 Open Access Article
Frequency dependent multiphase flows on centrifugal microfluidics†
Esmail
Pishbin
 a,
Amin
Kazemzadeh
 *b,
Mohammadreza
Chimerad
a,
Sasan
Asiaei
a,
Mahdi
Navidbakhsh
a and
Aman
Russom
 *b
*b
aSchool of Mechanical Engineering, Iran University of Science and Technology, Tehran, Iran
bDivision of Nanobiotechnology, Department of Protein Sciences, Science for Life Laboratory, KTH Royal Institute of Technology, Stockholm, Sweden. E-mail: amink@kth.se; aman@kth.se
First published on 16th December 2019
Abstract
The simultaneous flow of gas and liquids in large scale conduits is an established approach to enhance the performance of different working systems under critical conditions. On the microscale, the use of gas–liquid flows is challenging due to the dominance of surface tension forces. Here, we present a technique to generate common gas–liquid flows on a centrifugal microfluidic platform. It consists of a spiral microchannel and specific micro features that allow for temporal and local control of stratified and slug flow regimes. We investigate several critical parameters that induce different gas–liquid flows and cause the transition between stratified and slug flows. We have analytically derived formulations that are compared with our experimental results to deliver a general guideline for designing specific gas–liquid flows. As an application of the gas–liquid flows in enhancing microfluidic systems' performance, we show the acceleration of the cell growth of E. coli bacteria in comparison to traditional culturing methods.
Introduction
Flow regimes are mainly determined by the relationship between inertia, viscous, gravitational, and surface related forces. In large dimension fluid channels (i.e., hydraulic diameter >1 mm), gas–liquid flows are mainly classified into slug (i.e., liquid plugs separated by gas pockets), stratified (i.e., gas primarily flows above the liquid), annular (i.e., liquid films flowing on the walls of the conduit), and bubbly flows.1 Currently, these flows are mostly used to enhance the efficiency of industrial and environmental devices such as increasing the rate of mass and heat transfer2 and limiting liquid dispersion.3 The application of the stratified flow is mainly environmental while the slug and annular flows are commonly used in heat exchangers and air pollution control systems e.g., detecting airborne toxic biological and non-biological particles.4,5 In these systems establishing gas–liquid flows requires bulky, expensive and often multiple mechanical parts. In micro-scale systems, gas–liquid flows can be employed to enhance chemical reactions occurring in diagnostic devices and drug discovery applications,6–10 and enhance the mixing of miscible liquid streams e.g., in micro-reactors for synthesizing nanoparticles.7,11Micro-scale devices that are developed to perform diagnostics are commonly known as lab-on-a-chip devices. These devices use a lower volume of expensive reagents, perform clinical assays in a shorter time and by the use of liquid storage techniques may be able to automate and integrate diagnostic processes. But, despite significant advances in lab-on-a-chip devices, especially in on-chip storage liquid handling,12 generating some gas–liquid flows without using bulky equipment has been challenging.1,3 This is due to the decrease of gravitational force to surface tension force (i.e., low Bond number). Also, the specific conditions inducing different gas liquid flows in large fluid channels are not necessarily the same in microfluidics.3 Nevertheless, researchers have employed various methods for forming different gas–liquid flows. These techniques are mainly inspired by conventional systems i.e., using external compressors to blow air. For instance, researchers have achieved a stratified flow by using side stream gas to squeeze the liquid streaming in a microchannel.13,14 This technique has been used for focusing liquid streams, containing particles and cells in flow cytometry.13,15,16 Using a similar approach, an inertial microfluidic system has been introduced to generate stratified flow in order to transfer aerosol particles from air into the liquid phase.17 The device consists of two separate inlets for pumping liquid and gas into a curved microchannel that was used for migrating particles and allowing for real-time detection. They blew compressed air containing the particles (0.6–2.1 μm) into a liquid channel to form a stratified flow and load the particles. Similar techniques have been used to produce a slug flow often in pressure-driven microfluidic systems.6–10 In these platforms, liquid and gas have been introduced in microfluidic networks by syringe pumps and an air compressor. A significant application of the slug flow is mixing different reagents in microfluidic systems.18 The mixing by this technique is tunable and more efficient since the residence time distribution of the liquid is shorter in a slug flow in comparison to a single-phase flow.19 The residence time distribution is a criterion for measuring the distribution of residence times of different particles in a microchannel. Improving the performance of thermally dependent applications, e.g., PCR and material synthesis, is achievable using slug flow. Due to higher thermal coefficients arising from the convection heat transfer in liquid plugs, the temperature change rate of a segmented flow is always more than that of a continuous flow in the same fluid flow rate.20 The gas–liquid segmented flow circumvents the destabilization of the flow in flow-through PCR in continuous flow systems which occurs due to the generation of the bubbles when the liquid reaches the high-temperature zones. The generated bubbles are pushed into the gas segments due to internal circulation inside the liquid plug which make the slug flow a good choice when rapid thermal processing is required.21,22
In addition to pressure driven microfluidics, centrifugal microfluidic platforms have been recently employed for generating slug flows.23,24 In these systems, the air phase is injected into a liquid stream through a sequentially-driven internal pump which is actuated by external magnets during the rotation of the lab-disc.24
Overall, due to high surface tension forces compared to gravitational force in microfluidics the use of bulky accessories has been considered inevitable for generating gas–liquid flows. Here, we report on the exclusive use of artificial gravity available on centrifugal microfluidic platforms to generate and switch between the slug and stratified flows. We experimentally show that both slug and stratified flows can be achieved using centrifugal microfluidic platforms at relatively low rotational speeds. We thoroughly investigate the effects of centrifugal forces on generating different flow regimes and provided an analytical formulation for the prediction of the flow regimes. The analytical formulation is validated by experimental results and can be used as a guideline for designing gas–liquid centrifugal microfluidic systems. Our experiments show that different thicknesses of a stratified flow can be generated by tuning the rotational speed.
Results
Analytical model
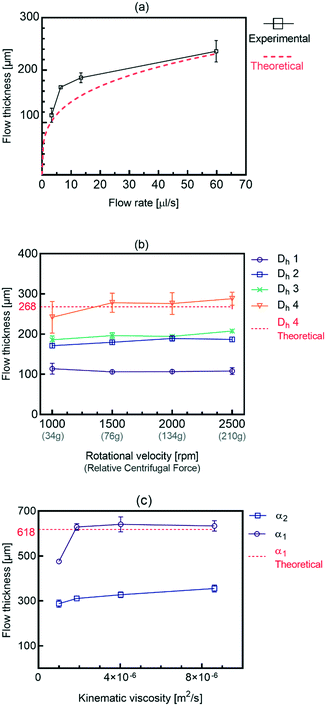
Stratification of the liquid streams in different microchannel geometries brings new capabilities in fields that require lamination of the particles along with a superficial mass transfer between the phases. Different results combined generally show that using a simple micro-structure on a centrifugal microfluidic platform is an effective alternative for producing a wide range of stratified flows. This is useful in applications that require adjustment of the residence time such as thermally dependent reactions, e.g., PCR for DNA amplification by implementing the presented heating methods for centrifugal microfluidics.25 An adjacent stream of the gas phase to the liquid phase can be used for removing the bubbles generated in the liquid passing the high-temperature zones.We have developed an analytical model that can be used as a tool for designing and developing gas–liquid centrifugal microfluidics for biomedical applications, e.g., cell culture. Fig. 1 shows the effects of the liquid flow rate (Q), rotational velocity (ω), and kinematic viscosity (ν) on the stratified flow thickness (t). The increase of the liquid flow thickness in a defined channel dimension will induce a transition to a slug flow from an initially stratified flow. In order to prevent such a transition, the height of microchannels must be considered wide enough to maintain the dominance of centrifugal forces over surface tension forces. We apply the Navier–Stokes equations for calculating the stratified flow thickness, see ESI,† part A. The centrifugal force appears as a body force similar to the gravitational force in fluid dynamics of a large channel and we use a geometry coefficient to take into account the effect of shear stress.26Eqn (1) defines the flow thickness:
 | (1) |
Fig. 1b shows the effect of rotational speed and different inlet hydraulic diameters on the flow thickness by using 4 different lab-disc samples. Our results show that the thickness of the stratified flow generated is rather independent of the rotational speed. This is due to the simultaneous increase of propelling force and the flow rate that compensates the effect of each other. For each case, four different rotational speeds, from 500 rpm to 2500 rpm, are evaluated. According to eqn (1), both the liquid flow rate and centrifugal force are a function of rotational speed. Also, the flow rate in centrifugal microfluidics is calculated as:27
 | (2) |
![[r with combining macron]](https://www.rsc.org/images/entities/i_char_0072_0304.gif) is the average distance of the liquid in the channels and Δr is the radial distance of the liquid subjected to centrifugal force. We combine this equation with eqn (1) to derive an equation for flow thickness that is independent of rotational velocity:
is the average distance of the liquid in the channels and Δr is the radial distance of the liquid subjected to centrifugal force. We combine this equation with eqn (1) to derive an equation for flow thickness that is independent of rotational velocity: | (3) |
Fig. 1c shows the effects of azimuth angle α on the flow thickness for four different liquids having different viscosities and densities. As is shown in the theoretical graph, the experimental results are in excellent agreement with eqn (3), confirming that the viscosity and density have a negligible effect on the flow thickness. Due to the independency of the stratified flow thickness to the kinematic viscosity in eqn (3), the theoretical graph is in the form of a horizontal line. However, our results also show that the flow thickness increases when the angle α decreases from 80° to 70°. This implies that for a constant flow rate, applying different spiral angles causes different magnitudes of propelling centrifugal forces which generate different stratified flow thicknesses. The stratified flow will convert to other flow regimes when the surface tension forces are dominant due to wall effects.
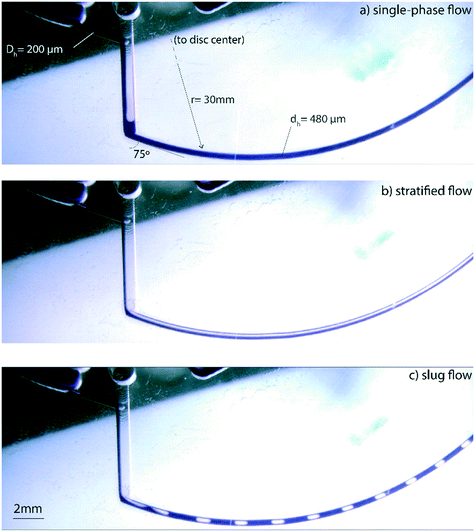
Fig. 2 shows the transition between stratified, slug and single-phase flow regimes in the spiral microchannel. In large channels, the stratified flow is formed in low superficial velocities at large Bond numbers, i.e., Bo > 4.7. In linear microfluidics, this dimensionless number is often lower than 1 due to the importance of surface tension forces with respect to gravitational force.2 We apply the same criterion but replace the gravitational force with the perpendicular component of the centrifugal force acting on the microchannel to calculate the centrifugal-based Bond number:
 | (4) |
Characterization
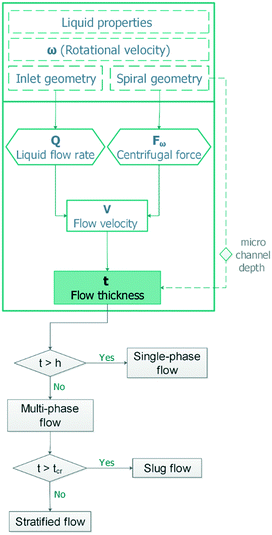
Fig. 3 summarizes the conditions required to produce stratified, slug and single-phase flows in microchannels on the centrifugal microfluidic platforms. They include the rotational speed, geometrical parameters, and liquid properties including density and viscosity. Liquid properties influence the magnitudes of the liquid flow rate and applied centrifugal force while the geometrical parameters mainly contribute to maintaining the stability of the flows. By using eqn (3) and knowing the critical thickness, the preferred flow regime can be formed by using different spiral channel heights. For the generated flows, the residence time and volume fractions of the different phases can be adjusted by varying the operational parameters, e.g., geometries and rotational speed. As we showed in Fig. 1b, the thickness of the stratified flow was changed by using different hydraulic diameters of the inlet channel. The effects of the operational parameters on the slug flow patterns will be shown in the following sections.For different fluid velocities in macro dimensions, the Kelvin–Helmholtz instability theory is used as the criterion of the transition.28–30 In microchannels, the predominance of the surface tension forces is responsible for this transition.30,31 Our experimental results confirm that when centrifugal force is well coordinated with other contributing parameters, such a transition can be achieved on centrifugal microfluidic platforms. Fig. 4a shows the measured critical thicknesses of the liquid flow in a 400 μm wide microchannel for four different liquids each experiencing a different centrifugal force. Based on these results, in higher rotational speeds, the transitions take place in wider thicknesses of the liquid. For a more precise evaluation, the results are analyzed based on the dimensionless critical number (Cr) that describes the ratio of the critical thickness to the height of the microchannel (tcr/h). The BoC number is used instead of the rotational speed in order to evaluate the effects of centrifugal force as well as the surface tension coefficients of different materials. Fig. 4b shows that by increasing the centrifugal force, relatively thicker stratified flows are required for the transition to occur. In Boc numbers close to 6, the liquid flow is in a stratified form even when more than ∼70% of the microchannel is filled by the liquid. In the dimensionless analysis, a nonlinear curve with r2 = 0.85 can be fitted for estimating the behavior of the system.
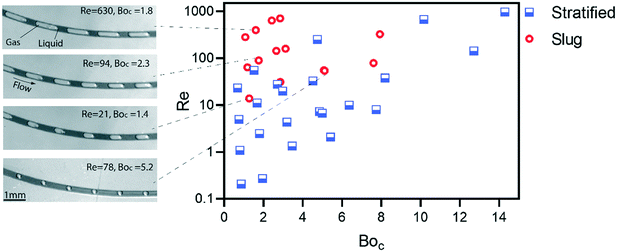
Fig. 5 shows the flow pattern in terms of dimensionless numbers for detailed characterization of flow transition on the centrifugal microfluidic platforms. The centrifugal Bond number and the Reynolds number are used as variables to present a holistic view over different parameters i.e., the viscous, inertia, surface tension and centrifugal forces. The hydraulic diameter is used as the length scale that is different for stratified and slug flows because of different wetted perimeters.3 The Reynolds number for the laminar gas–liquid flow is calculated for the liquid only due to the extremely large difference between the densities of the two phases. In order to investigate the flow rates, hydraulic diameter of the spiral channel and applied centrifugal force, ten different lab-discs were used. For Reynolds numbers less than 10, the stratified flow is formed because the flow thickness cannot elevate to the associated critical thicknesses. For BoC of 1 to 8 corresponding to the increase of the Re from 10 to 100, respectively, the transition to slug flow begins. The transition boundary in corresponding regions is in agreement with those of the effects of BoC on the critical thickness (Fig. 4b) predicted by our analysis. For BoC > 8, the applied centrifugal force is large enough to prevent the transition even for Re ∼ 1000. Note that we conducted our experiments on the PMMA substrates and using different materials will probably change the results shown in Fig. 5.
Different lengths and size fractions of liquid plugs and gas bubbles can be achieved by adjusting the operational parameters of the system. Four different patterns of the slug flow in different regions of the flow pattern map are shown in the Fig. 5. In the higher Re numbers, corresponding to higher rotational velocities of the disc, the lengths of the generated bubbles are more than twice the length of the liquid plugs. As the Re is reduced, the length of the bubbles is decreased. Consequently, there are several kinematic and geometrical parameters (mainly the rotational velocity of the disc and the radial distance of the spiral channel) that can be manipulated to control the sizes of the liquid and gas segments in a given hydraulic diameter of the spiral channel. This can be implemented for the intended application, e.g., mixing of miscible liquids, as well as addressing some technical problems in multiphase microfluidics. For instance, reduction of the uniformity of segmented flows is a major challenge in thermally dependent applications due to gas expansion and changing liquid viscosity. This causes the change in the flowrate and lengths of the liquid plugs.32 The main reported solution is to adjust the backflow to neutralize the vapor pressure during thermocycling. Due to the influence of multiple parameters on the patterns of the centrifugally-induced slug flow in the presented platform, the flow can be stabilized by designing the particular geometries of the main microchannel and or varying the cross-sections to achieve stable slug flow conditions in different temperature zones.
Durability
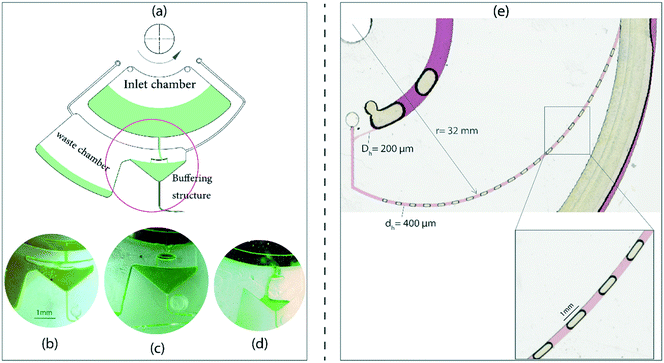
We studied the stability of the gas–liquid flows both on rotating and stationary platforms (i.e., platform brought to a halt). On the rotating platform, both the liquid plugs and the gas bubbles maintain their initial sizes. But a small deviation occurs when the last group of bubbles was generated which was due to the decrease of the liquid level in the reservoir. The gradual change in the liquid level in the reservoir consequently affects the total propulsive force and the liquid flow rate in the connected microchannel.27 In order to alleviate the effects of this on the quality of generated slug and stratified flows, we designed a flow regulator mechanism. Fig. 6a shows the liquid handling features that allow for producing a constant flow rate. It consists of an inlet chamber, a buffering structure, and a waste chamber. The buffering structure assists in generating constant pressure by overflowing the excess into the waste chamber. In order to employ this technique, the lengths and hydraulic diameters of the inlet and outlet microchannels must be adjusted in a way that the inflow and outflow rates of the liquid are balanced. Fig. 6b shows that the liquid level is maintained at a high flow rate and the excess liquid overflows into the waste chamber. Fig. 6c and d show the operation of the pressure regulator mechanism at lower flow rates.We also studied the gas–liquid state by stopping the platform with different deceleration rates. For the initially stratified flow on a rotating disc the flow eventually turns into a single-phase for the investigated deceleration rates. For the same experimental conditions, the slug flow shows some level of sustainability. At the stationary state it turns into a two-phase liquid–air plug at a deceleration rate of 1000 rpm s−1. Fig. 6e shows the liquid–air plug after the platform is brought to halt. In comparison with the slug flow in the rotating state the sizes of the air bubbles are slightly different which may be due to the larger effect of wall induced forces. The ability of stilling the slug flow is useful for incubation steps in clinical and chemical applications. We show that hundreds of thousands of bubbles and liquid plugs can be generated on a centrifugal microfluidics of a compact disc size, see ESI,† part C.
Applications
The slug flow is principally used for its ability to mix immiscible liquids due to the formation of secondary flows inside the liquid plugs. To show this capability in centrifugally-induced slug flows, we designed a model comprising two inlet chambers connected to a radial microchannel. After the disc rotation, the solution of the liquids with different colors was introduced into a slug flow regime by implementing the presented technique. A color-changing analysis showed that the mixing of the liquids can be enhanced by taking advantage of the recirculation motion inside the liquid plugs (see ESI,† part D). Simple design, no requirement to external devices and simple separation of the gas phase from the mixture (after the mixing process) are the main advantages of this continuous mixing method. In addition, multiple samples and reagents can be introduced into the slug flow by connecting multiple inlet chambers to the main channel via microchannels. For delivering the reagents in precise timing, the release of the reagents from different reservoirs can be controlled using different kinds of valves.33Microfluidic devices have shown capabilities for serving as cell culturing devices due to the reduction of the total processing time and reagent consumption.34 In centrifugal microfluidics, cell culturing is typically conducted in liquid chambers that are continuously stirred for enhancing the homogeneity of the solution.35 In this study, the capability of the presented platform for the production of liquid slugs is evaluated for bacterial cell culture. Segmentation of the mixture in the form of slugs may facilitate the single cells to access the nutrients and air supply. To assess the effects of converting the accommodated culture mixture into a segmented form, Escherichia coli bacteria (E. coli) samples were cultured in either the cell culture tubes or the liquid slugs under the same incubation conditions. The monitoring of the bacterial growth level during the incubation process was necessary. There are several methods for measuring cell concentration.36 Fluorescence-based cell counting and colony forming are the common techniques that were not suitable for this case because they require extraction of the samples from the containers. Furthermore, the optical density measurement was not applicable due to the small sample volume in the microchannel (less than 0.2 μL for each liquid plug). Consequently, we used an image analysis technique for immediate measurement of the color change of the mixture for the in situ estimation of the bacterial growth in the liquid plugs and culture tubes. To this end, phenol red was added to the samples as a pH indicator material for indirect monitoring of the bulk metabolic activity of the cell population.37,38 The color of this material is initially red and gradually turns to yellow when the pH of the mixture is changed due to the increase of the metabolic activity of the bacteria. It should be noted that the pH change of the solution may be due to other reasons, e.g., toxicity of the medium environment, rather than increasing the level of bacteria concentrations.
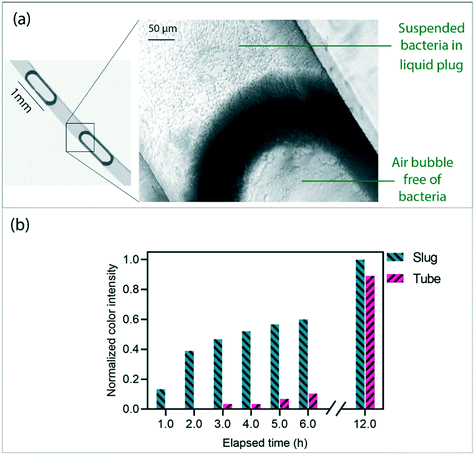
After segmentation of the mixture in form of liquid plugs, a microscopic observation showed that the bacteria are successfully located inside the liquid plug, see Fig. 7a. The prepared disc and a 0.5 ml Eppendorf tube containing 100 μL of the sample were incubated at 37 °C for 12 hours. For image analysis, the samples were captured (every 1 hour) using a high-resolution benchtop scanner. Fig. 7b shows the changes in the color of the samples in the tube and slugs in a normalized range of the color intensities. The color intensities were measured through a histogram analysis using the image analysis software ImageJ (National Institutes of Health, Bethesda, MD, USA). The graphs show that the samples in the liquid slug have rapidly started to grow after 1 hour while this time is 3–4 hours for the samples in the tube. In addition, the growth rate in the slug case is considerably higher than that in the tube. The stability of the liquid slugs after 12 hours shows the ability of the presented centrifugally-induced slugs to be used in processes with longer duration. We considered the growth level at t = 12 h as the ultimate level. Note that due to different depths of the liquids in the slug (400 μm) and tubes (∼2 mm), the slug samples were collected after the test in a 0.5 ml Eppendorf tube for measuring the ultimate colors under equal conditions. This makes it possible to compare the results of the plugs and tubes in a normalized range of the color changes. The higher value of the ultimate growth level in slugs in comparison to the tube samples (11% approximately) might be due to the facilitation of the bacterial cell growth in the segmented volumes.
As the color change of the solution containing phenol red can be due to several reasons, it is essential to control the viability of the bacteria after the culturing process. To determine the viability of bacterial cells, we used the same solution (without phenol red) as the control sample. The sample was collected from the microfluidic system after 12 hours and cultured in eosin methylene blue agar (EMB) medium and then kept at a temperature of 37 °C for 24 hours. Escherichia coli growth colonies exhibited a greenish metallic sheen by reflected light. Also, we used the Live/Dead BacLight kit (Thermo Fisher Scientific, USA) for a viability assay. In this regard, 100 μL of bacteria solution was mixed with dye (1 μL). For 15 min, the mixture was kept in the dark at room temperature for the bacteria to be stained. The stained bacteria were observed with fluorescence microscopy to determine their viability. The results confirm high viability of bacteria in the sample, see ESI,† part E.
Conclusion
Although gas–liquid flows are established and well applied in various industries, they have been rarely used in microfluidics technology especially on lab-on-a-chip platforms. In lab-on-a-chip devices, gas–liquid flows can be used as highly efficient mixing techniques, accelerating chemical reaction and cell growth rate. The main reason for scarcity of gas–liquid systems in microfluidics platforms has been the high surface to volume ratio of the microchannels that creates a substantial challenge to generate these flows. Here, we have reported on generating two of the common gas–liquid flows using a centrifugal microfluidics platform only. The gas–liquid flows are interchangeable by alternating the rotational speed and/or changing the channel dimension. We have derived and experimentally verified an analytical expression that can be used as a primary guideline for designing gas–liquid flows of specific specifications. We used the generated gas–liquid regime for culturing E. coli and our results show significant enhancement of the growth rate in comparison to traditional methods.Methods
Disc fabrication and experimental setup
The discs are made of 2 layers of 1 mm-thick PMMA which are bonded with a pressure sensitive adhesive (PSA) layer. The details of manufacturing of a lab-disc can be found in the literature including our previous publications.39–41 Briefly, the PMMA and PSA layers were cut using a Roland MDA-40 and a Graphtec CE-6000 cutter plotter machine, respectively. The layers were aligned and placed in a custom-made screw-press to complete the bonding. A still-frame imaging system was used in this study for capturing images of the rotating lab-disc in different rotational velocities. The system specifications are reported in our previously published articles.12,42,43Design of the disc
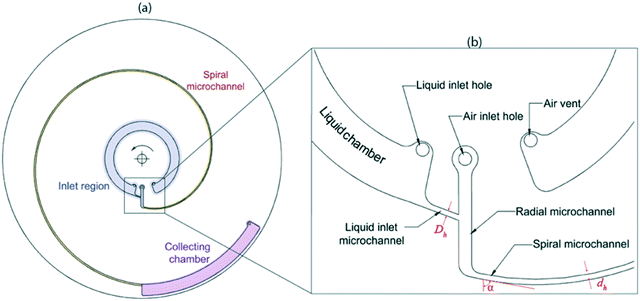
The design of the lab-disc used for the experiments is shown in Fig. 8. It consists of three main features: the inlet region for liquid and air, the spiral microchannel for generating gas–liquid flows and the collecting chamber (Fig. 8a). Various parts of the inlet region are shown in detail in Fig. 8b. The liquid is pipetted into the liquid chamber through the liquid loading hole. During the rotation of the platform, the liquid and air enter the spiral microchannel through a radially vented channel. Based on the different operational conditions, a flow pattern is shaped in the initial region of the connected spiral microchannel and transferred to the collecting chamber.Image processing
Commercial image processing software ImageJ (National Institutes of Health, Bethesda, MD, USA) was used for measuring the stratified flow thickness in various experiments.44 The captured images were analyzed in a specific region of the spiral channel to diminish the effect of the variation of the centrifugal force on the flow thickness along the channel. The experiments were repeated 5 times for each condition to ensure adequate precision (see ESI,† part F).Bacterial cell culture
For sterilization of the manufactured lab-disc, it was first washed with 70% ethanol and phosphate buffered saline and subsequently UV irradiation was used for 30 min in a laminar flow hood.The culture media were prepared by adding 25 mg L−1 phenol red (Sigma-Aldrich, Steinheim, Germany) to the Mueller Hinton broth (Sigma-Aldrich, Steinheim, Germany). The concentration of the Escherichia coli bacteria (E. coli, JM109) was controlled to be 106 cells per mL.
For introducing the culture mixture into the slug form, 100 μL of the solution was introduced to the inlet chamber of the lab-disc. The disc was accelerated up to 1200 rpm and after 5 seconds it was stopped with 1000 rpm s−1 for generation of the liquid plugs in the microchannel. Based on the size distribution analysis, the kinematics (ω = 1200 rpm, α = 200 rpm s−1) and the geometries (r = 32 mm, Dh = 200 μL) were selected in a way to have equal sizes (∼1 mm) of the liquid plugs and air bubbles in a microchannel with a hydraulic diameter of 400 μm.
Material preparation
Diluted water was used as the liquid for most of the experiments. For visibility of the liquid during the experiments and precise image analysis, food colors were added to the liquid. For the preparation of the liquids for evaluating the effect of kinematic viscosity, different portions of glycerol (G5516, Sigma-Aldrich, Germany) were mixed with specific volumes of diluted water at the temperature of 25 °C based on Table 1.45| Water volume % | Glycerol volume % | Mixture ρ [kg m−3] | Mixture μ [Ns m−2] | Mixture ν [m2 s−1] |
|---|---|---|---|---|
| 100 | 0 | 997 | 9 × 10⁻⁴ | 9 × 10⁻⁷ |
| 75 | 25 | 1070 | 2 × 10⁻³ | 2 × 10⁻⁶ |
| 42 | 58 | 1117 | 4.5 × 10⁻³ | 4 × 10⁻⁶ |
| 40 | 60 | 1165 | 1.3 × 10⁻² | 1 × 10⁻⁵ |
Conflicts of interest
There are no conflicts to declare.Acknowledgements
The authors would like to thank Dr. Amid Rahi from Shahid Beheshti University of medical sciences, Iran and Ahmad Saleem Akhtar from KTH Royal institute of technology, Sweden for their helpful suggestions and kind collaborations.References
- R. Gupta, D. F. Fletcher and B. S. Haynes, J. Comput. Multiphase Flows, 2010, 2, 1–31 CrossRef CAS.
- J. Kobayashi, Y. Mori, K. Okamoto, R. Akiyama, M. Ueno, T. Kitamori and S. Kobayashi, Science, 2004, 304, 1305–1308 CrossRef CAS PubMed.
- A. Günther and K. F. Jensen, Lab Chip, 2006, 6, 1487–1503 RSC.
- P. Kulkarni, P. A. Baron and K. Willeke, Aerosol measurement: principles, techniques, and applications, John Wiley & Sons, 2011 Search PubMed.
- P. Vlasogiannis, G. Karagiannis, P. Argyropoulos and V. Bontozoglou, Int. J. Multiphase Flow, 2002, 28, 757–772 CrossRef CAS.
- Y.-J. Hwang, C. W. Coley, M. Abolhasani, A. L. Marzinzik, G. Koch, C. Spanka, H. Lehmann and K. F. Jensen, Chem. Commun., 2017, 53, 6649–6652 RSC.
- A. Larrea, V. Sebastian, A. Ibarra, M. Arruebo and J. Santamaria, Chem. Mater., 2015, 27, 4254–4260 CrossRef CAS PubMed.
- B. Tomaszewski, A. Schmid and K. Buehler, Org. Process Res. Dev., 2014, 18, 1516–1526 CrossRef CAS.
- C. Willrodt, B. Halan, L. Karthaus, J. Rehdorf, M. K. Julsing, K. Buehler and A. Schmid, Biotechnol. Bioeng., 2017, 114, 281–290 CrossRef CAS PubMed.
- J. Yue, F. H. Falke, J. C. Schouten and T. A. Nijhuis, Lab Chip, 2013, 13, 4855–4863 RSC.
- L. Tamborini, P. Fernandes, F. Paradisi and F. Molinari, Trends Biotechnol., 2018, 36, 73–88 CrossRef CAS PubMed.
- A. Kazemzadeh, A. Eriksson, M. Madou and A. Russom, Nat. Commun., 2019, 10, 189 CrossRef PubMed.
- D. Huh, C. Kuo, J. Grotberg and S. Takayama, New J. Phys., 2009, 11, 075034 CrossRef CAS PubMed.
- X. Wang, Y. Yong, P. Fan, G. Yu, C. Yang and Z.-S. Mao, Chem. Eng. Sci., 2012, 69, 578–586 CrossRef CAS.
- D. Huh, A. H. Tkaczyk, J. H. Bahng, Y. Chang, H.-H. Wei, J. B. Grotberg, C.-J. Kim, K. Kurabayashi and S. Takayama, J. Am. Chem. Soc., 2003, 125, 14678–14679 CrossRef CAS PubMed.
- D. Huh, Y.-C. Tung, H.-H. Wei, J. B. Grotberg, S. J. Skerlos, K. Kurabayashi and S. Takayama, Biomed. Microdevices, 2002, 4, 141–149 CrossRef.
- J. Choi, S. C. Hong, W. Kim and J. H. Jung, ACS Sens., 2017, 2, 513–521 CrossRef CAS PubMed.
- A. Günther, M. Jhunjhunwala, M. Thalmann, M. A. Schmidt and K. F. Jensen, Langmuir, 2005, 21, 1547–1555 CrossRef PubMed.
- A. Günther, S. A. Khan, M. Thalmann, F. Trachsel and K. F. Jensen, Lab Chip, 2004, 4, 278–286 RSC.
- C.-Y. Huang, B.-H. Huang, F.-R. Cheng, S.-W. Chen and T.-M. Liou, Int. J. Heat Mass Transfer, 2017, 107, 657–666 CrossRef CAS.
- B. K. Yen, A. Günther, M. A. Schmidt, K. F. Jensen and M. G. Bawendi, Angew. Chem., Int. Ed., 2005, 44, 5447–5451 CrossRef CAS PubMed.
- Y. Fuchiwaki, H. Nagai, M. Saito and E. Tamiya, Biosens. Bioelectron., 2011, 27, 88–94 CrossRef CAS PubMed.
- D. Chakraborty and S. Chakraborty, Appl. Phys. Lett., 2010, 97, 234103 CrossRef.
- S. Haeberle, N. Schmitt, R. Zengerle and J. Ducrée, Sens. Actuators, A, 2007, 135, 28–33 CrossRef CAS.
- E. Pishbin, M. Eghbal, M. Navidbakhsh and M. Zandi, Sens. Actuators, B, 2019, 294, 270–282 CrossRef CAS.
- F. M. White and I. Corfield, Viscous fluid flow, McGraw-Hill, New York, 2006 Search PubMed.
- D. C. Duffy, H. L. Gillis, J. Lin, N. F. Sheppard and G. J. Kellogg, Anal. Chem., 1999, 71, 4669–4678 CrossRef CAS.
- D. Barnea, Y. Luninski and Y. Taitel, Can. J. Chem. Eng., 1983, 61, 617–620 CrossRef CAS.
- Y. Taitel and A. E. Dukler, AIChE J., 1976, 22, 47–55 CrossRef CAS.
- K. A. Triplett, S. Ghiaasiaan, S. Abdel-Khalik and D. Sadowski, Int. J. Multiphase Flow, 1999, 25, 377–394 CrossRef CAS.
- N. Brauner and D. M. Maron, Int. J. Multiphase Flow, 1992, 18, 123–140 CrossRef CAS.
- B. K. H. Yen, A. Günther, M. A. Schmidt, K. F. Jensen and M. G. Bawendi, Angew. Chem., Int. Ed., 2005, 44, 5447–5451 CrossRef CAS PubMed.
- O. Strohmeier, M. Keller, F. Schwemmer, S. Zehnle, D. Mark, F. von Stetten, R. Zengerle and N. Paust, Chem. Soc. Rev., 2015, 44, 6187–6229 RSC.
- M. L. Coluccio, G. Perozziello, N. Malara, E. Parrotta, P. Zhang, F. Gentile, T. Limongi, P. M. Raj, G. Cuda and P. Candeloro, Microelectron. Eng., 2019, 208, 14–28 CrossRef CAS.
- Y. Ren, L. M.-C. Chow and W. W.-F. Leung, Biomed. Microdevices, 2013, 15, 321–337 CrossRef PubMed.
- K. Kim, S. Kim and J. Jeon, Sensors, 2018, 18, 447 CrossRef PubMed.
- K. Welch, Y. Cai and M. Strømme, J. Funct. Biomater., 2012, 3, 418–431 CrossRef CAS PubMed.
- D. Matteau, V. Baby, S. Pelletier and S. Rodrigue, PLoS One, 2015, 10, e0133384 CrossRef PubMed.
- A. Kazemzadeh, P. Ganesan, F. Ibrahim, L. Kulinsky and M. J. Madou, RSC Adv., 2015, 5, 8669–8679 RSC.
- A. Kazemzadeh, P. Ganesan, F. Ibrahim, M. M. Aeinehvand, L. Kulinsky and M. J. Madou, Sens. Actuators, B, 2014, 204, 149–158 CrossRef CAS.
- E. Pishbin, M. Eghbal, S. Fakhari, A. Kazemzadeh and M. Navidbakhsh, Micromachines, 2016, 7, 215 CrossRef PubMed.
- A. Kazemzadeh, P. Ganesan, F. Ibrahim, M. M. Aeinehvand, L. Kulinsky and M. J. Madou, Sens. Actuators, B, 2014, 204, 149–158 CrossRef CAS.
- A. Kazemzadeh, P. Ganesan, F. Ibrahim, S. He and M. J. Madou, PLoS One, 2013, 8, e73002 CrossRef PubMed.
- M. D. Abràmoff, P. J. Magalhães and S. J. Ram, Biophotonics Int., 2004, 11, 36–42 Search PubMed.
- A. Volk and C. J. Kähler, Exp. Fluids, 2018, 59, 75 CrossRef.
Footnote |
| † Electronic supplementary information (ESI) available. See DOI: 10.1039/c9lc00924h |
| This journal is © The Royal Society of Chemistry 2020 |

