
 Open Access Article
 This Open Access Article is licensed under a Creative Commons Attribution-Non Commercial 3.0 Unported Licence
Gravity-driven microfluidic assay for digital enumeration of bacteria and for antibiotic susceptibility testing†
Yu-Ting
Kao
 ab,
Tomasz S.
Kaminski
a,
Witold
Postek
a,
Jan
Guzowski
a,
Karol
Makuch
a,
Artur
Ruszczak
a,
Felix
von Stetten
bc,
Roland
Zengerle
bc and
Piotr
Garstecki
*a
ab,
Tomasz S.
Kaminski
a,
Witold
Postek
a,
Jan
Guzowski
a,
Karol
Makuch
a,
Artur
Ruszczak
a,
Felix
von Stetten
bc,
Roland
Zengerle
bc and
Piotr
Garstecki
*a
aInstitute of Physical Chemistry, Polish Academy of Sciences, Kasprzaka 44/52, 01-224 Warsaw, Poland. E-mail: garst@ichf.edu.pl
bLaboratory for MEMS Applications, IMTEK-Department of Microsystems Engineering, University of Freiburg, Georges-Koehler-Allee 103, 79110 Freiburg, Germany
cHahn-Schickard, Georges-Koehler-Allee 103, 79110, Freiburg, Germany
First published on 27th November 2019
Abstract
The alarming dynamics of antibiotic-resistant infections calls for the development of rapid and point-of-care (POC) antibiotic susceptibility testing (AST) methods. Here, we demonstrated the first completely stand-alone microfluidic system that allowed the execution of digital enumeration of bacteria and digital antibiograms without any specialized microfluidic instrumentation. A four-chamber gravity-driven step emulsification device generated ∼2000 monodisperse 2 nanoliter droplets with a coefficient of variation of 8.9% of volumes for 95% of droplets within less than 10 minutes. The manual workload required for droplet generation was limited to the sample preparation, the deposition into the sample inlet of the chip and subsequent orientation of the chip vertically without an additional pumping system. The use of shallow chambers imposing a 2D droplet arrangement provided superior stability of the droplets against coalescence and minimized the leakage of the reporter viability dye between adjacent droplets during long-term culture. By using resazurin as an indicator of the growth of bacteria, we were also able to reduce the assay time to ∼5 hours compared to 20 hours using the standard culture-based test.
Introduction
Antibiotic-resistant bacterial infections are one of the most alarming problems in global health and one of the major causes of prolonged hospitalization and death.1 There is an urgent need for rapid diagnosis of the resistant infections and antibiotic susceptibility testing (AST) to increase the access to targeted antibiotic therapies.2 Currently, culture-based AST is usually performed by dilution or diffusion methods. In dilution methods, bacteria are inoculated in a series of concentrations of the antibiotics. The lowest concentration of antibiotic that prevents growth represents the minimum inhibitory concentration (MIC) value which is examined by visual inspection of turbidity. In diffusion methods, a strip or disc with a gradient of antibiotics is applied onto inoculated agar surface. The MIC of antibiotics against bacteria is determined by the visible inhibition zone. These methods typically require an overnight culture and are labour intensive. Another practical challenge in microbiology is the enumeration of bacteria (of the colony forming units, CFU). According to the Clinical Laboratory Standards Institute (CLSI)3 and the European Committee on Antimicrobial Susceptibility Testing (EUCAST),4 proper execution of an AST requires 5 × 10⁵ CFU ml−1 inoculum suspension in broth. The allowed range of the inoculum is 2–8 × 10⁵ CFU ml−1 for CLSI and 3–7 × 10⁵ CFU ml−1 for EUCAST. This relatively broad range together with errors associated with the limited precision of the optical densitometers might cause changes of the measured MIC value due to the “inoculum effect”5 – a phenomenon in which the MIC of bacteria against an antibiotic increases as the bacterial density increases. Reformatting both of these analytical methods for point-of-care (POC) testing is a challenge for microfluidic techniques that should provide the vista to rapidly perform all of the required liquid handling operations while requiring minimum labour and laboratory infrastructure.Recent studies reveal that microfluidic technologies actually can count bacteria precisely by digital methods,6,7 simplify the standardized AST assays based on dilution methods,8 and estimate the MIC from the growth of bacteria in droplets.9 These methods offer accurate liquid handling and fast detection of bacteria which could result in enhanced accuracy of the MIC measurement. However, they still mainly rely on external sources of flow such as syringe pumps to supply liquids which makes lab-on-a-chip microfluidic devices complicated and inconvenient to use. Hence, it is desired to reduce the external equipment and develop a new generation lab-on-a-chip microfluidic device for POC applications.
Nowadays, on-chip vacuum sources such as air chambers or degassed polymer forming chips may be used to suck liquids into the channels and next perform point-of-care AST.10–12 Such devices are usually made of elastomers, are equipment-free, portable and easy to use with only a few pipetting steps for sample deposition. However, the flow rate cannot be efficiently controlled for long periods of time and, more importantly, this approach cannot be used for a wide range of materials, especially thermoplastics which are widely used in mass production of microfluidic and medical diagnostic devices. Typically, in vacuum-driven devices, the inlet chamber amounts to a significant dead volume and may lead to the disadvantage of sample wasting.13 In order to obtain a sufficient flow rate, it is necessary for these degassed systems to be incubated in a vacuum chamber for 24 hours and then to be stored in a tightly sealed container before loading the liquid sample in order to obtain a sufficient flow rate to trigger the system.13,14 Any possible air leakage or long waiting times after opening the container disqualify the chip from further use. Here, we demonstrate digital counting of bacteria and ASTs via generation of libraries of highly monodisperse droplets using the most abundant, easy-to-use and “green” source of energy—gravity.
The use of gravity is an economical and facile approach to transport liquid in the microfluidic channels. Nevertheless, to date, there have been very few studies that discussed droplet generation via hydrostatic pressure that is caused by gravity. For example, Zhang et al.15 demonstrated a gravity-actuated technique for microfluidic droplet manipulation, van Steijn et al.16 used a gravity-based pressure control system for generation of monodisperse droplets and Tjhung et al.17 enumerated phage by using a gravity-driven droplet generator. However, all of these systems are characterized by relatively large dimensions as reservoirs need to be positioned high above the microfluidic junction in order to supply significant rates of flow. Additionally, on-chip operations in the aforementioned systems can be perturbed by any small variation in flow rates caused by partial clogging or bubble formation and have to be recalibrated with any change in the tubing supplying the liquids to the chip. Here, we addressed those issues by (i) compacting all the supply channels onto the chip (thus eliminating any external tubing or loose parts), (ii) triggering the flow by simply turning the chip vertically, (iii) using passive generation of droplets via step emulsification to ensure formation of a monodisperse emulsion.18
Experimental
Fabrication of gravity-driven step emulsification device
The gravity-driven step emulsification devices were fabricated as follows. PDMS (Sylgard 184, Dow Corning, USA) was poured onto a CNC-milled (MSG4025, Ergwind, Poland) polycarbonate master and incubated at 70 °C for 2 hours. After the PDMS was cured, this PDMS mold was treated with tridecafluoro-1,1,2,2-tetrahydrooctyl-1-trichlorosilane (United Chemical Technologies, USA) vapours at 10 mbar for 3 hours and subsequently used as a master mould to make the final PDMS device. The device was bonded with a 1 mm-thick glass slide after applying oxygen plasma for 30 seconds. The obtained microfluidics chips were filled with Novec 1720 (3M, USA) for 1 hour at 100 °C to ensure hydrophobicity. The dimensions of the device are available in the ESI† 1.Liquid samples
For droplet generation from samples of various viscosities, we used Mueller–Hinton (MH) broth (BD Biosciences, USA), Luria-Bertani (LB) broth (BIOCORP, Poland), and two batches of polyethylene glycol (PEG) (Sigma-Aldrich, Germany) with a molecular weight of 20![[thin space (1/6-em)]](https://www.rsc.org/images/entities/char_2009.gif) 000 (20k) and 2000000 (2m) dissolved in Tris-EDTA (TE) buffer (Sigma-Aldrich, Germany).
000 (20k) and 2000000 (2m) dissolved in Tris-EDTA (TE) buffer (Sigma-Aldrich, Germany).
Bacteria culture
Escherichia coli (ATCC 25922), Staphylococcus aureus (ATCC 29213), and Enterococcus faecalis (ATCC 51299) were cultured on 2% MH broth agar plates (BD Biosciences, USA) and incubated overnight at 37 °C. Individual colonies were picked and then inoculated into MH liquid broth (BD Biosciences, USA) with overnight culture. These overnight cultured E. coli, S. aureus, and E. faecalis suspensions were prepared by adjusting the concentration to ∼108 CFU mL−1 by OD measurement at 600 nm using MH liquid broth.Fluorescence measurement
The fluorescence signal was directly detected from the gravity-step emulsification device using a confocal laser microscope system (Nikon A1R/TiE, Japan). We acquired the fluorescence of resorufin at excitation/emission wavelengths of 561 nm/570–620 nm, respectively, at a laser power of 51.4%. There was no photobleaching at this setting (Fig. S1†). The wide-view images were stitched from multiple confocal scans. The relative fluorescence intensity of the droplets was measured using ImageJ software and the positive droplets, which were defined as the ones with intensity above a given threshold (Fig. S2†), were identified by using a protocol described in the literature.19Enumeration of bacteria by the digital droplet CFU (ddCFU) method on the gravity-driven step emulsification device
Novec HFE 7500 oil (3M, USA) with 2% perfluoropolyether/poly(ethylene glycol) triblock copolymer (PFPE–PEG–PFPE) surfactant synthesized according to the protocol described by Holtze et al.20 (such a concentration was previously demonstrated to stabilize the emulsions against coalescence during long-term incubation21) was used as the external phase. It was loaded to the device before deposition of the samples.10-fold series dilutions from an initial bacterial concentration of ∼108 CFU ml−1 were performed. We mixed 5 μl of 88 μM resazurin sodium salt (Sigma-Aldrich, Germany) and 5 μl of 108, 107, 106, 105, 104, 103, 102, and 101 CFU ml−1 bacterial culture, loaded 5 μl of mixtures into two copies of a four-chamber device, prepared the droplets and directly incubated at 37 °C for 5 hours before detection. The change (reduction) of resazurin sodium salt to fluorescent resorufin sodium salt was detected by a confocal laser microscope system (Nikon A1R/TiE, Japan). We counted the total number of droplets in a single chamber (N) and the number of positive droplets (N+). The fraction of positive droplets was denoted by P = N+/N. We assumed that the distribution of bacteria to droplets follows a Poisson distribution as a fraction of positive droplets (P): P = 1 − e−C0v, where C0 is the concentration of bacteria and v is the average volume of droplets. Therefore, the concentration of bacteria can be determined as C0 = −ln(1 − N+/N)/v. This formula defines the procedure of the digital droplet CFU assay that determines the concentration of bacteria.
Minimum inhibitory concentration test on the gravity-driven step emulsification device
The device was filled with Novec HFE 7500 oil (3M, USA) containing 2% surfactant (PFPE–PEG–PFPE) before loading MH broth containing bacteria, resazurin sodium salt (Sigma-Aldrich, Germany) and antibiotics (ampicillin (Sigma-Aldrich, Germany) or cefotaxime (Sigma-Aldrich, Germany)) mixtures for droplet generation. 1, 2, 4, 8, 16, 32 and 64 μg ml−1 concentrations of antibiotics were prepared from 128 mg ml−1 ampicillin stock solution and 10 mg ml−1 cefotaxime stock solution. These concentrations of antibiotics were then mixed with 176 μM of resazurin sodium salt. 106 CFU ml−1 of bacteria were obtained from 100-fold dilutions of ∼108 CFU ml−1. After 1:1 mixing of bacteria broth with resazurin sodium salt (Sigma-Aldrich, Germany) and antibiotic mixtures, the final bacterial density was around 5 × 10⁵ CFU ml−1 and the final concentration of resazurin was 44 μM. The entire device was incubated for 5 hours at 37 °C. The MIC was determined as the lowest concentration of antibiotic in which bacteria did not grow.
Image analysis
A USB 3 uEye CP camera (iDS, Germany) was used to record the process of droplet generation. The size distribution of droplets, number of droplets and positive/negative droplets counts were analyzed by using ImageJ software.Results and discussion
The design of the gravity-driven step emulsification device
Fig. 1 shows the layout of the microfluidic chip. The gravity-driven step emulsification device contains an oil reservoir with an oil inlet, four sample inlets, four sample chambers, four droplet chambers, and two oil outlets that connect each of two droplet chambers. Each sample chamber narrows and shallows towards the respective droplet chamber (opening angle α = 15°; shallowing angle 10°, from 1 mm to 40 μm height) to which it is connected via a short channel of length 200 μm, width 200 μm and height 40 μm. The height of the droplet chamber is 200 μm so that there is an abrupt change in height between the connecting channel and the chamber, which we refer to as the step.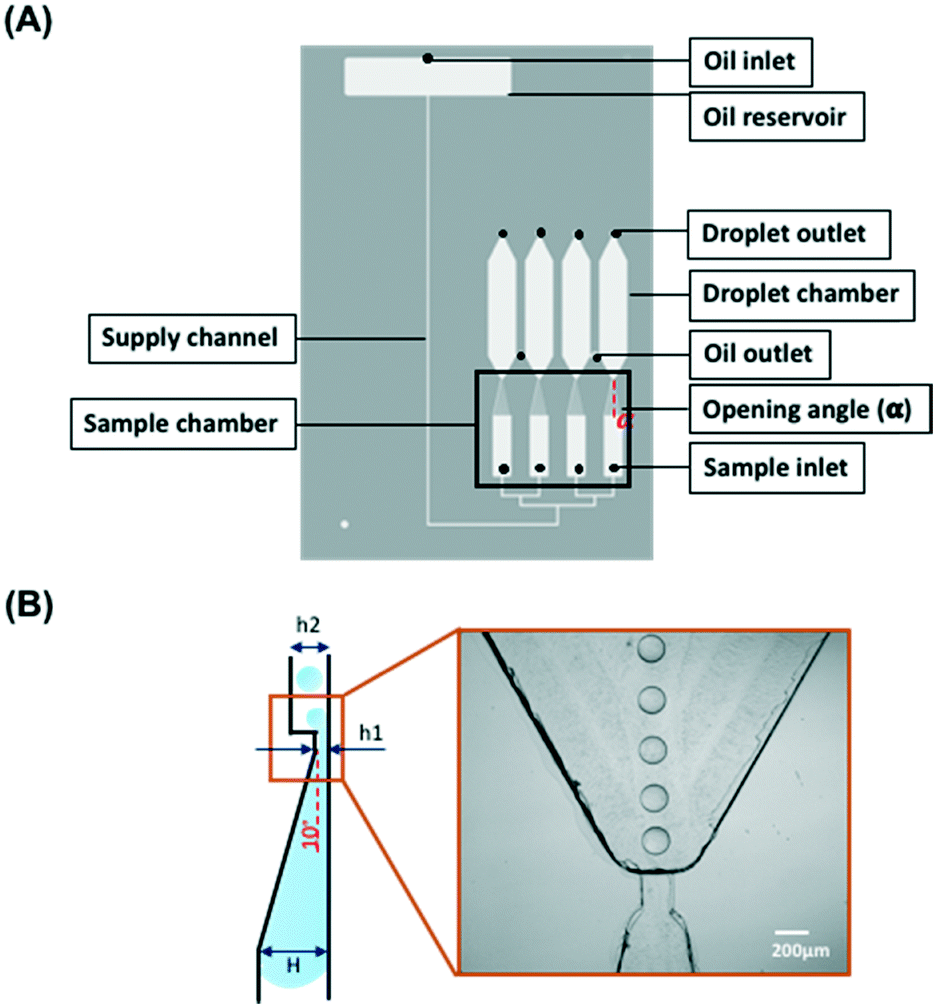 | ||
| Fig. 1 Schematic outline of the microfluidic chip. (A) The chip contains an oil reservoir with an oil inlet, four sample inlets, four sample chambers with the opening angle α = 15° (Fig. S3†) and four droplet chambers. A channel with a width of 200 μm and height of 40 μm connects the sample chamber and the droplet chamber. Two oil outlets connect each of two droplet chambers. The total length of the supply channel (200 μm × 200 μm in cross section) is 70 mm. The height difference between the oil inlet and the oil outlet is 30 mm. (B) The side view of the droplet forming unit consisting of a shallow part of the sample chamber (10° slope) connected via a step with the droplet chamber. The dimensions are H = 1 mm, h1 = 40 μm, h2 = 200 μm. | ||
The tapered geometry of the sample chamber allows avoiding the step being blocked by the sample during its emulsification when its rear part approaches the step; see Fig. 1B.22 The total length of the supply channel is 70 mm. The oil reservoir is located above the droplet chamber. The difference in height of 30 mm between the oil inlet and the oil outlet generates a pressure head of approximately 4.73 mbar that drives the liquid through the step emulsification module. The oil flows only when both the oil inlet and the oil outlet are open. The droplet outlet located at the top of the droplet chamber was designed for the users to extract droplets for culture or further analysis if necessary. The CAD file of the design is provided in the ESI† 1.
The workflow of the gravity-driven step emulsification device without dead volume
The protocol of operating the gravity-driven step emulsification device is shown in Fig. 2 and ESI† 2 (further details are described in Table S1†). We first filled the device with fluorinated oil containing 2 wt% surfactant from the oil inlet. Continuing with the chip in horizontal orientation, we then deposited the samples in each sample inlet. Orienting the device vertically initiated the flow of liquids and led to droplet generation. The droplets were transported away from the step by buoyancy. Placing the device back in the horizontal position immediately stopped droplet generation, confirming that the process relied solely on gravity.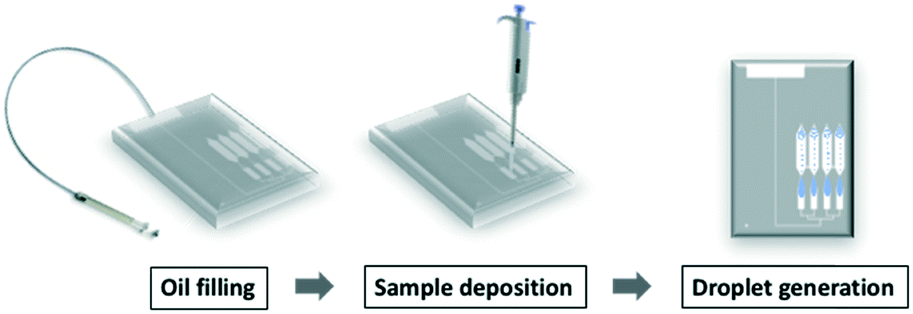 | ||
| Fig. 2 The workflow of gravity-driven step emulsification. Step 1: the entire chamber is filled with oil by injection through the oil inlet. Step 2: the samples are deposited in the sample inlet (steps 1 and 2 are in horizontal position). Step 3: the chip is oriented vertically, and droplets are generated immediately. | ||
Droplet generation from gravity-driven step emulsification device
Fig. 3A shows the volume of the droplets emulsified from 5 μl MH broth within the four chambers. We observed the entire process until no more droplets could be generated, namely, no MH broth remained in the sample chamber. The average volume of droplets in the chamber 1 was 1.78 ± 0.17 nl, in the chamber 2 was 1.98 ± 0.16 nl, in the chamber 3 was 2.09 ± 0.27 nl and in the chamber 4 was 2.09 ± 0.12 nl. Due to the limited precision of CNC milling, the depth of the channel (h1) in the chamber 1 was smaller than those of the other chambers (Fig. S4†) which resulted in the smaller size of droplets. This demonstrated that the droplet size could effectively be controlled by the geometry of the device. The average volume of MH broth droplets obtained from these four chambers was 1.98 nl with the coefficient of variance of droplet volumes of 11.7%. The size of droplets generated with our device decreased during sample emulsification (Fig. S5†); however, if the initial large droplet volumes and final small droplet volumes are discarded, the droplet volume changes only slightly. The initial and final droplet volume outliers are due to the hydrodynamic effects, but the fraction of these outliers in the emulsions is less than 5% which would result in a coefficient of variance of 8.9%. A similar observation was noted for a sloped emulsification system previously.22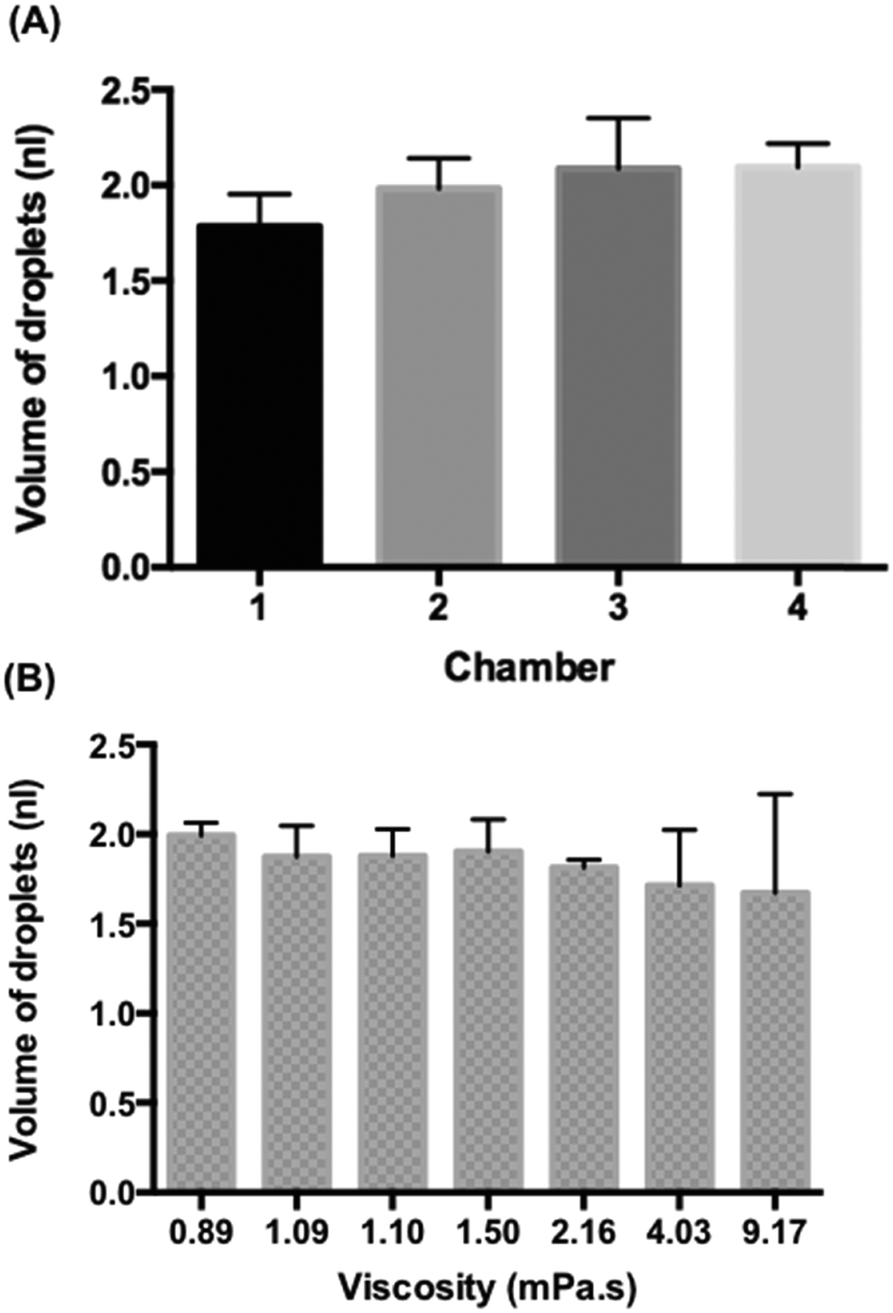 | ||
| Fig. 3 Droplet generation from the gravity-driven step emulsification device. (A) The average volume of droplets obtained from the entire droplet generation process without discarding the droplet volumes in the beginning and in the end from four different chambers. The aqueous solution is Muller–Hinton (MH) broth. (B) The volume of droplets generated from a liquid sample of different viscosity. Error bars are standard deviations (SDs). | ||
The whole emulsification process of the 5 μl sample took less than 10 minutes (ESI† 3), which corresponded to the flow rate of ca. 0.5 μl min−1. Previous gravity-driven droplet generation devices15–17 maintained a constant flow rate, while our device kept the monodisperse character of the emulsion when the oil level decreased thanks to the use of passive droplet generation which is more resistant to variations in the flow rate than other methods of droplet production.18,22 All of the features that we designed together made it possible to generate sufficient flow with the use of a small (30 mm) height difference that can be integrated onto a microfluidic chip.
In addition, we emulsified 2 μl liquid samples of different viscosity to observe the monodispersity of droplet generation on the four-chamber device. We used water (0.89 mPa s), Mueller–Hinton (MH) broth (1.09 mPa s), Luria-Bertani (LB) broth (1.1 mPa s), 1.2 wt% 20k polyethylene glycol (PEG) dissolved in Tris-EDTA (TE) buffer (1.5 mPa s), 2.4 wt% 20k PEG dissolved in TE buffer (2.16 mPa s), 4.8 wt% 20k PEG dissolved in TE buffer (4.03 mPa s), and 0.5 wt% 2m PEG dissolved in TE buffer (9.17 mPa s). The average droplet volume for water is 1.99 ± 0.07 nl, for MH is 1.87 ± 0.17 nl, for LB is 1.88 ± 0.15 nl, for 1.2 wt% 20k PEG in TE is 1.90 ± 0.18, and for 2.4 wt% 20k PEG in TE is 1.81 ± 0.04 (Fig. 3B). Interestingly, we observed a “balloon” phenomenon23 when the viscosity was above 4 mPa s which created big deviations of droplets in the group of 4.8 wt% 20k PEG in TE buffer (4.03 mPa s) and 0.5 wt% 2m PEG in TE buffer (9.17 mPa s). However, the droplet generation became stable afterwards (Fig. S6A†). A similar observation was found in a single-chamber device with glycerol and water mixtures (Fig. S6B†). However, when the viscosity was above 66 mPa s, it switched to the dripping module and the aqueous stream broke before the step (ESI† 4). We can observe a decline of the volume of droplets when the viscosity increases. Therefore, the gravity-driven step emulsification device helps to produce monodisperse droplets when the viscosity of the sample is under 4 mPa s which is enough for most biological samples (e.g. urine (1.07 mPa s at 20 °C and 0.8293 at 37 °C (ref. 24)), plasma (1.10–1.30 mPa s at 37 °C (ref. 25)), and saliva (0.95–1.1 mPa s (ref. 26)) etc.).
Mechanical stability of the emulsions for the possibility of long-term culture of bacteria
We made the emulsions from a 5 μl mixture of ∼106 CFU ml−1E. coli (diluted from McFarland 0.5) and 88 μM resazurin sodium salt using the gravity-driven step emulsification device and observed at 37 °C for 18 hours. Resazurin is known as an indicator of the metabolic activity of bacteria and is reduced to highly fluorescent resorufin in the presence of bacteria encapsulated in droplets. Here, we defined the fluorescent droplets as positive and non-fluorescent as negative.Fig. 4 shows that the droplets maintained good stability while incubated at 37 °C for 18 hours because we used HFE 7500 oil containing 2 wt% surfactant and designed an end-sealed tube to close the oil outlet to prevent bubble generation during incubation (Fig. S7 and Table S1,† step 13). HFE 7500 is an oil characterized by high gas solubility (0.48 ml air per one ml of oil27) which decreases with increasing temperature. Higher temperature causes bubble formation in the chambers. Once bubbles are formed in the chambers, they occupy some of the volume of the chamber and tend to grow in volume and further squeeze the droplets which results in droplet coalescence.
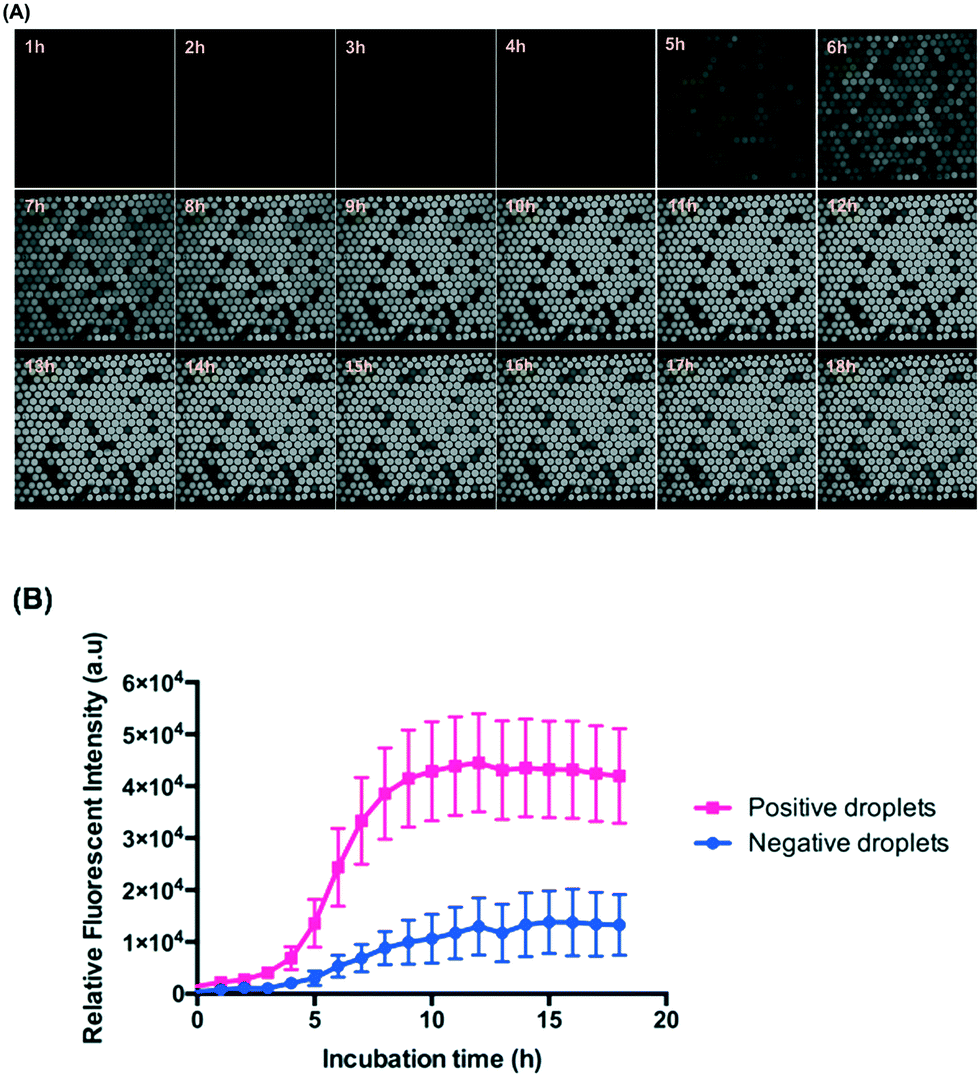 | ||
| Fig. 4 2D droplet arrangement for long-term incubation of E. coli in droplets. (A) The fluorescence images taken every 1 hour by time-lapse until 18 hours. (B) The relative fluorescence intensity of positive and negative droplets versus time. | ||
In addition, our system not only provides good stability of droplets but also is a promising platform for long-term culture of bacteria. Oxygen in the chamber can be stored both in the droplets and in the oil. In our case, roughly 1/3 of the volume of the chamber is filled by 2 nl droplets. Using the solubility coefficients of oxygen in complex medium28 and in fluorocarbon oil,29 we can calculate the amount of oxygen per droplet in the chamber. To estimate the oxygen consumption by bacteria inside a droplet, we assume that initially there is one bacterium inside the droplet which consumes oxygen with a rate30 determined by the exponential growth of bacteria. Consequently, we estimated that the oxygen will be consumed after 6 hours of incubation (ESI:† Note 4). This value is a lower bound estimation because it does not consider that some droplets do not comprise encapsulated bacterial cells and there is a diffusion of oxygen from PDMS into the chamber which introduces an additional flux of oxygen.31
Moreover, we have demonstrated the droplet generation process in a single chamber on a polycarbonate chip (ESI† 5) so we believe that this system, in the future, can be compatible with mass production strategies by using hard thermoplastics (e.g. COC) sealed with an oxygen-permeable polymethylpentene foil (e.g. TPX®). In fact, the depth of our droplet chamber is around 200 μm, which is 15 times shallower than in a VITEK®2 AST Card (bioMérieux) with the TPX® foil so the oxygen permeability of this foil should be sufficient to support incubation in the droplets.
Therefore, the gravity-driven step emulsification device proposed here is well suitable for long-term cultivation and monitoring of bacterial growth.
2D droplet arrangement delays mass transfer between adjacent droplets
The use of resazurin for the detection of bacteria in micro-droplets has been demonstrated in several studies.21,32,33Fig. 4 shows that the signals from the positive droplets (containing resorufin) and negative ones (containing resazurin) did not equalize even after 18 hours thanks to the 2D droplet arrangement. For a more reliable image analysis and wider range of tested species of bacteria, we chose 5-hour incubation for performing the ddCFU and MIC tests.From the perspective of the diffusion rate in a homogeneous fluid, it is surprising that the resorufin stays inside the droplets for such a long period in our system. Estimation of the time scale for the diffusion of resorufin in a homogeneous fluid gives the following time, τ = l2/4D = 26 s, where we assumed the characteristic length (l) equals to the droplet diameter and the diffusion coefficient of resorufin (D) was estimated from the Stokes–Einstein formula for 1 nm particles in HFE 7500 oil. According to this estimation, the equilibrium distribution of resorufin in all droplets in our system should happen in minutes. In reality (from our experiment and as shown before34), the droplets are covered with PFPE–PEG–PFPE surfactant so the partitioning of resorufin from the droplets to the fluorinated oil phase is small, and the mass transport between the droplets is mediated by vesicles rather than by diffusion. These vesicles (∼200 nm in diameter) consist of a fluorinated core surrounded by a surfactant bilayer in which particles soluble in water, instead of oil, are present as described before.34 The diffusion coefficient of such a vesicle is much smaller (3 to 4 orders of magnitude smaller) than that of a single fluorophore particle,34 which limits the transport between droplets as the vesicle needs to diffuse through the oil phase from one droplet to another. Additionally, these vesicles must detach themselves from one droplet and merge with another one, which additionally prolongs the process.
The 2D arrangement of droplets reduces the transport of fluorophores between droplets simply because in 2D arrangement, each droplet has smaller number of neighbours than in 3D emulsion arrangement, as was shown theoretically.35 This, however, is only an addition of time to the already lengthy transport that is based on large vesicles rather than on diffusion of single fluorophore particles. Scheler et al.21 could distinguish positive (with resorufin) from negative droplets after up to 9 hours under a 3D array incubation of E. coli encapsulated in droplets. We used exactly the same concentration of the same surfactant as they did, but we had ca. 2 times larger droplets incubated in a 2D arranged array. By estimation, the ratio of equilibrium time between adjacent droplets in the system of Scheler et al.21 (1 nl) and our droplets (2 nl) is 1.59 because the equilibrium time is proportional to the diameter square of droplets. Furthermore, in the case of 2D arrangement of droplets in comparison to 3D arrangement, the transport of fluorophores is reduced by a factor of 1.5.35 Since, Scheler et al.21 could distinguish positive from negative droplets after 9 hours, we then calculate by these factors and estimate that we should be able to do so after 21.47 (9 × 1.59 × 1.5) hours. Additionally, in Scheler et al.21 there could have been mixing due to convection at an elevated temperature which increases the rate of formation of contaminating vesicles.34 In our 2D arrangement, such a convection should be limited as the chamber was oriented horizontally during incubation. The fact that we are able to distinguish positive and negative droplets in our system after as long as 18 hours is therefore in line with the previously shown theoretical models. Although we can see a slightly decreased fluorescence signal after 12 hours, it is still clearly possible to distinguish positive droplets from negative ones (Fig. 4).
Digital droplet CFU for absolute quantification of bacteria
Fig. 5 demonstrates the possibility of enumerating bacteria on the gravity-driven step emulsification device. We generated eight serial logarithmic dilutions of an initial bacterial sample of ∼108 CFU ml−1 and subsequently loaded 5 μl of 88 μM resazurin and bacterial mixtures into two copies of the four-chamber device (total of eight chambers) for droplet generation by gravity and directly incubated the device at 37 °C for 5 hours before detection. According to the OD measurements (at 600 nm) of calibration curves that we obtained (Fig. S8†), 108 CFU ml−1 is found to be equivalent to approximately 0.40 OD unit for E. coli, 0.60 OD unit for S. aureus, and 0.52 OD unit for E. faecalis. | ||
| Fig. 5 Digital droplet CFU performed on the gravity-driven step emulsification device. (A) Fluorescence images of digital droplet CFU by eight different dilution steps from the bacterial concentration of ∼108. (B) Percentage of positive droplets versus bacterial concentration for (a) E. coli, (b) S. aureus, and (c) E. faecalis. (C) Comparison of ddCFU and bacteria concentration by series dilution. (a) E. coli, (b) S. aureus, (c) E. faecalis. Error bars are the standard deviations (SDs) from 4 independent experiments. | ||
The correlations between the fractions of positive droplets (P) followed the Poisson distribution for E. coli, S. aureus, and E. faecalis (Fig. 5B and S9†). Theoretically speaking, when the bacterial concentration (C0) is 5 × 10⁵ CFU ml−1, 63% of 1.98 nl droplets obtained from chamber 2 will be positive. In our case, we obtained 66 ± 6% positive droplets for E. coli, 65 ± 7% positive droplets for S. aureus, and 70 ± 6% positive droplets for E. faecalis. We compared this digital enumeration method to series dilution from the original concentration of bacteria and found that they displayed a high correlation in the case of E. coli (R2 = 0.9985), S. aureus (R2 = 9998), and E. faecalis (R2 = 0.9992) by the least squares fit within logarithmic axes (Fig. 5C). More statistical details are provided in Table S3.†
The limited number of droplets in a single chamber decreases the dynamic range of the enumeration method. We observed deviations from Poisson distribution at concentrations lower than 5 × 10² CFU ml−1 where the positive droplets were less than 1% (Fig. S9†). When the concentration of bacteria was higher than 5 × 10⁷ CFU ml−1, it reached a saturation point of the assay. Therefore, the limit of detection of our system is between 5 × 10² CFU ml−1 and 5 × 10⁶ CFU ml−1, yielding a dynamic range of four orders of magnitude. This dynamic range can easily be expanded with the use of (i) smaller droplet generation nozzles, and thus smaller and more numerous droplets, and (ii) larger sample volumes and larger chambers.
Determination of minimum inhibitory concentration of antibiotics against bacteria
Fig. 6 shows the results of determination of the MIC of ampicillin against E. coli, cefotaxime against S. aureus, and ampicillin against E. faecalis with 8 different concentrations of antibiotics (0, 0.25, 0.5, 1, 2, 4, 8, and 16 μg ml−1) used in each chamber. Resazurin and antibiotics were pre-mixed with bacteria before droplet generation. After droplet generation, we incubated the device for 5 hours at 37 °C. A standard bacterial concentration of 5 × 10⁵ CFU ml−1 for MIC test was used in this experiment. In Fig. 5A, 67% positive droplets for E. coli, 63% positive droplets for S. aureus, and 66% positive droplets for E. faecalis were obtained without antibiotic treatment. These results were in agreement with the ddCFU counting as we mentioned in the previous paragraph. The MIC value of ampicillin against E. coli is 4 μg ml−1, cefotaxime against S. aureus is 1 μg ml−1, and ampicillin against E. faecalis is 0.5 μg ml−1 (Fig. 6B). These values agreed with the MIC from the broth microdilution (Fig. S10†) and were also within the CLSI quality control (QC) range3 of 2–8 μg ml−1 for ampicillin against E. coli ATCC 25922, 1–4 μg ml−1 for cefotaxime against S. aureus ATCC 29213, and 0.5–2 μg ml−1 for ampicillin against E. faecalis ATCC 51299.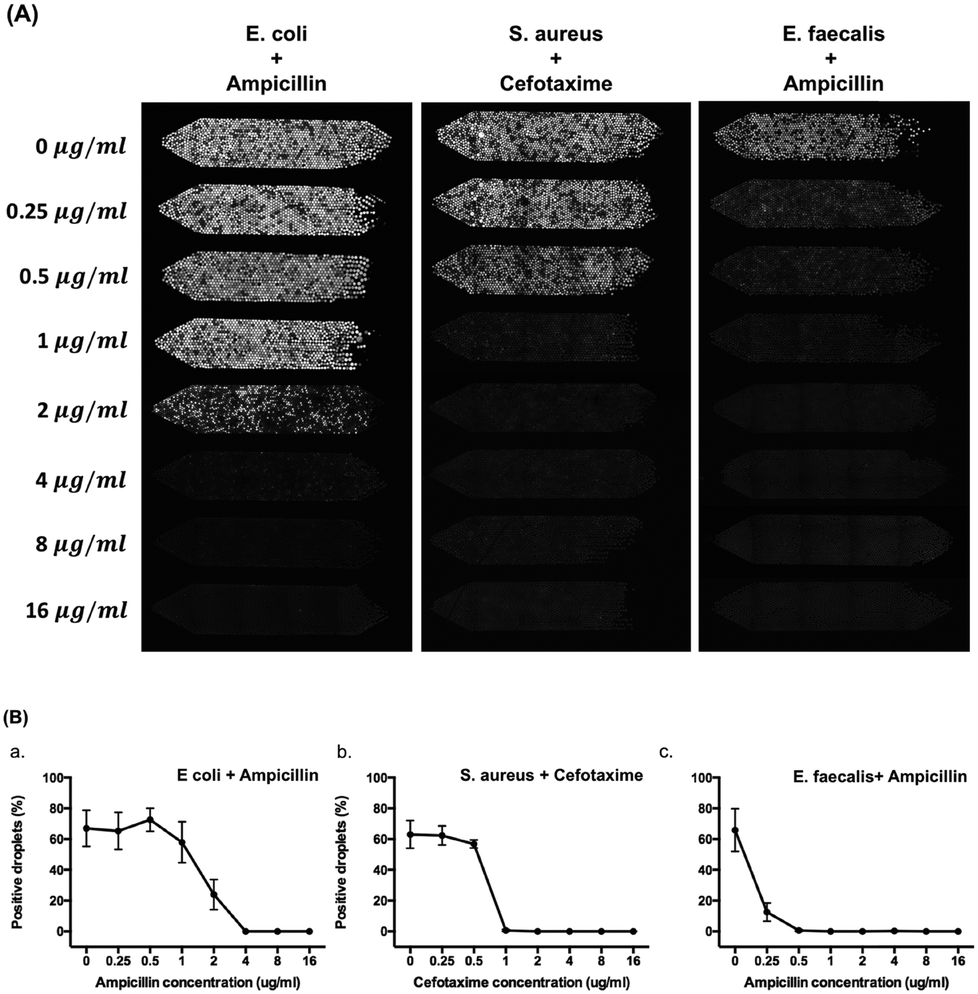 | ||
| Fig. 6 Determination of minimum inhibitory concentration of antibiotics against bacteria on chip. (A) Fluorescence images of each chamber after 5 hours of incubation for the combination of ampicillin against E. coli, cefotaxime against S. aureus, and ampicillin against E. faecalis. (B) The MIC plot for the combination of ampicillin against E. coli, cefotaxime against S. aureus, and ampicillin against E. faecalis. Error bars are standard deviations (SDs) from three independent experiments. | ||
With the help of resazurin, we could possibly determine the MIC value with various bacterial species within 5 hours. Here, we presented tests with one Gram-negative (E. coli) and two Gram-positive (S. aureus and E. faecalis) bacteria by pre-supplementing resazurin with antibiotics. However, Schmitt et al.36 pointed out that under the recommended concentration of 44 μM resazurin, the growth of Francisella and Neisseria species were inhibited after 24 hours of incubation at 37 °C and further showed that F. tularensis LVS (live vaccine strain) reached a maximum fluorescence ratio (resorufin to resazurin) after 4 hours post-inoculation but a decline in viable bacteria after 8 hours suggesting the limitation of using resazurin in some of bacteria strains. We also observed that presence of Pseudomonas aeruginosa (ATCC 27853) in the resazurin/resorufin assay resulted in limited discrimination of the positive droplets from the negative ones within a short period of time (Fig. S11†). This was probably due to the interactions of the fluorescent products (e.g. pyocyanin) that P. aeruginosa produces with resazurin/resorufin. Resazurin can be converted to resorufin in the presence of NADH or NADPH which is the product of respiration, but NAD(P)H might be oxidized by pyocyanin to NAD(P)+ (ref. 37) that results in a weak signal for detection. However, the use of resazurin is still quite universal approach within the incubation time (5 h) that we suggested in this work.
The time-kill of the used antibiotics versus the used bacterial strains might play an important role in this assay. Antibiotics are classified either as bacteriostatic or bactericidal. Bacteriostatic antibiotics inhibit cell growth, whereas bactericidal antibiotics induce cell death. Growth inhibition from bacteriostatic antibiotics is associated with suppressed cellular respiration, whereas cell death from most bactericidal antibiotics is associated with accelerated respiration.38 Resazurin is converted to resorufin by the products of respiration, and if within 5 hours, bacteria have not been “killed” by bactericidal antibiotics, the products from accelerated respiration will be detected and cause false signals. We think that experiments that would shed more light on the issue are possible in our setup and might be an interesting research path to follow in the future.
The concern of partitioning of the antibiotics between the aqueous environment of the droplet and the oil phase is of outmost importance. In our work, we used only one concentration of the antibiotic in a single chamber to minimize the effects of any cross-talks that might occur between neighbouring droplets. In a more general view, most antibiotics contain polar groups (e.g. amino (–NH2) and carboxylic (–COOH) in both ampicillin and cefotaxime) that make them insoluble in non-polar solvents and especially in fluorinated solvents.39,40 For most antibiotics, the partitioning to the fluorinated oil should be minimal. Although the antibiotics in droplets might migrate between the emulsions by vesicles, this migration will not influence the measured level of the MIC. Nonetheless, the partitioning and stability of the concentration inside droplets should be checked for each new combination of antibiotic, oil, surfactant and aqueous medium used in a given experiment.
Outlook and conclusions
We demonstrated a simple and robust method for generation of libraries of monodisperse two nanoliter droplets. The whole protocol required the user only to prepare the aqueous sample, deposit it onto an oil-prefilled chip and subsequently to orient the chip vertically. We used gravity to drive the liquids through a step-emulsification junction and to transform the liquid sample into a library of nanoliter droplets to encapsulate bacteria in droplets and count positive droplets by a digital CFU method. The concentration of bacteria was set by the volume of the droplet which made it easier to get rid of the inoculum effect. We further performed minimum inhibitory concentration tests at eight different concentrations of antibiotics using a pair of gravity-driven chips each comprising 4 separate droplet generators and 4 chambers for storage and incubation of emulsions. Thanks to the 2D droplet arrangement, we were able to culture the bacteria for long periods (18 h) which expands the range of applications to those requiring mid- to long-term cultures.Compared to other microfluidic methods for enumeration of bacteria7 and AST41 in droplets, the advantages of using a gravity-driven step emulsification device are the following: (i) pump-free droplet generation, (ii) integrated system with small footprint, and (iii) no need for manual transfer steps for incubation and imaging. Other microfluidic systems might suffer from droplet loss when transferring the droplets from a droplet generation chip to the incubation tubes and from tubes to a detection chip which may lead to miscalculation of the bacterial load. In this work, there are no additional transferring steps for users that makes the gravity-driven step emulsification device easy to use.
The routinely used commercial instruments (e.g. bioMérieux VITEK® 2 system) for AST are based on a variant of the microdilution method that requires a precisely known inoculum density to provide reliable results. For many β-lactam antibiotics used against β-lactamase-producing bacteria, the recorded value of the MIC shows a significant dependence on the starting density of bacteria. The allowed range of the starting inoculum density recommended by CLSI3 and EUCAST4 and errors associated with the limited precision of the commonly used optical densitometers may cause significant and even multiple fold differences in the measured MIC value (ESI:† Note 11). In the worst case scenario, a given pathogen can be even misclassified between susceptible, intermediate or resistant classes. On the other hand, the instruments for sensitive detection and enumeration of bacteria (e.g. bioMérieux TEMPO® and IDEXX Colilert-18) require 18–20 hours of incubation for measurement and this time-to-result could be shortened if the droplet assay is applied. In this context, the droplet digital assays provide a promising alternative that simultaneously digitally measure the initial density of a culture (determine the number of cells) and perform the susceptibility assay.
Moreover, possible applications of the gravity-driven step emulsification device are not limited to use in microbiology. The system presented here can also be combined with many digital droplet nucleic acid amplification techniques such as ddPCR42 (polymer chain reaction), ddRPA43 (recombinase polymerase amplification), and ddLAMP19 (loop-mediated isothermal amplification). However, to perform point-of-care detection, both droplet generation and imaging should be performed with possibly simple techniques and easily accessible in low-resource environments. Smartphone-based fluorescence microscopy has been developed in many studies44–47 and is also available on the market (e.g. handheld fluorescence microscopy, Soma Optics, Ltd., Japan), so the confocal microscopy used for detection in this work should be possible to be replaced with such portable detectors. Besides, label-free techniques based on light scattering48 or colorimetric methods49 can be another alternative way for detection in future work.
Thus, the gravity-driven step emulsification microfluidic device constitutes a step towards a simple and convenient way for large-scale compartmentalization and single-bacteria investigation which could be applied in microbiology and medical diagnostics.
Conflicts of interest
The described method is a subject of a patent application held by Y.-T. Kao, T. S. Kaminski, W. Postek, J. Guzowski and P. Garstecki pending in the Polish Patent Office.Acknowledgements
The authors thank Airit Agasty and Ying Zhou for the viscosity measurements and Shu-Wei Huang and Dr. Aneta Guzek for MIC measurements using the VITEK instrument. This publication is part of a project that has received funding from the European Union's Horizon 2020 research and innovation programme under the Marie Skłodowska-Curie grant agreement No. 711859. The scientific work was funded from the financial resources for science in the years 2017–2021 awarded by the Polish Ministry of Science and Higher Education for the implementation of an international co-financed project. In addition, P. G. acknowledges support from the National Science Centre grant DEC-2014/12/W/NZ6/00454 (Symfonia). K. M. acknowledges support from the National Science Centre, Poland, within the project Sonata 2016/21/D/ST3/00988. T. S. K. and W. P. acknowledge the support from the Foundation for Polish Science within the Team-Tech/2016-2/10 program. T. S. K. was supported by the Ministry of Science and Higher Education through the scholarship for outstanding young researchers (agreement 0722/E 64/STYP/10/295). This project was also partially performed in the Ultrafast Microfluidic Devices Laboratory funded by NanoFun POIG.02.02.00-00-025/09.Notes and references
- R. Daniels, J. Antimicrob. Chemother., 2011, 66, 11–23 CrossRef PubMed.
- J. Barenfanger, C. Drake and G. Kacich, J. Clin. Microbiol., 1999, 37, 1415–1418 CAS.
- F. R. Cockerill, M. A. Wikler, J. Adler, M. N. Dudley, G. M. Elipoulos, M. J. Ferraro, D. J. Hardy, D. W. Hecht, J. A. Hindler, J. B. Patel, M. Powell, J. M. Swenson, R. B. Thomson, M. M. Traczewski, J. D. Turnidge, M. P. Weinstein and B. L. Zimmer, Performance Standards for Antimicrobial Susceptibility Testing CLSI supplement M100S, Clinical and Laboratory Standards Institute, Wayne, PA, 26th edn, 2016 Search PubMed.
- European Committee for Antimicrobial Susceptibility Testing (EUCAST) of the European Society of Clinical Microbiology and Infectious Diseases (ESCMID), Clin. Microbiol. Infect., 2003, 9, ix–xv CrossRef.
- J. W. Mouton and A. A. Vinks, Clin. Pharmacokinet., 2005, 44, 767–768 CrossRef PubMed.
- G. Amselem, C. Guermonprez, B. Drogue, S. Michelin and C. N. Baroud, Lab Chip, 2016, 16, 4200–4211 RSC.
- O. Scheler, N. Pacocha, P. R. Debski, A. Ruszczak, T. S. Kaminski and P. Garstecki, Lab Chip, 2017, 17, 1980–1987 RSC.
- L. Derzsi, T. S. Kaminski and P. Garstecki, Lab Chip, 2016, 16, 893–901 RSC.
- L. Jiang, L. Boitard, P. Broyer, A.-C. Chareire, P. Bourne-Branchu, P. Mahé, M. Tournoud, C. Franceschi, G. Zambardi, J. Baudry and J. Bibette, Eur. J. Clin. Microbiol. Infect. Dis., 2016, 35, 415–422 CrossRef CAS PubMed.
- N. J. Cira, J. Y. Ho, M. E. Dueck and D. B. Weibel, Lab Chip, 2012, 12, 1052–1059 RSC.
- R. Mohan, C. Sanpitakseree, A. V. Desai, S. E. Sevgen, C. M. Schroeder and P. J. A. Kenis, RSC Adv., 2015, 5, 35211–35223 RSC.
- W.-B. Lee, C.-Y. Fu, W.-H. Chang, H.-L. You, C.-H. Wang, M. S. Lee and G.-B. Lee, Biosens. Bioelectron., 2017, 87, 669–678 CrossRef CAS PubMed.
- H. Tanaka, S. Yamamoto, A. Nakamura, Y. Nakashoji, N. Okura, N. Nakamoto, K. Tsukagoshi and M. Hashimoto, Anal. Chem., 2015, 87, 4134–4143 CrossRef CAS PubMed.
- E.-C. Yeh, C.-C. Fu, L. Hu, R. Thakur, J. Feng and L. P. Lee, Sci. Adv., 2017, 3, e1501645 CrossRef PubMed.
- K. Zhang, Q. Liang, S. Ma, T. He, X. Ai, P. Hu, Y. Wang and G. Luo, Microfluid. Nanofluid., 2010, 9, 995–1001 CrossRef.
- V. van Steijn, P. M. Korczyk, L. Derzsi, A. R. Abate, D. A. Weitz and P. Garstecki, Biomicrofluidics, 2013, 7, 024108 CrossRef PubMed.
- K. F. Tjhung, S. Burnham, H. Anany, M. W. Griffiths and R. Derda, Anal. Chem., 2014, 86, 5642–5648 CrossRef CAS PubMed.
- F. Dutka, A. S. Opalskia and P. Garstecki, Lab Chip, 2016, 16, 2044–2049 RSC.
- F. Schuler, C. Siber, S. Hin, S. Wadle, N. Paust, R. Zengerle and F. von Stetten, Anal. Methods, 2016, 8, 2750–2755 RSC.
- C. Holtze, A. C. Rowat, J. J. Agresti, J. B. Hutchison, F. E. Angilè, C. H. J. Schmitz, S. Köster, H. Duan, K. J. Humphry, R. A. Scanga, J. S. Johnson, D. Pisignano and D. A. Weitz, Lab Chip, 2008, 8, 1632–1639 RSC.
- O. Scheler, T. S. Kaminski, A. Ruszczak and P. Garstecki, ACS Appl. Mater. Interfaces, 2016, 8, 11318–11325 CrossRef CAS PubMed.
- W. Postek, T. S. Kaminski and P. Garstecki, Lab Chip, 2017, 17, 1323–1331 RSC.
- Z. Li, A. M. Leshansky, L. M. Pismen and P. Tabeling, Lab Chip, 2015, 15, 1023–1031 RSC.
- B. A. Inman, W. Etienne, R. Rubin, R. A. Owusu, T. R. Oliveira, D. B. Rodriques, P. F. Maccarini, P. R. Stauffer, A. Mashal and M. W. Dewhirst, Int. J. Hyperthermia, 2013, 29, 206–210 CrossRef CAS PubMed.
- G. Késmárky, P. Kenyeres, M. Rábai and K. Tóth, Clin. Hemorheol. Microcirc., 2008, 39, 243–246 Search PubMed.
- H. A. Waterman, C. Blom, H. J. Holterman, E. J. 's-Gravenmade and J. Mellema, Arch. Oral Biol., 1988, 33, 589–596 CrossRef CAS PubMed.
- F. Schuler, M. Trotter, M. Geltman, F. Schwemmer, S. Wadle, E. Domínguez-Garrido, M. López, C. Cervera-Acedo, P. Santibáñez, F. von Stetten, R. Zengerle and N. Paust, Lab Chip, 2016, 16, 208–216 RSC.
- L. Mahler, M. Tovar, T. Weber, S. Brandes, M. M. Rudolph, J. Ehgartner, T. Mayr, M. T. Figge, M. Roth and E. Zang, RSC Adv., 2015, 5, 101871–101878 RSC.
- K. Sklodowska and S. Jakiela, RSC Adv., 2017, 7, 40990–40995 RSC.
- P. Çalik, P. Yilgör, P. Ayhan and A. S. Demir, Chem. Eng. Sci., 2004, 59, 5075–5083 CrossRef.
- C. H. Chen, Y. Lu, M. L. Y. Sin, K. E. Mach, D. D. Zhang, V. Gau, J. C. Liao and P. K. Wong, Anal. Chem., 2010, 82, 1012–1019 CrossRef CAS PubMed.
- L. Boitard, D. Cottinet, N. Bremond, J. Baudry and J. Bibette, Eng. Life Sci., 2015, 15, 318–326 CrossRef CAS.
- K. Churski, T. S. Kaminski, S. Jakiela, W. Kamysz, W. Baranska-Rybak, D. B. Weibel and P. Garstecki, Lab Chip, 2012, 12, 1629–1637 RSC.
- P. Gruner, B. Riechers, B. Semin, J. Lim, A. Johnston, K. Short and J.-C. Baret, Nat. Commun., 2014, 7, 10392 CrossRef PubMed.
- Y. Skhiri, P. Gruner, B. Semin, Q. Brosseau, D. Pekin, L. Mazutis, V. Goust, F. Kleinschmidt, A. El Harrak, J. B. Hutchison, E. Mayot, J.-F. Bartolo, A. D. Griffiths, V. Taly and J.-C. Baret, Soft Matter, 2012, 8, 10618–10627 RSC.
- D. M. Schmitt, D. M. O'Dee, B. N. Cowan, J. W.-M. Birch, L. K. Mazzella, G. J. Nau and J. Horzempa, Front. Cell. Infect. Microbiol., 2013, 3, 93 Search PubMed.
- Y. Q. O'Malley, K. J. Reszka, D. R. Spitz, G. M. Denning and B. E. Britigan, Am. J. Physiol., 2004, 287, L94–L103 Search PubMed.
- M. A. Lobritz, P. Belenky, C. B. M. Porter, A. Gutierrez, J. H. Yang, E. G. Schwarz, D. J. Dwyer, A. S. Khalil and J. J. Collins, Proc. Natl. Acad. Sci. U. S. A., 2015, 112, 8173–8180 CrossRef CAS.
- F. Varanda, M. J. P. de Melo, A. I. Caço, R. Dohrn, F. A. Makrydaki, E. Voutsas, D. Tassios and I. M. Marrucho, Ind. Eng. Chem. Res., 2006, 45, 6368–6374 CrossRef CAS.
- A. I. Caço, F. Varanda, M. J. P. de Melo, A. M. A. Dias, R. Dohrn and I. M. Marrucho, Ind. Eng. Chem. Res., 2008, 47, 8083–8089 CrossRef.
- W. Postek, P. Gargulinski, O. Scheler, T. S. Kaminski and P. Garstecki, Lab Chip, 2018, 18, 3668–3677 RSC.
- L. B. Pinheiro, V. A. Coleman, C. M. Hindson, J. Herrmann, B. J. Hindson, S. Bhat and K. R. Emslie, Anal. Chem., 2012, 84, 1003–1011 CrossRef CAS PubMed.
- F. Schuler, F. Schwemmer, M. Trotter, S. Wadle, R. Zengerle, F. von Stetten and N. Paust, Lab Chip, 2015, 15, 2759–2766 RSC.
- Q. Wei, H. Qi, W. Luo, D. Tseng, S. J. Ki, Z. Wan, Z. Göröcs, L. A. Bentolila, T.-T. Wu, R. Sun and A. Ozcan, ACS Nano, 2013, 7, 9147–9155 CrossRef CAS PubMed.
- J. E. Kong, Q. Wei, D. Tseng, J. Zhang, E. Pan, M. Lewinski, O. B. Garner, A. Ozcan and D. Di Carlo, ACS Nano, 2017, 11, 2934–2943 CrossRef CAS PubMed.
- M. Kühnemund, Q. Wei, E. Darai, Y. Wang, I. Hernández-Neuta, Z. Yang, D. Tseng, A. Ahlford, L. Mathot, T. Sjöblom, A. Ozcan and M. Nilsson, Nat. Commun., 2017, 8, 13913 CrossRef PubMed.
- Y. Sung, F. Campa and W.-C. Shih, Biomed. Opt. Express, 2017, 8, 5075–5086 CrossRef CAS PubMed.
- X. Liu, R. E. Painter, K. Enesa, D. Holmes, G. Whyte, C. G. Garlisi, F. J. Monsma Jr., M. Rehak, F. F. Craiga and C. A. Smith, Lab Chip, 2016, 16, 1636–1643 RSC.
- J. A. Adkins, K. Boehle, C. Friend, B. Chamberlain, B. Bisha and C. S. Henry, Anal. Chem., 2017, 89, 3613–3621 CrossRef CAS PubMed.
Footnote |
| † Electronic supplementary information (ESI) available. See DOI: 10.1039/c9lc00684b |
| This journal is © The Royal Society of Chemistry 2020 |