
 Open Access Article
 This Open Access Article is licensed under a Creative Commons Attribution-Non Commercial 3.0 Unported Licence
Efficient separation and high-precision analyses of tin and cadmium isotopes in geological materials†
Matthias
Friebel
 ,
Eniko R.
Toth
,
Manuela A.
Fehr
and
Maria
Schönbächler
*
,
Eniko R.
Toth
,
Manuela A.
Fehr
and
Maria
Schönbächler
*
Institute of Geochemistry and Petrology, ETH Zürich, Clausiusstrasse 25, 8092 Zürich, Switzerland. E-mail: mariasc@ethz.ch
First published on 19th December 2019
Abstract
This paper presents a new method for the separation of Sn and Cd from geological matrices followed by high-precision isotope analyses that include low abundance isotopes (<1.25%). The new technique is of specific interest for the detection of small mass-independent nucleosynthetic or cosmogenic isotope variations in meteorites and other planetary materials. We also report a new precise estimate for Sn isotope abundances. The method employs a combination of ion exchange and extraction chromatography together with multi-collector inductively coupled plasma mass spectrometry (MC-ICP-MS). Tin is separated from the sample matrix using an anion-exchange resin, followed by removal of remaining matrix elements and organics using the TRU and Pre-filter resins, respectively. The matrix fraction from the TRU resin step is further purified to isolate Cd using a two-stage anion exchange procedure. Analyses of Sn and Cd standard solutions doped with interfering elements were employed to define thresholds for tolerable amounts of interference producing elements. Our data demonstrate that our new procedure produces purified Sn and Cd solutions with sufficiently low levels of contaminants for high precision Sn and Cd isotope analyses. Removal of U is important for Sn isotope data because of doubly charged U ions. The internally normalised Sn isotope data of the two standard solution (NIST SRM 3161a and SPEX CLSN2-2Y) are in excellent agreement with previous data. Based on repeated analysis of independently processed lake sediment aliquots, an external reproducibility (intermediate precision) (2SD) is achieved of ±110 ppm for 112Sn/120Sn, ±170 ppm for 114Sn/120Sn, ±160 ppm for 115Sn/120Sn, ±21 ppm for 117Sn/120Sn, ±13 ppm for 118Sn/120Sn, ±20 ppm for 119Sn/120Sn, ±22 ppm for 122Sn/120Sn and ±24 ppm for 124Sn/120Sn. Replicate Sn analyses of the carbonaceous chondrite Allende are in excellent agreement with those of the lake sediments. For Cd isotope analyses, the lake sediment yields an external reproducibility (2SD) of ±170 ppm for 106Cd/111Cd, ±200 ppm for 108Cd/111Cd, ±34 ppm for 110Cd/111Cd, ±18 ppm for 112Cd/111Cd, ±24 ppm for 113Cd/111Cd and ±15 ppm for 114Cd/111Cd.
1. Introduction
The Sn isotope composition has been studied in detail since the mid 1960s. Most work was carried out by thermal ionisation mass spectrometry (TIMS) and focused on improving the analytical techniques to precisely determine the Sn isotope abundances and atomic weights.1–4 Another goal was the search for isotopic anomalies in meteorites.5,6 With the introduction of MC-ICP-MS and its capability for measuring elements with high ionisation potentials at high precision (e.g.ref. 7), research shifted to the investigation of mass-dependent Sn isotope fractionation associated with the formation of cassiterite for provenance analysis.8–14 Other studies used Sn to identify mass-independent nuclear field shift effects during chemical exchange reaction using crown ether15 and during methylation and demethylation.16 Most recent research focused on mass-dependent Sn isotope fractionation during igneous differentiation and on the Sn isotope composition of the bulk silicate Earth (BSE) using a double-spike approach.17,18Tin isotopes are of special interest for geochemical and cosmochemical studies due to various reasons. With a 50% condensation temperature of 704 K for a gas of solar composition at a total pressure of 10−4 bar, Sn is cosmochemically classified as a moderately volatile element.19,20 Moreover, the primitive mantle of the Earth is depleted in Sn by a factor of 33 ± 3 relative to the CI chondrites.21 Therefore, mass-dependent Sn isotope fractionation is a promising tool to better constrain the mechanism of volatile depletion in the solar system. Geochemically, Sn is moderately siderophile to chalcophile, and incompatible during silicate differentiation.21 The behaviour of Sn during differentiation depends on its oxidation state, coordination in the crystal lattice and melt composition.22,23 Based on this, Sn isotope fractionation likely occurs during igneous processes and published Sn isotope data support this conclusion.17,18
Similarly, Cd is another moderately volatile element with a 50% condensation temperature of 652 K![[thin space (1/6-em)]](https://www.rsc.org/images/entities/char_2009.gif) 20 that has been studied for its mass-dependent isotope composition to address the origin of volatile depletion in rocky planets (e.g.ref. 24–27). More recently, it has also been shown that Cd isotopes not only fractionate due to volatility related processes e.g. in chondrites,26 but also during magmatic differentiation, with the crust displaying a slightly heavier Cd isotope composition.28
20 that has been studied for its mass-dependent isotope composition to address the origin of volatile depletion in rocky planets (e.g.ref. 24–27). More recently, it has also been shown that Cd isotopes not only fractionate due to volatility related processes e.g. in chondrites,26 but also during magmatic differentiation, with the crust displaying a slightly heavier Cd isotope composition.28
In recent years, nucleosynthetic isotope variations have become a powerful tool in cosmochemistry. These are mass-independent isotope variations identified in meteorites and terrestrial planets. They are caused by the heterogeneous distribution of presolar dust that survived the formation of the solar system and kept the extreme isotopic compositions of their stellar sources (e.g. AGB-star or supernovae).29 The distinct nucleosynthetic compositions of planetary materials can be used to investigate important processes in the early solar system, such as mixing or the physical conditions (e.g. temperatures) that prevailed in the protoplanetary disk, and influenced the composition of solar system material (e.g.ref. 30 and 31). Tin is the element with the highest number of stable isotopes with ten stable isotopes, formed by the p-process (112Sn and 114Sn), s-process (116Sn), the r-process (124Sn), or mixtures thereof (115Sn, 117Sn, 118Sn, 119Sn, 120Sn and 122Sn), and therefore an ideal candidate to study nucleosynthetic isotope variations in the solar system. Cadmium provides an excellent companion with its eight stable isotopes also produced by a variety of nucleosynthetic processes: 106Cd and 108Cd by the p-process, 110Cd by the s-process, and 111Cd to 116Cd by a combination of the s- and the r-process in different proportions.32,33 Cadmium has a mainly chalcophile affinity as opposed to the more siderophile nature of Sn, indicating that Cd and Sn may reside in different carrier phases within meteorites. Therefore, the combined study of Sn and Cd may provide a powerful tool to assess the origin of the current lack of resolvable nucleosynthetic isotope variations of moderately volatile elements at the bulk meteorite scale. However, since these mass-independent nucleosynthetic variations are generally small, mostly less than 0.1 per mil (e.g. for Zr,30 Mo34 and Ru35), an improved analytical procedure for mass-independent Sn and Cd isotope analyses is required.
In addition to nucleosynthetic variations, meteorites and lunar samples can experience mass-independent modification of their isotopes through exposure to galactic cosmic rays in space. Such modifications are, for example, reported for Cd isotopes in lunar samples.26,36 This is important to note, because the investigation of the mass-dependent Sn and Cd isotope compositions in meteorites and lunar samples using the double-spike method also depends on their mass-independent isotope composition. This is because the double spike method assumes a constant natural isotope composition that is only altered by mass-dependent isotope fractionation. In order to obtain precise and accurate data using the double-spike approach, one must identify whether the Sn or Cd isotope composition was subject to mass-independent processes, i.e. has a different mass-independent composition and if so, the double spike calculation needs adaption (e.g.ref. 37).
Available analytical methods for Sn or Cd isotope analyses (e.g.ref. 14 and 27) were not designed to obtain such mass-independent isotope data at sufficiently high precision to address these issues. Therefore, we developed a new analytical procedure to obtain high precision Sn and Cd isotope data from the same sample aliquot. The method includes a three-stage chromatographic procedure to efficiently separate Sn from complex rock matrices, followed by anion-exchange chromatography to purify Cd. The resulting Sn and Cd sample solutions are analysed on a Nu Plasma II MC-ICP-MS, thereby determining all Sn and Cd isotopes at high precision. Spectral interferences and matrix effects from traces of elements remaining after sample purification can hamper data quality during MC-ICP-MS analyses. This is in particular an issue when improving the analytical precision, because effects, which were unproblematic at lower precision, can be resolved at high precision. For this reason, we performed extensive test with Cd and Sn standard solutions doped with critical elements. The accuracy and precision of the new procedure was also verified using two geological samples processed through the chromatographic procedure: a lake sediment and the carbonaceous chondrite Allende. The new technique is powerful because it can be applied for the search of nucleosynthetic or cosmogenic Sn and Cd isotope variations in extraterrestrial materials. Since extraterrestrial materials are in general rare and therefore analyses are sample limited, the combined Sn and Cd isotope analyses on the same sample aliquot constitute a significant advantage. Here, the method is also used for a new accurate estimate of Sn isotope abundances.
2. Samples and analytical procedures
2.1 Samples and standard materials
Two Sn standard solutions were employed: the NIST SRM 3161a (Lot 070330) bought in 5% HNO3–1% HF and the SPEX CLSN2-2Y (Lot CL6-83SNY) in 1% HNO3–1% HF. These standards were chosen because no certified Sn isotope reference standard currently exists, and they were already used in previous studies.13,14,18 For Cd, an Alfa Aesar Cd standard in 5% HNO3 was employed and on two measurement days the NIST SRM 3108 Cd standard (Lot 060531) was analysed for comparison. A sample of a sediment core from Lake Zürich (ZH 09-05 23.3) referred to here as Lake Zürich I, as well as, the basaltic USGS standard rock (BHVO-2) and the CV3 chondrite Allende were used to test the developed separation procedure.2.2 Materials and reagents
Mineral acids of reagent grade were purified once (HF, 1TD) or twice (HCl, HNO3, 2TD) by sub-boiling distillation in Savillex™ Teflon stills. Millipore Super-Q (SQ) water with a resistivity of 18 MΩ was used for mixing reagents.2.3 Sample digestion
Powdered aliquots of Lake Zürich I and BHVO-2 in sizes of 0.1 to 1 g were digested on a hotplate using 60 ml Savillex beaker made from perfluoroalkoxy alkanes (PFA). First, the samples were digested in 1.5 ml concentrated HNO3 and 12 ml concentrated HF at 140 °C for one day. After dry down, the samples were re-dissolved in 30 ml 7 M HNO3 at 110 °C overnight and taken to dryness again. Samples with high organic contents (lake sediments) were additionally treated with 7.5 ml 10 M HCl and 2.5 ml 14 M HNO3 for 3 days at 80 °C and taken to dryness. In the final digestion step, each sample was re-dissolved in 20 ml 6 M HCl and evaporated at low temperatures (80–90 °C) to prevent the Sn loss in the form of SnCl4,14,38 which becomes volatile at 114 °C.39 An aliquot (0.1 g) of Lake Zürich I (referred to as Lake Zürich I bomb) and two 1 g powder aliquots of the CV3 carbonaceous chondrite Allende (split each over 5 vials) were digested in precleaned PFA vials in a Parr© bomb using for each vial 0.7 ml concentrated HNO3 and 3 ml concentrated HF for 4.5 days at 170 °C, followed by dry-down and dissolution with 5 ml 6 M HCl at 90–100 °C.2.4 Tin separation procedure
Tin was purified from the sample matrix using a three-stage separation procedure (Table 1). The first stage uses a modified method of Fehr et al.40 to separate Sn, Cd, and Zn from the matrix elements. For each separation, a fresh resin bed of 2 ml anion-exchange resin (AG 1-X8, 200–400 mesh) was prepared in BioRad PolyPrep® chromatography columns. Up to 0.5 g of sample was loaded on one individual column, while larger sample sizes were split over several columns. The digested sample was dissolved in 3.37 ml 3 M HCl prior to ion exchange chemistry and refluxed overnight on a hotplate. Before centrifuging, 6.73 ml SQ water was added to achieve a final concentration of 1 M HCl and the sample was refluxed for another hour. After centrifuging, precipitates, if present, were washed twice with 1 ml 1 M HCl for 30 min. This procedure was repeated twice. Small aliquots (0.1 ml) were taken before loading the solution onto the column to determine the yields of the separation procedure. After cleaning and conditioning the resin with 10 ml 1 M HNO3 and 10 ml 1 M HCl, the sample was loaded in 10 ml 1 M HCl. Following the loading, the column was rinsed with 20 ml 1 M HCl and more matrix elements (e.g. Ag) were eluted using 10 ml 6 M HCl and 2 ml 1 M HNO3. Tin was then recovered from the resin with 5 ml 1 M HNO3. To prevent Sn precipitation, 0.17 ml 4 M HF per ml solution was added to the beaker prior to the Sn collection.41 The second stage of the chromatographic procedure (Table 1) uses a modified separation method based on Eichrom TRU resin11,14,41 in conjunction with an Eichrom Pre-filter resin to remove organics eluting from the resin. Eichrom Pre-filter resin (40 μl) was filled in Teflon columns, followed by 120 μl Eichrom TRU resin. After cleaning and conditioning of the resin with 5 ml 1 M HNO3, 5 ml 0.1 M HCl–0.3 M HF (U removal from the resin) and 5 ml 1 M HCl, samples were loaded in 1 ml 1 M HCl. The resin was rinsed with 5 ml 1 M HCl to separate Sn from Cd and the remaining matrix (Zn) before eluting Sn in 3.5 ml 1 M HNO3 into PFA beakers containing 10 μl ml−1 solution 1 M HF. The matrix fraction of this separation was further cleaned for Cd isotope analysis (see Section 2.5).| Eluent | Volume (ml) | Step |
|---|---|---|
| (1) Column: 2 ml BioRad AG1-X8 anion-exchange resin (200–400 mesh) | ||
| 1 M HNO3 | 10 | Resin cleaning |
| 1 M HCl | 10 | Resin conditioning |
| 1 M HCl | 10 | Sample loading |
| 1 M HCl | 20 | Matrix elution |
| 6 M HCl | 10 | Matrix elution |
| 1 M HNO3 | 2 | Matrix elution |
| 1 M HNO3 | 5 | Sn, Cd, Zn |
|
||
| (2) Column: 40 μl Eichrom Pre-filter resin (100–150 μm) + 120 μl Eichrom TRU resin (100–150 μm) | ||
| 1 M HNO3 | 5 | Resin cleaning |
| 0.1 M HCl–0.3 M HF | 5 | Resin cleaning (U) |
| 1 M HCl | 5 | Resin conditioning |
| 1 M HCl | 1 | Sample loading |
| 1 M HCl | 5 | Cd, Zn |
| 1 M HNO3 | 3.5 | Sn |
|
||
| (3) Column: 160 μl Eichrom Pre-filter resin (100–150 μm) – organics removal | ||
| 1 M HCl | 5 | Resin cleaning |
| 0.1 M HCl–0.3 M HF | 5 | Resin cleaning (U) |
| 1 M HNO3 | 5 | Resin conditioning |
| 1 M HNO3–0.01 M HF (sample solution) | 3.5 | Sn |
| 1 M HNO3 | 1 | Sn |
The Eichrom Pre-filter resin (40 μl) used in the second stage was not sufficient to remove all organic compounds (octyl(phenyl)-N,N-diisobutylcarbamoylmethylphosphine oxide (CMPO) and tributyl phosphate (TBP)) of the TRU resin. For further organic removal, an additional column using solely Pre-filter resin was introduced (Table 1). The eluted Sn fraction of the second column was directly loaded on a Teflon column with Eichrom Pre-filter (160 μl). The resin was pre-cleaned and conditioned with 5 ml 1 M HCl, 5 ml 0.1 M HCl–0.3 M HF and 5 ml 1 M HNO3. Tin was directly collected upon loading and in an additional 1 ml 1 M HNO3.
2.5 Cadmium separation procedure
The Cd–Zn fraction from the second separation step for Sn (Table 1) was purified for Cd using a two-stage anion exchange procedure (Table 2), which is based on the method of Wombacher et al.27 It employs 2 ml anion-exchange resin (AG 1-X8, 100–200 mesh) prepared in quartz glass columns. The Cd–Zn fraction from the Sn separation was dried down and redissolved in 5 ml 6 M HCl for 30–40 minutes at 120 °C. The sample solution was diluted to 3 M HCl by adding 5 ml MQ water and further refluxed for 10–15 minutes before cooling and loading onto the cleaned and preconditioned resin. Remaining matrix elements were removed using 0.5 M HCl, 1 M HCl and 2 M HCl. The procedure of ref. 27 includes an additional elution step using 8 M HCl to specifically remove Ag from the sample. However, Ag is already separated in the first Sn ion exchange column and therefore this step was omitted here. To efficiently elute Zn from the resin, a total of 21 ml 0.5 M HNO3–0.1 M HBr mixture was used. This solution was always prepared fresh each day because HNO3 and HBr slowly react with each other over time (e.g.ref. 27). Afterwards, 2.5 ml 2 M HNO3 was added, followed by the collection of Cd in 4 ml 2 M HNO3. Another 4 ml 2 M HNO3 was used to elute the last fraction (Cd post fraction; Table 2), that was checked for its Cd content. On average, this cut contained <5% of the total eluted Cd and was therefore discarded.| Eluent | Volume (ml) | Step |
|---|---|---|
| a The Cd-containing fraction of the (2) column from the Sn separation procedure (Table 1) was dried down and dissolved in 3 M HCl as sample load. | ||
| 2 ml BioRad AG 1-X8 anion-exchange resin (100–200 mesh) | ||
| 2 M HNO3 | 10 | Resin cleaning |
| H2O | 1 | Rinse |
| 0.5 M HCl | 1 | Conditioning (conversion to Cl− form) |
| 6 M HCl | 20 | Conditioning |
| 0.5 M HCl | 11 | Conditioning |
| 3 M HCl | 10 | Sample loadinga |
| 3 M HCl | 1 | Matrix elution |
| 0.5 M HCl | 30 | Matrix elution |
| 1 M HCl | 10 | Matrix elution |
| 2 M HCl | 10 | Matrix elution |
| 0.5 M HNO3–0.1 M HBr | 1 | Elute remaining HCl |
| 0.5 M HNO3–0.1 M HBr | 20 | Zn |
| 2 M HNO3 | 2.5 | Matrix elution |
| 2 M HNO3 | 4 | Cd |
| 2 M HNO3 | 4 | Cd (post fraction) |
|
||
| 160 μl BioRad AG 1-X8 anion-exchange resin (100–200 mesh) | ||
| 2 M HNO3 | 2 | Resin cleaning |
| H2O | 0.1 | Rinse |
| 0.5 M HCl | 1 | Conditioning (conversion to Cl− form) |
| 3 M HCl | 1 | Sample loading |
| 0.5 M HCl | 0.2 | Matrix elution |
| 0.5 M HNO3–0.1 M HBr | 0.1 | Elute remaining HCl |
| 0.5 M HNO3–0.1 M HBr | 1.6 | Zn |
| 2 M HNO3 | 0.25 | Matrix elution |
| 2 M HNO3 | 0.4 | Cd |
| 2 M HNO3 | 0.4 | Cd (post fraction) |
The second separation step is a downscaled version of the first (by a factor of ∼10) using ∼160 μl anion-exchange resin (AG 1-X8, 100–200 mesh) prepared in Teflon columns (Table 2). It was specifically designed to remove remaining Zn required for samples with a 66Zn/111Cd ratio above ∼0.01. This ratio was calculated based on mass-scans performed on the Nu Plasma II MC-ICP-MS that was used for Cd isotope analysis. This ratio is the threshold determined for obtaining accurate 106Cd and 108Cd isotope data (see below) onto which Zn argides can interfere. The sample was prepared prior to loading as before, but with 0.5 ml 6 M HCl and 0.5 ml MQ water. The Cd fraction was collected in 0.4 ml 2 M HNO3. The post-Cd elution contained on average <5% of the total eluted Cd. However, on one occasion, a column processed standard contained ∼7% of the total Cd in this post-cut and was thus recombined with the main Cd fraction.
3. Mass spectrometry
3.1 Instrumentation
The samples were analysed on a Nu Plasma II MC-ICP-MS (Nu Instruments) at ETH Zürich using a DSN 100 desolvator as a sample introduction system (Table S1†). Measurements were performed in low-resolution. For Sn analyses, a wet-plasma sampler cone and a dry-plasma skimmer cone were used. For Cd, another set of dry-plasma sampler and skimmer cones were used. The nebuliser uptake rate was about 50–60 μl min−1 and prior to each analysis a peak centre routine was performed.3.2 Tin data collection and reduction
In order to analyse all ten Sn isotopes and to monitor all isobaric interferences, the measurements were performed in dynamic mode (Table 3). In the first measurement line, all Sn isotopes and 111Cd were analysed, while the second line was mainly used for correction of isobaric interferences (125Te, 126Te, 129Xe) (Table 3). One analysis consisted of 20 cycles with 10 s integration time for the first measurement line and 5 s in the second, and 3 s of magnet settle time after the magnet jumped. At the beginning of each analysis an electronic baseline was measured via electrostatic analyser deflection lasting 30 s. A 0.5 M HNO3–0.005 M HF solution was used to rinse the nebuliser for 240 s after each analysis. Interspersed between the samples, a second 0.5 M HNO3–0.005 M HF solution was analysed with the same measurement routine as the samples as background monitor. The recorded signals were used for the background correction and in particular to account for the Ar3 interference on mass 120 (Table 3). The sample measurements were bracketed to a NIST 3161a SRM Sn standard solution at concentrations within ±20% of the sample. A single measurement took about 10 minutes and used around 100–120 ng Sn. The total ion beam sensitivity ranged from 2.7 × 10⁻¹² to 4.8 × 10⁻¹² A ppb−1 using 1011 Ω resistors. Before analysis, each sample was checked for potential remaining impurities of Cd, Mo, Pd, Ru, Rh, Te, U and Zr by scanning through their mass range and comparing to a multi-element standard. All collected data were first corrected for the electronic baseline, followed by the subtraction of background measurement. The data were internally normalised to a 116Sn/120Sn ratio of 0.4460 (ref. 2) using the exponential law to correct for instrumental mass bias (in addition data was also tested for normalisations to 122Sn/118Sn = 0.19125 and 118Sn/120Sn = 0.742935 calculated based on the 116Sn/120Sn ratio of 0.4460 (ref. 2)). The normalisation ratio of 116Sn/120Sn was chosen to ease the comparison to earlier studies, which already used it. Moreover, this ratio offers a wide range of advantages such as the relatively large spread of isotope masses, the minor effects of interfering isotopes from neighbouring elements, the relatively small uncertainties of the data compared to when other ratios are employed and the use of even isotope masses only. The latter ascertains that the normalisation ratio is not affected by non-mass-dependent effects such as nuclear field shift or magnetic isotope effects.| 111Cd | 112Sn | 113Cd | 114Sn | 115Sn | 116Sn | 117Sn | 118Sn | 119Sn | 120Sn | 122Sn | 124Sn | 125Te | 126Te | 129Xe | |
|---|---|---|---|---|---|---|---|---|---|---|---|---|---|---|---|
| Collector configuration | |||||||||||||||
| Line 1 | L3 | L2 | L1 | Ax | H1 | H2 | H3 | H4 | H5 | H6 | H7 | H8 | |||
| Line 2 | L4 | L3 | L2 | L1 | H1 | H3 | H4 | H5 | H7 | ||||||
|
|||||||||||||||
| Isotope abundances of Sn and isobaric interferences | |||||||||||||||
| Cd | 12.8 | 24.1 | 12.2 | 28.7 | 7.5 | ||||||||||
| Sn | 0.97 | 0.66 | 0.34 | 14.5 | 7.7 | 24.2 | 8.6 | 32.6 | 4.6 | 5.8 | |||||
| In | 4.3 | 95.7 | |||||||||||||
| Te | 0.10 | 2.6 | 4.8 | 7.1 | 19.0 | ||||||||||
| Xe | 0.09 | 0.09 | 26.4 | ||||||||||||
|
|||||||||||||||
| Major molecular interferences | |||||||||||||||
| M1H | 110Pd (11.7) | ||||||||||||||
| 110Cd (12.5) | 111Cd (12.8) | 112Cd (24.1) | 113Cd (12.2) | 114Cd (28.7) | |||||||||||
| 115In (95.7) | |||||||||||||||
| 121Sb (57.2) | 123Sb (42.8) | ||||||||||||||
| 124Sn (5.8) | |||||||||||||||
| 128Te (31.7) | |||||||||||||||
| M14N | 97Mo (9.5) | 98Mo (24.1) | 100Mo (9.6) | ||||||||||||
| 99Ru (12.7) | 100Ru (12.6) | 101Ru (17.0) | 102Ru (31.5) | 104Ru (18.6) | |||||||||||
| 103Rh (100) | |||||||||||||||
| 104Pd (11.1) | 105Pd (22.3) | 106Pd (27.3) | 108Pd (26.4) | 110Pd (11.7) | |||||||||||
| 110Cd (12.5) | 111Cd (12.8) | 112Cd (24.0) | |||||||||||||
| 115In (95.7) | |||||||||||||||
| M16O | 95Mo (15.9) | 96Mo (16.6) | 97Mo (9.5) | 98Mo (24.1) | 100Mo (9.6) | ||||||||||
| 99Ru (12.7) | 100Ru (12.6) | 101Ru (17.0) | 102Ru (31.5) | 104Ru (18.6) | |||||||||||
| 103Rh (100) | |||||||||||||||
| 104Pd (11.1) | 106Pd (27.3) | 108Pd (26.4) | 110Pd (11.7) | ||||||||||||
| 110Cd (12.5) | 113Cd (12.2) | ||||||||||||||
| 109Ag (48.1) | |||||||||||||||
| M40Ar | 71Ga (39.7) | ||||||||||||||
| 72Ge (27.6) | 73Ge (7.7) | 74Ge (35.8) | |||||||||||||
| 76Se (9.3) | 77Se (7.6) | 78Se (23.7) | 80Se (49.4) | 82Se (8.7) | |||||||||||
| 75As (100) | |||||||||||||||
| 79Br (50.5) | |||||||||||||||
| 40Ar–40Ar–40Ar (99.6) | |||||||||||||||
| 82Kr (11.5) | 84Kr (56.8) | 86Kr (17.2) | |||||||||||||
| 85Rb (71.9) | |||||||||||||||
| 86Sr (9.8) | |||||||||||||||
| 89Y (100) | |||||||||||||||
| M++ | 232Th (100) | 238U (99.3) | |||||||||||||
Isobaric interferences (Table 3) were corrected using 111Cd, 125Te and 129Xe signals as monitors as follows. First a Cd correction was performed on 116Sn by subtracting 116Cd (using 116Cd/111Cd = 0.563754 (ref. 6)) without mass bias correction. For the mass bias correction, the corrected 116Sn signal was then used to determine the fractionation factor (β) of the exponential law:
| Rtrue = Rmeas × (m1/m2)β | (1.1) |
| εxSn = ((xSn/120Snsample/xSn/120SnNIST 3161a) − 1) × 10000 | (1.2) |
Solutions for yield and blank determination were analysed on an Element XR. The blanks from digestion and those from the chemical separation procedure were dried down and taken up in 0.5 M HNO3–0.005 M HF for analysis. To estimate the yields of the separation procedure, small aliquots (5% of sample material) of the Sn fraction collected in the first and third stage were compared to a small aliquot (1% of sample material) taken before the chromatographic procedure. These aliquots were also analysed in a 0.5 M HNO3–0.005 M HF media.
3.3 Cadmium data collection and reduction
Similar to Sn, Cd isotope analyses were performed in dynamic mode to allow measurements of all Cd isotopes and Pd, In and Sn isotopes for direct isobaric interference corrections. In the first line, all Cd isotopes, 115In and 118Sn were measured. In the second, 105Pd, 108Cd and 111Cd were collected. Each analysis comprised of 30 dynamic isotope measurements, using 10 s (first line) and 5 s (second line) integrations, and a 2 s magnet delay time. Before each measurement, an electronic baseline was measured for 30 s. After each analysis, the nebuliser was rinsed with 0.5 M HNO3 for 150 s. On-peak backgrounds were measured in 0.5 M HNO3 before and after three standard and/or sample analyses. Background corrections were applied to sample and standard measurements using the average of background analyses before and after these measurement blocks. Samples were bracketed to an Alfa Aesar Cd standard with a matching concentration to within ±20% on average. Each measurement lasted ∼12 minutes consuming between ∼120–150 ng Cd. The total ion beam intensity ranged from 1.5 × 10⁻¹² to 3.3 × 10⁻¹² A ppb−1 using 1011 Ω resistors. The column processed samples were checked for purity using 2–5% aliquots on the Nu Plasma II by scanning them for potentially interfering elements including Zn, Zr, Mo, Ge, Ru, Ga, Pd, In and Sn. These aliquots were also scanned for their Cd content, which was used to calculate the final yields following the full separation procedure by comparison with the 1% aliquot taken prior to the first Sn column chemistry (Section 2.4).After baseline and background correction, the Cd isotope data were internally normalised to a 116Cd/111Cd ratio of 0.578505 42 with the exponential law. This ratio was chosen to ascertain a large spread, which improves precision, but also to minimize the effects of interferences from neighbouring elements (i.e. Pd) and to avoid isotopes affected by neutron capture (113Cd, 114Cd) during galactic cosmic ray irradiation in space.43
Interferences from Pd, In and Sn were corrected for using a similar iterative approach as described for the Sn data reduction (see Section 3.2). Results are reported in the epsilon notation relative to 111Cd:
| εxCd = ((xCd/111Cdsample/xCd/111CdAlfa Aesar) − 1) × 10000 | (1.3) |
4. Results and discussion
4.1 Yields and blanks
The Sn yields of the first and the combined yields of the second and third column are around 90–100% and 80–100%, respectively. The yield of the total Sn separation procedure was generally >80%. The total yield for the separation of Cd was on average >70%.The total Sn procedural blank ranged typically between 1.4 and 2.2 ng for samples of 0.5–1 g. The Sn blanks of the reagents differed, concentrated HCl (twice Teflon distilled) contained 16–30 pg ml−1, while concentrated HNO3 (twice Teflon distilled) and SQ water contained less than 2 pg ml−1 Sn. The total procedural blank was therefore strongly dependent on the digestion procedure. While the complete separation procedure usually yielded a blank of 0.4 ng Sn, the digestion of the sample alone resulted in blank values from 0.27 ng per beaker in a Parr bomb digestion, up to 2 ng blank for the digestion of 0.5–1 g sample material in 60 ml vials on the hotplate. Generally, the Sn content of the analysed lake sediment and basalt aliquots was above 500 ng resulting in a blank contribution of <1%, which is therefore negligible.
The Cd blanks after the Sn column chemistry in the Cd–Zn cut were ≤14 pg, and including the subsequent Cd ion exchange chemistry ≤87 pg, on average. The sample digestion and the complete separation procedure together yielded blanks of <90 pg Cd. Considering that the Cd contents of all lake sediments and column processed standards were ∼150 ng or higher, this results in a negligible blank contribution of <0.1%.
4.2 Eluted organics from TRU resin
It has been shown that organics eluted from the TRU resin during extraction chromatography can affect the instrumental mass bias of Cd (ref. 44 and 45) and therefore compromise the quality of isotopic analysis. Several other studies also reported that these organic compounds elute from the TRU resin into sample fractions.14,46 High contents of organics, furthermore, influence the nebuliser uptake rate and the sensitivity of the instrument, and may affect the dissolution of the sample after dry-down. The Sn fractions after the second separation stage, consisting of TRU Spec resin and Pre-filter resin, contained up to 250 μg P, most likely bound to the organic extractants (CMPO and TBP) of the TRU resin, because both compounds are phosphor bound organic species. After the additional clean-up column (third stage) containing the Pre-filter resin, the phosphorous content of the Sn fractions was reduced to <20 ng. Phosphorus is efficiently separated from Cd by the employed Cd anion-exchange chemistry (Table 2). The final purified Cd solutions contained on average <12 ng P.4.3 Interferences
 | ||
| Fig. 1 Tin isotope ratios for a 100 and 200 ppb NIST SRM 3161a standard solution doped with Cd, U and Te. Data points show the average of individual analyses and the dotted line marks the tolerance level for each element. Closed symbols indicate interference corrected data, open symbols data without interference correction. Uncertainties are 2SD of repeat analyses. For three standards (Cd/Sn = 0.5 × 10⁻⁴ and 3.5 × 10⁻⁴, U/Sn = 1.5 × 10⁻⁴) only one measurement was performed and the uncertainty is the 2SD of the daily bracketing standard. The grey band represents the reproducibility (2SD) of NIST SRM 3161a at 200 ppb. (d–f) No Te correction on 120Sn. (g–i) Te correction on 120Sn. | ||
| Sample | Sn (ppb)f | Cd/Sn | Te/Sn | N | ε 112Sn | ε 114Sn | ε 115Sn | ε 117Sn | ε 118Sn | ε 119Sn | ε 122Sn | ε 124Sn | |
|---|---|---|---|---|---|---|---|---|---|---|---|---|---|
| a Indicates the number of analysed standards within one analytical session, instead of the number (N) of analytical sessions for standard solutions or individual measurements for the other samples. b Denotes ε115Sn measured relative to SPEX CLSN2-2Y and corrected for difference between SPEX CLSN2-2Y and NIST SRM 3161a. c Measured with Aridus II on a Nu Plasma II. d Uncertainty refers to 95% confidence interval t0.95,n−1 × SD/√n). e For the lake sediment, two aliquots were digested. “bomb” refers to the Parr bomb digestion, the second aliquot was digested on the hotplate. NIST: NIST SRM 3161a; SPEX: SPEX CLSN2-2Y; Lake Zürich Ix: x refers to separate column chemistry. f Sn (ppb) concentration refers to measurement solution. | |||||||||||||
| Sn standard solutions | |||||||||||||
| NIST SRM 3161a | 200 | 1.4 × 10⁻⁵ | 3.6 × 10⁻⁵ | 20 | 0.0 ± 0.9 | 0.0 ± 1.3 | 0.0 ± 1.2 | 0.00 ± 0.16 | 0.00 ± 0.11 | 0.00 ± 0.17 | 0.00 ± 0.21 | 0.00 ± 0.31 | |
| 100 | 11 | 0.0 ± 1.4 | 0.0 ± 2.3 | 0.0 ± 2.0 | 0.00 ± 0.22 | 0.00 ± 0.13 | 0.00 ± 0.21 | 0.00 ± 0.25 | 0.00 ± 0.39 | ||||
| 40 | 29a | 0.0 ± 2.6 | 0.2 ± 4.9 | 0.1 ± 5.4 | 0.00 ± 0.20 | 0.00 ± 0.21 | 0.01 ± 0.39 | 0.00 ± 0.35 | 0.01 ± 0.40 | ||||
| 25 | 25a | 0.0 ± 5.0 | 0 ± 11 | 0.1 ± 6.7 | 0.01 ± 0.50 | 0.01 ± 0.26 | 0.02 ± 0.71 | 0.00 ± 0.91 | 0.00 ± 0.75 | ||||
| 9 | 19a | −1 ± 11 | 0 ± 23 | 1 ± 21 | −0.1 ± 1.4 | 0.04 ± 0.61 | 0.1 ± 1.9 | 0.1 ± 1.9 | 0.2 ± 1.7 | ||||
| 5.5 | 21a | 0 ± 28 | 1 ± 49 | 0 ± 42 | 0.0 ± 1.6 | −0.02 ± 0.91 | 0.0 ± 1.6 | 0.0 ± 2.6 | 0.0 ± 2.5 | ||||
| SPEX CLSN2-2Y | 100 | 2.4 × 10⁻⁵ | 6.2 × 10⁻⁵ | 20a | 0.0 ± 1.2 | 0.1 ± 1.8 | 7.3 ± 2.2 | −0.05 ± 0.18 | 0.01 ± 0.11 | −0.03 ± 0.19 | −0.05 ± 0.27 | −0.13 ± 0.44 | |
|
|||||||||||||
| Column processed Sn standard solutions | |||||||||||||
| NIST + Cd | 200 | 1.6 × 10⁻⁵ | 3.3 × 10⁻⁵ | 1 | −0.4 ± 1.0 | −0.3 ± 1.7 | −0.6 ± 1.1 | 0.18 ± 0.18 | 0.01 ± 0.13 | 0.11 ± 0.18 | −0.14 ± 0.16 | −0.16 ± 0.27 | |
| NIST + Cd | 100 | 2.8 × 10⁻⁵ | 2.6 × 10⁻⁵ | 1 | 0.6 ± 1.7 | 1.3 ± 2.3 | 0.1b ± 1.7 | 0.02 ± 0.23 | 0.10 ± 0.20 | 0.04 ± 0.15 | −0.03 ± 0.14 | −0.17 ± 0.27 | |
| SPEX | 100 | 8.6 × 10⁻⁶ | 2.8 × 10⁻⁵ | 1 | −0.6 ± 1.6 | −1.6 ± 2.1 | −1.1b ± 1.5 | −0.09 ± 0.25 | −0.04 ± 0.10 | −0.15 ± 0.10 | −0.18 ± 0.27 | −0.48 ± 0.36 | |
| SPEX Ag1x8 | 100 | 7.3 × 10⁻⁶ | 1.8 × 10⁻⁵ | 1 | −0.1 ± 1.6 | −0.1 ± 2.1 | −0.5b ± 1.5 | 0.05 ± 0.25 | 0.08 ± 0.10 | 0.18 ± 0.10 | 0.00 ± 0.27 | 0.15 ± 0.36 | |
| SPEX TRU | 100 | 1.3 × 10⁻⁵ | 1.2 × 10⁻⁴ | 1 | −1.2 ± 1.6 | −1.0 ± 2.1 | −1.0b ± 1.5 | 0.08 ± 0.25 | −0.03 ± 0.10 | 0.10 ± 0.10 | −0.06 ± 0.27 | −0.09 ± 0.36 | |
|
|||||||||||||
| Allende (CV3) | |||||||||||||
| Allende bomb 1a | 200 | 4.3 × 10⁻⁵ | 3.6 × 10⁻⁵ | 1 | 0.4 ± 1.0 | 1.9 ± 1.7 | −2.8 ± 1.1 | 0.05 ± 0.18 | 0.04 ± 0.13 | 0.10 ± 0.18 | −0.07 ± 0.16 | −0.13 ± 0.27 | |
| Allende bomb 1a | 200 | 4.4 × 10⁻⁵ | 6.8 × 10⁻⁵ | 1 | 0.27 ± 0.83 | 0.9 ± 1.1 | −2.6 ± 1.1 | 0.16 ± 0.23 | 0.10 ± 0.12 | 0.04 ± 0.21 | 0.02 ± 0.24 | −0.06 ± 0.41 | |
| Allende bomb 1b | 200 | 1.2 × 10⁻⁴ | 3.3 × 10⁻⁵ | 1 | −0.11 ± 0.92 | 1.9 ± 1.4 | −0.09 ± 0.94 | 0.08 ± 0.22 | 0.02 ± 0.11 | 0.09 ± 0.14 | 0.17 ± 0.24 | 0.03 ± 0.24 | |
| Allende bomb 1b | 200 | 2.3 × 10⁻⁵ | 5.1 × 10⁻⁵ | 1 | 0.33 ± 0.57 | −0.13 ± 0.82 | −2.38 ± 0.81 | 0.20 ± 0.12 | −0.03 ± 0.10 | 0.00 ± 0.15 | −0.23 ± 0.19 | −0.21 ± 0.23 | |
| With additional Pre-filter clean up | |||||||||||||
| Allende bomb 2a | 200 | 5.8 × 10⁻⁵ | 4.0 × 10⁻⁵ | 1 | −0.17 ± 0.84 | 0.90 ± 1.15 | −2.5 ± 1.4 | 0.07 ± 0.16 | 0.10 ± 0.12 | 0.12 ± 0.16 | −0.02 ± 0.20 | 0.00 ± 0.38 | |
| Allende bomb 2b | 200 | 4.5 × 10⁻⁵ | 4.5 × 10⁻⁵ | 1 | −0.26 ± 0.84 | 0.64 ± 0.93 | −2.20 ± 0.92 | 0.21 ± 0.12 | 0.10 ± 0.08 | 0.17 ± 0.23 | 0.09 ± 0.12 | −0.14 ± 0.25 | |
| Allende bomb 2a + 2bc | 200 | 4.9 × 10⁻⁵ | 3.0 × 10⁻⁵ | 1 | −0.9 ± 1.1 | −0.22 ± 1.62 | −0.3b ± 1.7 | 0.26 ± 0.18 | 0.03 ± 0.10 | 0.07 ± 0.21 | −0.04 ± 0.25 | −0.16 ± 0.37 | |
| Allende bomb 1 mean | 200 | 4 | 0.23 ± 0.46 | 1.1 ± 2.0 | −2.0 ± 2.5 | 0.12 ± 0.14 | 0.03 ± 0.11 | 0.06 ± 0.09 | −0.03 ± 0.34 | −0.09 ± 0.21 | |||
| 4d | 0.23 ± 0.36 | 1.1 ± 1.6 | −2.0 ± 2.0 | 0.12 ± 0.11 | 0.03 ± 0.09 | 0.06 ± 0.08 | −0.03 ± 0.27 | −0.09 ± 0.16 | |||||
| Allende bomb 2 mean | 200 | 3 | −0.44 ± 0.85 | 0.4 ± 1.3 | −1.7 ± 2.4 | 0.18 ± 0.19 | 0.07 ± 0.11 | 0.12 ± 0.17 | 0.01 ± 0.21 | −0.10 ± 0.31 | |||
|
|||||||||||||
| Basalts | |||||||||||||
| BHVO-2 1a | 100 | 1.2 × 10⁻⁵ | 3.0 × 10⁻⁵ | 1 | −1.1 ± 1.7 | −2.4 ± 2.3 | 0.3b ± 1.7 | −0.08 ± 0.23 | −0.17 ± 0.20 | 0.13 ± 0.15 | 0.20 ± 0.14 | 0.06 ± 0.27 | |
| BHVO-2 1b | 100 | 2.3 × 10⁻⁵ | 2.7 × 10⁻⁵ | 1 | 0.4 ± 1.7 | 1.9 ± 2.3 | −0.2b ± 1.7 | 0.08 ± 0.23 | −0.03 ± 0.20 | −0.01 ± 0.15 | 0.10 ± 0.14 | 0.08 ± 0.27 | |
| BHVO-2 2 | 100 | 1.4 × 10⁻⁵ | 3.2 × 10⁻⁵ | 1 | −0.3 ± 1.7 | −1.0 ± 2.3 | 0.3b ± 1.7 | −0.06 ± 0.23 | −0.14 ± 0.20 | 0.03 ± 0.15 | 0.07 ± 0.14 | 0.16 ± 0.27 | |
|
|||||||||||||
| Lake sediment | |||||||||||||
| Lake Zürich Ia | 200 | 3.5 × 10⁻⁵ | 3.6 × 10⁻⁵ | 1 | 1.1 ± 1.0 | 1.3 ± 1.7 | −1.5 ± 1.1 | 0.13 ± 0.18 | 0.03 ± 0.13 | −0.04 ± 0.18 | −0.16 ± 0.16 | −0.17 ± 0.27 | |
| Lake Zürich Ia | 200 | 3.3 × 10⁻⁵ | 2.8 × 10⁻⁵ | 1 | −0.45 ± 0.92 | 0.6 ± 1.4 | −1.86 ± 0.94 | −0.10 ± 0.22 | −0.09 ± 0.11 | 0.20 ± 0.14 | 0.24 ± 0.24 | −0.07 ± 0.24 | |
| Lake Zürich Ib | 200 | 1.5 × 10⁻⁵ | 3.2 × 10⁻⁵ | 1 | 0.1 ± 1.0 | 0.0 ± 1.7 | −1.7 ± 1.1 | 0.09 ± 0.18 | 0.04 ± 0.13 | 0.02 ± 0.18 | 0.00 ± 0.16 | −0.05 ± 0.27 | |
| Lake Zürich Ib | 200 | 1.3 × 10⁻⁵ | 3.0 × 10⁻⁵ | 1 | −0.31 ± 0.92 | −1.1 ± 1.4 | −1.96 ± 0.94 | −0.10 ± 0.22 | −0.08 ± 0.11 | 0.06 ± 0.14 | −0.06 ± 0.24 | 0.05 ± 0.24 | |
| Lake Zürich Ib | 200 | 1.5 × 10⁻⁵ | 4.0 × 10⁻⁵ | 1 | 0.0 ± 1.2 | 0.4 ± 2.0 | −2.0 ± 1.4 | 0.13 ± 0.19 | 0.08 ± 0.12 | −0.16 ± 0.11 | −0.08 ± 0.21 | −0.14 ± 0.29 | |
| Lake Zürich Ic | 200 | 1.8 × 10⁻⁵ | 2.8 × 10⁻⁵ | 1 | 0.09 ± 0.92 | 0.8 ± 1.4 | −1.64 ± 0.94 | 0.05 ± 0.22 | 0.15 ± 0.11 | 0.01 ± 0.14 | −0.16 ± 0.24 | −0.33 ± 0.24 | |
| Lake Zürich Ic | 200 | 2.2 × 10⁻⁵ | 2.8 × 10⁻⁵ | 1 | −0.68 ± 0.92 | −0.5 ± 1.4 | −1.86 ± 0.94 | −0.18 ± 0.22 | −0.02 ± 0.11 | 0.01 ± 0.14 | −0.17 ± 0.24 | −0.21 ± 0.24 | |
| Lake Zürich Ic | 200 | 8.8 × 10⁻⁶ | 4.0 × 10⁻⁵ | 1 | 0.3 ± 1.2 | −0.7 ± 2.0 | −2.7 ± 1.4 | 0.04 ± 0.19 | 0.03 ± 0.12 | −0.06 ± 0.11 | −0.02 ± 0.21 | −0.10 ± 0.29 | |
| With additional Pre-filter clean up | |||||||||||||
| Lake Zürich Id | 200 | 8.0 × 10⁻⁵ | 3.4 × 10⁻⁵ | 1 | −0.25 ± 0.94 | −0.5 ± 1.4 | −0.9 ± 1.1 | −0.10 ± 0.12 | 0.03 ± 0.11 | −0.11 ± 0.17 | −0.07 ± 0.22 | −0.16 ± 0.38 | |
| Lake Zürich Ie | 200 | 5.1 × 10⁻⁵ | 3.3 × 10⁻⁵ | 1 | −0.8 ± 1.1 | −0.3 ± 1.6 | 0.0 ± 1.7 | −0.10 ± 0.18 | 0.02 ± 0.10 | −0.10 ± 0.21 | −0.03 ± 0.25 | −0.10 ± 0.37 | |
| Lake Zürich I bomb a | 200 | 1.1 × 10⁻⁴ | 3.7 × 10⁻⁵ | 1 | 0.14 ± 0.84 | 1.4 ± 1.2 | −0.5 ± 1.4 | −0.13 ± 0.16 | −0.01 ± 0.12 | −0.03 ± 0.16 | −0.01 ± 0.20 | −0.03 ± 0.38 | |
| Lake Zürich I bomb b | 200 | 2.9 × 10⁻⁵ | 3.3 × 10⁻⁵ | 1 | 0.24 ± 0.94 | 0.2 ± 1.4 | −0.6 ± 1.1 | 0.00 ± 0.12 | 0.11 ± 0.11 | −0.21 ± 0.17 | −0.14 ± 0.22 | −0.19 ± 0.38 | |
| Lake Zürich I bomb b | 200 | 2.4 × 10⁻⁵ | 2.8 × 10⁻⁵ | 1 | −0.6 ± 1.1 | 0.5 ± 1.6 | −0.9 ± 1.7 | −0.12 ± 0.18 | −0.01 ± 0.10 | 0.03 ± 0.21 | 0.06 ± 0.25 | 0.10 ± 0.37 | |
| Lake Zürich I bomb c | 200 | 8.1 × 10⁻⁵ | 3.7 × 10⁻⁵ | 1 | 0.38 ± 0.78 | 1.20 ± 0.97 | −0.6 ± 1.0 | −0.08 ± 0.14 | −0.04 ± 0.10 | −0.18 ± 0.16 | −0.13 ± 0.18 | −0.20 ± 0.21 | |
| Lake Zürich I bomb c | 200 | 8.1 × 10⁻⁵ | 2.2 × 10⁻⁵ | 1 | −0.59 ± 0.73 | −0.56 ± 0.97 | −0.3 ± 1.2 | −0.01 ± 0.12 | −0.07 ± 0.11 | −0.02 ± 0.14 | 0.11 ± 0.20 | 0.03 ± 0.27 | |
| Lake Zürich I bomb c | 200 | 8.5 × 10⁻⁵ | 1.5 × 10⁻⁵ | 1 | −0.80 ± 0.91 | −0.8 ± 1.3 | −0.4 ± 1.4 | 0.06 ± 0.18 | −0.04 ± 0.13 | −0.22 ± 0.16 | −0.22 ± 0.22 | −0.33 ± 0.35 | |
| Lake Zürich I bomb c | 200 | 8.4 × 10⁻⁵ | 1.5 × 10⁻⁵ | 1 | 0.38 ± 0.91 | 1.1 ± 1.3 | 0.1 ± 1.4 | 0.07 ± 0.18 | 0.07 ± 0.13 | −0.10 ± 0.16 | 0.01 ± 0.22 | −0.12 ± 0.35 | |
| Lake Zürich I bomb cc | 200 | 8.4 × 10⁻⁵ | 2.7 × 10⁻⁵ | 1 | −1.2 ± 1.1 | 0.4 ± 1.6 | −1.9b ± 1.7 | −0.19 ± 0.18 | −0.04 ± 0.10 | −0.07 ± 0.21 | −0.07 ± 0.25 | 0.00 ± 0.37 | |
| Lake Zürich I bomb c | 200 | 9.4 × 10⁻⁵ | 2.7 × 10⁻⁵ | 1 | 0.29 ± 0.91 | 1.5 ± 1.3 | −0.7 ± 1.4 | −0.16 ± 0.18 | −0.01 ± 0.13 | 0.00 ± 0.16 | 0.09 ± 0.22 | −0.04 ± 0.35 | |
| Lake Zürich I bomb c | 200 | 8.1 × 10⁻⁵ | 2.7 × 10⁻⁵ | 1 | 0.2 ± 1.1 | 1.5 ± 1.2 | −0.9 ± 1.0 | −0.07 ± 0.12 | −0.07 ± 0.07 | −0.09 ± 0.11 | −0.05 ± 0.19 | 0.06 ± 0.25 | |
| Measured with Aridus II on NU3 | |||||||||||||
| Lake Zürich Ib | 100 | 2.8 × 10⁻⁵ | 3.9 × 10⁻⁵ | 1 | 0.1 ± 1.3 | 0.7 ± 2.7 | −1.0 ± 2.0 | −0.13 ± 0.14 | 0.04 ± 0.16 | −0.05 ± 0.21 | −0.15 ± 0.22 | −0.31 ± 0.33 | |
| Lake Zürich Id | 100 | 2.3 × 10⁻⁵ | 2.3 × 10⁻⁵ | 1 | 0.0 ± 1.2 | 0.3 ± 2.9 | −2.1 ± 1.7 | −0.07 ± 0.13 | −0.07 ± 0.09 | −0.18 ± 0.22 | −0.01 ± 0.25 | 0.07 ± 0.53 | |
| Lake Zürich Ie | 100 | 6.5 × 10⁻⁵ | 2.2 × 10⁻⁵ | 1 | −0.2 ± 1.2 | 0.4 ± 2.3 | 0.3 ± 2.7 | 0.01 ± 0.27 | 0.00 ± 0.18 | −0.14 ± 0.27 | 0.09 ± 0.31 | −0.18 ± 0.57 | |
| Lake Zürich I bomb b | 100 | 3.2 × 10⁻⁵ | 1.8 × 10⁻⁵ | 1 | 0.0 ± 1.2 | 0.4 ± 2.9 | −0.8 ± 1.7 | −0.02 ± 0.13 | −0.06 ± 0.09 | −0.33 ± 0.22 | 0.15 ± 0.25 | 0.00 ± 0.53 | |
| Lake Zürich I bomb c | 40 | 8.0 × 10⁻⁵ | 1.3 × 10⁻⁵ | 1 | −3.3 ± 2.6 | −3.9 ± 4.9 | 3.2 ± 5.4 | −0.13 ± 0.20 | 0.12 ± 0.21 | −0.17 ± 0.39 | 0.15 ± 0.34 | −0.14 ± 0.40 | |
| Lake Zürich I bomb c | 9 | 1.0 × 10⁻⁴ | −5.7 × 10⁻⁵ | 1 | −1 ± 11 | −10 ± 23 | −7 ± 21 | 0.8 ± 1.4 | 0.16 ± 0.61 | −0.8 ± 1.9 | −1.1 ± 1.9 | −0.3 ± 1.7 | |
| Lake Zürich I bomb c | 5.5 | −3.8 × 10⁻⁵ | 1.9 × 10⁻⁴ | 1 | 0 ± 28 | 25 ± 49 | 3 ± 42 | −0.4 ± 1.6 | 0.13 ± 0.91 | −0.5 ± 1.6 | −0.7 ± 2.6 | −1.4 ± 2.5 | |
| Lake Zürich I mean | 200 | 20 | −0.1 ± 1.1 | 0.3 ± 1.7 | −1.1 ± 1.6 | −0.04 ± 0.21 | 0.00 ± 0.13 | −0.05 ± 0.20 | −0.04 ± 0.22 | −0.10 ± 0.24 | |||
| 100 | 4 | 0.0 ± 0.2 | 0.4 ± 0.3 | −0.9 ± 2.0 | −0.05 ± 0.12 | −0.02 ± 0.10 | −0.18 ± 0.23 | 0.02 ± 0.27 | −0.11 ± 0.35 | ||||
| 40 | 1 | −3.3 ± 2.6 | −3.9 ± 4.9 | 3.2 ± 5.4 | −0.13 ± 0.20 | 0.12 ± 0.21 | −0.17 ± 0.39 | 0.15 ± 0.34 | −0.14 ± 0.40 | ||||
| 9 | 1 | −1 ± 11 | −10 ± 23 | −7 ± 21 | 0.8 ± 1.4 | 0.16 ± 0.61 | −0.8 ± 1.9 | −1.1 ± 1.9 | −0.3 ± 1.7 | ||||
| 5.5 | 1 | 0 ± 28 | 25 ± 49 | 3 ± 42 | −0.4 ± 1.6 | 0.13 ± 0.91 | −0.5 ± 1.6 | −0.7 ± 2.6 | −1.4 ± 2.5 | ||||
Because of the high abundances of 120Sn, 122Sn and 124Sn, the Te interference correction can tolerate larger amounts of Te compared to Cd or In. Without Te correction on the denominator isotope 120Sn, Te/Sn ratios of up to 3 × 10⁻³ can be tolerated (Fig. 1d–f). If an additional Te interference correction on 120Sn is applied, a Te/Sn ratio of up to 1.2 × 10⁻² still yields accurate Sn isotope results (Fig. 1g–i). The Te/Sn ratios of the analysed samples after the chemical separation procedure were generally below 8.0 × 10⁻⁵. The Te interferences were monitored using 125Te and 126Te and the results after interference correction with each isotope were compared. Our data show that interference correction using 125Te results in a slightly better reproducibility, because 126Te needs an additional correction for 126Xe and this increases the uncertainty of the correction (Table S2†). A proportionally higher background was observed for 125Te compared to 126Te, and this elevated 125Te background correlated with the signal intensity of Sn. This increased background signal was likely caused by 124Sn-hydrides. Therefore, the correction with 125Te results in slightly lower 122Sn/120Sn and 124Sn/120Sn ratios when compared to the 126Te corrected data (Table S2†). However, this difference is smaller than the uncertainties of the analyses.
Uranium (238U) can interfere on 119Sn as double-charged ions. Tests show that the production rate of U++ is ca. 4% and that U/Sn ratios of up to 5 × 10⁻⁵ leave the results unaffected (Fig. 1c). This demonstrates that relatively small blank amounts of U can already affect the data and thus U requires a clean separation from the Sn fraction. The U content of samples after our chemical separation procedure were generally below this threshold.
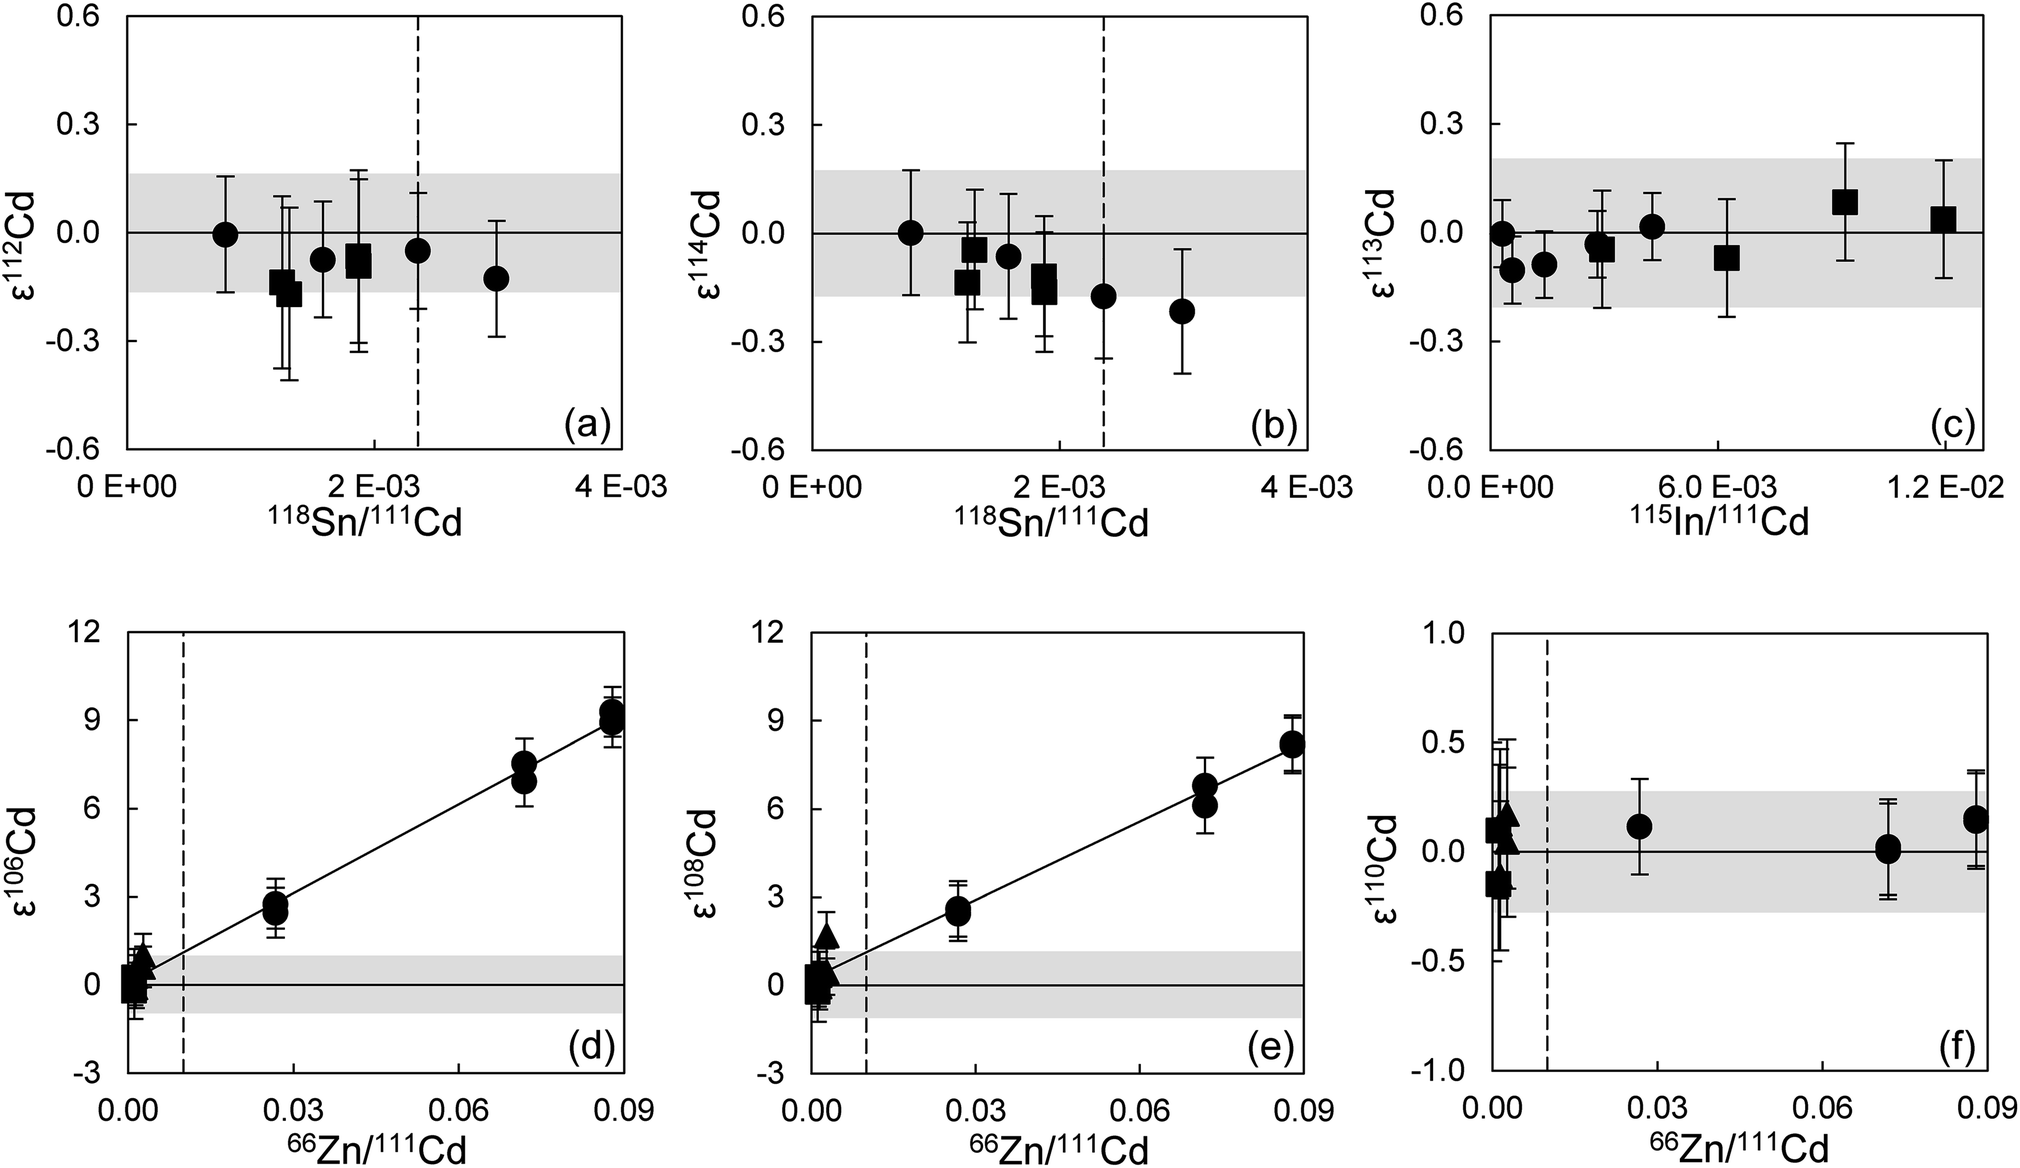
The limits for adequate and reliable isobaric interference corrections for Cd isotope analyses were also assessed. To this end, the 200 ppb Alfa Aesar Cd standard solution was doped with different amounts of Sn (0.050–0.200 ppb), In (0.005–0.200 ppb) and Pd (0.005–0.075 ppb) (Fig. 2 and ESI Fig. S2†). The tolerance levels were defined as the relative signal ratios of the isotopes used for interference correction (118Sn, 115In and 105Pd) against 111Cd. This allows a direct comparison with samples scanned for purity before analysis. Standards with a 105Pd/111Cd ratio of up to ∼5.5 × 10⁻⁴ (0.075 ppb Pd, Pd/Cd = 3.8 × 10⁻⁴) and a 115In/111Cd ratio of up to ∼1.2 × 10⁻² (0.200 ppb In, In/Cd = 1.0 × 10⁻³) can still be accurately corrected for (Fig. S2a–c† and 2c). For Sn, the tolerance threshold was determined at 118Sn/111Cd of ∼2.4 × 10⁻³ (0.150 ppb Sn, Sn/Cd = 7.5 × 10⁻⁴) (Fig. 2a and b). Column processed standards and samples in general yielded ratios below these limits (Table S3†).
 | ||
| Fig. 2 Cadmium isotope ratios measured for a 200 ppb Alfa Aesar Cd standard solution doped with Sn (a, b), In (c) and Zn (d–f) after interference correction. Symbols represent different measurement sessions, with each data point showing the result of one analysis and the dotted vertical lines the derived tolerance thresholds. The grey bands show the average daily reproducibility of the 200 ppb Alfa Aesar Cd standard solution (2SD). The individual error bars denote the reproducibility (2SD) of the bracketing standard on the day of measurement. The 118Sn/111Cd and the 115In/111Cd values were determined from the measured signal intensities of these isotopes during analysis. The 66Zn/111Cd ratios were obtained from mass-scans performed prior to analysis. | ||
For Cd analyses, major molecular interferences originate from Zn, Zr and Mo, that in particular influence the two least abundant Cd isotopes, 106Cd and 108Cd.27 Standard solutions doped with up to 0.400 ppb Mo (Mo/Cd = 2 × 10⁻³, 95Mo/111Cd ∼ 1.3 × 10⁻³ from mass-scans) and 0.030 ppb Zr (Zr/Cd = 1.5 × 10⁻⁴, 90Zr/111Cd ∼ 3.0 × 10⁻⁴) yield accurate Cd isotope data and thus these levels can be tolerated in the final sample solutions (ESI Fig. S2d–f†). For Zn, a tolerance threshold on 66Zn/111Cd of ∼1 × 10⁻² was estimated (∼1 ppb Zn, Zn/Cd ∼ 5 × 10⁻³) (Fig. 2d–f). These limits were in general achieved for Cd–Zn standards and samples passed through both Cd ion exchange columns (Table S3†). However, the Zn blank of sample solutions often increased following dry-down and redissolution to levels above this tolerance threshold, as can be observed for samples where repeat analyses were possible (Cd Std 1 and Lake Zürich If, Table S3†). This issue was noted early during establishing our method and was combatted by adopting a more thorough cleaning regime of the pipette tips and vials used, and by working with PE gloves instead of vinyl. This ensured that Zn levels remained low. This is reflected by the last two measurements of Cd Std 1 that already show a much more constant Zn/Cd ratio than before, and also from the low Zn/Cd ratio of later processed standards and samples.
4.4 Precision and accuracy of the solution standards and the determination of Sn isotope abundances
| Ratio | ETHa (200 ppb) | ETHa (100 ppb) | Lee and Halliday (1995) | Rosman et al. (1984) | Devillers et al. (1983)c | ||||||||||
|---|---|---|---|---|---|---|---|---|---|---|---|---|---|---|---|
| NIST 3161a | SPEX1 | Johnson Matthey AAS standard solution | Johnson Matthey Sn oxide and metalb | VENTRON metallic wire, Alfa Products | |||||||||||
| Mean | 2SD | 2SD (ppm) | Mean | 2SD | 2SD (ppm) | Mean | 2SD | 2SD (ppm) | Mean | 2SD | 2SD (ppm) | Mean | 2SD | 2SD (ppm) | |
| a External reproducibility (n sessions). b “Specpure” tin oxide (JMC 530 laboratory S8346) and tin metal (JM 540 laboratory S2807). c Absolute ratios determined using a 116Sn–122Sn double spike. | |||||||||||||||
| 112Sn/120Sn | 0.029823 | 0.000004 | 149 | 0.029826 | 0.000008 | 266 | 0.029812 | 0.000004 | 134 | 0.029860 | 0.000050 | 1674 | 0.029840 | 0.000100 | 3351 |
| 114Sn/120Sn | 0.020190 | 0.000004 | 206 | 0.020194 | 0.000007 | 346 | 0.020195 | 0.000014 | 693 | 0.020220 | 0.000050 | 2473 | 0.020000 | 0.000100 | 5000 |
| 115Sn/120Sn | 0.010361 | 0.000002 | 193 | 0.010369 | 0.000002 | 228 | 0.010366 | 0.000007 | 675 | 0.010390 | 0.000040 | 3850 | 0.011000 | 0.000100 | 9091 |
| 116Sn/120Sn | 0.446000 | 0.446000 | 0.446000 | 0.446000 | 0.446000 | 0.001100 | 2466 | ||||||||
| 117Sn/120Sn | 0.235320 | 0.000028 | 119 | 0.235302 | 0.000023 | 100 | 0.235313 | 0.000048 | 204 | 0.235380 | 0.000080 | 340 | 0.235500 | 0.000700 | 2972 |
| 118Sn/120Sn | 0.742945 | 0.000029 | 39 | 0.742929 | 0.000024 | 32 | 0.742935 | 0.000076 | 102 | 0.742950 | 0.000200 | 269 | 0.743200 | 0.001100 | 1480 |
| 119Sn/120Sn | 0.263479 | 0.000032 | 121 | 0.263447 | 0.000027 | 103 | 0.263430 | 0.000046 | 175 | 0.263450 | 0.000130 | 493 | 0.263400 | 0.000400 | 1519 |
| 122Sn/120Sn | 0.142095 | 0.000011 | 80 | 0.142081 | 0.000007 | 48 | 0.142086 | 0.000013 | 91 | 0.142110 | 0.000070 | 493 | 0.142010 | 0.000280 | 1972 |
| 124Sn/120Sn | 0.177583 | 0.000035 | 197 | 0.177549 | 0.000027 | 152 | 0.177588 | 0.000052 | 293 | 0.177530 | 0.000100 | 563 | 0.177600 | 0.000550 | 3097 |
| n | 17 | 7 | |||||||||||||
The associated uncertainties on the ratios are generally more precise than in previous studies. Nevertheless, the ratios 117Sn/120Sn, 118Sn/120Sn and 119Sn/120Sn are affected by drifting (long-term and during a session) (Fig. 3). Therefore, for sample analyses, the measurements were bracketed with NIST SRM 3161a to correct for these drifts. The reason for the long-term drifts is unclear. It could indicate that the Faraday cups do not behave completely linear due to differences in cup efficiencies, however, the relatively prominent drifts on the odd/even isotope ratios 117Sn/120Sn and 119Sn/120Sn may also suggest nuclear field shift effect48 or the magnetic isotope effect49 as a potential source (Fig. 3). The typical reproducibility (2SD) of the NIST SRM 3161 200 ppb solution (drift corrected) within a single session was 0.9 for ε112Sn, 1.3 for ε114Sn, 1.2 for ε115Sn, 0.16 for ε117Sn, 0.11 for ε118Sn, 0.17 for ε119Sn, 0.21 for ε122Sn and 0.31 for ε124Sn.
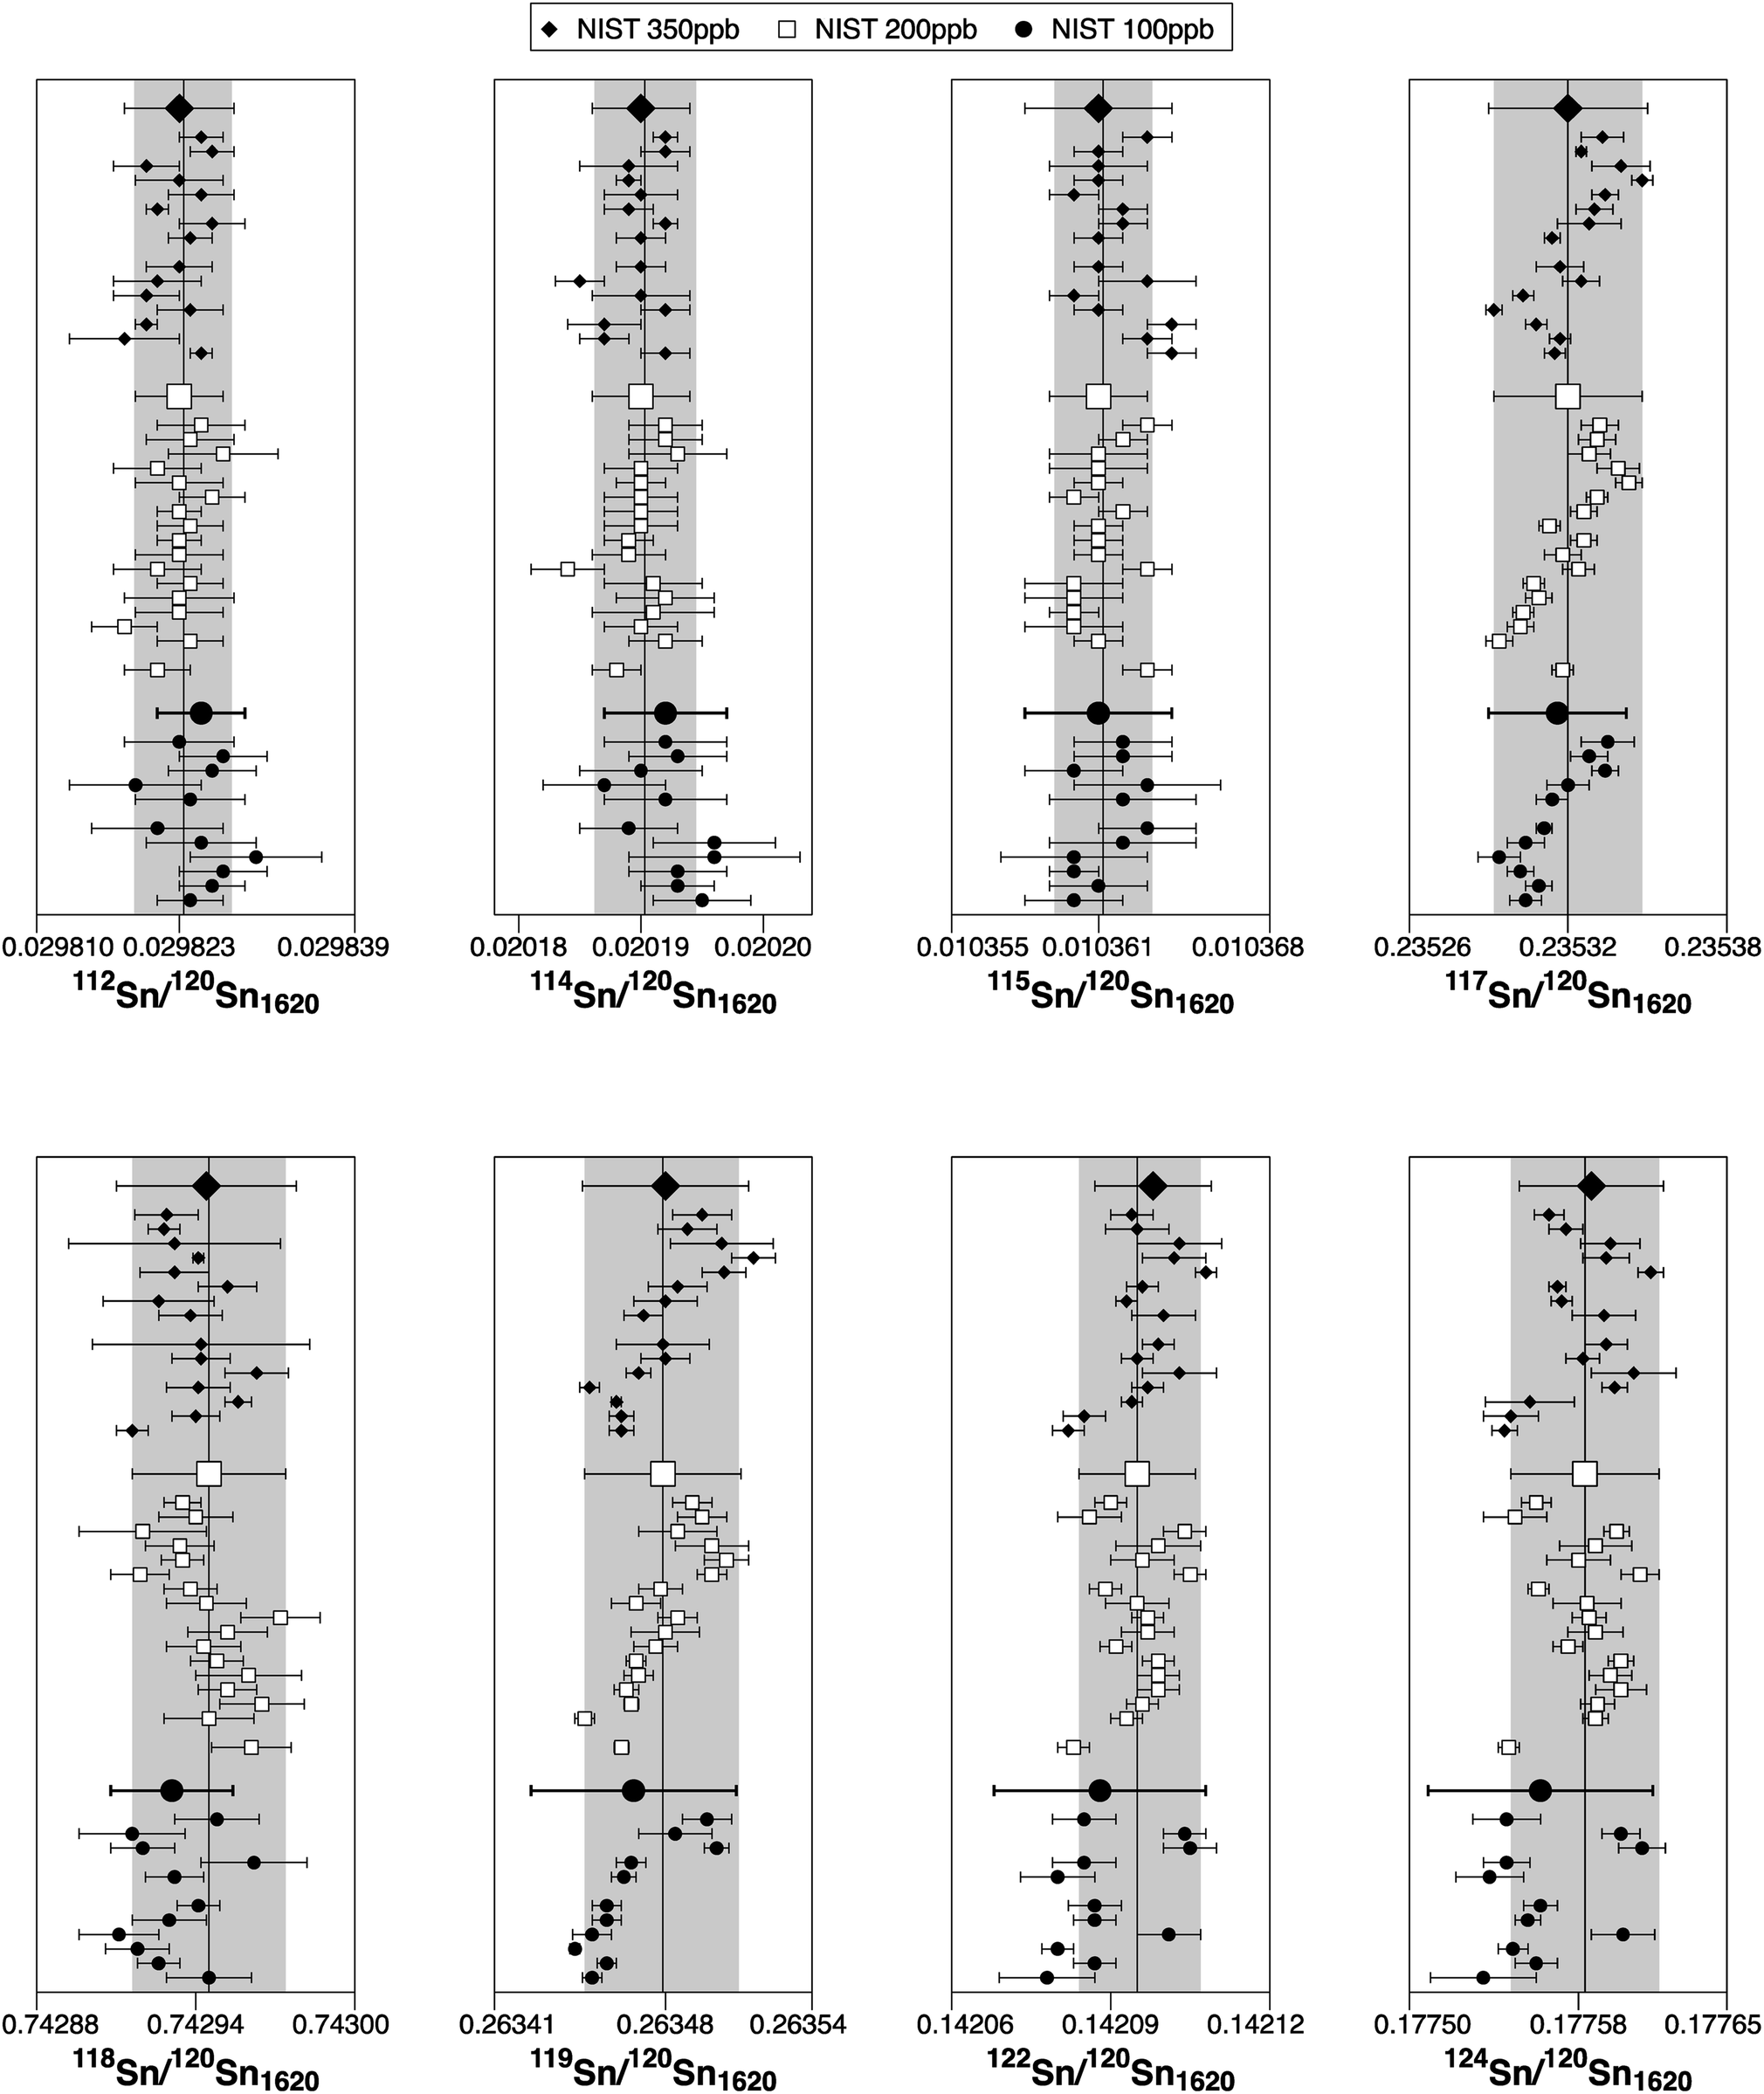 | ||
| Fig. 3 Tin isotope ratios of NIST SRM 3161a at concentrations of 100 ppb, 200 ppb and 350 ppb over a period of 15 months. Each data point and associated 2SD represents the average of an individual analytical session, while the grey band indicates the typical reproducibility (2SD) of NIST SRM 3161a at 200 ppb within a single session. Subscript 1620 refers to the 116Sn/120Sn ratio that was employed for instrumental mass bias corrections. | ||
Based on the long-term average for a 200 ppb NIST SRM 3161a Sn solution (Table 5), new Sn isotope abundances were calculated. The new Sn isotope abundances are more precise and in good agreement with the previous recommendation of IUPAC 2001 (ref. 50) (Table 6).
| ETHb | 2SD | Böhlke (2005)c | |
|---|---|---|---|
| a The 2SD uncertainties in parenthesis refer to last digits. b Abundances and associated uncertainties were calculated based on data for NIST SRM 3161a 200 ppb (Table 5). c Representative Sn isotope composition from Böhlke.50 | |||
| 112 | 0.0097220 | (15) | 0.0097(1) |
| 114 | 0.0065822 | (14) | 0.0066(1) |
| 115 | 0.0033775 | (7) | 0.0034(1) |
| 116 | 0.1453838 | (45) | 0.1454(9) |
| 117 | 0.0767065 | (94) | 0.0768(7) |
| 118 | 0.242175 | (12) | 0.2422(9) |
| 119 | 0.085883 | (11) | 0.0859(4) |
| 120 | 0.325973 | (23) | 0.3258(9) |
| 122 | 0.0463168 | (40) | 0.0463(3) |
| 124 | 0.057880 | (12) | 0.0579(5) |
4.5 Precision and accuracy of the sample measurements
 | ||
| Fig. 4 The Sn isotope composition for repeated analyses of eight independently processed aliquots of a lake sediment (Lake Zürich I). The shaded area represents the typical reproducibility (2SD) of NIST SRM 3161a 200 ppb within a single session, while the individual error bars represent the analytical precision of the NIST bracketing standard during the measurement session. Black symbols – no additional Pre-filter stage, open symbols – additional Pre-filter stage. Half-filled symbol – average of all the single analysis, uncertainty – 2SD. | ||
 | ||
| Fig. 5 The Sn isotope composition for repeated analyses of two independently digested aliquots of Allende. Symbols and uncertainties are the same as in Fig. 4. | ||
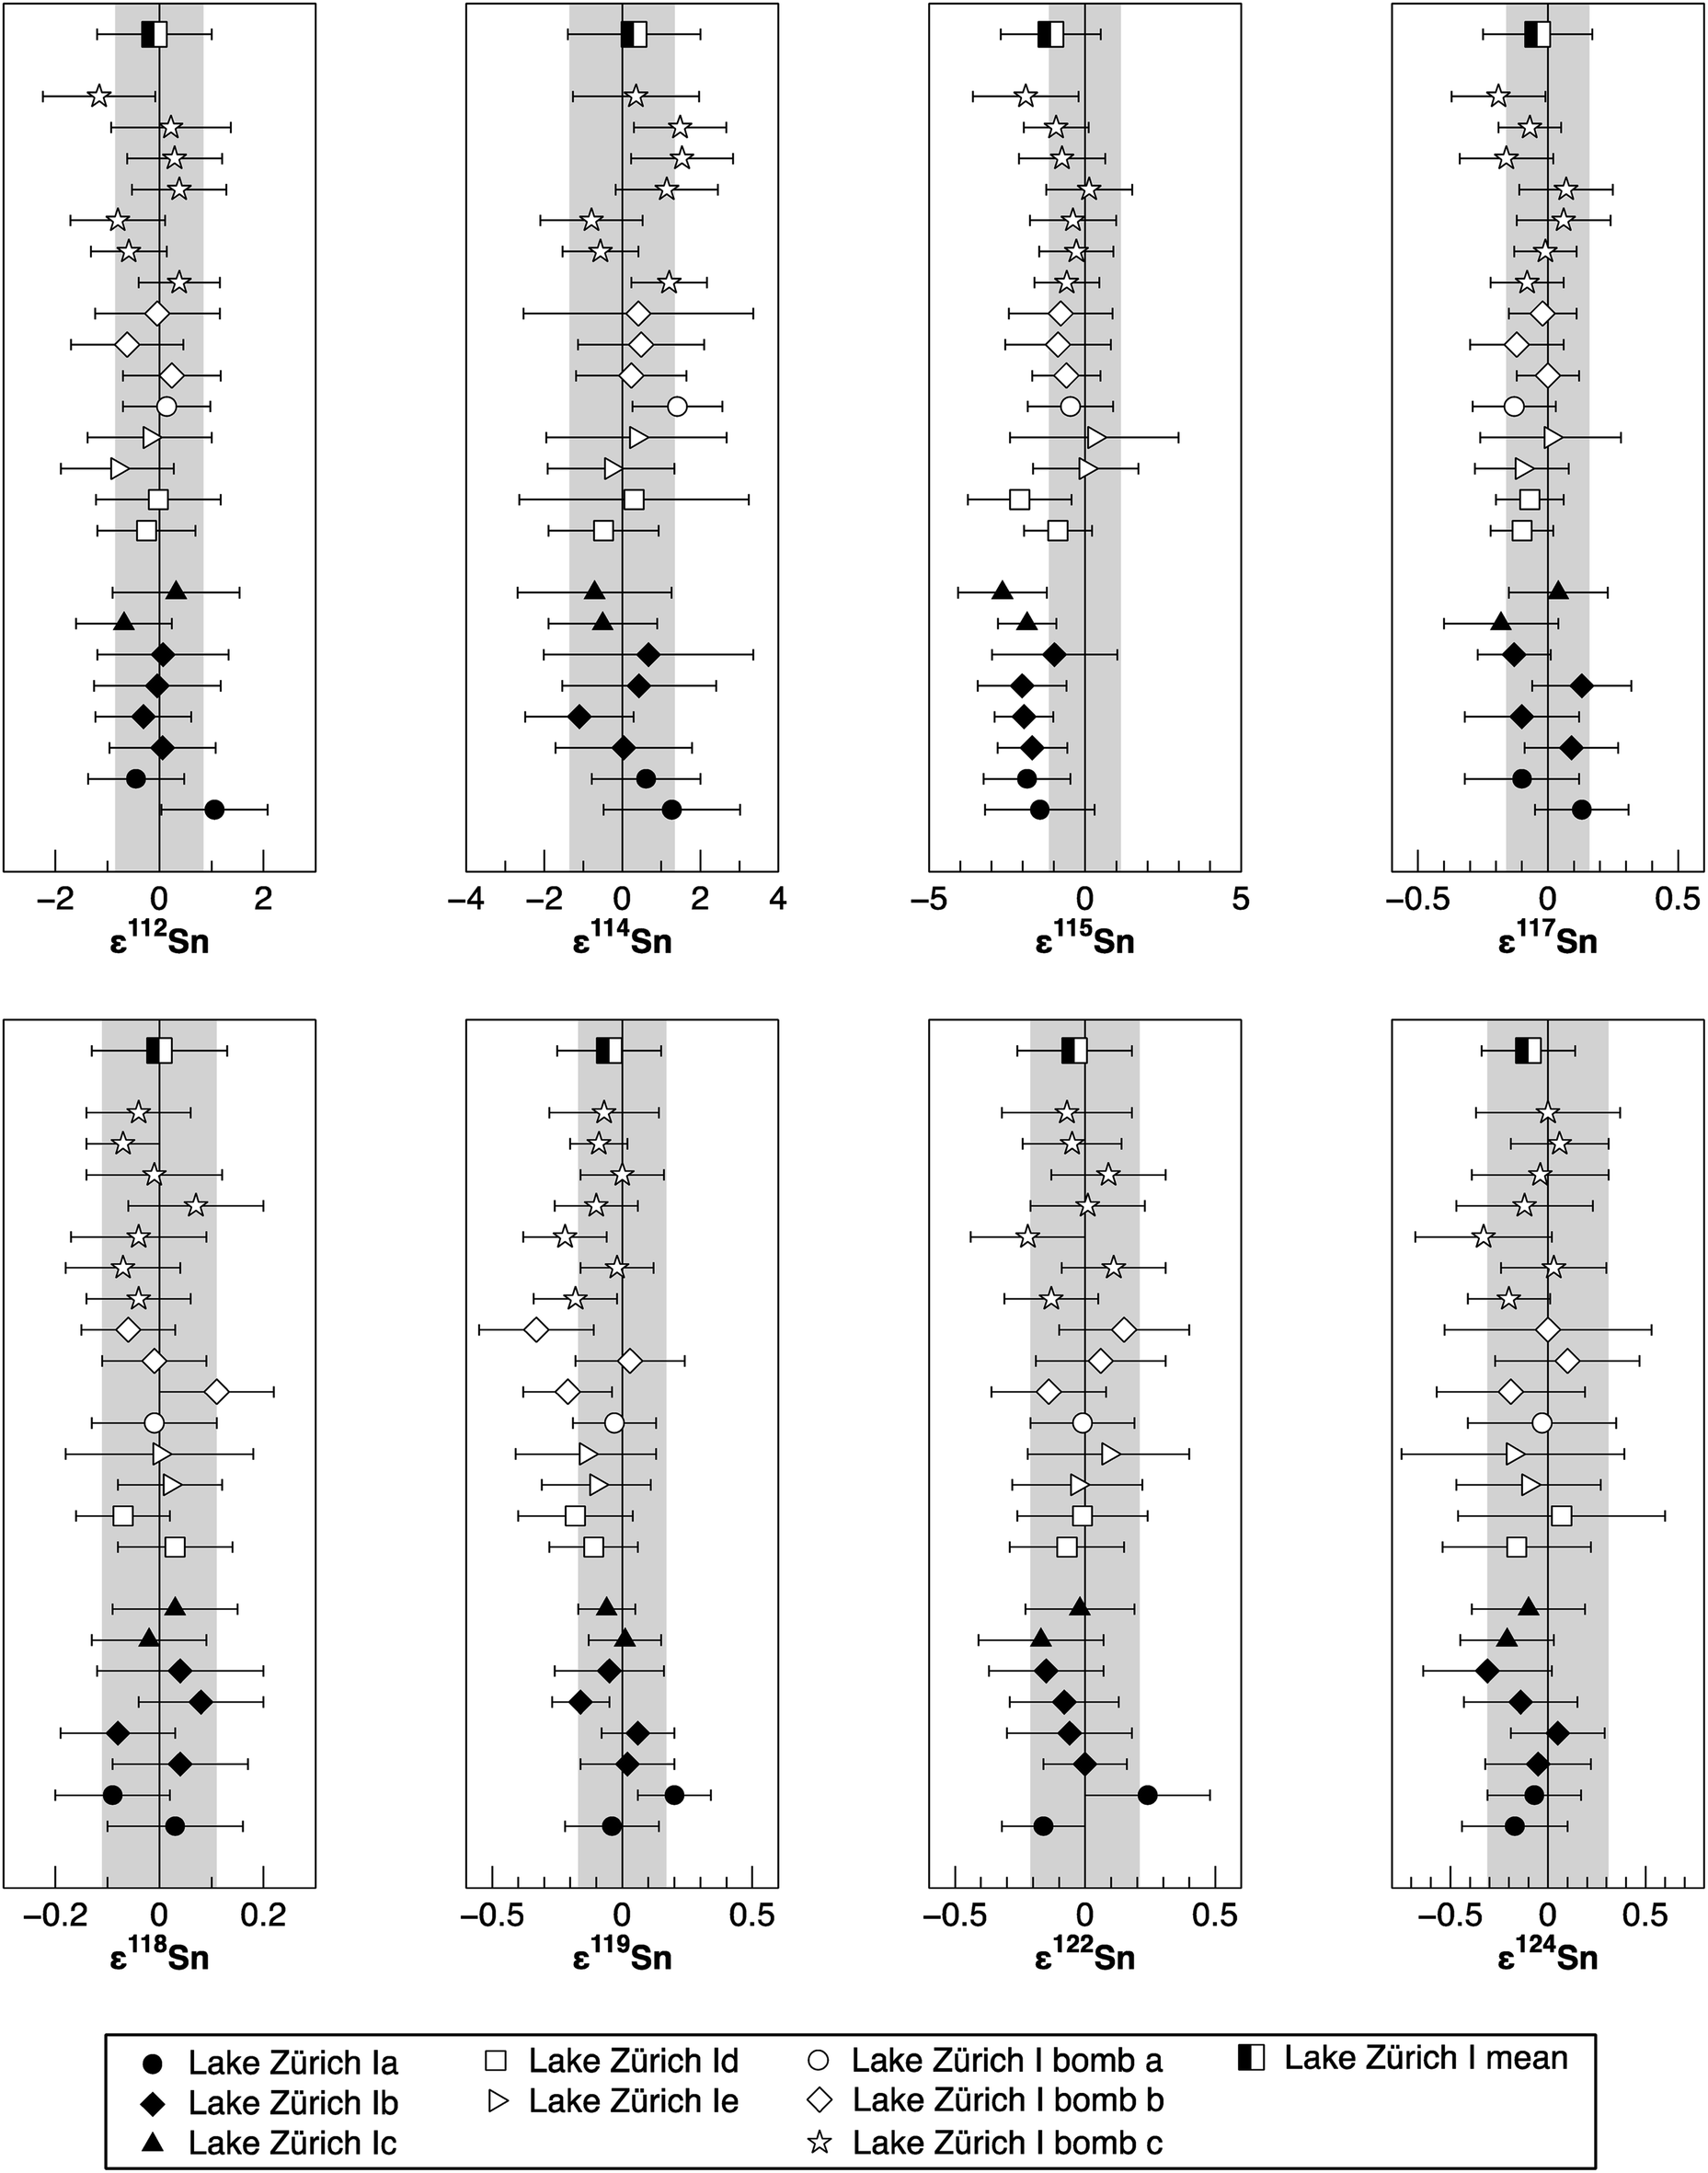
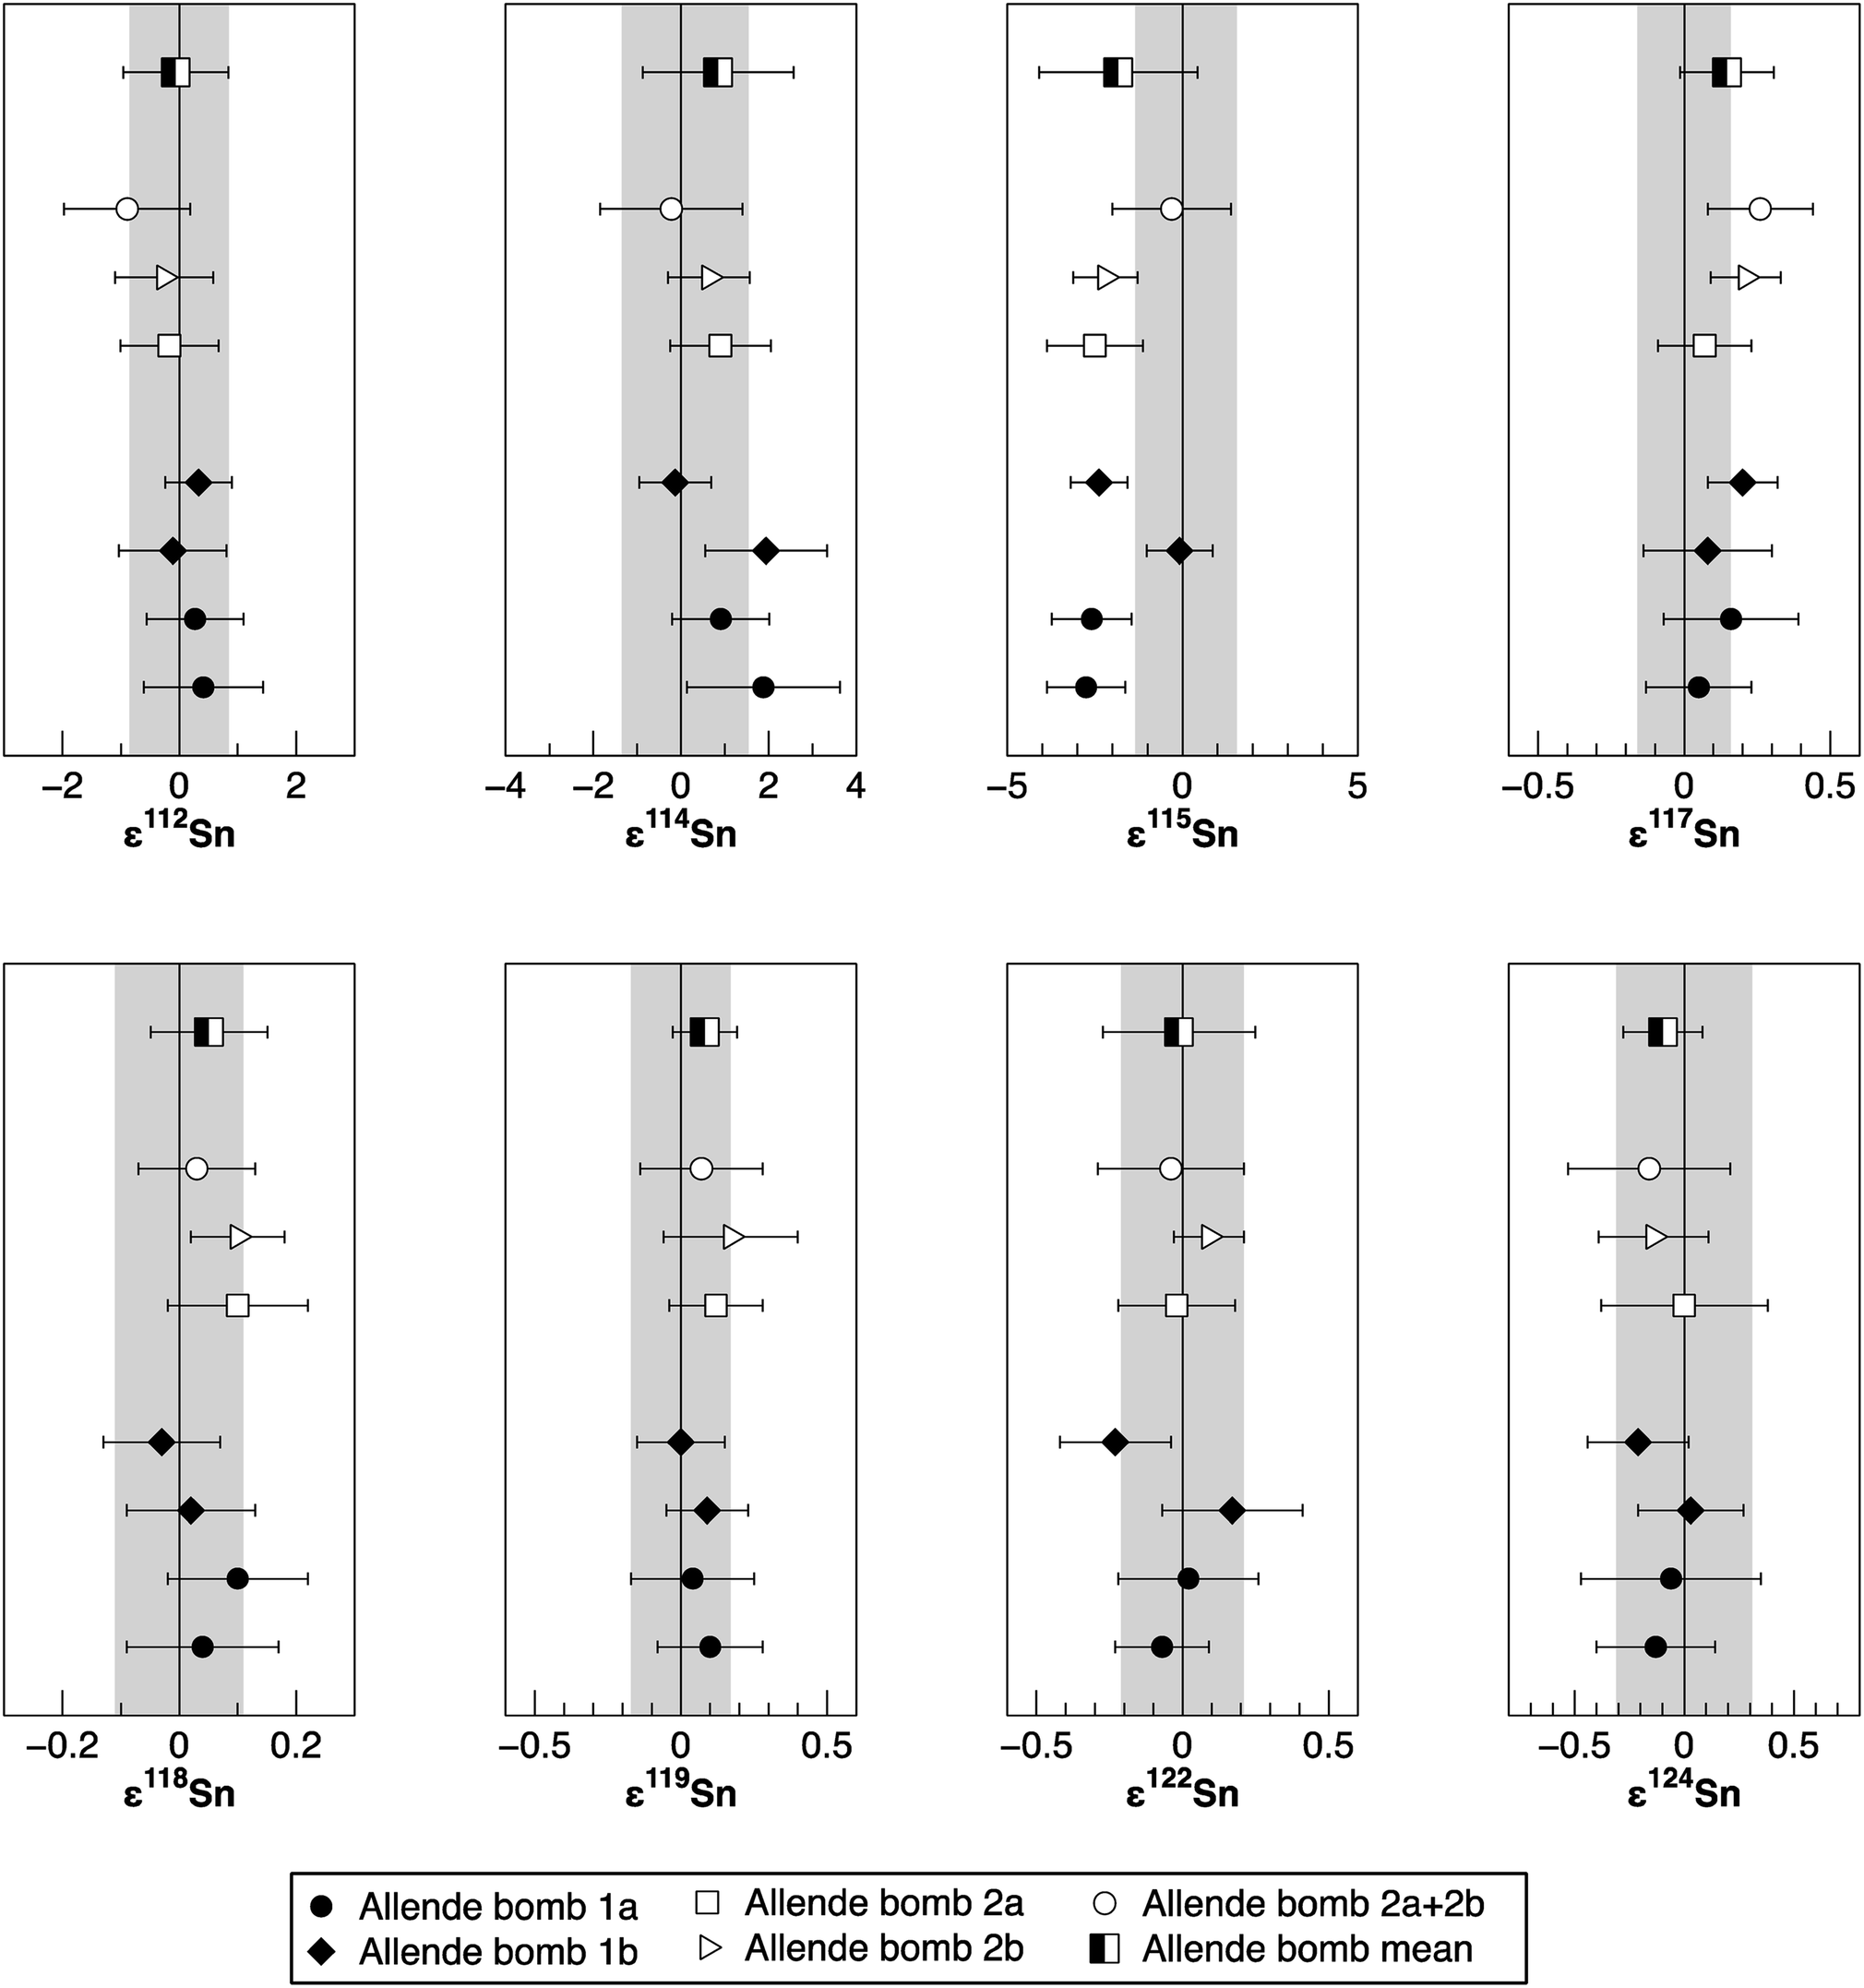
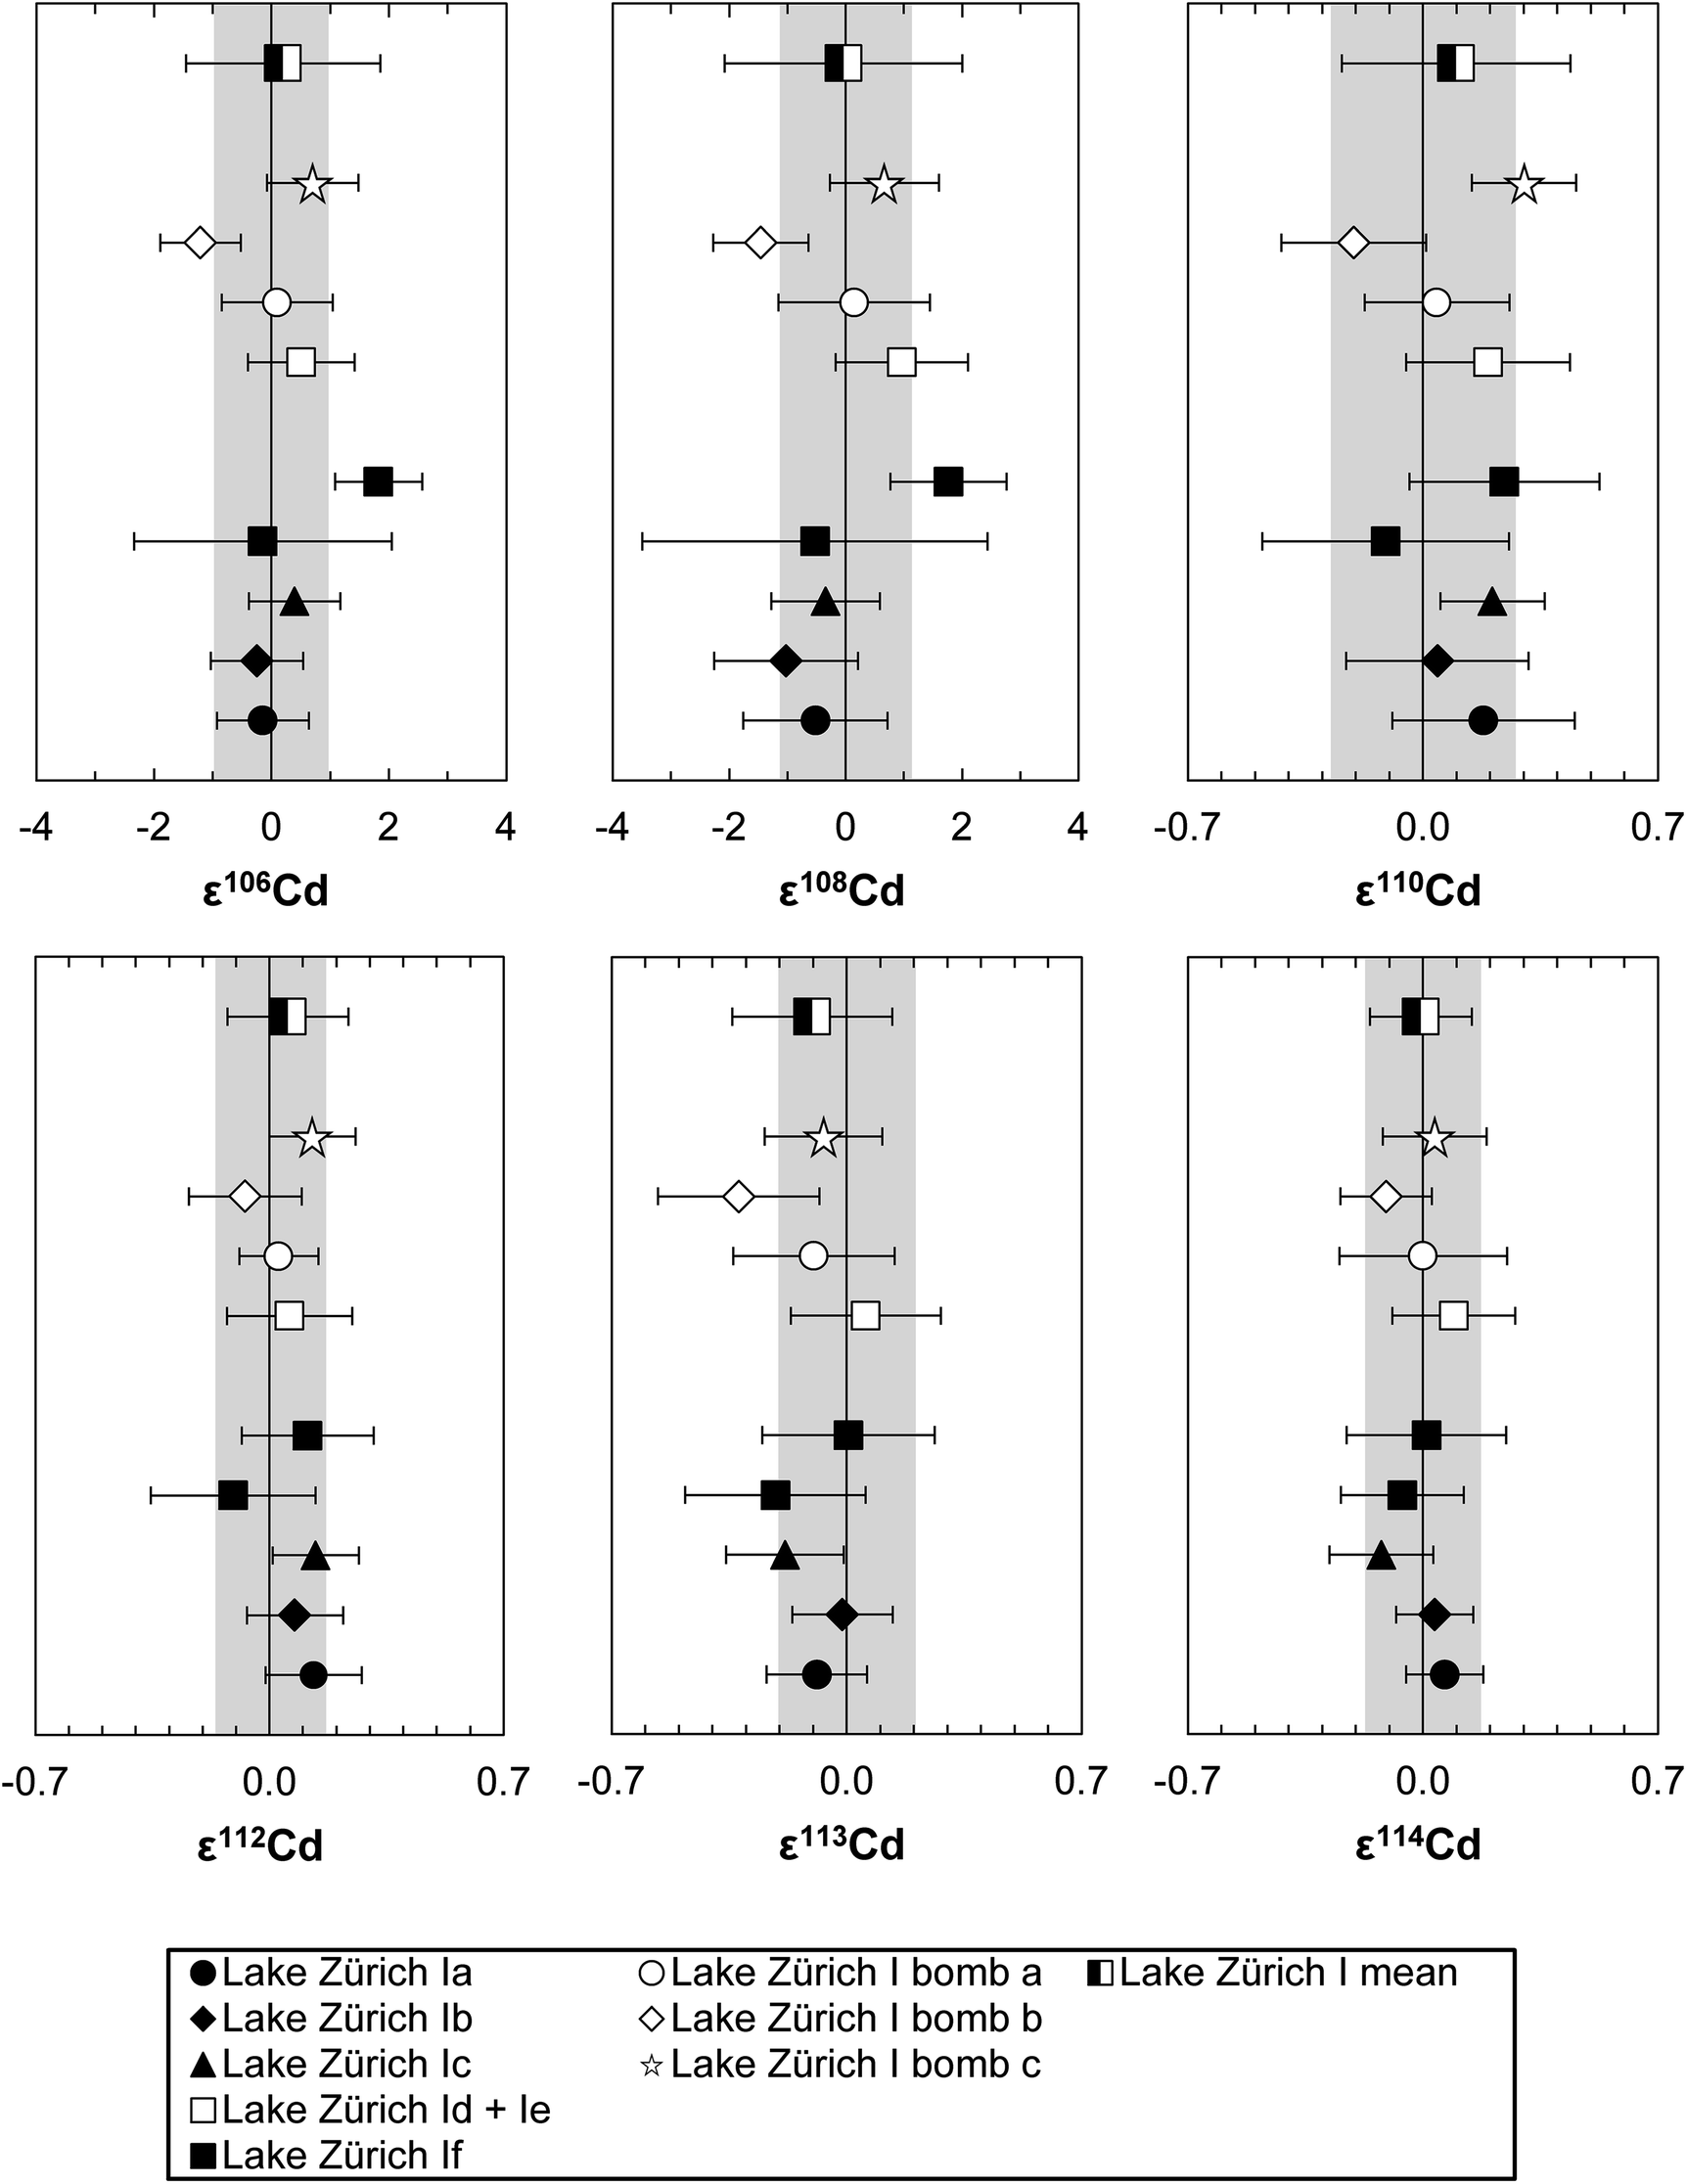
To verify the method and to check for analytical artifacts associated with organics released by the TRU Spec resin, aliquots of lake sediments were analysed using different introduction systems (Aridus II versus DSN). The isotopic composition of the lake sediment Lake Zürich I measured with two different desolvating systems, DSN 100 and Aridus II, are in good agreement (Table 4). In addition, aliquots of samples prepared by using the two-stage chromatographic separation procedure only were measured and compared to samples with the additional Pre-filter stage. Similar results are obtained when comparing samples before and after additional treating with Pre-filter resin (Table 4 and Fig. 4). The exception are the lake sediments with additional Pre-filter treatment, which show a tendency to higher ε115Sn values and therefore are closer to the values obtained for the NIST SRM 3161a Sn standard solution. The reason behind this is unclear, but may indicate that these samples pick up a small additional In blank during Pre-filter treatment. Alternatively, organics may be partly responsible for the observed negative shift in ε115Sn. However, considering the analytical uncertainty, all isotopic ratios measured with or without the third stage column (Pre-filter resin) are identical.
000 ng Zn, Cd–Zn Std 5: 200 ng Cd + 20 ng Zn) and without additions of Zn (500 ng Cd each), were used to calibrate and test the accuracy and reproducibility of our separation procedure for Cd isotope analyses. The standard aliquots were passed through various stages of the column chemistry (Table S3†), and display on average the same Cd isotope composition as the unprocessed Alfa Aesar standard once Zn has been efficiently removed (Fig. 6). The Cd isotope data of Lake Zürich I display a similar to slightly larger reproducibility (2SD, n = 9), compared to the Alfa Aesar Cd standard, of 0.2 ± 1.7 for ε106Cd, 0.0 ± 2.0 for ε108Cd, 0.10 ± 0.34 for ε110Cd, 0.06 ± 0.18 for ε112Cd, −0.10 ± 0.24 for ε113Cd and −0.01 ± 0.15 for ε114Cd (Table S3,†Fig. 7). In general, the Cd isotope data of the lake sediment overlap with the composition of the Alfa Aesar Cd standard, apart from the second measurement of Lake Zürich If with an elevated ε106Cd and ε108Cd data, which is likely due to Zn contamination.
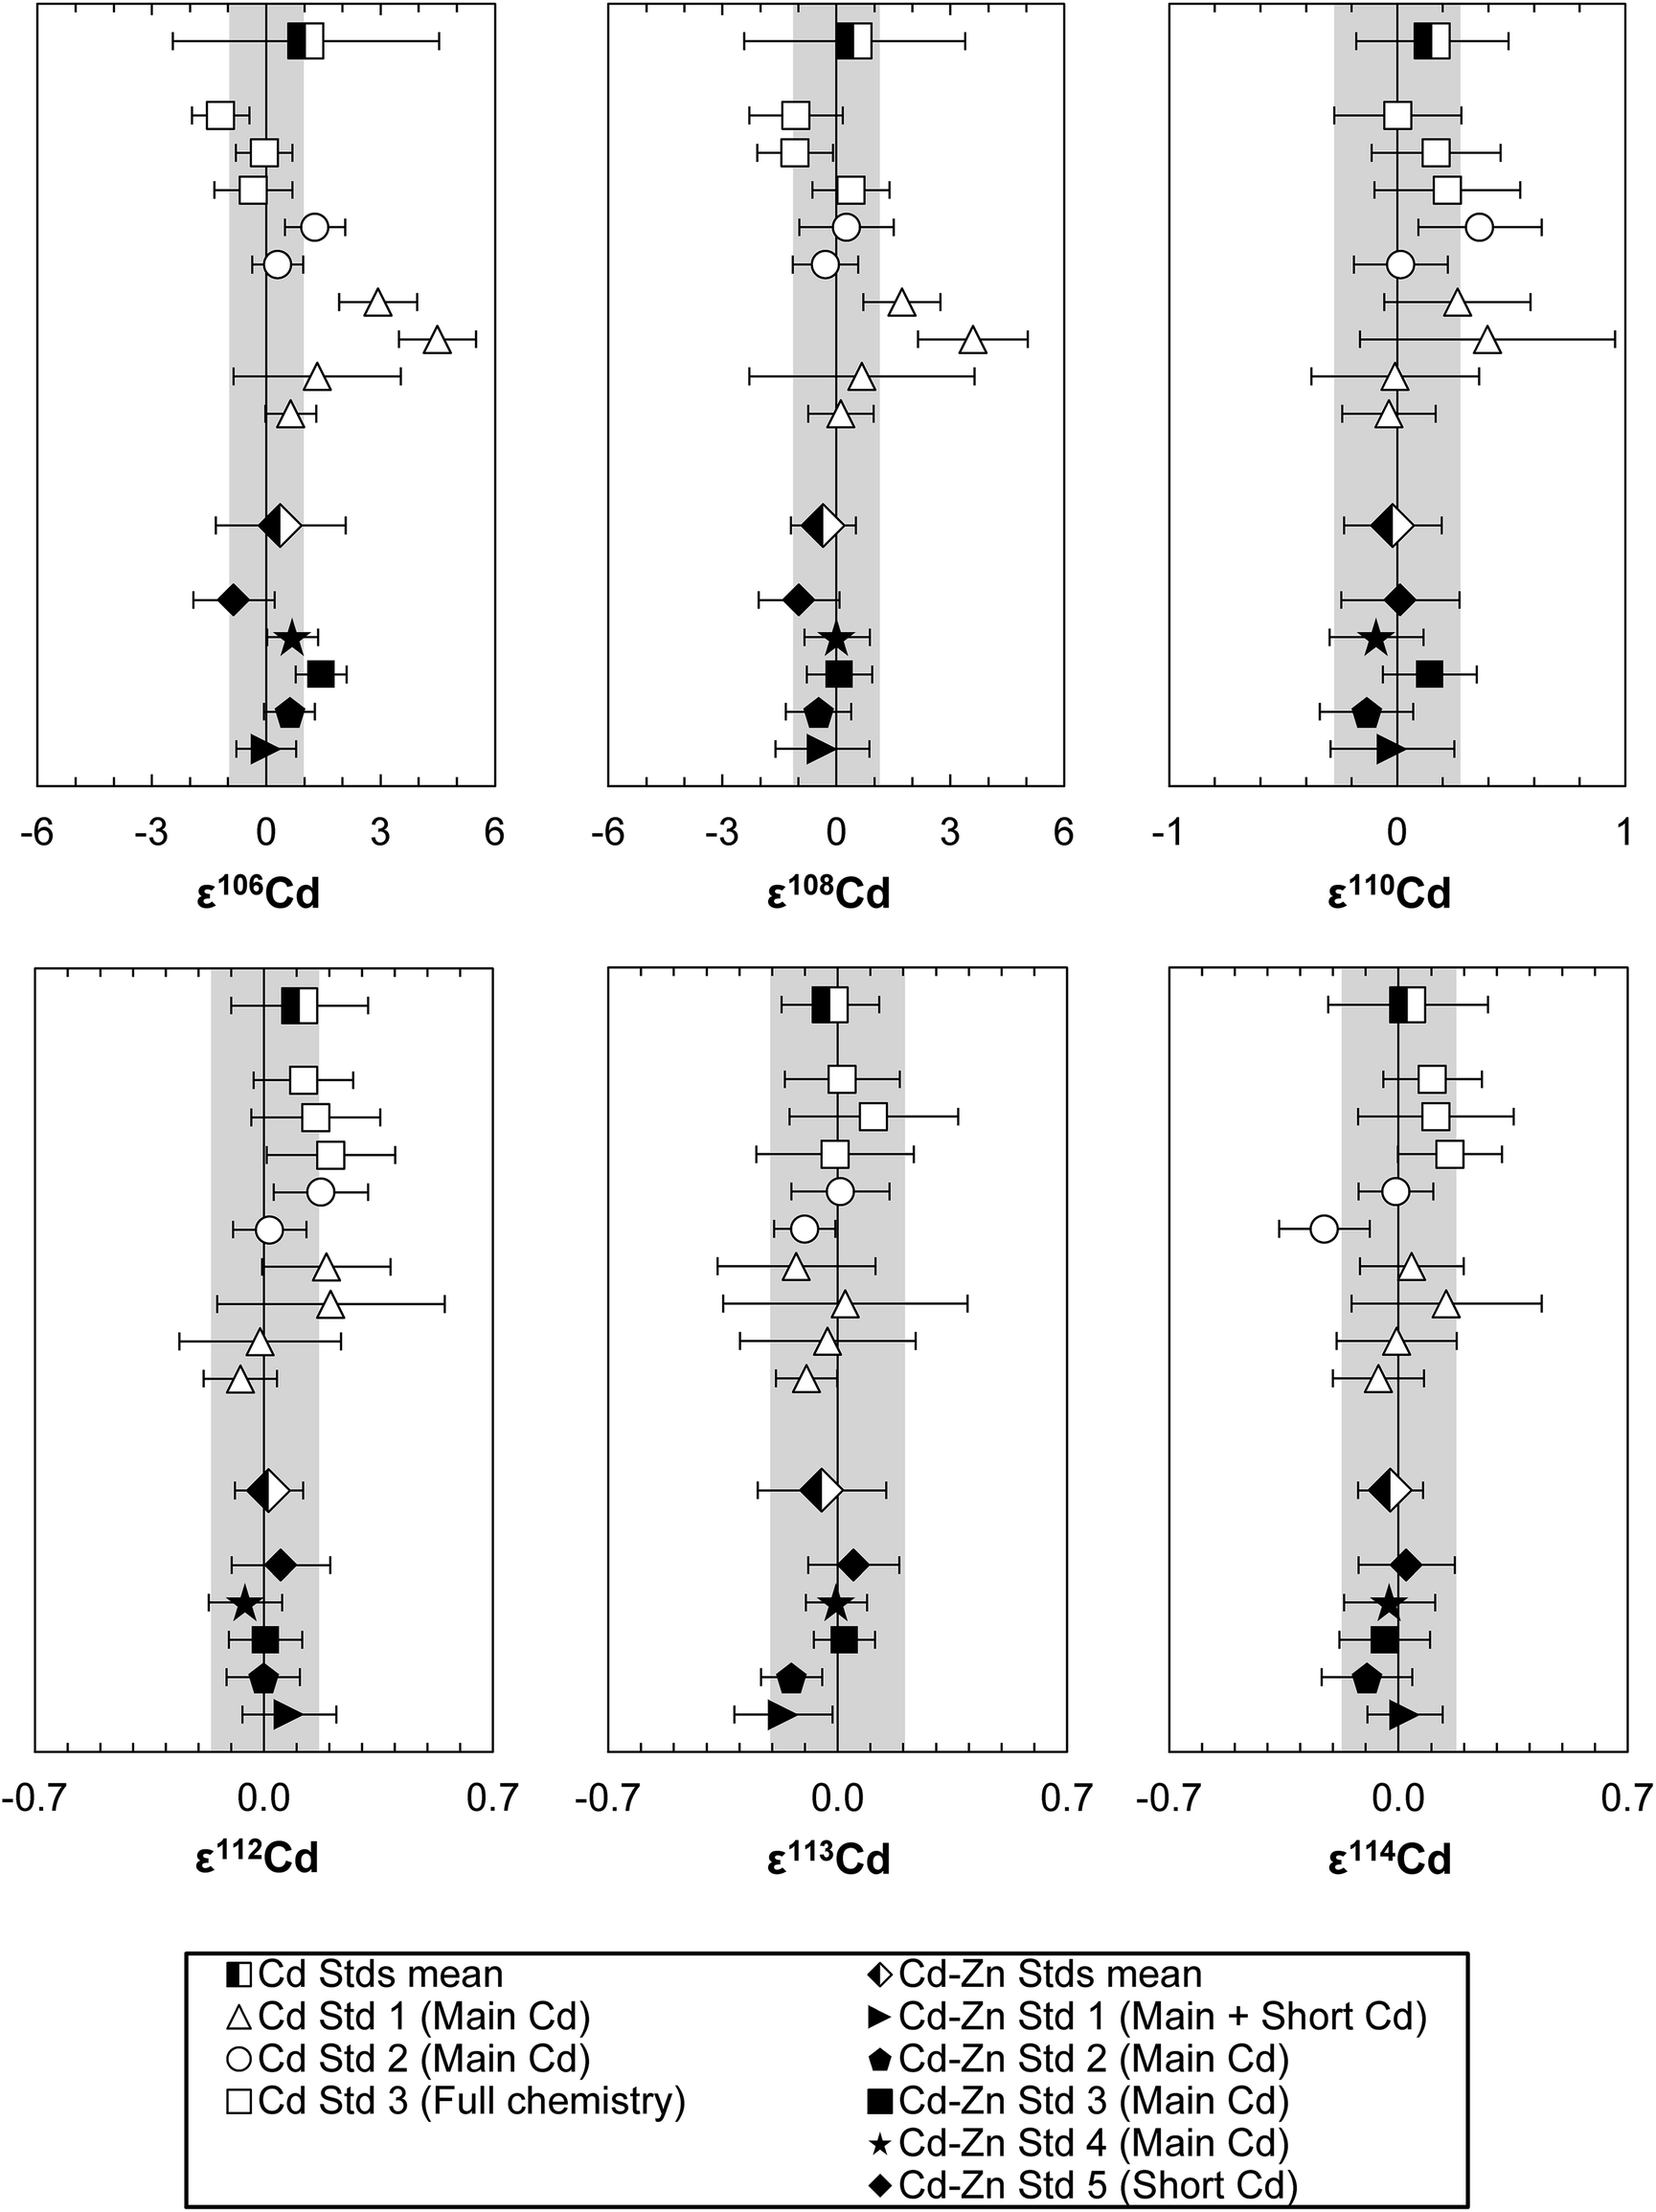 | ||
| Fig. 6 The Cd isotope composition of column processed Alfa Aesar Cd aliquots with (Cd–Zn Std 1 to 4: 200 ng Cd + 80000 ng Zn, Cd–Zn Std 5: 200 ng Cd + 20 ng Zn) and without additions of Zn (500 ng Cd each). Open symbols represent pure Cd standard aliquots, closed symbols Cd–Zn standards and half-filled symbols the averages. The ion exchange procedure which each standard was subjected to is indicated in brackets: “Main Cd” – first Cd column chemistry, “Short Cd” – last down-scaled Cd column chemistry, “Full chemistry” – entire separation procedure performed using all four column chemistries. Error bars show the reproducibility (2SD) of the 200 ppb Alfa Aesar Cd standard measured in the same session, except for the averages where the 2SD of the repeat measurements are given. The grey bands indicate the average daily reproducibility (2SD) of the 200 ppb Alfa Aesar Cd standard. | ||
5. Conclusion
We developed and validated a new analytical method to separate Sn and Cd from geological samples for isotope analysis by MC-ICPMS at high precision. The new separation technique yields purified Sn fractions with minimal amounts of Cd, Te and other interfering elements and high Sn recoveries (>80%). Interference tests with doped Sn solutions show that besides Cd, In and Te, in particular the removal of U is critical because of the relatively high U++ production rates that can reach 4% depending on instrument conditions. Solutions require U/Sn ratios of less than 5 × 10⁻⁵ for accurate data. Tellurium interference correction on Sn isotopes yields better precision when using 125Te (instead of 126Te) for correction. Moreover, our data indicate that both the NIST SRM 3161a and SPEX CLSN-2Y Sn standard solution contain small traces of In that affect the 115Sn data. The differences in ε115Sn between the two standards suggests that the SPEX solution contains 0.76 per mil more In than NIST SRM 3161a.For Cd isotope analyses, the purified Cd fractions contain Pd, Sn and In below their determined tolerance limits and Zn is efficiently separated to enable accurate 106Cd and 108Cd isotope data. Inference tests demonstrate that notably high Zn levels (66Zn/111Cd > 1 × 10⁻²) yield inaccurate 106Cd and 108Cd data due to interfering Zn-argides formed in the plasma. Such levels can be easily generated as blank contribution during the analytical procedure and therefore need careful monitoring, if the low abundance Cd isotopes are targeted.
Our new analytical procedure allows for the simultaneous detection of all ten Sn isotopes and the correction of direct isobaric interferences. Similarly, it also includes the simultaneous measurement of all eight Cd isotopes including Pd, In and Sn isotopes for isobaric interference correction. The new data obtained for the NIST SRM 3161a Sn standard is in excellent agreement with those previously determined.2,7,47 Based on our data, more precise absolute abundances of natural Sn were determined. The precisions for Sn and Cd isotope data achieved using our new procedure are sufficient to identify potential small nucleosynthetic or cosmogenic effects in meteorites. Our findings also illustrate the challenges related to extending an analytical method to low abundance isotopes or improving the measurement precision through increased counting statistics and improved instrumentation available. It requires careful attention to potential interferences. Molecular interferences (e.g., argides or oxides) as well as double charged ions formed in the plasma, or contamination of single standard solutions, previously unproblematic, can hamper the data quality when moving to higher precision.
Conflicts of interest
There are no conflicts to declare.Acknowledgements
We would like to thank Adrian Gilli for the provision of the sample from Lake Zurich. The research leading to these results has received funding from the Swiss National Science Foundation (Project 200021_149282). Parts of this work have been carried out within the framework of the National Centre for Competence in Research PlanetS supported by the Swiss National Science Foundation. We would also like to thank Tim Conway and Matthias Sieber for their helpful input regarding the early Zn blank issue and Maria Kirchenbaur, Morten Andersen and Tim Elliot for helpful discussion.References
- J. R. De Laeter and P. M. Jeffery, J. Geophys. Res., 1965, 70, 2895–2903 CrossRef CAS.
- C. Devillers, T. Lecomte and R. Hagemann, Int. J. Mass Spectrom. Ion Phys., 1983, 50, 205–217 CrossRef CAS.
- N. J. McNaughton and K. J. R. Rosman, Geochim. Cosmochim. Acta, 1991, 55, 499–504 CrossRef CAS.
- K. J. R. Rosman and N. J. McNaughton, Int. J. Mass Spectrom. Ion Processes, 1987, 75, 91–98 CrossRef CAS.
- J. R. De Laeter and P. M. Jeffery, Geochim. Cosmochim. Acta, 1967, 31, 969–985 CrossRef CAS.
- R. D. Loss, K. J. R. Rosman and J. R. de Laeter, Geochim. Cosmochim. Acta, 1990, 54, 3525–3536 CrossRef CAS.
- D.-C. Lee and A. N. Halliday, Int. J. Mass Spectrom. Ion Processes, 1995, 146–147, 35–46 CrossRef.
- D. Berger, E. Figueiredo, G. Brügmann and E. Pernicka, J. Archaeol. Sci., 2018, 92, 73–86 CrossRef CAS.
- G. Brügmann, D. Berger and E. Pernicka, Geostand. Geoanal. Res., 2017, 41, 437–448 CrossRef.
- R. Clayton, P. Andersson, N. H. Gale, C. Gillis and M. J. Whitehouse, J. Anal. At. Spectrom., 2002, 17, 1248–1256 RSC.
- M. Haustein, C. Gillis and E. Pernicka, Archaeometry, 2010, 52, 816–832 CrossRef CAS.
- A. H. Mason, W. G. Powell, H. A. Bankoff, R. Mathur, A. Bulatović, V. Filipović and J. Ruiz, J. Archaeol. Sci., 2016, 69, 110–117 CrossRef CAS.
- E. Yamazaki, S. Nakai, Y. Sahoo, T. Yokoyama, H. Mifune, T. Saito, J. Chen, N. Takagi, N. Hokanishi and A. Yasuda, J. Archaeol. Sci., 2014, 52, 458–467 CrossRef CAS.
- E. Yamazaki, S. i. Nakai, T. Yokoyama, S. Ishihara and H. Tang, Geochem. J., 2013, 47, 21–35 CrossRef CAS.
- F. Moynier, T. Fujii and P. Telouk, Anal. Chim. Acta, 2009, 632, 234–239 CrossRef CAS PubMed.
- D. Malinovskiy, L. Moens and F. Vanhaecke, Environ. Sci. Technol., 2009, 43, 4399–4404 CrossRef CAS PubMed.
- N. Badullovich, F. Moynier, J. Creech, F. Z. Teng and P. A. Sossi, Geochem. Perspect. Lett., 2017, 24–28, DOI:10.7185/geochemlet.1741.
- X. Wang, Q. Amet, C. Fitoussi and B. Bourdon, Geochim. Cosmochim. Acta, 2018, 228, 320–335 CrossRef CAS.
- A. M. Davis, in Meteorites and the Early Solar System II, ed. D. S. Lauretta and H. Y. McSween, University of Arizona Press, 2006, vol. 1, pp. 295–307 Search PubMed.
- K. Lodders, Astrophys. J., 2003, 591, 1220 CrossRef CAS.
- K. P. Jochum, A. W. Hofmann and H. M. Seufert, Geochim. Cosmochim. Acta, 1993, 57, 3585–3595 CrossRef CAS.
- F. Farges, R. L. Linnen and G. E. Brown, Can. Mineral., 2006, 44, 795–810 CrossRef CAS.
- R. L. Linnen, M. Pichavant, F. Holtz and S. Burgess, Geochim. Cosmochim. Acta, 1995, 59, 1579–1588 CrossRef CAS.
- K. J. R. Rosman and J. R. De Laeter, Geochim. Cosmochim. Acta, 1974, 38, 1665–1677 CrossRef CAS.
- K. J. R. Rosman and J. R. De Laeter, Earth Planet. Sci. Lett., 1988, 89, 163–169 CrossRef CAS.
- F. Wombacher, M. Rehkämper, K. Mezger, A. Bischoff and C. Münker, Geochim. Cosmochim. Acta, 2008, 72, 646–667 CrossRef CAS.
- F. Wombacher, M. Rehkämper, K. Mezger and C. Münker, Geochim. Cosmochim. Acta, 2003, 67, 4639–4654 CrossRef CAS.
- C. S. Palk, M. Schönbächler, M. Rehkämper and B. J. Wood, Lunar Planet. Sci., 2015, 46, 2822 Search PubMed.
- E. Zinner, in Treatise on Geochemistry, ed. H. D. Holland and K. K. Turekian, Elsevier, Oxford, 2nd edn, 2014, pp. 181–213 Search PubMed.
- W. Akram, M. Schönbächler, S. Bisterzo and R. Gallino, Geochim. Cosmochim. Acta, 2015, 165, 484–500 CrossRef CAS.
- A. Trinquier, J.-L. Birck and C. J. Allègre, Astrophys. J., 2007, 655, 1179–1185 CrossRef CAS.
- C. Arlandini, F. Käppeler, K. Wisshak, R. Gallino, M. Lugaro, M. Busso and O. Straniero, Astrophys. J., 1999, 525, 886–900 CrossRef CAS.
- S. Bisterzo, R. Gallino, O. Straniero, S. Cristallo and F. Käppeler, Mon. Not. R. Astron. Soc., 2011, 418, 284–319 CrossRef CAS.
- C. Burkhardt, T. Kleine, F. Oberli, A. Pack, B. Bourdon and R. Wieler, Earth Planet. Sci. Lett., 2011, 312, 390–400 CrossRef CAS.
- M. Fischer-Gödde and T. Kleine, Nature, 2017, 541, 525–527 CrossRef PubMed.
- D. G. Sands, J. R. De Laeter and K. J. R. Rosman, Earth Planet. Sci. Lett., 2001, 186, 335–346 CrossRef CAS.
- J. Y. Hu and N. Dauphas, J. Anal. At. Spectrom., 2017, 32, 2024–2033 RSC.
- M. Kirchenbaur, A. Heuser, A. Bragagni and F. Wombacher, Geostand. Geoanal. Res., 2018, 42, 361–377 CrossRef CAS.
- A. F. Holleman, E. Wiberg and N. Wiberg, Lehrbuch der Anorganischen Chemie, Walter de Gruyter, 2007 Search PubMed.
- M. A. Fehr, M. Rehkämper and A. N. Halliday, Int. J. Mass Spectrom., 2004, 232, 83–94 CrossRef CAS.
- W. Yi, A. N. Halliday, D.-C. Lee and J. N. Christensen, Geochim. Cosmochim. Acta, 1995, 59, 5081–5090 CrossRef CAS.
- F. Wombacher, M. Rehkämper and K. Mezger, Geochim. Cosmochim. Acta, 2004, 68, 2349–2357 CrossRef CAS.
- E. R. Toth, M. Schönbächler, M. Friebel and M. A. Fehr, Meteorit. Planet. Sci., 2017, 52, A353 Search PubMed.
- M. Gault-Ringold and C. H. Stirling, J. Anal. At. Spectrom., 2012, 27, 449 RSC.
- K. Murphy, M. Rehkämper, K. Kreissig, B. Coles and T. van de Flierdt, J. Anal. At. Spectrom., 2016, 31, 319–327 RSC.
- C. Pin and J. Rodriguez, in Treatise on Geochemistry, ed. K. K. Turekian, Elsevier, Oxford, 2nd edn, 2014, pp. 147–170 Search PubMed.
- K. J. R. Rosman, R. D. Loss and J. R. De Laeter, Int. J. Mass Spectrom. Ion Processes, 1984, 56, 281–291 CrossRef CAS.
- J. Bigeleisen, J. Am. Chem. Soc., 1996, 118, 3676–3680 CrossRef CAS.
- A. L. Buchachenko, J. Phys. Chem. B, 2013, 117, 2231–2238 CrossRef CAS PubMed.
- J. K. Böhlke, J. Phys. Chem. Ref. Data, 2005, 34, 57 CrossRef.
- S. Ripperger and M. Rehkämper, Geochim. Cosmochim. Acta, 2007, 71, 631–642 CrossRef CAS.
- K. J. R. Rosman, I. L. Barnes, L. J. Moore and J. W. Gramlich, Geochem. J., 1980, 14, 269–277 CrossRef CAS.
Footnote |
| † Electronic supplementary information (ESI) available. See DOI: 10.1039/c9ja00289h |
| This journal is © The Royal Society of Chemistry 2020 |