
Why we might be misusing process mass intensity (PMI) and a methodology to apply it effectively as a discovery level metric†
Edward R.
Monteith‡
 a,
Pieter
Mampuys‡
b,
Louise
Summerton
a,
James H.
Clark
a,
Bert U. W.
Maes
*b and
C. Robert
McElroy
*a
a,
Pieter
Mampuys‡
b,
Louise
Summerton
a,
James H.
Clark
a,
Bert U. W.
Maes
*b and
C. Robert
McElroy
*a
aGreen Chemistry Centre of Excellence, Department of Chemistry, University of York, Heslington, York, YO10 5DD, UK. E-mail: rob.mcelroy@york.ac.uk
bOrganic Synthesis, Department of Chemistry, University of Antwerp, Groenenborgerlaan 171, 2020 Antwerp, Belgium. E-mail: bert.maes@uantwerpen.be
First published on 7th November 2019
Abstract
Process mass intensity (PMI) is a key mass-based metric to evaluate the green credentials of an individual or sequence of reactions during process and chemical development. The increasing awareness to consider greenness as early as the initial discovery level, requires a set of parameters suitable to assess it at this stage of development, and guidelines to apply them correctly. This paper evaluates when and how PMI can be used in a correct manner. Different simulations for key reactions in the organic synthesis toolbox – i.e. amide bond formation and Mitsunobu reactions – illustrate that PMI can easily be misleading without due consideration of yield, concentration and molecular weight of reactants and product. A fair appraisal of the green potential of different methodologies therefore requires careful analysis of the examples and metrics data generated.
Introduction
Over the last decade pressure on the chemical industry to change their practices and develop more environmentally friendly and sustainable technologies has drastically increased. While the fine chemicals industry typically produces a large amount of waste, with E-factors in the range of 25 to >100 kg kg−1 for pharmaceuticals, product volumes are low in comparison to commodity chemicals featuring lower E-factors (<1–5 kg kg−1). Both sectors therefore require a focus on sustainability.1–3Initially the efficiency and sustainability of a process was a difficult concept to measure and quantify, which lead to the development of green chemistry metrics.4–7 The accepted consensus for any metric is that it must be simple, easily measurable and clearly highlight the desired information. From a historical viewpoint the original metric was percentage yield; while this is good at conveying the amount of final product obtained from the limiting reactant, it revealed nothing else about the reaction efficiency, process or conditions. There have been a considerable number of green chemistry metrics developed over the past few decades, some of the most common are atom economy (AE),8 environmental factor (E-factor)9 and reaction mass efficiency (RME).10 Other metrics which appear frequently are process mass intensity (PMI),11 mass intensity (MI),12 carbon efficiency (CE),10 atom utilization (AU),13 environmental quotient (EQ).14 There are many more green measures of success in circulation,15–17 which the Clark group summarized in a comprehensive list of over 60 different metrics.18 Recently, Roschangar et al. made a strong push to unify green mass-based metrics in industry via the introduction of a green aspiration level (GAL).19–21 This approach works by taking the average E-factor of active pharmaceutical ingredients (API) at an early stage of development but not include solvents or water, termed simple E-factor (sEF) and the average of commercial processes, capturing all inputs, including process water, but not considering recycling, termed complete E-factor (cEF).19–21 These values are 42 kg kg−1 and 167 kg kg−1 respectively and represent the process GAL. All processes can then be compared against these figures. Other concepts such as average complexity, a transformation GAL (tGAL) and relative process greenness (RPG) are also discussed.19–21 With the availability of so many different types of metrics, clarity was required to standardise how they should be used as each metric has its advantages and disadvantages. A ‘Metrics Toolkit’ was developed at the University of York, through the CHEM21 consortium.22 This toolkit takes a holistic overview of several aspects of a process and allows a more rounded comparison of its credentials.22 On the other hand, the toolkit does not tell the user if something is green but rather gives the information to determine if the process is better than the previous one and allows a direct comparison to be made between several processes. Importantly, it provides a way to clearly identify which aspects can further be improved to iteratively improve greenness.
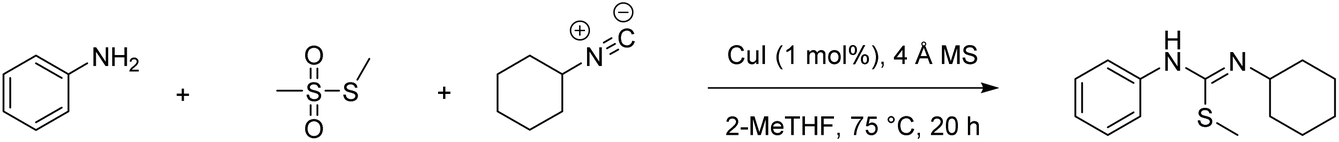
A direct comparison of physical reaction parameters yields unambiguous data from which conclusions can be clearly drawn, e.g., reaction temperature, solvent choice, the type of work-up and purification employed (qualitative comparison using flags). Similarly, mass-based metrics can also give unambiguous data e.g., percent yield, conversion, selectivity and atom economy (quantitative comparison using figures). This is illustrated in our recent paper,23 which compares a classical and modern multi-component reaction (MCR) for the synthesis of N-cyclohexyl-S-methyl-N′-phenylisothiourea.24–26 The example is particularly interesting as MCRs are considered to be an inherently green methodology in the synthetic toolbox. During this analysis the Chem21 Metrics Toolkit22 was employed, and the results of a direct comparison between the two processes are displayed in Table 1. All quantitative and qualitative inputs should be considered as well as up-stream considerations such as how the reactants, reagents, and catalysts have been prepared. Still, it is clear from these results that some general assumptions can be made regarding yield, AE, RME (chosen to show the inherent efficiency with regard to converting reactants into the desired product) and PMI (the metric that accounts for all inputs in a step). Some of the results should have been expected whereas others such as RME may be considered to be surprising with respect to the general assumption about the inherent efficiency of these reactions. From this work the metric which stands out the most to compare overall performance is the difference in PMI between the two routes.
| Classical approach24,25 |
|
||||||
|---|---|---|---|---|---|---|---|
| MCR approach26 |
|
||||||
| Route | Yield (%) | AE (%) | RME (%) | PMI (g g−1) | PMIRRC![[thin space (1/6-em)]](https://www.rsc.org/images/entities/char_2009.gif) a (g g−1) a (g g−1) |
PMISolvb (g g−1) |
PMIWUc (g g−1) |
| a Process mass intensity: reactants, reagents, catalyst. b Process mass intensity: solvents. c Process mass intensity: work-up. | |||||||
| Classical | 84 | 66 | 53 | 817.1 | 26.9 | 742.3 | 790.2 |
| MRC | 88 | 76 | 39 | 324.5 | 13.8 | 312.5 | 310.7 |

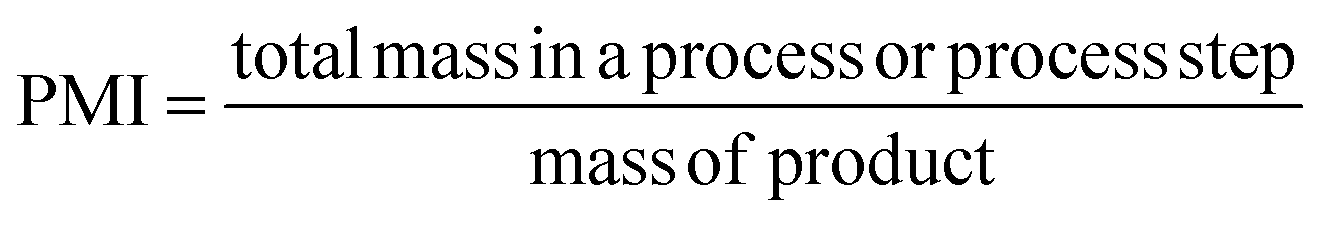
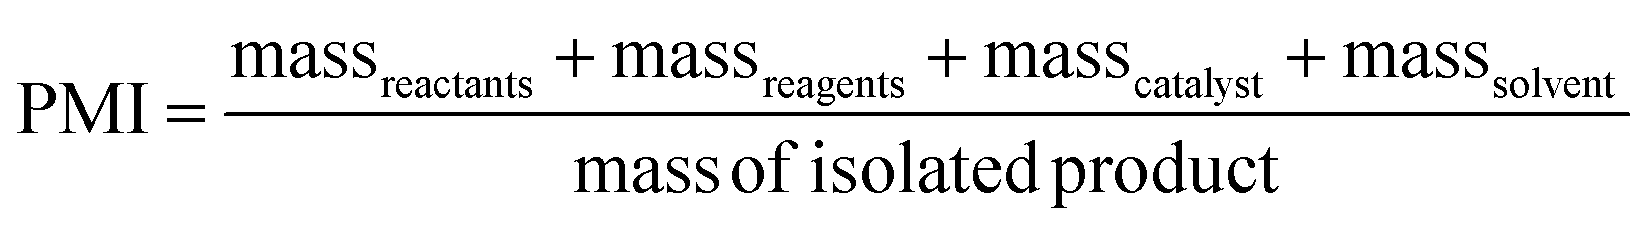
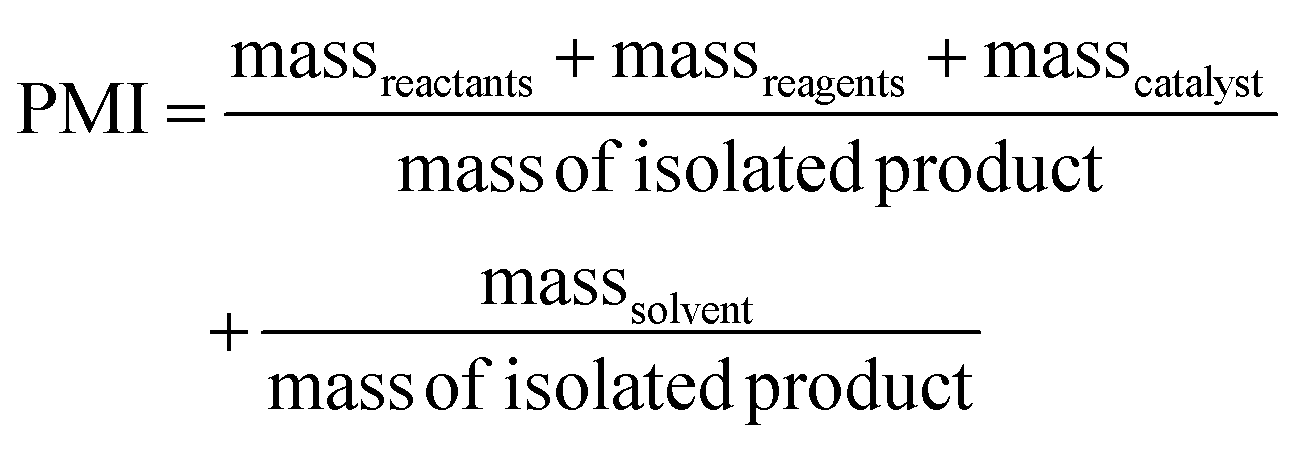
PMI is the most complete mass-based metric as it comprises the mass of all the material used in a synthetic route relative to the amount of isolated product (eqn (1)). Materials considered in its calculation include reagents, reactants, catalysts, solvents (reaction & purification) and work-up chemicals. The PMI value can also be viewed in terms of its four inputs (eqn (2)) or expressed as the amount of reagents, reactants and catalyst (PMIRRC) and solvent (PMISolv) relative to the amount of isolated product (eqn (3) and (4)).
 | (1) |
 | (2) |
 | (3) |
| PMI = PMIRRC + PMISolv | (4) |
PMI is the key metric adopted by the process chemists in pharmaceutical industry to measure the sustainability of a manufacturing process and was chosen for its ease in generating, measuring and communicating data and ability to be used quickly to determine an estimation of greenness.11 Another factor for selecting PMI as the metric of choice is due to its focus on process input rather than output, therefore driving innovation and efficiency from the outset. Moreover, targets can be set and then used as a quantitative measure of process performance/suitability. An example of this was published by workers at Eli Lilly and Co. (Lilly).27 They reported that an original PMI target of <100 g g−1 was set for all APIs in a commercial process, but soon discovered that trying to meet a target <100 g g−1 was unrealistic and that it is more suitable to adjust expectations according to the product under study and its market demand.28 As a solution to this, workers at Lilly developed a strategy based on molecular complexity and predicted market demand to set realistic PMI targets.27
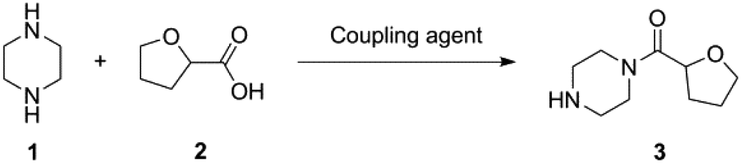
There can be issues with setting limits based on a single metric and also comparing mass-based metric results against different processes as briefly covered by Watson.17 A direct comparison of the PMI between one reaction and another yielding the same product from the same reactants, but applying different reagents can appear to be a sound comparison at face value, but can the result reliably be compared without all the (different) parameters of each reaction being taken into consideration? The green credentials obtained via the Chem21 Metrics Toolkit, of a reaction between piperazine (1) and tetrahydrofuran-2-carboxylic acid (2) via six different amide coupling reagents perfectly illustrates that issues can arise when metric targets are introduced and data directly compared (Table 2; for experimental details see ESI section 1†). The highest PMI figure is surprisingly obtained from an enzymatic process, which may instinctively be the more favourable process based on the reaction conditions (i.e. almost all green flags in Table 2). Moreover, the lowest PMI is obtained with boric acid (B(OH)3) as coupling reagent although it also delivers red flags based on the qualitative metrics. Why do these PMI values contradict our instincts as to which reaction is greener? Is it acceptable to just compare PMI figures without any caution when the same reactants are used under different reaction conditions? Moreover, can this also be done for two different sets of reactants yielding different products? In this manuscript, we seek answers to those questions. Of note, we will only be assessing quantitative mass based metrics, qualitative metrics such as those covered by the Chem21 tool will not be considered. Fully assessing the greenness of any reaction requires a holistic approach.
|
|
||||||
|---|---|---|---|---|---|---|
| Coupling agent | ||||||
| Silicaa | Enzymeb | SOCl2c |
B(OH)3d |
PPh3 & NBSe | HMDSf | |
| Flag system: Green flag denotes preferred, amber is acceptable-some issues and red is undesirable.22 Reaction conditions: 1 (5 mmol), 2 (5 mmol).a K60 silica (0.1 g, activated at 700 °C), neat, 110 °C, 14 h, then acetone (20 mL).b Immobilised novoenzyme 435 (0.1 g), heptane (20 mL), rt, 72 h.c Thionyl chloride (15 mmol), toluene (20 mL), 110 °C, 1 h.d Boric acid (0.5 mmol), toluene (20 mL), 110 °C, 11 h.e Triphenylphosphine (5 mmol), N-bromosuccinimide (5 mmol), pyridine (5 mmol), CH2Cl2 (20 mL), 5 °C then rt, 1 h.f Hexamethyldisilazane (5 mmol), neat, 110 °C, 8 h. | ||||||
| Yield (%) | 15 | 14 | 70 | 74 | 82 | 93 |
| Atom economy (%) | 91 | 91 | 91 | 91 | 91 | 91 |
| RME (%) | 14 | 12 | 64 | 68 | 75 | 85 |
| PMI (g g−1) | 44 | 168 | 74 | 34 | 129 | 137 |
| PMISolv (g g−1) | 36 | 160 | 54 | 32 | 87 | 76 |
| Solvent choice |

|

|

|

|

|

|
| Catalyst? |

|

|

|

|

|

|
| Recoverable catalyst? |

|

|

|

|

|

|
| Critical element |

|

|

|

|

|

|
| Energy |

|

|

|

|

|

|
| Work-up |

|

|

|

|

|

|
| Health and safety | — | — |

|

|
— |

|
| Chemical of concern? | — | — | — |

|
— | — |
Results and discussion
Following on from these initial observations (Table 2), a further in depth analysis on mass-based metrics was conducted. Amide bond formation is the largest category of reactions carried out in the pharmaceutical industry, accounting for 16% of all transformations.29–33 All practicing chemists will inevitably encounter this reaction in their own research at one stage in their career and therefore this is ideal as a model case. Several amides, taken from a comprehensive review on amide coupling reagents by Weisenburger et al., using a variety of different coupling reagents were selected for our mass-based metrics analysis (Scheme 1).31 The top five coupling reagents in order of popularity (number of publications indicated between brackets underneath) in June 2015 were: 1-ethyl-3-(3′-dimethylaminopropyl)carbodiimide hydrochloride (EDC; 54), thionyl chloride (SOCl2; 42), carbonyldiimidazole (CDI; 38), oxalyl chloride ((COCl)2; 22) and N,N′-dicyclohexylcarbodiimide (DCC; 14) and therefore examples involving the application of these were chosen. The reagents pivaloyl chloride (PivCl; 13), isobutyl chloroformate (IBCF; 14) and propylphosphonic anhydride (T3P; 15) were also considered as coupling reagents for our metrics analysis as a reasonable number of processes employed them for reasons beyond the scope of this paper (Scheme 1).31 As such, careful consideration of amide bond forming reactions should involve a broad range of reactants and reagents to clearly highlight any issues arising from a given metric. It will allow the results and trends generated to be directly applicable to current discovery programs.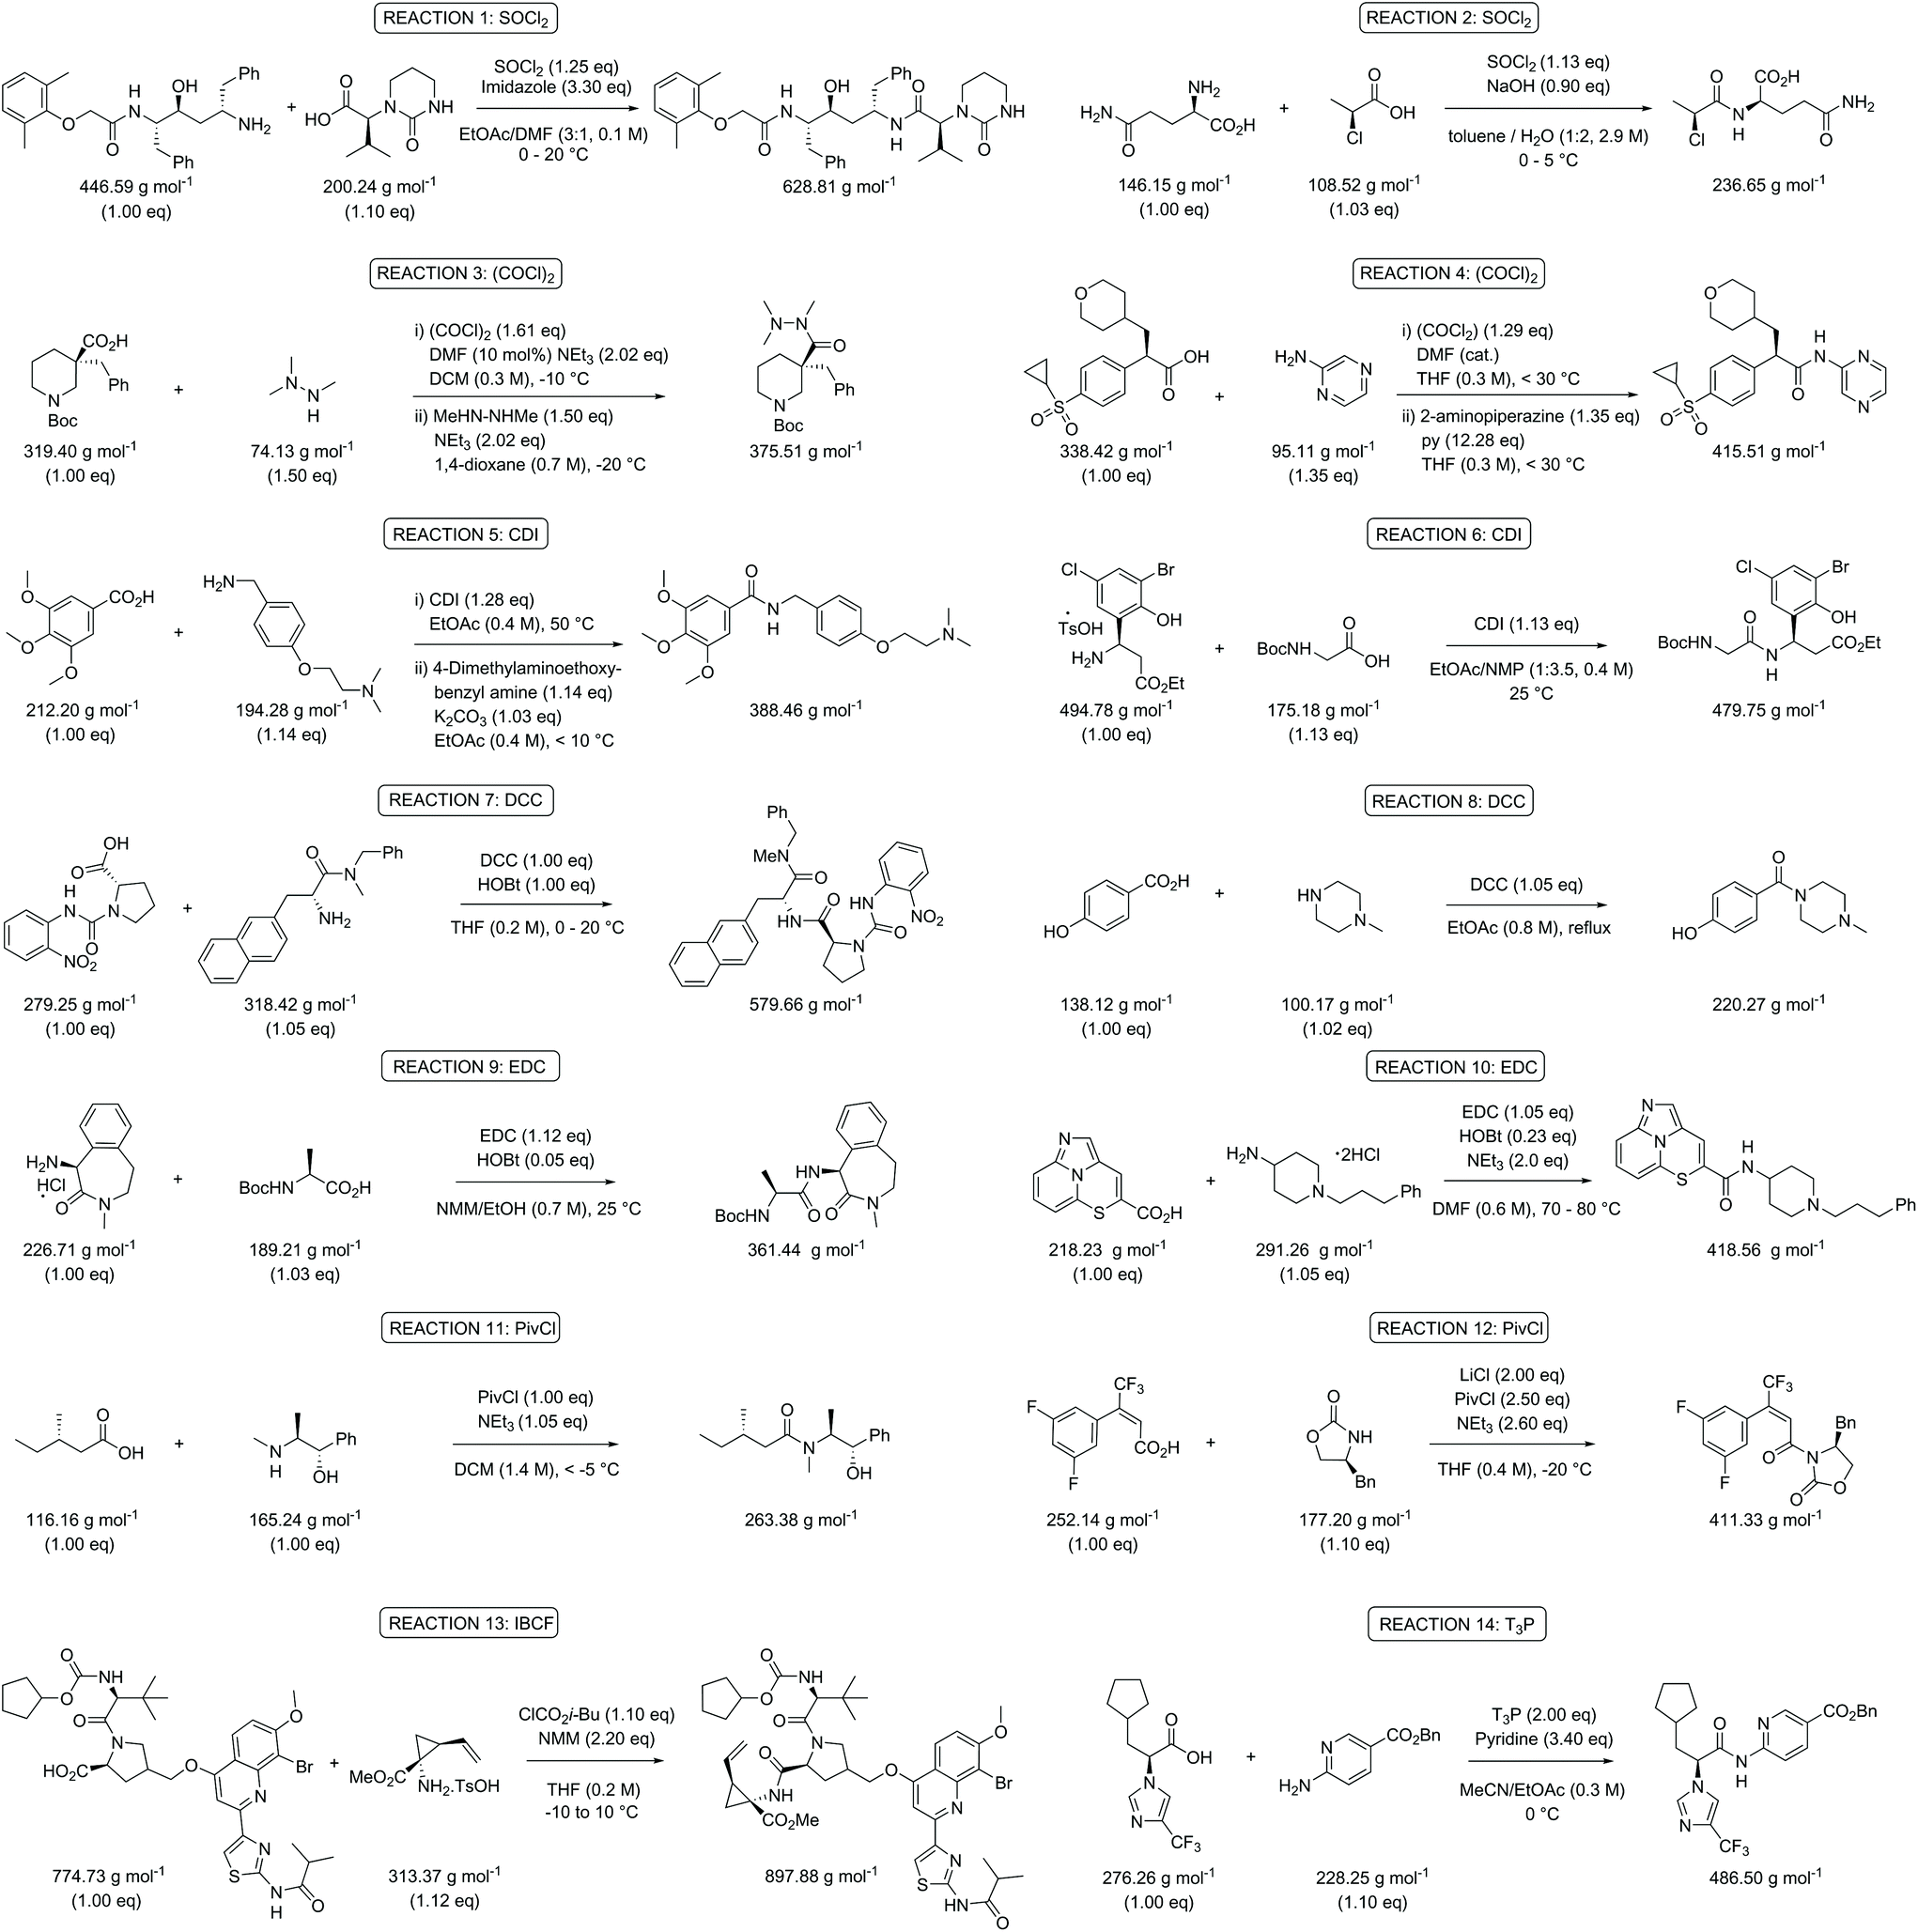 | ||
| Scheme 1 Overview of the selected amide bond forming reactions to evaluate the green metrics parameters.31 | ||
The experimental data of the selected reactions were input into the Chem21 Metrics Toolkit (see ESI†).22 The work-up of the assessed procedures was not taken into consideration as the level of information given varied from publication to publication and its inclusion can easily present misleading metric data when combined with the reagents and reactants in a process. Moreover, typically larger volumes of solvent are taken than actually required – especially in an early phase of development – and halogenated solvents such as dichloromethane, unfortunately, are still commonly used in extractions during method development, although alternatives are in most cases certainly possible. Considering PMI, including PMIWU, would therefore give a distorted view not matching with reality with respect to the chemical reaction itself. The parameters analysed were percent yield, atom economy (AE), reaction mass efficiency (RME), process mass intensity (PMI, eqn (1) and (2)), process mass intensity for reagents, reactants & catalyst (PMIRRC, eqn (3) and (4)), and process mass intensity for reaction solvent (PMISolv, eqn (3) and (4)). PMIRRC was calculated by subtracting PMISolv from the overall process (PMI − PMISolv). The concentration of the reaction was also calculated in relation to the limiting reactant. PMISolv and PMIRRC were measured individually to highlight the impact each has on the overall result. The dominance of solvents on the PMI is already known as shown by Manley et al.11 They described how solvents normally account for 70% of the PMI. Using PMISolv and PMIRRC allows the impact of solvents and reactants/reagents to be considered separately, therefore giving a clearer view of any possible issues with and the variabilities in the data of the reaction under study.
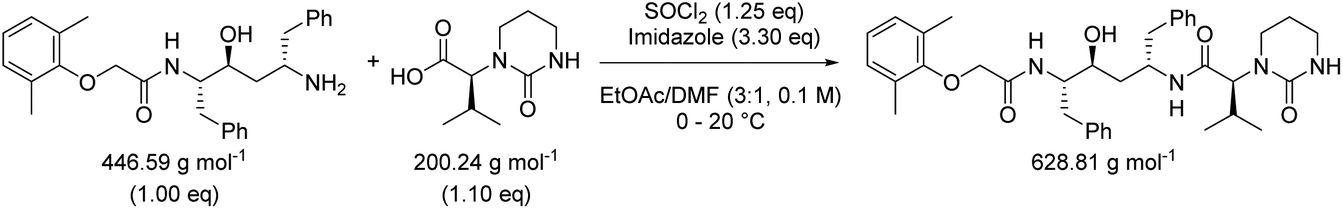
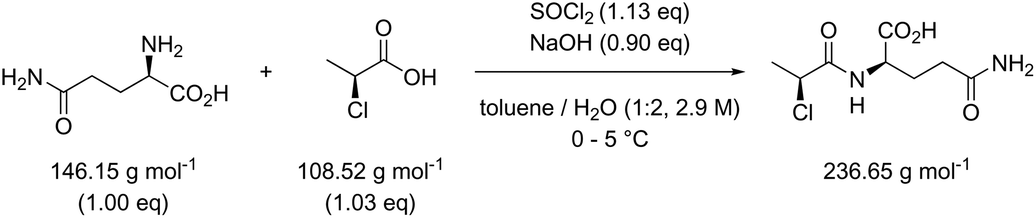
Table 3 contains the metrics data for two amide formation reactions (reactions 1 and 2), involving different reactants and products, but both with thionyl chloride (SOCl2) as coupling reagent. The AE, RME and yield are very similar for both reactions based on the literature data. However, a difference of 13.4 g g−1 can be observed in the PMI of both reactions. A similar difference (15.5 versus 1.7 g g−1) is also noticeable in the PMISolv, which is due to a large concentration difference, 0.1 and 2.9 M respectively. The dominance of the solvent in the PMI calculation, as reported by Manley et al.11 is again nicely illustrated in this table. Four simulations (A–D) were subsequently performed for both reactions to determine the impact of altering the reaction parameters on the green metrics values. In simulation A both reactions were scaled to a concentration of 0.4 M while keeping all other reaction parameters (reactants, reagents, solvent, product, yield) unaltered compared to the literature reference, resulting in the PMI altering considerably; in reaction 1 the PMI decreased from 17.3 to 5.7 g g−1 and in reaction 2 the PMI increased from 3.9 g g−1 to 14.6 g g−1. When comparing both reactions by PMIRRC, the solvent effect is ignored and the values of 1.8 g g−1 & 2.2 g g−1 remain constant (Table 3, simulation A). When the yield is altered, the values for PMIRRC shift as seen in simulations B and D. As expected, decreasing the yield from 92% to 90% had no effect on reaction 1. Increasing the yield from 81% to 90% in reaction 2 had only a minor change on the PMIRRC, from 2.2 to 2.0 g g−1. However, the effect was most noticeable when there was a large change in yield to 50% (simulation D). Moreover, in this last simulation all green metrics values besides AE altered significantly compared to the reported literature data for both reactions. This highlights the unreliability of comparing metrics from two reactions with significantly differing parameters.
| Reaction 1 |
|
|||||
|---|---|---|---|---|---|---|
| Reaction 2 |
|
|||||
| AE (%) | RME (%) | PMI (g g−1) | PMIRRC (g g−1) | PMISolv (g g−1) | Yield (%) | |
| a Reactions refer to Scheme 1. | ||||||
| Literature data reported | ||||||
| Reaction 1: [Acid] = 0.1 M | 97 | 87 | 17.3 | 1.8 | 15.5 | 92 |
| Reaction 2: [Acid] = 2.9 M | 93 | 75 | 3.9 | 2.2 | 1.7 | 81 |
| Simulation A: [Acid] = 0.4 M, literature yield | ||||||
| Reaction 1 | 97 | 87 | 5.7 | 1.8 | 3.9 | 92 |
| Reaction 2 | 93 | 75 | 14.6 | 2.2 | 12.4 | 81 |
| Simulation B: [Acid] = literature data, yield = 90% | ||||||
| Reaction 1 | 97 | 85 | 17.7 | 1.8 | 15.8 | 90 |
| Reaction 2 | 93 | 83 | 3.5 | 2.0 | 1.5 | 90 |
| Simulation C: [Acid] = 0.4 M, yield = 90% | ||||||
| Reaction 1 | 97 | 85 | 5.8 | 1.8 | 4.0 | 90 |
| Reaction 2 | 93 | 83 | 13.2 | 2.0 | 11.2 | 90 |
| Simulation D: [Acid] = 0.4 M, yield = 50% | ||||||
| Reaction 1 | 97 | 47 | 10.5 | 3.3 | 7.2 | 50 |
| Reaction 2 | 93 | 46 | 23.7 | 3.5 | 20.2 | 50 |
Following the analysis and simulations with SOCl2, attention was then turned to the other coupling reagents [oxalyl chloride (Table S1†), CDI (Table S2†), DCC (Table S3†), EDC (Table S4†), PivCl (Table S5†), IBCF (Table S6†), and T3P (Table S7†)], based on the selected literature examples shown in the review (Scheme 1).31 All target compounds are amides with a variety of molecular weights between 220.27 and 897.88 g mol−1. The same trends for yield and concentration on PMI and PMIRRC as observed in Table 3 were also confirmed throughout the analysis of this data. The lower the concentration used in the reaction, the higher the PMI. This is logical since a concentrated process will contain less solvent. This is especially significant when comparing processes, e.g. pilot plant/production scale versus a discovery route. The conditions used during bench work applying standard laboratory techniques and dilutions are notably different to those employed at pilot or production scale.34 Reaction concentration is a factor which will be considered and optimized, most likely by a process chemist, whereas at the bench in a high throughput R&D laboratory, concentration is rarely considered and typically varies a lot. A direct comparison of two reactions here would therefore most likely be inaccurate, imposing the use of PMIRRC. Even when using PMIRRC simulations with similar yield will be required to compare the green potential of amide bond-forming reactions differing in product and coupling reagent.
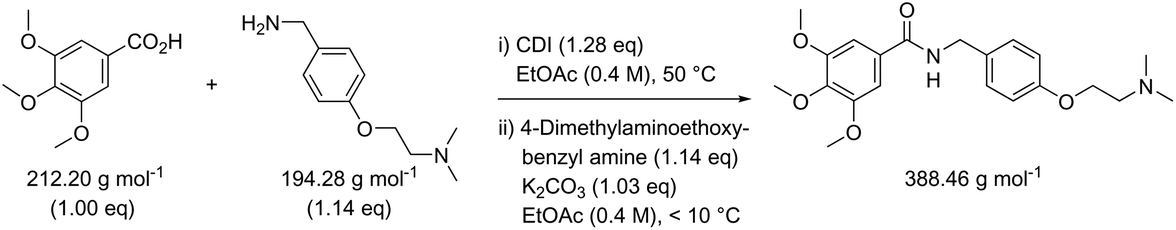
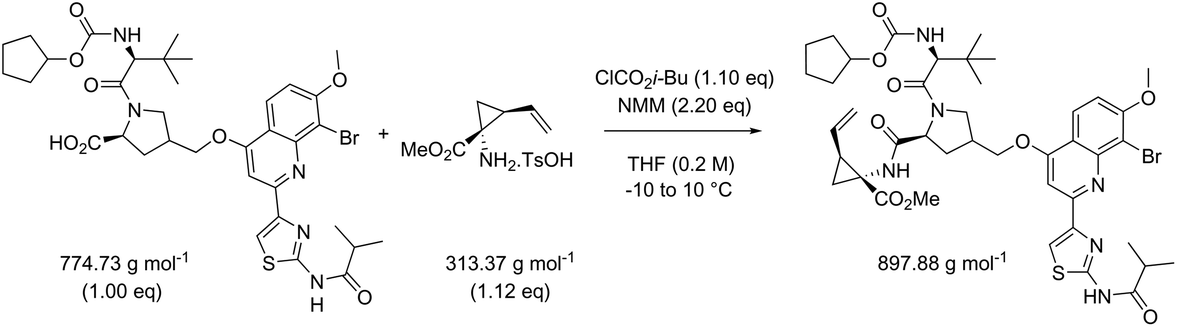
While in Table 3 two reactions with SOCl2 as coupling reagent were randomly selected, we subsequently compared two amide bond-forming reactions of Scheme 1 featuring both the smallest (reaction 5, 17.92 g mol−1) and largest (reaction 13, 461.36 g mol−1) molecular weight difference between the two reactants (Table 4). Obviously, this is also reflected in the molecular weight of the corresponding products (388.46 g mol−1versus 897.88 g mol−1). Though the coupling reagent is not the same (CDI and IBCF), the molecular weight difference is small (23.57 g mol−1). When comparing the literature metrics for both processes there is again very little difference between them at first glance; the yield 89% vs. 84%, PMI 8.8 vs. 8.3 g g−1, PMIRRC 2.2 vs. 2.0 g g−1 and PMISolv 6.6 vs. 6.3 g g−1. However, when the concentrations were standardised at 0.4 M the difference in PMI became apparent; the PMI of 8.8 vs. 8.3 g g−1 went to 8.7 vs. 4.9 g g−1 for both reactions (simulation A). When this effect is combined with a yield of only 50% the values went to 15.5 vs. 8.3 g g−1 (simulation D). This clearly highlights the problem of comparing a PMI value without standardising the concentration. A concentration of 0.4 M was chosen as the default concentration as we felt it reflected a reasonable concentration that a working bench chemist may arbitrarily use. It is worth noting that the chosen concentration is somewhat irrelevant as long as it is standardised. In simulation C the concentration is 0.4 M whereas in simulation E the concentration has been scaled to 0.8 M, both with a yield of 90%. As expected, in both simulations the values for PMIRRC are identical making it a reliable metric for comparison. The overall PMI is highest for the lowest concentration (simulation C) as would be expected. Standardising the concentration avoids the effect that the quantity of solvent has on the overall metrics of the process. It is interesting to note that the reaction with the highest molecular weight difference between reactants gives the lowest PMI/PMIRRC values and the lowest difference the reverse, though the yield of the target amide is the same. This conclusion remains when exactly the same coupling agent (CDI or IBCF) and stoichiometry (excess coupling reagent and amine reactant) were applied for reactions 5 and 13 (simulations F–I).
| Reaction 5 (CDI) | ΔMW reactants 17.92 g mol−1 |
|
|||||
|---|---|---|---|---|---|---|---|
| MW CDI 162.15 g mol−1 | |||||||
| Reaction 13 (IBCF) | ΔMW reactants 461.36 g mol−1 |
|
|||||
| MW IBCF 138.58 g mol−1 | |||||||
| AE (%) | RME (%) | PMI (g g−1) | PMIRRC (g g−1) | PMISolv (g g−1) | Yield (%) | ||
| a Reactions refer to Scheme 1. | |||||||
| Literature data reported | |||||||
| Reaction 5: [Acid] = 0.4 M | 96 | 81 | 8.8 | 2.2 | 6.6 | 89 | |
| Reaction 13: [Acid] = 0.2 M | 83 | 67 | 8.3 | 2.0 | 6.3 | 84 | |
| Simulation A: [Acid] = 0.4 M, literature yield | |||||||
| Reaction 5 | 96 | 81 | 8.7 | 2.2 | 6.4 | 89 | |
| Reaction 13 | 83 | 67 | 4.9 | 2.0 | 2.9 | 84 | |
| Simulation B: [Acid] = literature data, yield = 90% | |||||||
| Reaction 5 | 96 | 82 | 8.6 | 2.2 | 6.4 | 90 | |
| Reaction 13 | 83 | 72 | 7.8 | 1.9 | 5.9 | 90 | |
| Simulation C: [Acid] = 0.4 M, yield = 90% | |||||||
| Reaction 5 | 96 | 82 | 8.6 | 2.2 | 6.4 | 90 | |
| Reaction 13 | 83 | 72 | 4.6 | 1.9 | 2.7 | 90 | |
| Simulation D: [Acid] = 0.4 M, yield = 50% | |||||||
| Reaction 5 | 96 | 46 | 15.5 | 4.0 | 11.5 | 50 | |
| Reaction 13 | 83 | 40 | 8.3 | 3.4 | 4.9 | 50 | |
| Simulation E: [Acid] = 0.8 M, yield = 90% | |||||||
| Reaction 5 | 96 | 82 | 5.4 | 2.2 | 3.2 | 90 | |
| Reaction 13 | 83 | 72 | 3.2 | 1.9 | 1.4 | 90 | |
| Simulation F: CDI (1.1 eq.) as coupling reagent for both reactions, reactant stoichiometry as literature, [acid] = 0.4 M, Yield = 90% | |||||||
| Reaction 5 | 96 | 82 | 8.6 | 2.2 | 6.4 | 90 | |
| Reaction 13 | 83 | 72 | 4.5 | 1.8 | 2.7 | 90 | |
| Simulation G: CDI (1.1 eq.) as coupling reagent for both reactions, reactant stoichiometry as literature, [acid] = 0.4 M, Yield = 50% | |||||||
| Reaction 5 | 96 | 46 | 15.4 | 3.9 | 11.5 | 50 | |
| Reaction 13 | 83 | 40 | 8.2 | 3.3 | 4.9 | 50 | |
| Simulation H: IBCF (1.1 eq.) as coupling reagent for both reactions, reactant stoichiometry as literature, [acid] = 0.4 M, Yield = 90% | |||||||
| Reaction 5 | 96 | 82 | 8.4 | 2.0 | 6.4 | 90 | |
| Reaction 13 | 83 | 72 | 4.5 | 1.7 | 2.8 | 90 | |
| Simulation I: IBCF (1.1 eq.) as coupling reagent for both reactions, reactant stoichiometry as literature, [acid] = 0.4 M, Yield = 50% | |||||||
| Reaction 5 | 96 | 46 | 15.1 | 3.5 | 11.5 | 50 | |
| Reaction 13 | 83 | 40 | 8.0 | 3.1 | 4.9 | 50 | |
Quantitative green metrics assessment is also interesting for methodology development – though not performed yet – when researchers want to benchmark their synthetic method with the existing literature. The effect of alteration of the coupling agent for the synthesis of the same amide reaction product was therefore evaluated. This was again examined for reactions 5 and 13 with a set of different coupling reagents covering a larger MW range (between 118.97 g mol−1 and 318.18 g mol−1; Table 5). Yield, concentration and excess reagent were fixed in these simulations. The PMIRRC ranges from 1.6–2.2 g g−1 (reaction 5) and from 1.5–1.8 g g−1 (reaction 13) and the overall PMI from 8.0–8.6 g g−1 (reaction 5) and from 4.3–4.6 g g−1 (reaction 13). Therefore, the effect of the coupling reagent on the PMI/PMIRRC is small. On the other hand, when there is a large span in MW of the reactants, when reactions 5 and 13 are compared, the PMI will be lower than when their MWs are more equal. When there is a large span in MW of the reactants, the PMI will be higher than when their MWs are more equal as observed before (vide supra). It is interesting to note the range of PMIRRC is however small. The effect on PMI is more dependent on the reactants than the reagents and this should be taken into consideration when developing a synthetic procedure.
| Reaction 5 | ΔMW reactants 17.92 g mol−1 |
|
|||||
|---|---|---|---|---|---|---|---|
| Reaction 13 | ΔMW reactants 461.36 g mol−1 |
|
|||||
| AE (%) | RME (%) | PMI (g g−1) | PMIRRC (g g−1) | PMISolv (g g−1) | Yield (%) | ||
| a Reactions refer to Scheme 1. | |||||||
| Simulation A: SOCl2 (1.1 eq., MW = 118.97 g mol−1), [Acid] = 0.4 M in THF | |||||||
| Reaction 5 | 96 | 82 | 8.0 | 1.6 | 6.4 | 90 | |
| Reaction 13 | 83 | 72 | 4.3 | 1.5 | 2.8 | 90 | |
| Simulation B: (COCl)2 (1.1 eq., MW = 126.93 g mol−1), [Acid] = 0.4 M in THF | |||||||
| Reaction 5 | 96 | 82 | 8.0 | 1.6 | 6.4 | 90 | |
| Reaction 13 | 83 | 72 | 4.3 | 1.6 | 2.8 | 90 | |
| Simulation C: CDI (1.1 eq., MW = 162.15 g mol−1), [Acid] = 0.4 M in THF | |||||||
| Reaction 5 | 96 | 82 | 8.1 | 1.7 | 6.4 | 90 | |
| Reaction 13 | 83 | 72 | 4.4 | 1.6 | 2.8 | 90 | |
| Simulation D: DCC (1.1 eq., MW = 206.33 g mol−1), [Acid] = 0.4 M in THF | |||||||
| Reaction 5 | 96 | 82 | 8.3 | 1.9 | 6.4 | 90 | |
| Reaction 13 | 83 | 72 | 4.4 | 1.7 | 2.8 | 90 | |
| Simulation E: EDC (1.1 eq., MW = 191.70 g mol−1), [Acid] = 0.4 M in THF | |||||||
| Reaction 5 | 96 | 82 | 8.2 | 1.8 | 6.4 | 90 | |
| Reaction 13 | 83 | 72 | 4.4 | 1.6 | 2.8 | 90 | |
| Simulation F: PivCl (1.1 eq., MW = 120.58 g mol−1), [Acid] = 0.4 M THF | |||||||
| Reaction 5 | 96 | 82 | 8.0 | 1.6 | 6.4 | 90 | |
| Reaction 13 | 83 | 72 | 4.3 | 1.5 | 2.8 | 90 | |
| Simulation G: IBCF (1.1 eq., MW = 138.58 g mol−1), [Acid] = 0.4 M in THF | |||||||
| Reaction 5 | 96 | 82 | 8.0 | 1.6 | 6.4 | 90 | |
| Reaction 13 | 83 | 72 | 4.3 | 1.6 | 2.8 | 90 | |
| Simulation H: T3P (1.1 eq., MW = 318.18 g mol−1), [Acid] = 0.4 M in THF | |||||||
| Reaction 5 | 96 | 82 | 8.6 | 2.2 | 6.4 | 90 | |
| Reaction 13 | 83 | 72 | 4.6 | 1.8 | 2.8 | 90 | |


Looking at the best yielding reactions from the eight different coupling reagents for amide synthesis covered in this paper a number of trends become clear (Table 6). The overall yields are high which is expected from an optimised process – the best being quantitative and the worst 84% – allowing reliable comparison. However, in order to eliminate the concentration effect, the concentration of all reactions was again scaled to 0.4 M. The AEs are also high figures ranging from 97–83%. A slight spread appears in RME with a range of 96–67%. PMI has a range from 15.0–4.9 g g−1 which are relatively good results for a synthetic process. The highest and lowest PMIRRC are 3.3 & 1.8 g g−1, respectively. As mentioned previously PMIRRC is a small proportion of the overall metric but looking at Table 6 one would argue that the reaction with the lowest PMIRRC should therefore have the greenest potential irrespective of other factors which can influence selection. This would indicate thionyl chloride as being one of the best choices for amide coupling, which is actually in line with the OPRD review and supports the fact that thionyl chloride is by far one of the most popular choices for amide formation.29,30–32 This is besides metrics also due to other factors such as its low cost, ease of use and the gaseous by-products eliminating any extra separation step and again helping to reduce the cost of the process. Based on Table 6, PMIRRC alone seems to be a viable alternative to the full PMI calculation for reaction conditions selection (i.e., reagents). This would allow R&D chemists to truly see the advantages or disadvantages of a particular approach although concentration and solvent usage would need to be considered separately afterwards. The PMIRRC value is generally small compared to PMISolv and PMIWU, therefore using this figure to compare two or more coupling agents would highlight the chemistry, i.e. reagent(s) selected, with the greatest green potential to perform the specific reaction, e.g. amide synthesis from a carboxylic acid and an amine. If for example, conditions A & B where analysed and PMIRRC for B generates a lower value, it would indicate an inherent organic reaction-based improvement to the process of A.
| AE (%) | RME (%) | PMI (g g−1) | PMIRRC (g g−1) | PMISolv (g g−1) | Yield (%) | |
|---|---|---|---|---|---|---|
| a Reactions refer to Scheme 1. | ||||||
| Reaction 1 (SOCl2) | 97 | 87 | 5.7 | 1.8 | 3.9 | 92 |
| Reaction 3 ((COCl)2) | 95 | 79 | 12.2 | 3.2 | 9.0 | 91 |
| Reaction 5 (CDI) | 96 | 96 | 8.7 | 2.2 | 6.4 | 89 |
| Reaction 7 (DCC) | 91 | 77 | 6.7 | 2.1 | 4.5 | 86 |
| Reaction 9 (EDC) | 87 | 79 | 8.5 | 2.6 | 5.9 | 92 |
| Reaction 11 (PivCl) | 94 | 94 | 15.0 | 2.3 | 12.6 | 100 |
| Reaction 13 (IBCF) | 83 | 67 | 4.9 | 2.0 | 2.9 | 84 |
| Reaction 14 (T3P) | 96 | 81 | 8.1 | 3.3 | 4.7 | 88 |
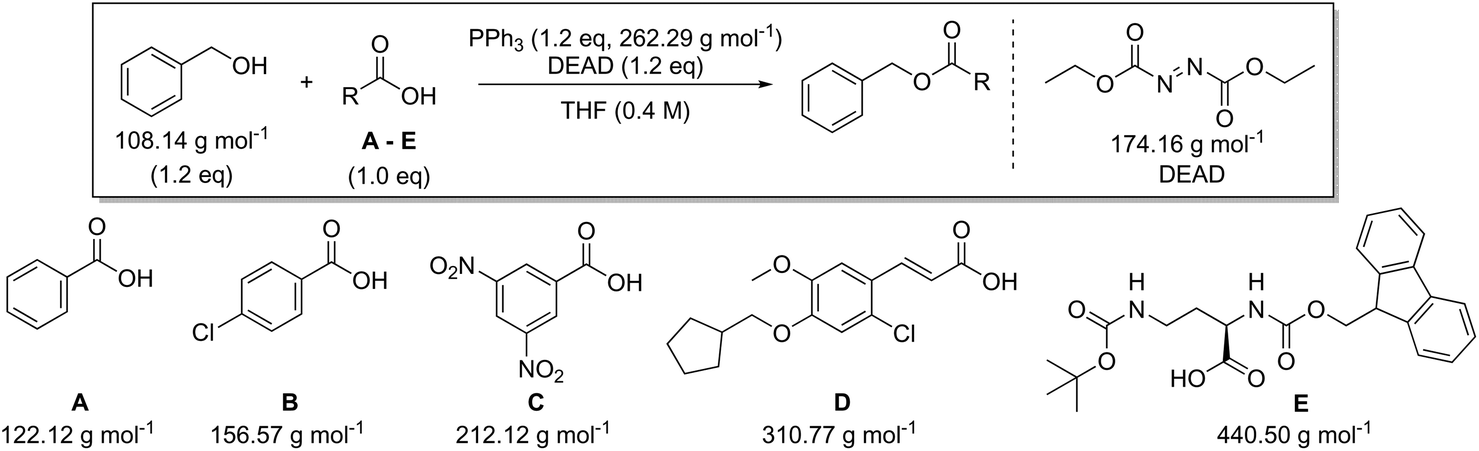
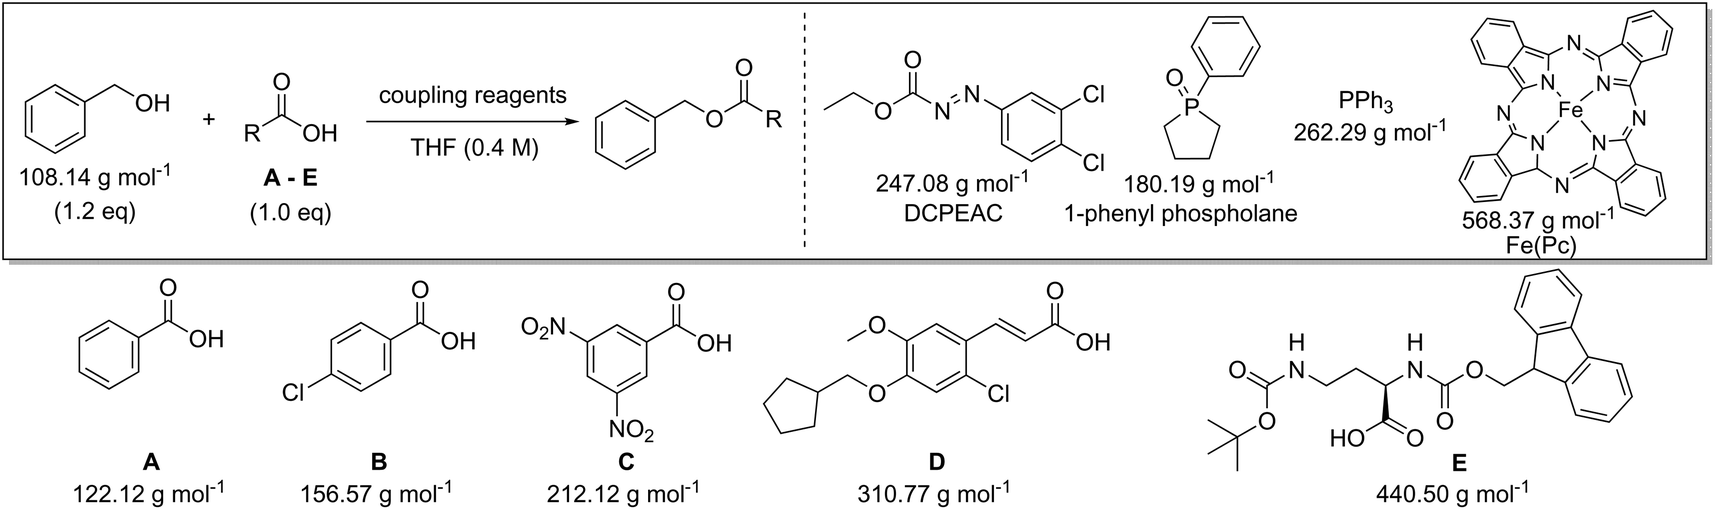
In addition to amide bond formation, we also investigated the viability of green chemistry metrics for the Mitsunobu esterification reaction, chosen because of its widespread use in pharmaceutical industry. Synthetic interest is based on its use for the selective inversion of a secondary alcohol's chirality while converting the functionality to an ester.35 It employs two stoichiometric coupling reagents (triphenylphosphine and diethyl azodicarboxylate) opposed to one in the previous case study. This makes it attractive for green metrics analysis as it allows us to evaluate the effect of multiple reagents on the parameters and to assess if our previous trends and observations are still valid, especially considering reagent variation was not found to have a major impact in amide synthesis. It is important to note that in the amide synthesis additives (mostly bases, nucleophilic activators) are often used which of course also belong to the reagent category for green metrics analysis. However, simulations with additives that are actually practically used, spanning a large difference in molecular weight, are not self-evident to identify here. Like before, the reaction conditions were inserted into the Chem21 Metrics Toolkit and a variety of simulations analysed (Table 7).22 Benzyl alcohol was coupled with several carboxylic acids (A–E) with molecular weights ranging from 122.12 to 440.50 g mol−1. The simulations considered variations in yield, concentration and excess of reagents as before. The full set of simulations for the Mitsunobu reaction can be found in the ESI section 3.† Comparison of the same reaction of benzyl alcohol with benzoic acid at the same concentration, but with varying yield is shown in Table 7 (simulations 1–4 carboxylic acid A). The PMI varies from 15.7 g g−1 to 28.3 g g−1 for a yield difference of 40%. Altering the concentration from 0.4 M to 0.8 M for 90% yield varies the PMI with a value of 5.8 g g−1 (simulations 1 and 6, carboxylic acid A). Yield and concentration therefore have a similar effect on the PMI/PMIRRC as observed in the amide coupling. Again, if one is not careful in the selection of the correct example to determine the greenness of a reaction, one could draw the conclusion that the coupling between benzyl alcohol and benzoic acid (A) with a PMI of 15.7 g g−1 is less favourable than the coupling between benzyl alcohol and an amino-protected ornithine (E) with a PMI of 6.9 g g−1 (Table 7, simulation 1) simulated at the same yield, concentration and reaction stoichiometry. However, this does not appreciate the green potential of the reaction itself as this difference in PMI is just dependent on the MW of the reactants as observed in amide coupling. This again highlights the potential pitfall when comparing the PMI of different sets of reactants for discovery purposes and how, based on the reactants being studied, a favourable PMI can be obtained.
|
|
||||||
|---|---|---|---|---|---|---|
| Carboxylic acid | AE (%) | RME (%) | PMI (g g−1) | PMIRRC (g g−1) | PMISolv (g g−1) | Yield (%) |
| Simulation 1: [Acid] = 0.4 M, yield = 90% | ||||||
| A | 92 | 76 | 15.7 | 4.1 | 11.6 | 90 |
| B | 93 | 78 | 13.7 | 3.6 | 10.0 | 90 |
| C | 94 | 80 | 11.4 | 3.2 | 8.2 | 90 |
| D | 96 | 82 | 8.8 | 2.7 | 6.2 | 90 |
| E | 97 | 84 | 6.9 | 2.3 | 4.7 | 90 |
| Simulation 2: [Acid] = 0.4 M, yield = 80% | ||||||
| A | 92 | 67 | 17.7 | 4.6 | 13.1 | 80 |
| B | 93 | 69 | 15.4 | 4.1 | 11.3 | 80 |
| C | 94 | 71 | 12.8 | 3.6 | 9.2 | 80 |
| D | 96 | 73 | 9.9 | 3.0 | 6.9 | 80 |
| E | 97 | 74 | 7.8 | 2.6 | 5.2 | 80 |
| Simulation 3: [Acid] = 0.4 M, yield = 70% | ||||||
| A | 92 | 59 | 20.2 | 5.2 | 15.0 | 70 |
| B | 93 | 60 | 17.6 | 4.7 | 12.9 | 70 |
| C | 94 | 62 | 14.6 | 4.1 | 10.5 | 70 |
| D | 96 | 64 | 11.4 | 3.4 | 7.9 | 70 |
| E | 97 | 65 | 8.9 | 2.9 | 6.0 | 70 |
| Simulation 4: [Acid] = 0.4 M, yield = 50% | ||||||
| A | 92 | 42 | 28.3 | 7.3 | 20.9 | 50 |
| B | 93 | 43 | 24.6 | 6.6 | 18.0 | 50 |
| C | 94 | 44 | 20.4 | 5.7 | 14.7 | 50 |
| D | 96 | 46 | 15.9 | 4.8 | 11.1 | 50 |
| E | 97 | 47 | 12.5 | 4.1 | 8.4 | 50 |
| Simulation 5: Scale reaction × 5: [Acid] = 0.4 M, yield = 90% | ||||||
| A | 92 | 76 | 15.7 | 4.1 | 11.6 | 90 |
| B | 93 | 78 | 13.7 | 3.6 | 10.0 | 90 |
| C | 94 | 80 | 11.4 | 3.2 | 8.2 | 90 |
| D | 96 | 82 | 8.8 | 2.7 | 6.2 | 90 |
| E | 97 | 84 | 6.9 | 2.3 | 4.7 | 90 |
| Simulation 6: [Acid] = 0.8 M, yield = 90% | ||||||
| A | 92 | 76 | 9.9 | 4.1 | 5.8 | 90 |
| B | 93 | 78 | 8.6 | 3.6 | 5.0 | 90 |
| C | 94 | 80 | 7.3 | 3.2 | 4.1 | 90 |
| D | 96 | 82 | 5.7 | 2.7 | 3.1 | 90 |
| E | 97 | 84 | 4.6 | 2.3 | 2.3 | 90 |
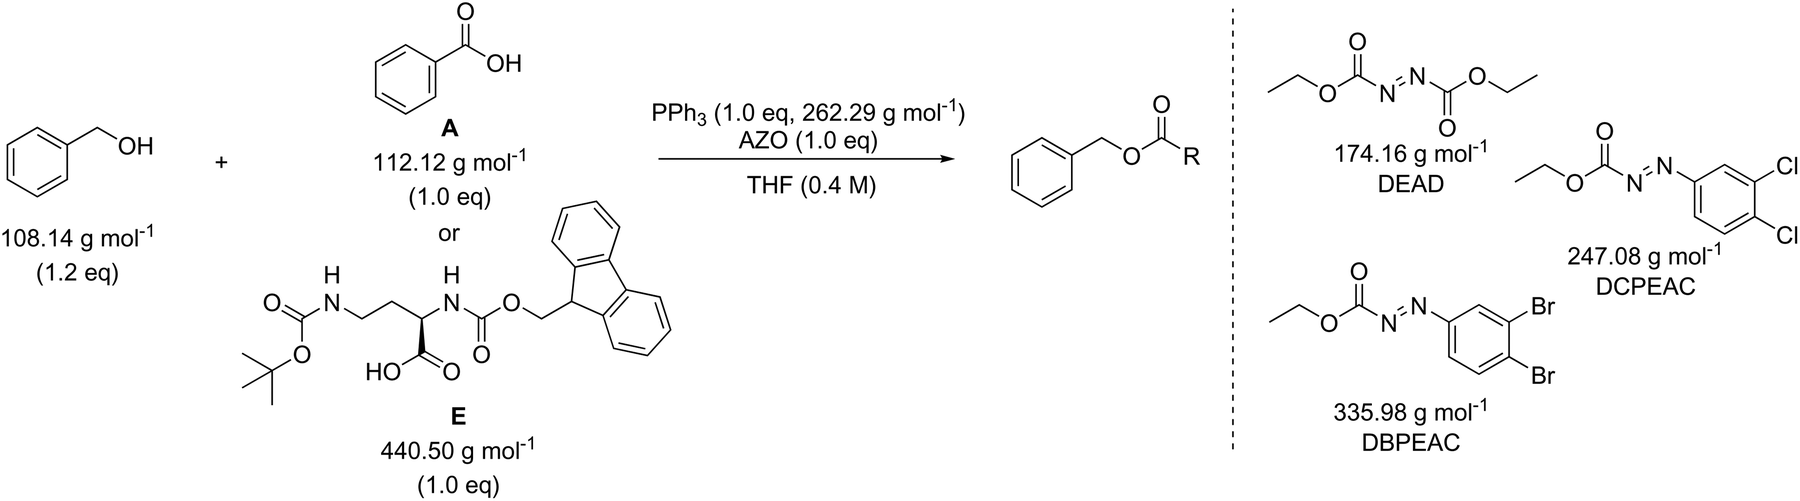
The effect of the molecular weight of the reagents for the coupling of benzyl alcohol with a low (benzoic acid, A) and high (amino-protected ornithine, E) molecular weight carboxylic acid was examined (Table 8). Triphenylphosphine (262.29 g mol−1) was combined with diethyl azodicarboxylate (DEAD, 174.16 g mol−1), ethyl 2-(2,3-dichlorophenyl)diazene-1-carboxylate (DCPEAC, 247.08 g mol−1) or ethyl 2-(2,3-dibromophenyl)diazene-1-carboxylate (DBPEAC, 335.98 g mol−1). Yield, concentration and excess reagent were again fixed in these simulations as before. The PMIRRC ranges from 4.1–5.1 g g−1 (A) and from 2.3–2.7 g g−1 (E) and the overall PMI from 15.7–16.7 g g−1 (A) and from 6.9–7.4 g g−1 (E). Similar to amide synthesis the effect on PMI/PMIRRC is more dependent on the reactants than the reagents, irrespective of the number of reagents used. When comparing two processes it intrinsically may be logical to assume the process employing only one reagent would perform more favourable than the process using two. This may not be the case when looking at PMI as only the mass is considered and the sum of two moderate weight reagents may actually be lower than the mass of one bulky metal complex!
|
|
||||||
|---|---|---|---|---|---|---|
| Carboxylic acid | AE (%) | RME (%) | PMI (g g−1) | PMIRRC (g g−1) | PMISolv (g g−1) | Yield (%) |
| Simulation 1: [Acid] = 0.4 M, yield = 90%, DEAD as coupling reagent | ||||||
| A | 92 | 76 | 15.7 | 4.1 | 11.6 | 90 |
| E | 97 | 84 | 6.9 | 2.3 | 4.7 | 90 |
| Simulation 2: [Acid] = 0.4 M, yield = 90%, DCPEAC as coupling reagent | ||||||
| A | 92 | 76 | 16.2 | 4.5 | 11.6 | 90 |
| E | 97 | 84 | 7.1 | 2.5 | 4.7 | 90 |
| Simulation 3: [Acid] = 0.4 M, yield = 90%, DBPEAC as coupling reagent | ||||||
| A | 92 | 76 | 16.7 | 5.1 | 11.6 | 90 |
| E | 97 | 84 | 7.4 | 2.7 | 4.7 | 90 |
Finally, we also evaluated the recent advances towards a catalytic Mitsunobu reaction36,37 and compared these with classical alcohol activation at the expense of stoichiometric phosphine an azodicarboxylate coupling reagents (Table 9). Recent studies recycle the required stoichiometric reagents in situ using terminal oxidants [di(acetoxy)iodobenzene,38,39 O2 with iron phthalocyanine40,41] and reductants (phenylsilane42). However, a stoichiometric reagent will always be required to allow the phosphine or azodicarboxylate components to be used in catalytic amounts. Therefore, any improvements in green metrics are explicitly linked to the nature of the terminal oxidants and reductants employed. For example, the highest PMIRRC is obtained in simulation 3 of Table 9, which can be explained by two equivalents of di(acetoxy)iodobenzene that are required for re-oxidation; thereby generating a large amount of waste. In contrast with O2 and catalytic iron phthalocyanine a lower PMIRRC is obtained (simulation 2). In order to improve the PMI, Aldrich and Taniguchi reported a protocol that is catalytic in both phosphine (1-phenylphospholane-1-oxide) and azocarboxylate employing phenylsilane reductant to recycle the phosphine catalyst and iron-phthalocyanine/O2 oxidant to regenerate the azocarboxylate.42,43 Pleasingly the PMIRCC is indeed lower than for the stoichiometric coupling (simulations 1 and 5, Table 9).
|
|
||||||
|---|---|---|---|---|---|---|
| Carboxylic acid | AE (%) | RME (%) | PMI (g g−1) | PMIRRC (g g−1) | PMISolv (g g−1) | Yield (%) |
| Simulation 1: Stoichiometric coupling reagents [PPh3 (1.2 eq.), DCPEAC (1.2 eq.)] | ||||||
| A | 92 | 76 | 16.2 | 4.5 | 11.6 | 90 |
| B | 93 | 78 | 14.1 | 4.0 | 10.0 | 90 |
| C | 94 | 80 | 11.7 | 3.5 | 8.2 | 90 |
| D | 96 | 82 | 9.1 | 2.9 | 6.2 | 90 |
| E | 97 | 84 | 7.1 | 2.5 | 4.7 | 90 |
| Simulation 2: Catalytic in azodicarboxylate coupling reagent [PPh3 (1.2 eq.), DCPEAC (0.1 eq.), Fe(Pc) (0.1 eq.), O2] | ||||||
| A | 92 | 76 | 15.0 | 3.4 | 11.6 | 90 |
| B | 93 | 78 | 13.1 | 3.1 | 10.0 | 90 |
| C | 94 | 80 | 10.9 | 2.7 | 8.2 | 90 |
| D | 96 | 82 | 8.5 | 2.3 | 6.2 | 90 |
| E | 97 | 84 | 6.7 | 2.0 | 4.7 | 90 |
| Simulation 3: Catalytic in azodicarboxylate coupling reagent [PPh3 (1.2 eq.), DCPEAC (0.1 eq.), PhI(OAc)2 (2.0 eq.)] | ||||||
| A | 92 | 76 | 18.1 | 6.5 | 11.6 | 90 |
| B | 93 | 78 | 15.7 | 5.7 | 10.0 | 90 |
| C | 94 | 80 | 13.1 | 4.9 | 8.2 | 90 |
| D | 96 | 82 | 10.1 | 4.0 | 6.2 | 90 |
| E | 97 | 84 | 7.9 | 3.3 | 4.7 | 90 |
| Simulation 4: Catalytic in phosphine coupling reagent [1-phenyl phospholane (0.1 eq.), DCPEAC (1.2 eq.), PhSiH3 (1.1 eq.)] | ||||||
| A | 92 | 76 | 15.2 | 3.6 | 11.6 | 90 |
| B | 93 | 78 | 13.3 | 3.3 | 10.0 | 90 |
| C | 94 | 80 | 11.0 | 2.9 | 8.2 | 90 |
| D | 96 | 82 | 8.6 | 2.4 | 6.2 | 90 |
| E | 97 | 84 | 6.8 | 2.1 | 4.7 | 90 |
| Simulation 5: ‘Fully catalytic’ [PPh3 (0.1 eq.), DCPEAC (0.1 eq.), Fe(Pc) (0.1 eq.), O2, PhSiH3 (1.1 eq.)] | ||||||
| A | 92 | 76 | 14.1 | 2.5 | 11.6 | 90 |
| B | 93 | 78 | 12.3 | 2.3 | 10.0 | 90 |
| C | 94 | 80 | 10.2 | 2.1 | 8.2 | 90 |
| D | 96 | 82 | 8.0 | 1.8 | 6.2 | 90 |
| E | 97 | 84 | 6.3 | 1.7 | 4.7 | 90 |
Conclusions
In this study into mass-based metrics, we have highlighted the potential pitfalls of introducing metric targets to select an optimal synthetic procedure at discovery level. By evaluating the green potential of amide bond forming and Mitsunobu reactions, it has been illustrated that process mass intensity (PMI, or PMIRRC) can be used as a very effective metric for reagents selection. However, one needs to take care when comparing different reactions with respect to green metrics. Different simulations have highlighted how PMI results could be misleading when comparing values at bench scale without a due consideration of all the relevant parameters. In order to make a more accurate comparison between different procedures, the yield, concentration (unless PMIRCC is considered) and the difference in molecular weights of the reactants should be as close as practically possible. Of course not all protocols will practically allow certain transformations to be performed at the same concentration. Interestingly, our results show that the effect of the molecular weight of the applied reagent is rather limited. Practically, when researchers want to benchmark their synthetic method with existing literature for the same reaction, it is extremely important to be very careful in the selection of the examples used for comparison as difference in PMI should not reflect the difference in molecular weight of the reactants/products used for comparative analysis, but rather identify which methodologies have the greatest green potential. As such, those methodologies should be focused on for optimisation in a discovery context and not abandoned due to initial poor data obtained from the bench or from the literature, avoiding a fair green metrics comparison. Easy to perform simulations are crucial in this respect as highlighted in this work. Since the synthetic community moves towards greener approaches for the synthesis of industrially relevant compounds, our study may serve as a good guide to correctly apply PMI as an effective discovery level metric. One should of course still bear in mind that additional qualitative factors, as stated in the original Chem21 toolkit paper,22 also need to be taken into consideration such as elemental sustainability, renewability, and health and safety of reagents/reactants/solvents. Though PMI is an important metric, no metric should be assessed in isolation, but rather in a holistic manner to assess the overall green credentials of a synthetic methodology.The findings of this paper have been applied in a review discussing different thiosulfonate syntheses.44 Here incorporation of the green credentials of the synthetic procedures towards thiosulfonates allows to judge the merits of the state of the art, beyond the typical yield of a product and availability of the reactants.
Conflicts of interest
The authors declare no conflicts of interest.Acknowledgements
This research was financially supported by the University of Antwerp (BOF), the Hercules and Francqui Foundation, the Research Foundation Flanders (FWO) (Research Project, Scientific Research Community, BioFact Excellence of Science project Grant no. 30902231) and the Innovative Medicines Initiative (http://www.imi.europa.eu) Joint Undertaking under grant agreement no. 115360, resources of which are composed of the financial contribution from the European Union's Seventh Framework Programme (FP7/2007-2013) and EFPIA companies in kind contribution.References
- R. A. Sheldon, Chem. Ind., 1997, 12–15 CAS.
- R. A. Sheldon, Green Chem., 2007, 9, 1273–1283 RSC.
- Green Techniques for Organic Synthesis and Medicinal Chemistry, ed. W. Zhang and B. W. Cue, Wiley, 2nd edn, 2012 Search PubMed.
- D. J. C. Constable, A. D. Curzons and V. L. Cunningham, Green Chem., 2002, 4, 521–527 RSC.
- J. A. Glaser, Clean Technol. Environ. Policy, 2009, 11, 371 CrossRef CAS.
- P. J. Dunn, Chem. Soc. Rev., 2012, 41, 1452–1461 RSC.
- D. J. C. Constable, P. J. Dunn, J. D. Hayler, G. R. Humphrey, J. J. L. Leazer, R. J. Linderman, K. Lorenz, J. Manley, B. A. Pearlman, A. Wells, A. Zaks and T. Y. Zhang, Green Chem., 2007, 9, 411–420 RSC.
- B. Trost, Science, 1991, 254, 1471–1477 CrossRef CAS PubMed.
- R. A. Sheldon, Chem. Tech., 1994, 24, 38–47 CAS.
- A. D. Curzons, D. J. C. Constable, D. N. Mortimer and V. L. Cunningham, Green Chem., 2001, 3, 1–6 RSC.
- C. Jimenez-Gonzalez, C. S. Ponder, Q. B. Broxterman and J. B. Manley, Org. Process Res. Dev., 2011, 15, 912–917 CrossRef CAS.
- C. Jiménez-González, C. Ollech, W. Pyrz, D. Hughes, Q. B. Broxterman and N. Bhathela, Org. Process Res. Dev., 2013, 17, 239–246 CrossRef.
- C. Jiménez-González, D. J. Constable, A. D. Curzons and V. L. Cunningham, Clean Technol. Environ. Policy, 2002, 4, 44–53 CrossRef.
- C. Jiménez-González, D. J. C. Constable and C. S. Ponder, Chem. Soc. Rev., 2012, 41, 1485–1498 RSC.
- G. J. Ruiz-Mercado, R. L. Smith and M. A. Gonzalez, Ind. Eng. Chem. Res., 2012, 51, 2309–2328 CrossRef CAS.
- M. G. T. C. Ribeiro and A. A. S. C. Machado, Green Chem. Lett. Rev., 2013, 6, 1–18 CrossRef CAS.
- F. I. McGonagle, H. F. Sneddon, C. Jamieson and A. J. B. Watson, ACS Sustainable Chem. Eng., 2014, 2, 523–532 CrossRef CAS.
- L. Summerton and A. Constandinou, Beyond Mass-based Metrics: Evaluating the Greenness of Your Reaction in Green and Sustainable Medicinal Chemistry: Methods, Tools and Strategies for the 21st Century Pharmaceutical Industry, The Royal Society of Chemistry, 2016, pp. 41–53 Search PubMed.
- F. Roschangar, R. A. Sheldon and C. H. Senanayake, Green Chem., 2015, 17, 752–768 RSC.
- F. Roschangar, J. Colberg, P. J. Dunn, F. Gallou, J. D. Hayler, S. G. Koenig, M. E. Kopach, D. K. Leahy, I. Mergelsberg, J. L. Tucker, R. A. Sheldon and C. H. Senanayake, Green Chem., 2017, 19, 281–285 RSC.
- F. Roschangar, Y. Zhou, D. J. C. Constable, J. Colberg, D. P. Dickson, P. J. Dunn, M. D. Eastgate, F. Gallou, J. D. Hayler, S. G. Koenig, M. E. Kopach, D. K. Leahy, I. Mergelsberg, U. Scholz, A. G. Smith, M. Henry, J. Mulder, J. Brandenburg, J. R. Dehli, D. R. Fandrick, K. R. Fandrick, F. Gnad-Badouin, G. Zerban, K. Groll, P. T. Anastas, R. A. Sheldon and C. H. Senanayake, Green Chem., 2018, 20, 2206–2211 RSC.
- C. R. McElroy, A. Constantinou, L. C. Jones, L. Summerton and J. H. Clark, Green Chem., 2015, 17, 3111–3121 RSC.
- S. Abou-Shehada, P. Mampuys, B. U. W. Maes, J. H. Clark and L. Summerton, Green Chem., 2017, 19, 249–258 RSC.
- C. Levallet, J. Lerpiniere and S. Y. Ko, Tetrahedron, 1997, 53, 5291–5304 CrossRef CAS.
- S. K. Hamilton, D. E. Wilkinson, G. S. Hamilton and Y.-Q. Wu, Org. Lett., 2005, 7, 2429–2431 CrossRef CAS PubMed.
- P. Mampuys, Y. Zhu, T. Vlaar, E. Ruijter, R. V. A. Orru and B. U. W. Maes, Angew. Chem., Int. Ed., 2014, 53, 12849–12854 CrossRef CAS PubMed.
- D. P. Kjell, I. A. Watson, C. N. Wolfe and J. T. Spitler, Org. Process Res. Dev., 2013, 17, 169–174 CrossRef CAS.
- W. J. W. Watson, Green Chem., 2012, 14, 251–259 RSC.
- S. D. Roughley and A. M. Jordan, J. Med. Chem., 2011, 54, 3451–3479 CrossRef CAS.
- R. M. de Figueiredo, J.-S. Suppo and J.-M. Campagne, Chem. Rev., 2016, 116, 12029–12122 CrossRef CAS PubMed.
- J. R. Dunetz, J. Magano and G. A. Weisenburger, Org. Process Res. Dev., 2016, 20, 140–177 CrossRef CAS.
- K. Hollanders, B. U. W. Maes and S. Ballet, Synthesis, 2019, 51, 2261–2277 CrossRef CAS.
- M. T. Sabatini, L. T. Boulton, H. F. Sneddon and T. D. Sheppard, Nat. Catal., 2019, 2, 10–17 CrossRef CAS.
- http://learning.chem21.eu/process-design/-/introduction-to-process-engineering/what-is-scale-up .
- S. Fletcher, Org. Chem. Front., 2015, 2, 739–752 RSC.
- R. H. Beddoe, H. F. Sneddon and R. M. Denton, Org. Biomol. Chem., 2018, 16, 7774–7781 RSC.
- D. Hirose, M. Gazvoda, J. Košmrlj and T. Taniguchi, Chem. Sci., 2016, 7, 5148–5159 RSC.
- T. Y. S. But and P. H. Toy, J. Am. Chem. Soc., 2006, 128, 9636–9637 CrossRef CAS.
- T. Y. S. But, J. Lu and P. H. Toy, Synlett, 2010, 1115–1117 CAS.
- D. Hirose, T. Taniguchi and H. Ishibashi, Angew. Chem., Int. Ed., 2013, 52, 4613–4617 CrossRef CAS PubMed.
- O2 has been neglected in the PMI calculations given its low molecular weight. It is the most abundant and sustainable oxidant on earth yielding water as a by-product also justifying its omission from the calculations. For a review describing important parameters when using O2, see: H. Sterckx, B. Morel and B. U. W. Maes, Angew. Chem., Int. Ed., 2019, 58, 7946–7970 CrossRef CAS.
- J. A. Buonomo and C. C. Aldrich, Angew. Chem., Int. Ed., 2015, 54, 13041–13044 CrossRef CAS.
- D. Hirose, M. Gazvoda, J. Košmrlj and T. Taniguchi, Org. Lett., 2016, 18, 4036–4039 CrossRef CAS.
- P. Mampuys, C. R. McElroy, J. H. Clark, R. V. A. Orru and B. U. W. Maes, Adv. Synth. Catal., 2009 DOI:10.1002/adsc.201900864.
Footnotes |
| † Electronic supplementary information (ESI) available: Appendix 1: summary of experimental procedures and green metrics calculations; appendix 2: spread sheet metrics calculations for amide synthesis; appendix 3: spread sheet metrics calculations for Mitsunobu synthesis. See DOI: 10.1039/c9gc01537j |
| ‡ These authors contributed equally. |
| This journal is © The Royal Society of Chemistry 2020 |