Dietary supplementation with aromatic amino acids decreased triglycerides and alleviated hepatic steatosis by stimulating bile acid synthesis in mice†
Qingquan
Ma‡
 ,
Jiayi
Chen‡
,
Xinbo
Zhou
,
Linlin
Hu
,
Yuchen
Sun
,
Zhishen
Wang
,
Zhiyuan
Yue
and
Anshan
Shan
*
,
Jiayi
Chen‡
,
Xinbo
Zhou
,
Linlin
Hu
,
Yuchen
Sun
,
Zhishen
Wang
,
Zhiyuan
Yue
and
Anshan
Shan
*
Institute of Animal Nutrition, Northeast Agricultural University, Harbin, 150030, China. E-mail: asshan@neau.edu.cn; mqqwill@163.com; Fax: +86 451 55103336; Tel: +86 451 55190685
First published on 10th December 2020
Abstract
Emerging evidence shows that amino acids can modulate lipid metabolism. Aromatic amino acids (AAAs) serve as important precursors of several neurotransmitters and metabolic regulators that play a vital role in regulating nutrient metabolism. But whether AAAs have a lipid-lowering function remains unknown. Here mice were fed amino acid-defined diets containing AAAs at 1.82% and 3.64% for 3 weeks. We demonstrated that double AAA intake significantly decreased the serum and hepatic triglycerides and serum low-density lipoprotein cholesterol, but increased the high-density lipoprotein cholesterol as well as insulin tolerance. Combined metabolomic and transcriptomic analysis showed that the hepatic acidic pathway of bile acid synthesis was responsible for the improvement in lipid metabolism by AAA treatment. This study suggests that AAAs have the potential to ameliorate steatosis and provides a new alternative to improve lipid metabolism.
Introduction
Dysregulation of lipid metabolism has been shown to be associated with a series of lifestyle-related diseases, and may cause metabolic syndromes such as obesity and insulin resistance.1 In recent years, the concept of functional amino acids has been proposed because of the functional diversity in the regulation of many metabolic pathways involving health, growth, and development.2,3 For example, dietary supplementation with amino acids, such as leucine, isoleucine, and arginine, markedly decreased white adipose tissue weight and circulating triglyceride and low density lipoprotein cholesterol levels, and ameliorated dyslipidaemia.4–6Aromatic amino acids (AAAs), including phenylalanine, tryptophan, and tyrosine, are amino acids that have an aromatic ring in the side chain. Phenylalanine and tryptophan are essential amino acids for animals while tyrosine is a semi-essential amino acid and is derived from phenylalanine. Growing evidence shows that AAAs are not only the building blocks of proteins but they also play a regulatory role in other biological processes. For example, AAAs serve as precursors to the biosynthesis of neurological compounds, and biosynthesis and degradation of AAAs often act as the starting point for many secondary metabolites.7 Besides, tryptophan supplementation decreased the serum levels of lipids, cholesterol, and low-density lipoprotein in rats8 and resulted in significant decreases in hepatic lipids, in particular triglycerides, in chicks.9,10 Moderate intake of tryptophan affected fatty acid and triglyceride metabolism under physiological conditions.11L-Phenylalanine treatment chronically reduced food intake and body weight in mice with diet-induced obesity, and also stimulated insulin release and improved glucose tolerance in rats.12 In contrast, however, elevated blood concentrations of AAAs are also observed in obesity.13 Whether AAA repletion is beneficial to lipid metabolism remains unknown.
In this study, an amino acid-defined diet was used to investigate the effect of extra supplementation of AAA on lipid profiles and metabolism accompanied by transcriptome and metabolome analyses for the possible mechanism.
Materials and methods
Experimental animals and diets
All animal procedures were performed in accordance with the Guidelines for Care and Use of Laboratory Animals of the Northeast Agricultural University, and experiments were approved by the Animal Welfare Committee of the university. Male C57BL/6J mice were purchased from HFK Co. Ltd (Beijing, China) at 4 weeks of age and housed individually in plastic rodent cages at 22–24 °C on a 12 h light/dark cycle. After 1 week of acclimation, mice were weighed and randomly assigned (10 mice per group) to the following amino acid-defined diets containing proportional AAA (tryptophan![[thin space (1/6-em)]](https://www.rsc.org/images/entities/char_2009.gif) :
:![[thin space (1/6-em)]](https://www.rsc.org/images/entities/char_2009.gif) tyrosine
tyrosine![[thin space (1/6-em)]](https://www.rsc.org/images/entities/char_2009.gif) :
:![[thin space (1/6-em)]](https://www.rsc.org/images/entities/char_2009.gif) phenylalanine = 2.0
phenylalanine = 2.0![[thin space (1/6-em)]](https://www.rsc.org/images/entities/char_2009.gif) :
:![[thin space (1/6-em)]](https://www.rsc.org/images/entities/char_2009.gif) 8.4
8.4![[thin space (1/6-em)]](https://www.rsc.org/images/entities/char_2009.gif) :
:![[thin space (1/6-em)]](https://www.rsc.org/images/entities/char_2009.gif) 7.8) with a dose of 1.82% (control diet, CD) and 3.64% (CD with extra AAA, CDA). The two diets were isonitrogenous and isoenergetic. In order to make both diets isonitrogenous and minimize the impact of other amino acids, extra nitrogen was balanced by supplementing with amino acid mixtures other than AAA in the CD group (Table 1). The animals had free access to food and water. Body weight and food intake were recorded weekly and average calorie intake was calculated by food intake. The experiment lasted for 3 weeks.
7.8) with a dose of 1.82% (control diet, CD) and 3.64% (CD with extra AAA, CDA). The two diets were isonitrogenous and isoenergetic. In order to make both diets isonitrogenous and minimize the impact of other amino acids, extra nitrogen was balanced by supplementing with amino acid mixtures other than AAA in the CD group (Table 1). The animals had free access to food and water. Body weight and food intake were recorded weekly and average calorie intake was calculated by food intake. The experiment lasted for 3 weeks.
| Amino acid defined diets | CD (1.82% AAA) | CDA (3.64% AAA) |
|---|---|---|
| The amino acid-defined diets contain proportional AAA with a dose of 1.82% (control diet, CD), and 3.64% (control diet with extra AAA, CDA). | ||
| Formula | g kg−1 | g kg−1 |
| L-Alanine | 4.0 | 3.6 |
| L-Arginine HCl | 6.6 | 5.9 |
| L-Asparagine | 5.0 | 4.4 |
| L-Aspartic acid | 11.0 | 9.8 |
| L-Cystine | 3.2 | 2.8 |
| L-Glutamic acid | 32.6 | 29.0 |
| L-Glutamine | 10.8 | 9.6 |
| Glycine | 2.8 | 2.5 |
| L-Histidine HCl, monohydrate | 4.2 | 3.7 |
| L-Lysine HCl | 15.6 | 13.9 |
| L-Methionine | 4.2 | 3.7 |
| L-Proline | 16.4 | 14.6 |
| L-Serine | 8.6 | 7.6 |
| L-Threonine | 6.6 | 5.9 |
| L-Isoleucine | 7.6 | 6.8 |
| L-Leucine | 14.6 | 13.0 |
| L-Valine | 9.0 | 8.0 |
| L-Tryptophan | 2.0 | 4.0 |
| L-Tyrosine | 8.4 | 16.8 |
| L-Phenylalanine | 7.8 | 15.6 |
| Sucrose | 304.5 | 304.5 |
| Corn starch | 302.0 | 302.0 |
| Maltodextrin | 75.0 | 75.0 |
| Vitamin Mix | 10.0 | 10.0 |
| Mineral Mix, AIN-93 | 35.0 | 35.0 |
| Choline bitartrate (41.1% choline; g kg−1) | 2.5 | 2.5 |
| Lard | 40.0 | 40.0 |
| Cellulose | 50.0 | 50.0 |
| % kcal from | ||
| Protein | 18.8 | 18.8 |
| Carbohydrates | 71.8 | 71.8 |
| Fat | 9.4 | 9.4 |
| kcal g−1 | 3.8 | 3.8 |
Glucose tolerance test (GTT) and insulin tolerance test (ITT)
GTT and ITT were conducted after two weeks of AAA intervention. GTT and ITT were performed by i.p. injection of 2 g kg−1 glucose after overnight fasting and 0.75 units per kg insulin after 4 h fasting, respectively. Blood was sampled from the tail vein and glucose concentrations in the mice were measured at 0 min, 15 min, 30 min, 60 min, and 120 min after injection of glucose or insulin using a glucose meter (On Call, Hangzhou, China).Collection of blood and tissue samples
At the end of the experiment, the mice were anesthetized with ether after 12 h of fasting. Blood samples were collected from mice orbit and centrifuged at 3000g for 15 min, and stored at −80 °C until analysis. The mice were anesthetized and then sacrificed by cervical dislocation. The liver and white adipose tissue (WAT) were removed and weighed. Some part of the tissues was fixed in 4% paraformaldehyde for histological observation, and the remaining tissues were rapidly frozen in liquid nitrogen and stored at −80 °C until use.Biochemical analysis in serum and liver
Serum levels of total cholesterol (TC), triglycerides (TG), high-density lipoprotein cholesterol (HDL-C), low-density lipoprotein cholesterol (LDL-C), glucose (GLU), non-esterified fatty acids (NEFA), blood urea nitrogen (BUN), total bile acids (TBA), alkaline phosphatase (AKP), and liver levels of TG were determined using commercial diagnostic kits (Nanjing Jiancheng Bioengineering Institute, Nanjing, China).Histological examination
Histological examination was carried out using the HE staining method. The liver samples were fixed in 10% neutral buffered formalin for approximately 6 h and dehydrated before embedding in paraffin wax. Sections were cut into 5 μm slices and mounted on polylysine-handled glass slides, and HE staining was performed. Then the images were captured by using a microscope (BX46 and BX53 OLYMPUS, Japan) and a microscope camera system (sc-180 and DP73 OLYMPUS, Japan).Untargeted metabolomic analysis and data processing
We took 100 mg of the liver sample (six statements for each group), added 10 times the volume of pre-cooled 90% methanol, frozen with liquid nitrogen, and homogenized and crushed with an MP homogenizer. Then we performed cryogenic ultrasound, stewing, and centrifugation, and obtained the supernatant. Then 100 μL of acetonitrile aqueous solution (acetonitrile![[thin space (1/6-em)]](https://www.rsc.org/images/entities/char_2009.gif) :
:![[thin space (1/6-em)]](https://www.rsc.org/images/entities/char_2009.gif) water = 1
water = 1![[thin space (1/6-em)]](https://www.rsc.org/images/entities/char_2009.gif) :
:![[thin space (1/6-em)]](https://www.rsc.org/images/entities/char_2009.gif) 1, v/v) was added to reconstitute, vortexed, and centrifuged for 15 min at 14
1, v/v) was added to reconstitute, vortexed, and centrifuged for 15 min at 14![[thin space (1/6-em)]](https://www.rsc.org/images/entities/char_2009.gif) 000g at 4 °C. The supernatant was collected for mass spectrometry.14 The samples were separated using Agilent 1290 Infinity LC Ultra High Performance Liquid Chromatography System (UHPLC) HILIC column.15 Electrospray ionization (ESI) positive and negative ion modes were used for detection, and a Triple TOF 6600 mass spectrometer (AB SCIEX) was used for mass spectrometry analysis. After the data was preprocessed by Pareto scaling,16 multi-dimensional statistical analysis was performed, including unsupervised principal component analysis (PCA), supervised partial least squares discriminant analysis (PLS-DA) and orthogonal partial least squares discriminant analysis (OPLS-DA). The single-dimensional statistical analysis included Student's t-test and multiple analysis of variance, and R software was used to draw the volcano maps. Kyoto Encyclopedia of Genes and Genomes (KEGG) analysis was performed to evaluate the enrichment of the metabolites in the different pathways.
000g at 4 °C. The supernatant was collected for mass spectrometry.14 The samples were separated using Agilent 1290 Infinity LC Ultra High Performance Liquid Chromatography System (UHPLC) HILIC column.15 Electrospray ionization (ESI) positive and negative ion modes were used for detection, and a Triple TOF 6600 mass spectrometer (AB SCIEX) was used for mass spectrometry analysis. After the data was preprocessed by Pareto scaling,16 multi-dimensional statistical analysis was performed, including unsupervised principal component analysis (PCA), supervised partial least squares discriminant analysis (PLS-DA) and orthogonal partial least squares discriminant analysis (OPLS-DA). The single-dimensional statistical analysis included Student's t-test and multiple analysis of variance, and R software was used to draw the volcano maps. Kyoto Encyclopedia of Genes and Genomes (KEGG) analysis was performed to evaluate the enrichment of the metabolites in the different pathways.
Transcriptomic analysis and data processing
The RNA concentration was measured using Qubit®RNA Assay Kit in Qubit®2.0 Flurometer (Life Technologies, CA, USA). RNA integrity was assessed using the RNA Nano 6000Assay Kit of the Bioanalyzer 2100 system (Agilent Technologies, CA, USA). The sequencing libraries were generated using NEBNext®UltraTM RNA Library Prep Kit for Illumina® (NEB, USA) following the manufacturer's recommendations, and index codes were added to attribute the sequences to each sample. Briefly, mRNA was purified from total RNA using poly-T oligo-attached magnetic beads. Fragmentation was carried out using divalent cations under elevated temperature in the NEBNext First Strand Synthesis Reaction Buffer (5×). The first strand cDNA was synthesized using a random hexamer primer and M-MuLV Reverse Transcriptase (RNase H-). The second strand cDNA synthesis was subsequently performed using DNA Polymerase I and RNase H. The remaining overhangs were converted into blunt ends via exonuclease/polymerase activities. After adenylation of the 3′ ends of the DNA fragments, the NEBNext Adaptor with hairpin loop structures was ligated to prepare for hybridization. In order to select the cDNA fragments preferably of 250–300 bp in length, the library fragments were purified with AMPure XP system (Beckman Coulter, Beverly, USA). Then 3 μl of USER Enzyme (NEB, USA) was used with size-selected, adaptor-ligated cDNA at 37 °C for 15 min followed by 5 min at 95 °C before PCR. Then PCR was performed with Phusion High-Fidelity DNA polymerase, Universal PCR primers and Index (X) Primer. Finally, PCR products were purified (AMPure XP system) and library quality was assessed on the Agilent Bioanalyzer 2100 system. The data were analysed by gene ontology (GO) enrichment and KEGG enrichment analysis of differentially expressed genes.Quantitative real-time PCR analysis
Total RNA was extracted from the liver using Trizol reagent (Thermo Fisher Scientific, MA, USA) and reverse-transcribed into the cDNA using a cDNA kit (Takara, Dalian, China). Real-time PCR was performed by using the ABI PRISM 7500 SDS thermal cycler apparatus (Applied Biosystems, CA, USA) using the cDNA templates, specific primers and the SYBR Green qPCR Master Mix (Takara, Dalian, China). Calculations were performed using a comparative method (2−ΔΔCt), and β-actin was used as the internal control. The primer sequences for each gene are shown in Table 2.| Gene | Gene Bank ID | Forward sequence (5′–3′) | Reverse sequence (5′–3′) |
|---|---|---|---|
| Abbreviations used: Fas, fatty acid synthase; Acc, acetyl CoA carboxylase; Atgl, adipose triglyceride lipase; Hsl, hormone-sensitive lipase; Ampk, adenosine monophosphate-activated protein kinase; Sirt1, Sirtuin1; Pgc1, peroxisome proliferator activated receptor γ co-activator 1α; Cyp7a1, cholesterol 7α-hydroxylase; Cyp27a1, sterol 27-hydroxylase; Cyp7b1, oxysterol 7α-hydroxylase; Fxr (Nr1h4), farnesoid X receptor; Shp (Nr0b2), short heterodimer partner; Srebp1, sterol regulatory element-binding protein 1; Ntcp (Slc10a1), Na+-taurocholate cotransport peptide; Bsep (Abcb11), bile salt export pump; Oatp3 (Slco1a5), organic anion-transporting polypeptide 3; Oat2 (Slc22a7), organic anion transporter 2. | |||
| β-Actin | XM_021187106.2 | CAGGCATTGCTGACAGGATG | TGCTGATCCACATCTGCTGG |
| Fas | NM_001146708.1 | TGCTTGCTGGCTCACAGTTA | ATCAGTTTCACGAACCCGCC |
| Acc | XM_006531957.3 | GGAGGAGGAGGGAAAGGGAT | CTCCCCAAGGAGATACCCCA |
| Atgl | NM_001163689.1 | TGCAGCACATTTATCCCGGT | CTCTTCCTGGGGGACAACTG |
| Hsl | XM_029479277.1 | GGTGACACTCGCAGAAGAC | GATGGCAGGTGTGAACTGGA |
| Ampk | NM_001355640.1 | CTACCTAGCAACCAGCCCAC | ACGTCTGAGGGCTTTCCTTG |
| Sirt1 | NM_001159589.2 | GAGCTGGGGTTTCTGTCTCC | CTGCAACCTGCTCCAAGGTA |
| Pgc1 | NM_008904.2 | AGCACGAAAGGCTCAAGAGG | CGGCGCTCTTCAATTGCTTT |
| Cyp7a1 | NM_007824.3 | AGCAGCCTCTGAAGAAGTGAATGG | AGAGCCGCAGAGCCTCCTTG |
| Cyp27a1 | NM_024264.5 | CACCGATGGCTGAGGAAGAAAGAG | ACCCAGGCAAGACCGAACCC |
| Cyp7b1 | NM_007825.4 | AGCCCTGCGTGACGAAATTGAC | GAGCACAGCCTCAGAACCTCAAG |
| Fxr | NM_001163504.1 | ACAGAGAGGCGGTGGAGAAGC | TCAGCGTGGTGATGGTTGAATGTC |
| Shp | NM_011850.3 | TCTCTTCCTGCTGGGGTTGGC | ACCGCTGCTGGCTTCCTCTAG |
| Srebp1 | NM_001276707.1 | GCGGTTGGCACAGAGCTTCC | CCTCCTCCTCAGACTGCGATCC |
| Ntcp | NM_001177561.1 | CCCTAATGGCCTGAACTCT | CTGCTGTTGAAGGTTTGCT |
| Bsep | NM_001363492.1 | GTTCACGGAGCTTGAGTTG | AAAAGCAGCCACTGTTCG |
| Oatp3 | NM_001267707.1 | CCAGCGAGAACACCATTT | GAAAAGCATCTGACCCCAT |
| Oat2 | NM_144856.2 | GCGGTTGGCACAGAGCTTCC | CCTCCTCCTCAGACTGCGATCC |
Statistical analysis
All the data were expressed as means ± SEM. A two-tailed unpaired Student's t-test was carried out for all comparisons using SPSS software (Chicago, USA). A P value < 0.05 was considered statistically significant.Results
AAA repletion has no effect on body weight and fat mass
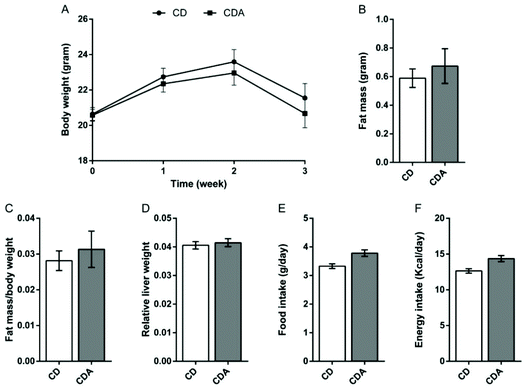
As the results show, double AAA supplementation had no effect on body weight, absolute or relative WAT weight and relative liver weight in comparison with the control group (Fig. 1A–D). Moreover, AAA repletion also has no effect on food intake and energy intake (Fig. 1E and F).AAA repletion improved lipid profiles
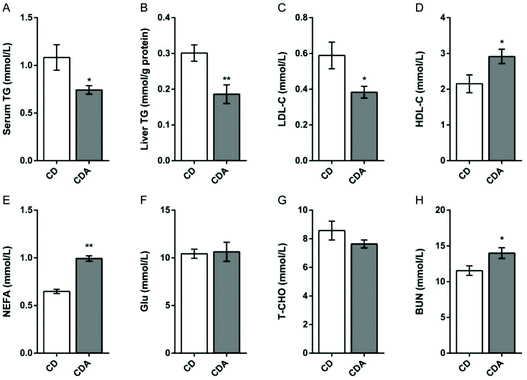
AAA repletion significantly decreased the triglyceride level in serum and liver, and the low-density lipoprotein cholesterol level in serum (P < 0.05) (Fig. 2A–C), and increased the level of high-density lipoprotein cholesterol (P < 0.05) (Fig. 2D) compared to the control diet group. However, non-esterified fatty acids and blood urea nitrogen were significantly increased after extra AAA supplementation (P < 0.05) (Fig. 2E and H). Besides, no significant differences in the serum levels of total cholesterol and serum glucose were observed between the two groups (Fig. 2F and G).AAA repletion improved insulin tolerance
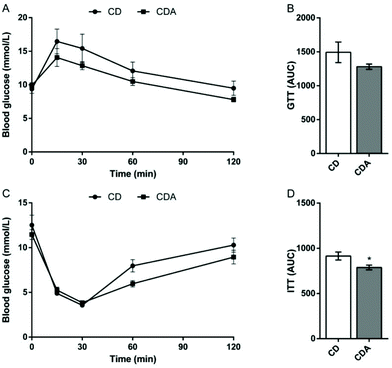
To study the influence of AAA extra supplementation on glucose homeostasis, we performed a glucose tolerance test and an insulin tolerance test after 2 weeks of AAA intervention. The results showed that extra supplementation of AAA markedly decreased the area under the curve of the insulin tolerance test compared to the control group (P < 0.05) (Fig. 3C and D). The area under the curve of the glucose tolerance test also decreased with double AAA intake (Fig. 3A and B).AAA repletion alleviated hepatic steatosis by adjusting energy-related gene expression
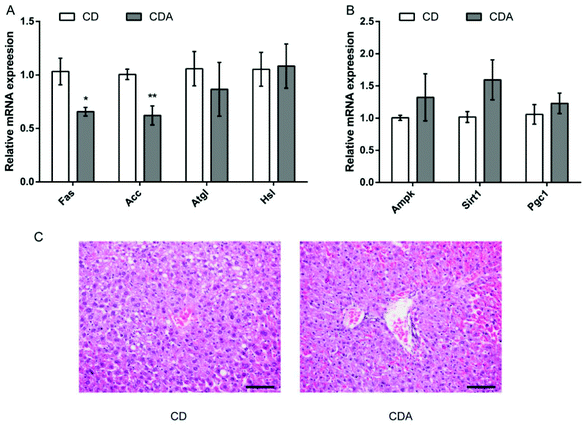
Next we measured the mRNA expression of energy-related genes in the liver and observed that AAA repletion significantly suppressed the mRNA expression of fatty acid synthase (Fas) (P < 0.05) and acetyl CoA carboxylase (Acc) (P < 0.01) (Fig. 4A). Besides, AAA repletion promoted the mRNA expression of adenosine monophosphate-activated protein kinase (Ampk), Sirtuin1 (Sirt1) and peroxisome proliferator activated receptor γ co-activator 1α (Pgc1) in comparison with the CD group (Fig. 4B). As shown in liver HE, double AAA-fed mice displayed decreased hepatic steatosis observed by smaller and less adipose hollow space (Fig. 4C).Metabolic differences after AAA supplementation
In the CDA and CD groups, a total of 17![[thin space (1/6-em)]](https://www.rsc.org/images/entities/char_2009.gif) 077 and 12
077 and 12![[thin space (1/6-em)]](https://www.rsc.org/images/entities/char_2009.gif) 745 known metabolites in liver tissue were detected by LC-MS/MS on positive-ion and negative-ion models, respectively (Fig. S1–3†). Thirteen significantly differential metabolites (VIP > 1, P < 0.05) and 11 differential metabolites (VIP > 1, 0.05 < P < 0.1) were detected in the positive-ion model. Ten significantly differential metabolites (VIP > 1, P < 0.05) and four differential metabolites (VIP > 1, 0.05 < P < 0.1) were detected in the negative-ion model (Tables 3 and S1†). In order to systematically study the metabolic alterations of AAA supplementation, KEGG pathway enrichment analysis of the differentially expressed metabolites in the CDA vs. CD group was performed. The results showed that significant changes occurred in several important pathways. The tyrosine level was significantly elevated in three AAAs. Moreover, primary bile acid synthesis, including cholic acid, taurine, and taurocholate levels, were increased under AAA repletion.
745 known metabolites in liver tissue were detected by LC-MS/MS on positive-ion and negative-ion models, respectively (Fig. S1–3†). Thirteen significantly differential metabolites (VIP > 1, P < 0.05) and 11 differential metabolites (VIP > 1, 0.05 < P < 0.1) were detected in the positive-ion model. Ten significantly differential metabolites (VIP > 1, P < 0.05) and four differential metabolites (VIP > 1, 0.05 < P < 0.1) were detected in the negative-ion model (Tables 3 and S1†). In order to systematically study the metabolic alterations of AAA supplementation, KEGG pathway enrichment analysis of the differentially expressed metabolites in the CDA vs. CD group was performed. The results showed that significant changes occurred in several important pathways. The tyrosine level was significantly elevated in three AAAs. Moreover, primary bile acid synthesis, including cholic acid, taurine, and taurocholate levels, were increased under AAA repletion.
| Metabolites | POS/NEG model | Fold change | VIP | P-Value | Pathways |
|---|---|---|---|---|---|
| VIP > 1 and P value < 0.05 are regarded as significantly differential metabolites; VIP > 1 and 0.05 < P value < 0.1 are regarded as differential metabolites. | |||||
| L-Tyrosine | POS | 1.56 | 1.71 | 0.022 | AAA biosynthesis |
| 2-Oxoadipic acid | NEG | 2.82 | 2.11 | 0.010 | Tryptophan metabolism |
| Vitamin L1 | NEG | 0.48 | 1.17 | 0.022 | AAA biosynthesis |
| S-Adenosylmethionine | POS | 1.70 | 1.61 | 0.046 | Amino acid metabolism |
| Betaine | POS | 1.41 | 2.54 | 0.075 | Amino acid metabolism |
| S-Adenosyl-L-homocysteine | POS | 0.49 | 1.40 | 0.088 | Amino acid metabolism |
| N6,N6,N6-Trimethyl-L-lysine | POS | 0.72 | 3.06 | 0.048 | Amino acid metabolism |
| Cholic acid | POS | 3.37 | 1.74 | 0.082 | Primary bile acid biosynthesis |
| Taurocholate | POS/NEG | 4.41 | 5.43 | 0.090 | Primary bile acid biosynthesis |
| Taurine | POS | 5.61 | 2.20 | 0.096 | Primary bile acid biosynthesis |
| Dopamine | POS | 1.59 | 1.48 | 0.020 | Tyrosine metabolism, bile secretion |
| Flavin adenine dinucleotide | POS | 0.81 | 1.20 | 0.053 | Vitamin digestion and absorption |
| Pantothenate | POS | 0.81 | 1.51 | 0.054 | Vitamin digestion and absorption |
| 4-Pyridoxic acid | POS/NEG | 0.69 | 2.46 | 0.055 | Vitamin B6 metabolism |
| Palmitic acid | NEG | 0.78 | 33.2 | 0.029 | Fatty acid biosynthesis |
| cis-9-Palmitoleic acid | NEG | 0.75 | 22.5 | 0.076 | Fatty acid biosynthesis |
| Cytosine | POS | 0.51 | 1.09 | 0.018 | Pyrimidine metabolism |
| Purine | POS/NEG | 0.58 | 1.36 | 0.080 | Purine metabolism |
| Hypoxanthine | NEG | 0.86 | 11.2 | 0.029 | Purine metabolism |
| D-Sorbitol | NEG | 1.89 | 1.47 | 0.088 | ABC transporters |
Upregulation of primary bile acid synthesis with double AAA intake
A volcano plot provided a quick view of the differences in gene expressions (Fig. S4A†). Some genes were upregulated but more genes were downregulated in the CDA group compared to the CD group. In total, we analyzed 54![[thin space (1/6-em)]](https://www.rsc.org/images/entities/char_2009.gif) 742 transcripts. In all, 190 genes were differentially expressed with 101 downregulated and 89 upregulated genes in the liver (Fig. S4B†). The top 30 enriched gene ontology (GO) terms are shown in Fig. S5.† Many genes were connected with the muscle-related pathway in GO analysis, indicating that AAA supplementation may stimulate protein synthesis.17 Integrated metabolome and transcriptome data were analyzed to investigate pathway alterations under AAA supplementation, and we identified 23 pathways that were significantly altered (Fig. 5). Among these pathways, the alteration of primary bile acid synthesis and bile secretion are included. Meanwhile, the transcriptome data generated by RNA sequencing indicated that important genes related to bile acid synthesis were remarkably different between the two groups. In the primary bile acid synthesis pathway, the expression of oxysterol 7α-hydroxylase (Cyp7b1) was up-regulated in the acidic pathway. Moreover, bile recovery-related gene organic anion transporter 2 (Oat2), lipid metabolism-related genes sterol regulatory element-binding protein 1 (Srebp1) and G protein-coupled receptor 146 (Gpr146) were upregulated in the CDA group.
742 transcripts. In all, 190 genes were differentially expressed with 101 downregulated and 89 upregulated genes in the liver (Fig. S4B†). The top 30 enriched gene ontology (GO) terms are shown in Fig. S5.† Many genes were connected with the muscle-related pathway in GO analysis, indicating that AAA supplementation may stimulate protein synthesis.17 Integrated metabolome and transcriptome data were analyzed to investigate pathway alterations under AAA supplementation, and we identified 23 pathways that were significantly altered (Fig. 5). Among these pathways, the alteration of primary bile acid synthesis and bile secretion are included. Meanwhile, the transcriptome data generated by RNA sequencing indicated that important genes related to bile acid synthesis were remarkably different between the two groups. In the primary bile acid synthesis pathway, the expression of oxysterol 7α-hydroxylase (Cyp7b1) was up-regulated in the acidic pathway. Moreover, bile recovery-related gene organic anion transporter 2 (Oat2), lipid metabolism-related genes sterol regulatory element-binding protein 1 (Srebp1) and G protein-coupled receptor 146 (Gpr146) were upregulated in the CDA group.
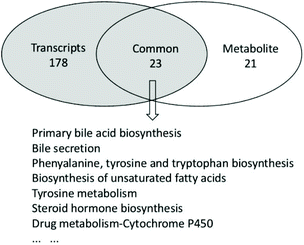 | ||
| Fig. 5 Altered pathways in extra AAA supplementation. Metabolic and transcriptional analysis identified 23 pathways that were significantly altered by AAA treatment. | ||
Double AAA intake did not cause cholestasis
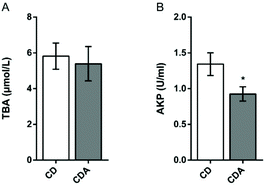
Next we focused our attention on bile acid metabolism. Since the integrated metabolome and transcriptome analysis had shown that bile acid synthesis in the liver was elevated, it was, however, still unknown whether double AAA intake could lead to cholestasis. Therefore, total bile acids and alkaline phosphatase in serum were tested. The serum concentration of total bile acids had no significant differences between the two groups (Fig. 6A). Compared to the CD group, the levels of alkaline phosphatase in the CDA group were significantly reduced (P < 0.05) (Fig. 6B). So, double AAA intake did not cause cholestasis but decreased liver injury.Double AAA intake increased the acidic pathway of primary bile acid synthesis and upregulated bile acid reabsorption
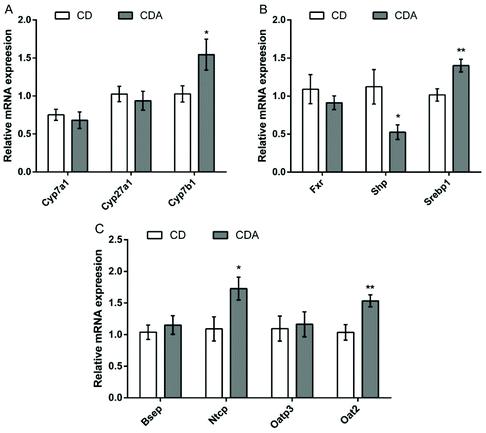
In order to further explore the changes in the bile acid pathway under the influence of double AAA intake, we measured the mRNA expression of the related genes. The results showed that AAA repletion markedly upregulated the acidic pathway by increasing oxysterol 7α-hydroxylase (Cyp7b1) mRNA expression (P < 0.05) while the expression of cholesterol 7α-hydroxylase (Cyp7a1) and sterol 27-hydroxylase (Cyp27a1) had no significant difference (Fig. 7A). AAA repletion increased the mRNA expression of the bile acid transportation-related genes sodium taurocholate cotransporting polypeptide (Ntcp) and organic anion transporter 2 (Oat2) (Fig. 7C) (P < 0.05). In addition, double AAA supplementation promoted the expression of sterol regulatory element-binding protein 1 (Srebp1) (P < 0.01) by suppressing the expression of the nuclear receptor short heterodimer partner (Shp) (P < 0.05) (Fig. 7B).Discussion
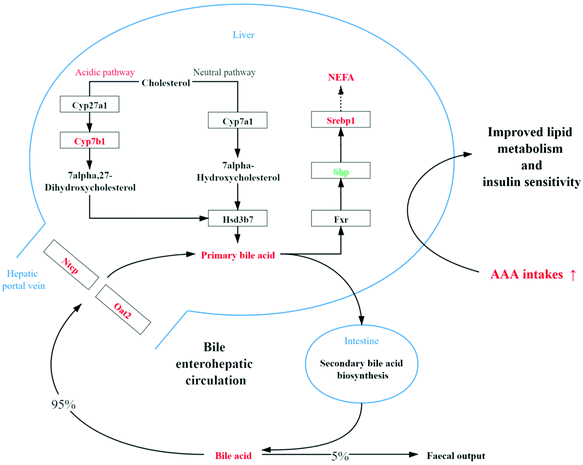
Growing evidence shows that amino acids are able to modulate lipid metabolism. For instance, branched-chain amino acid (BCAA) supplementation reduced body weight, epididymal adipose tissue mass, and the hepatic and skeletal muscle triglyceride concentrations.18 Similarly, arginine treatment also decreased the relative weight of white fat pads, as well as lowered the serum concentrations of glucose and triglycerides, and improved the glucose tolerance.19 In this study, we demonstrated that a new amino acid family, AAA, improved the lipid profiles (Fig. 2 and 3) and alleviated hepatic steatosis (Fig. 4) via stimulating bile acid synthesis without changes in body weight and WAT weight (Fig. 1). In the past, AAAs have been proved to have some special effects. For example, there are hot spots that are rich in tryptophan and tyrosine and play a role in protein–protein binding.20 Tryptophan serves as a precursor of a neurohormone, melatonin, supplementation of which is beneficial for lipid metabolism and hepatic steatosis.21,22 Moreover, tyrosine is the initial precursor of the biosynthesis of dopa and dopamine. The results are in line with a previous study in which bile flow and biliary output of total bile acids were significantly increased after excess dietary tyrosine.23 In fact, metabolomic analysis showed that only concentration of tyrosine was significantly increased in the liver (Table 3), suggesting that the regulation of lipid metabolism by dietary AAA supplementation is mainly due to the accumulation of the tyrosine signal, at least in the liver.It is now clear that bile acids function as hormones or nutrient signaling molecules that help to regulate lipids, glucose, lipoproteins, energy metabolism and inflammatory responses.24,25 Bile acid, a component of bile, is synthesized from cholesterol in the liver and contributes to fat-soluble vitamin absorption,26 and improves insulin tolerance by insulin signaling (AKT) and ERK1/2 pathways in hepatocytes.27 Cholic acid (CA) is a kind of bile acid that prevents hepatic triglyceride accumulation and elevates serum TG in mouse models of hypertriglyceridemia.28 In mice, more than 95% of bile acids are taurine conjugated, which increases solubility even at acidic pH, prevents Ca2+ precipitation, minimizes passive absorption, and bestows resistance to cleavage by pancreatic carboxypeptidases.29 Moreover, not only taurine but also taurine-conjugated bile acid, formed by the conversion of taurine in the body, could prevent the progression of obesity.30 In the present study, levels of cholic acid, taurocholate and taurine all increased (Table 3). However, excessive bile acid may cause cholestasis and liver toxicity.31,32 As shown in Fig. 6, no change in the TBA level and decreased AKP level in serum were observed with AAA supplementation, which suggested that AAA did not cause cholestasis and liver damage but improved lipid metabolism. The possible mechanism is summarized in Fig. 8.
There are two major bile acid biosynthetic pathways: the neutral pathway (classical pathway) that is initiated by Cyp7a1 located in the endoplasmic reticulum of the liver, and the acidic pathway (alternative pathway) that is initiated by Cyp271; then its product is rapidly 7a-hydroxylated by microsomal Cyp7b1.33 In general, the neutral pathway is the major pathway of generating bile acid under physiological conditions, while the acidic pathway has been shown to be more active in cirrhosis and various liver diseases.34,35 However, recent research has shown that the acidic pathway is not just an alternative pathway, but it also contributes to lipid, cholesterol, carbohydrate, and energy homeostasis.36 Studies have shown that reduced Cyp7b1 mRNA expression was observed in type 2 diabetic mice.37,38 Furthermore, increasing the cholesterol catabolism through the acidic pathway would also lead to a marked and rapid reduction of liver triglycerides.39 Moreover, cold induced the increase of brown and beige adipocytes that upregulated Cyp7b1 and promoted thermogenesis and energy expenditure.40 These findings suggested that hepatic Cyp7b1 potentially plays a vital role in obesity-related type 2 diabetes. In the present study, AAA promoted bile acid synthesis by the acidic pathway rather than the neutral pathway because the key Cyp7a1 for the classical pathway was not altered but Cyp7b1 for the acidic pathway was markedly regulated.
The promotion of the acidic pathway of primary bile acids leads to higher bile acid level. After secondary bile acid biosynthesis and enterohepatic circulation, bile acids are resorbed from the intestines, travel through the portal blood and return to the liver via the Na+-taurocholate cotransport peptide (Ntcp).41 The SLC family transporters, including organic anion-transporting polypeptides (Oatps) and organic anion transporters (Oats), are also required for bile acid transportation.42,43 In this experiment, the reabsorption of bile acid from the hepatic portal vein is enhanced due to the upregulation of Ntcp and Oat2. At the transcriptional level, bile acids, which are the endogenous ligands of the farnesoid X receptor (Fxr), activate the transcription of the atypical nuclear receptor short heterodimer partner (Shp).44 With double AAA intake, Fxr was not altered but the suppression of Shp led to increased Srebp1 expression. It has been proposed that bile acids regulate hepatic lipid homeostasis through the coordinate regulation of Fxr, Shp, Lxr and Srebp1 genes.28 Sterol regulatory element-binding protein 1 (Srebp1), also known as sterol regulatory element-binding transcription factor 1 (Srebf1), plays a key role in hepatic transcriptional regulation of lipogenic enzymes by sensing the concentration of environmental sterols45 but not in cholesterol biosynthesis in the liver.46 The elevated Srebp1 expression can partly explain the increase of serum non-esterified fatty acid (NEFA) level and the unaltered level of cholesterol by AAA treatment. However, it was observed that hepatic expression of Srebp1 and its lipogenic target genes were suppressed by cholic acid.28 It was assumed that the AAA signal plays a dominant role in the regulation of Srebp1 rather than of cholic acid. Furthermore, the transcriptome displayed an upregulated G protein-coupled receptor 146 (Gpr146) that modulates hepatic very low-density lipoprotein (VLDL) secretion, and subsequently circulating LDL-C and TG levels via promoting activity of Srebp2.47 This suggests that the regulatory metabolism of AAA on lipid metabolism is more complex as compared to promoting bile acid secretion.
Conclusions
Dietary supplementation with AAA significantly improved hepatic steatosis, serum triglycerides and other lipid profiles. The mechanism involves increasing primary bile acid synthesis by increasing the expression of Cyp7b1. Further experiments are needed to explore the investigation in long-term AAA intervention and different animal models, which may cause unsimilar results. This study provides a new insight about the role of AAA on lipid metabolism and illustrates the potential of AAA in the alleviation of metabolic disorders.Funding
This research was funded by the National Key Research & Development Program of China (2018YFD0501202), the National Natural Science Foundation of China (31772611), and the Assisted Project by Heilongjiang Postdoctoral Funds for Scientific Research Initiation (LBH-Q17008).Conflicts of interest
The authors declare no conflict of interest.References
- C. Cheng, S. Zhuo, B. Zhang, X. Zhao, Y. Liu, C. Liao, J. Quan, Z. Li, A. M. Bode and Y. Cao, Treatment implications of natural compounds targeting lipid metabolism in nonalcoholic fatty liver disease, obesity and cancer, Int. J. Biol. Sci., 2019, 15, 1654–1663 CrossRef CAS.
- G. Y. Wu, Functional amino acids in nutrition and health, Amino Acids, 2011, 41, S54–S54 Search PubMed.
- G. Wu, Functional amino acids in growth, reproduction, and health, Adv. Nutr., 2010, 1, 31–37 CrossRef CAS.
- Q. Ma, X. Zhou, L. Hu, J. Chen, J. Zhu and A. Shan, Leucine and isoleucine have similar effects on reducing lipid accumulation, improving insulin sensitivity and increasing the browning of WAT in high-fat diet-induced obese mice, Food Funct., 2020, 11, 2279–2290 RSC.
- Q. Ma, X. Zhou, Y. Sun, L. Hu, J. Zhu, C. Shao, Q. Meng and A. Shan, Threonine, but Not Lysine and Methionine, Reduces Fat Accumulation by Regulating Lipid Metabolism in Obese Mice, J. Agric. Food Chem., 2020, 68, 4876–4883 CrossRef CAS.
- W. J. J. Fu, T. E. Haynes, R. Kohli, J. B. Hu, W. J. Shi, T. E. Spencer, R. J. Carroll, C. J. Meininger and G. Y. Wu, Dietary L-arginine supplementation reduces fat mass in Zucker diabetic fatty rats, J. Nutr., 2005, 135, 714–721 CrossRef CAS.
- Q. Han, R. S. Phillips and J. Li, Editorial: Aromatic Amino Acid Metabolism, Front. Mol. Biosci., 2019, 6, 22 CrossRef.
- Z. Ruan, Y. Yang, Y. Wen, Y. Zhou, X. Fu, S. Ding, G. Liu, K. Yao, X. Wu and Z. Deng, Metabolomic analysis of amino acid and fat metabolism in rats with L-tryptophan supplementation, Amino Acids, 2014, 46, 2681–2691 CrossRef CAS.
- Y. Akiba, K. Takahashi, M. Horiguchi, H. Ohtani, S. Saitoh and H. Ohkawara, L-tryptophan alleviates fatty liver and modifies hepatic microsomal mixed function oxidase in laying hens, Comp. Biochem. Physiol., 1992, 102, 769–774 CrossRef CAS.
- S. R. Rogers and G. M. Pesti, The influence of dietary tryptophan on broiler chick growth and lipid metabolism as mediated by dietary protein levels, Poult. Sci., 1990, 69, 746–756 CrossRef CAS.
- R. Fears and E. A. Murrell, Tryptophan and the control of triglyceride and carbohydrate metabolism in the rat, Br. J. Nutr., 1980, 43, 349–356 CrossRef CAS.
- A. Alamshah, E. Spreckley, M. Norton, J. S. Kinsey-Jones, A. Amin, A. Ramgulam, Y. Cao, R. Johnson, K. Saleh and E. Akalestou, l-phenylalanine modulates gut hormone release and glucose tolerance, and suppresses food intake through the calcium-sensing receptor in rodents, Int. J. Obes., 2017, 41, 1693–1701 CrossRef CAS.
- D. M. Libert, A. S. Nowacki and M. R. Natowicz, Metabolomic analysis of obesity, metabolic syndrome, and type 2 diabetes: amino acid and acylcarnitine levels change along a spectrum of metabolic wellness, PeerJ, 2018, 6, e5410 CrossRef.
- Z. Leon, Mammalian cell metabolomics: experimental design and sample preparation, Electrophoresis, 2013, 34, 2762–2775 CAS.
- J. Ivanisevic, Z. J. Zhu and L. Plate, Toward ‘omic scale metabolite profiling: a dual separation-mass spectrometry approach for coverage of lipid and central carbon metabolism, Anal. Chem., 2013, 85, 6876–6884 CrossRef CAS.
- H. P. Benton, J. Ivanisevic, N. G. Mahieu and M. E. Kurczy, Autonomous metabolomics for rapid metabolite identification in global profiling, Anal. Chem., 2015, 87, 884–891 CrossRef CAS.
- A. Dukes, C. Davis, M. El Refaey, S. Upadhyay, S. Mork, P. Arounleut, M. H. Johnson, W. D. Hill, C. M. Isales and M. W. Hamrick, The aromatic amino acid tryptophan stimulates skeletal muscle IGF1/p70s6k/mTor signaling in vivo and the expression of myogenic genes in vitro, Nutrition, 2015, 31, 1018–1024 CrossRef CAS.
- M. Arakawa, T. Masaki, J. Nishimura, M. Seike and H. Yoshimatsu, The effects of branched-chain amino acid granules on the accumulation of tissue triglycerides and uncoupling proteins in diet-induced obese mice, Endocr. J., 2011, 58, 161–170 CrossRef CAS.
- W. Jobgen, C. J. Meininger, S. C. Jobgen, P. Li, M. J. Lee, S. B. Smith, T. E. Spencer, S. K. Fried and G. Wu, Dietary L-arginine supplementation reduces white fat gain and enhances skeletal muscle and brown fat masses in diet-induced obese rats, J. Nutr., 2009, 139, 230–237 CrossRef CAS.
- A. A. Bogan and K. S. Thorn, Anatomy of hot spots in protein interfaces, J. Mol. Biol., 1998, 280, 1–9 CrossRef CAS.
- H. Sun, F. F. Huang and S. Qu, Melatonin: a potential intervention for hepatic steatosis, Lipids Health Dis., 2015, 14, 75 CrossRef.
- S. Nishida, T. Segawa, I. Murai and S. Nakagawa, Long-term melatonin administration reduces hyperinsulinemia and improves the altered fatty-acid compositions in type 2 diabetic rats via the restoration of Delta-5 desaturase activity, J. Pineal Res., 2002, 32, 26–33 CrossRef CAS.
- S. Nagaoka, H. Miyazaki, H. Oda, Y. Aoyama and A. Yoshida, Effects of excess dietary tyrosine on cholesterol, bile acid metabolism and mixed-function oxidase system in rats, J. Nutr., 1990, 120, 1134–1139 CrossRef CAS.
- H. Wang, J. Chen, K. Hollister, L. C. Sowers and B. M. Forman, Endogenous bile acids are ligands for the nuclear receptor FXR/BAR, Mol. Cell, 1999, 3, 543–553 CrossRef CAS.
- F. G. Schaap, M. Trauner and P. L. Jansen, Bile acid receptors as targets for drug development, Nat. Rev. Gastroenterol Hepatol., 2014, 11, 55–67 CrossRef CAS.
- A. Saeed, M. Hoekstra, M. O. Hoeke, J. Heegsma and K. N. Faber, The interrelationship between bile acid and vitamin A homeostasis, Biochim. Biophys. Acta, Mol. Cell Biol. Lipids, 2017, 5, 496–512 CrossRef.
- Y. Fang, E. Studer, C. Mitchell, S. Grant, W. M. Pandak and P. B. Hylemon, Conjugated bile acids regulate hepatocyte glycogen synthase activity in vitro and in vivo via Galphai signaling, Mol. Pharmacol., 2007, 71, 1122–1128 CrossRef CAS.
- M. Watanabe, S. M. Houten, L. Wang, A. Moschetta, D. J. Mangelsdorf, R. A. Heyman, D. D. Moore and J. Auwerx, Bile acids lower triglyceride levels via a pathway involving FXR, SHP, and SREBP-1c, J. Clin. Invest., 2004, 113, 1408–1418 CrossRef CAS.
- A. F. Hofmann and K. J. Mysels, Bile acid solubility and precipitation in vitro and in vivo: the role of conjugation, pH, and Ca2+ ions, J. Lipid Res., 1992, 33, 617–626 CAS.
- S. Murakami, Role of taurine in the pathogenesis of obesity, Mol. Nutr. Food Res., 2015, 59, 1353–1363 CrossRef CAS.
- T. Li and U. Apte, Bile Acid Metabolism and Signaling in Cholestasis, Inflammation, and Cancer, Adv. Pharmacol., 2015, 74, 263–302 CAS.
- D. A. Lionarons, M. Heger and R. F. van Golen, Simple steatosis sensitizes cholestatic rats to liver injury and dysregulates bile salt synthesis and transport, Sci. Rep., 2016, 6, 31829 CrossRef CAS.
- J. Y. Chiang, Bile acid metabolism and signaling, Compr. Physiol., 2013, 3, 1191–1212 Search PubMed.
- M. Axelson and J. Sjovall, Potential bile acid precursors in plasma-possible indicators of biosynthetic pathways to cholic and chenodeoxycholic acids in man, J. Steroid Biochem., 1990, 36, 631–640 CrossRef CAS.
- A. Crosignani, M. Del Puppo, M. Longo, E. De Fabiani, D. Caruso and M. Zuin, Changes in classic and alternative pathways of bile acid synthesis in chronic liver disease, Clin. Chim. Acta, 2007, 382, 82–88 CrossRef CAS.
- W. M. Pandak and G. Kakiyama, The acidic pathway of bile acid synthesis: Not just an alternative pathway, Liver Res., 2019, 3, 88–98 CrossRef.
- C. Chen, B. Hu and T. Wu, Bile acid profiles in diabetic (db/db) mice and their wild type littermates, J. Pharm. Biomed. Anal., 2016, 131, 473–481 CrossRef CAS.
- K. Nojima, K. Sugimoto, H. Ueda, N. Babaya, H. Ikegami and H. Rakugi, Analysis of hepatic gene expression profile in a spontaneous mouse model of type 2 diabetes under a high sucrose diet, Endocr. J., 2013, 60, 261–274 CrossRef CAS.
- G. Kakiyama, D. Marques and H. Takei, Mitochondrial oxysterol biosynthetic pathway gives evidence for CYP7B1 as controller of regulatory oxysterols, J. Steroid Biochem. Mol. Biol., 2019, 189, 36–47 CrossRef CAS.
- A. Worthmann, C. John, M. C. Ruhlemann, M. Baguhl, F. A. Heinsen and N. Schaltenberg, Cold-induced conversion of cholesterol to bile acids in mice shapes the gut microbiome and promotes adaptive thermo genesis, Nat. Med., 2017, 23, 839–849 CrossRef CAS.
- B. Doring, T. Lutteke, J. Geyer and E. Petzinger, The SLC10carrier family: transport functions and molecular structure, Curr. Top. Membr., 2012, 70, 105–168 Search PubMed.
- X. Liu, Transporter-Mediated Drug-Drug Interactions and Their Significance, dv. Exp. Med. Biol., 2019, 1141, 241–291 CAS.
- K. N. Faber, M. Müller and P. L. Jansen, Drug transport proteins in the liver, Adv. Drug Delivery Rev., 2003, 55, 107–124 CrossRef CAS.
- B. A. Goodwin, Regulatory cascade of the nuclear receptors FXR, SHP-1, and LRH-1represses bile acid biosynthesis, Mol. Cell, 2000, 6, 517–526 CrossRef CAS.
- S. Zhang, X. Lin, H. Lynn, G. Xu, J. Li, C. Zhao and M. Li, Dietary cholesterol interacts with SREBF1 to modulate obesity in Chinese children, Mol. Nutr. Food Res., 2017, 61, 1700105–1700122 CrossRef.
- H. Shimano, N. Yahagi, M. Amemiya-Kudo, A. H. Hasty, J. Osuga, Y. Tamura, F. Shionoiri, Y. Iizuka, K. Ohashi and K. Harada, Sterol regulatory element-binding protein-1 as a key transcription factor for nutritional induction of lipogenic enzyme genes, J. Biol. Chem., 1999, 274, 35832–35839 CrossRef CAS.
- H. Yu, A. Rimbert, A. E. Palmer, T. Toyohara, Y. Xia, F. Xia, L. M. R. Ferreira, Z. Chen, T. Chen and N. Loaiza, GPR146 Deficiency Protects against Hypercholesterolemia and Atherosclerosis, Cell, 2019, 179, 1276–1288 CrossRef CAS.
Footnotes |
| † Electronic supplementary information (ESI) available. See DOI: 10.1039/d0fo02364g |
| ‡ These authors contributed equally to this manuscript. |
| This journal is © The Royal Society of Chemistry 2021 |

