DOI:
10.1039/D0FO00287A
(Review Article)
Food Funct., 2020,
11, 3781-3799
Effects of fasting intervention regulating anthropometric and metabolic parameters in subjects with overweight or obesity: a systematic review and meta-analysis†
Received
2nd February 2020
, Accepted 16th April 2020
First published on 27th April 2020
Abstract
Background: Previous studies have shown that fasting produces a potential effect in the prevention and treatment of many diseases. However, the role of fasting in people with overweight or obesity remains controversial. The aim of this study was to assess the intervention of fasting in the regulation of anthropometric and metabolic parameters of subjects with overweight or obesity. Methods: The PubMed, Cochrane library, Web of science and EMBASE databases were searched from the inception dates to October 2019, identifying published literature evaluating the effect of fasting intervention on the people with overweight or obesity. Results: Twenty-five studies with 1358 participants with overweight or obesity were included in the meta-analysis. Fasting was associated with the significant reduction of body weight, body mass index (BMI), fat free mass (FEM), fat mass (FM), waist circumference (WC), low density lipoprotein cholesterol (LDL-C), triglycerides (TG), systolic blood pressure (SBP) and diastolic blood pressure (DBP). However, there was no significant difference in the variations in the total cholesterol (TC), high density lipoprotein cholesterol (HDL-C), blood glucose and insulin concentrations. Conclusion: Our meta-analysis found that fasting was associated with a significant effect on the regulation of anthropometric (body weight, BMI, FEM, FM and WC) and metabolic parameters (LDL-C, TG, SBP and DBP) in people with overweight or obesity. Considering some limitations found in this study, additional data from large clinical trials are needed.
1. Introduction
Obesity is a pathological state in which excess abdominal weight is accumulated due to the imbalance between energy intake and consumption.1 The prevalence of obesity has doubled in more than 70 countries in the past 30 years and has constantly increased in most other countries.2 As excess weight gain increases the risk of cardiovascular disease, diabetes, cancer and other diseases; the increasing prevalence of obesity is a worldwide health problem and causes a large financial burden in all countries.3,4 By 2030, a 5% decrease in body mass index (BMI) parameter is expected to lead to a reduction of €495 million in obesity related direct health care expenses over 20 years.5
Fasting is regarded as ingesting no or minimal energy for a period of time, which including periodic fasting (PF), intermittent fasting (IF), very low calorie diet (VLCD) and other fasting.6,7 Among them, PF consists of fasting only 1 or 2 days per week with consuming food ad libitum on 5 to 6 days per week and VLCD is regarded as an energy intake of 800 kcal or less per day.7–9 IF includes limiting or no food consumption on 1–3 day per week and eating freely on the no restriction days, which comprises complete alternate-day fasting (CADF), alternate day modified fasting (ADMF), time-restricted feeding (TRF) and others.10,11 The main difference between CADF and ADMF is the energy intake on fasting day (CADF: zero calorie intake; ADMF: 20–25% of energy needs).11,12 Specially, TRF is an eating pattern in which daily food consumption is limited to 8 hours or less.13 Previous studies have indicated that fasting produces a potential effect in the prevention and treatment of many diseases. Several studies have found that fasting was profitable for symptoms and inflammatory parameters in patients with rheumatic diseases.14,15 Meanwhile, the risk of hypertension, cardiovascular and metabolic disease was reduced through fasting intervention.7 In addition, fasting may protect from cancer via reducing the harm to cells and DNA, and increasing the death of precancerous cells.16 Simultaneously, fasting could also debase the capacity of cancer cells to adapt and survive, thereby improving the effects of cancer therapies.17
Some studies have reported that IF and VLCD may improve the body composition, reduce cardiovascular risk factors, and positively affect glucose control in people with overweight or obesity.18,19 However, recent research has also shown that the advantages of IF for weight loss, weight management, or cardio-protection in subjects with overweight or obesity were not obvious.20 The role of fasting in people with overweight or obesity remains controversial. Therefore, a meta-analysis of all related randomized control trials (RCTs) was conducted focusing on the intervention of fasting in the regulation of anthropometric and metabolic parameters of people with overweight or obesity.
2. Materials and methods
2.1. Sources and methods of data retrieval
We searched the PubMed, Cochrane library, Web of science and EMBASE databases from the inception dates to October 2019, using the keywords fasting, very low calorie diet, intermittent fasting, alternate day fasting, periodic fasting, modified fasting regimen, time-restricted feeding, overweight, obesity and obese to identify published literature evaluating the effect of fasting intervention on regulating anthropometric and metabolic parameters in people with overweight or obesity. The literature search was limited to English language and human subjects. The detailed search strategy is shown in Table S1.†
2.2. Inclusion criteria
The inclusion criteria were (1) RCTs comparing fasting intervention and a normal diet or energy restriction group; (2) overweight or obesity was defined based on a local criterion; (3) the outcomes were quantitative data that could be extracted or calculated. Exclusion criteria were as follows: (1) randomized studies were single-arm studies or without a placebo; (2) fasting due to religious habits; and (3) non-human studies, reviews and conference literature. Two researchers independently reviewed the literature and collected all eligible studies. Once disagreements existed, the nutritionist was involved to discuss and solve it (Fig. 1).
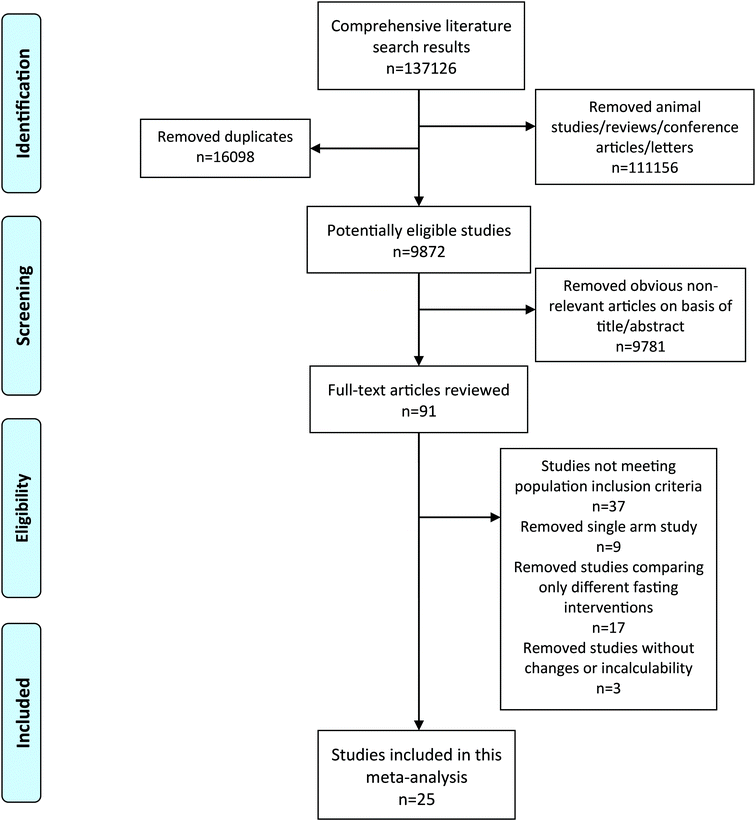 |
| | Fig. 1 Flow diagram of the literature search and selection. | |
2.3. Data abstraction
Data collected from all included literature were as follows: (1) first author, nationality, publication year, numbers, mean age and gender of fasting intervention subjects and the control group; (2) the fasting type, subject type, fasting time and dose, diabetes or not, whether measured immediately after fasting or not (outcome type); and (3) the variations in the body weight, BMI, fat free mass (FEM), fat mass (FM), waist circumference (WC), total cholesterol (TC), low density lipoprotein cholesterol (LDL-C), high density lipoprotein cholesterol (HDL-C), triglycerides (TG), systolic blood pressure (SBP), diastolic blood pressure (DBP), blood glucose and insulin parameters in the fasting intervention and control subjects.
2.4. Risk of bias within individual studies
The methodological quality for the selected literature was evaluated independently using the Cochrane Collaboration (RevMan Version 5.3) software by two investigators according to Cochrane risk-of-bias criteria,21 which included seven items (randomization sequence generation, allocation concealment, blinding of participants and personnel, blinding of outcome assessment, incomplete outcome data, selective reporting, and other bias) to estimate bias in each trial. Each quality item was graded as low risk, unclear risk, or high risk. Simultaneously, the GRADE system was used to classify the quality of evidence. The included trials were graded as high quality, moderate quality, low quality, or very low quality according to the risk of bias, inconsistency, indirectness, imprecision and other considerations.22
2.5. Statistical analysis
Statistical analysis was performed using the statistical software Review Manager 5.3 and Stata 12.0. The mean change (standard deviation) in anthropometric and metabolic parameters from the baseline was used to evaluate the differences between the fasting intervention and control subjects. When it could not obtained via the original literature, we calculated the standard deviation in the mean change in the anthropometric and metabolic parameters using the formula in the Cochrane handbook.23 The correlation coefficient of the equation was estimated using the data from the included literature providing the baseline and endpoint values and the variations, simultaneously.
The random effects model was used to compute the summary standard mean difference (SMD) and 95% confidence interval (CI) and to evaluate the differences in the variations in the anthropometric and metabolic parameters between the fasting intervention group and the controls.
We use the I2 statistic to estimate statistical heterogeneity. The potential publication bias was evaluated via the Egger test, where the trim-and-fill method (sensitivity analysis) was used to correct outcomes and evaluate the impact of bias on the outcomes. Subgroup analyses were conducted based on the fasting type (ADMF, CADF, TRF, VLCD), subject type (Adult(women + men), Adult(women), Adult(men)), Region(Oceania, America, Europe, Asia), fasting time (<12weeks, ≥12 weeks), diabetes or not, and outcome type (follow-up, non follow-up). Because only one literature was for PF, the subgroup analysis was not conducted in view of PF.
3. Results
A total of 25 studies met inclusion criteria, involving 1358 samples, with 690 interventions and 668 controls.12,24–47 The variations in the body weight, BMI, FEM, FM, WC, TC, LDL-C, HDL-C, TG, SBP, DBP, blood glucose and insulin parameters were evaluated in twenty-four,12,24–27,29–47 thirteen,12,25,26,30,32–37,41,44,45 nine,12,24,25,27,28,34,36,40,41 ten,12,24–29,31,36,41 eight,25,27,30,31,37,41,44,45 thirteen,12,24–28,30,35–38,44,47 ten,12,24–28,30,34,38,47 twelve,12,24–28,30,36,38,44,45,47 thirteen,12,24–28,30,36–38,44,45,47 eleven,12,24,25,27,30,35–38,44,45 eleven,12,24,25,27,30,35–38,44,45 twelve12,25–28,30,35,36,38,44,45,47 and ten12,25–28,30,38,44,45,47 studies, respectively. The detailed outcomes are performed in Table 1 and Table S2.† Almost all studies12,24–36,38–47 (n = 24) were randomized, and nearly half of the studies12,24,25,28,30,31,33,39,41,42,44,45 (n = 12) described allocation concealment methods. Specially, as fasting cannot blind between the intervention group and controls, double-blind setup were lacking in all studies. However, five studies stated that outcome assessments were blinded.12,28,31,33,41 Four studies were considered to have attrition bias as the reason for the drop out was not explained.37,38,43,46 Only six trials had clinical trial registration codes, where reporting bias might have existed.12,27,31,33,41,44 After evaluation comprehensively, other biases existed in ten studies.26,27,32,34–38,43,46 The risk of bias within individual studies detailed is performed in Fig. 2. In addition, the GRADE system was performed to determine the quality of evidence for different results. We considered that the grades of evidence were moderate quality in all outcomes except for the FEM parameter (low quality) (Table 2).
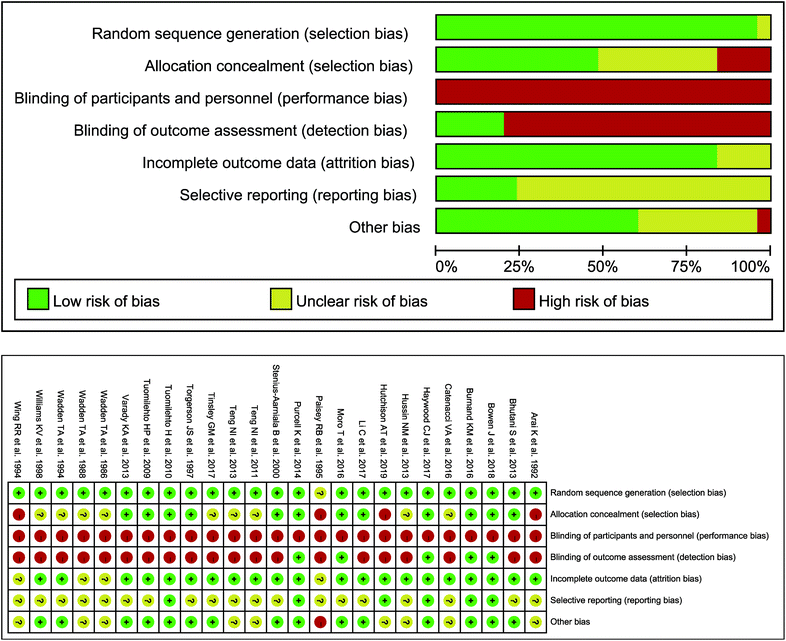 |
| | Fig. 2 Risk of within-study bias. | |
Table 1 Characteristics of studies examining the effects of fasting intervention on regulating anthropometric and metabolic parameters
| Author |
Region |
Year |
Fasting type |
Subjects |
Outcome type |
Fasting time |
Fasting dose |
Diabetes |
n
|
Gender(M/F) |
Age |
| IG |
CG |
IG |
CG |
IG |
CG |
| Bowen J. et al.a |
Australia |
2018 |
ADMF |
A(W + M) |
Non follow-up |
16 weeks |
573.6 kcal |
ND |
67 |
68 |
15/67 |
16/65 |
40.0 ± 8.3 |
40.6 ± 8.8 |
| Varady K. A. et al. |
US |
2013 |
ADMF |
A(W + M) |
Non follow-up |
12 weeks |
400–600 kcal |
ND |
15 |
15 |
5/10 |
3/12 |
47 ± 3 |
48 ± 2 |
| Bhutani S. et al.a |
US |
2013 |
ADMF |
A(W + M) |
Non follow-up |
12 weeks |
450 kcal |
ND |
16 |
16 |
1/24 |
1/15 |
42 ± 2 |
49 ± 2 |
| Catenacci V. A. et al. |
US |
2016 |
CADF |
A(W + M) |
Non follow-up |
8 weeks |
0 kcal |
ND |
13 |
12 |
3/10 |
3/9 |
39.6 ± 9.5 |
42.7 ± 7.9 |
| Hutchison A. T. et al.(1) |
Australia |
2019 |
CADF |
A(W) |
Non follow-up |
8 weeks |
0 kcal |
ND |
22 |
11 |
0/22 |
0/11 |
51 ± 2 |
49 ± 3 |
| Hutchison A. T. et al.(2) |
Australia |
2019 |
CADF |
A(W) |
Non follow-up |
8 weeks |
0 kcal |
ND |
22 |
11 |
0/22 |
0/11 |
49 ± 2 |
49 ± 3 |
| Moro T. et al. |
Italy |
2016 |
TRF |
A(M) |
Non follow-up |
8 weeks |
2735 kcal |
ND |
17 |
17 |
17/0 |
17/0 |
29.9 ± 4.1 |
28.5 ± 3.5 |
| Tinsley G. M. et al. |
US |
2017 |
TRF |
A(M) |
Non follow-up |
8 weeks |
1674 kcal |
ND |
10 |
8 |
10/0 |
8/0 |
22.9 ± 4.1 |
22.0 ± 2.4 |
| Li C. et al.a |
Germany |
2017 |
VLCD |
A(W + M) |
Follow-up |
1 week |
300 kcal |
D |
16 |
16 |
— |
— |
64.7 ± 7.0 |
65.4 ± 5.7 |
| Haywood C. J. et al.(1) |
Australia |
2017 |
VLCD |
A(W + M) |
Non follow-up |
12 weeks |
400–600 kcal |
ND |
41 |
36 |
16/25 |
13/23 |
— |
— |
| Haywood C. J. et al.(2) |
Australia |
2017 |
VLCD |
A(W + M) |
Non follow-up |
12 weeks |
400–600 kcal |
ND |
41 |
40 |
16/25 |
16/24 |
— |
— |
| Hussin N. M. et al. |
Malaysia |
2013 |
VLCD |
A(M) |
Non follow-up |
12 weeks |
300–500 kcal |
ND |
16 |
15 |
16/0 |
15/0 |
59.7 ± 6.6 |
59.7 ± 6.2 |
| Burnand K M. et al. |
UK |
2016 |
VLCD |
A(W + M) |
Follow-up |
2 weeks |
800 kcal |
ND |
21 |
25 |
0/21 |
4/21 |
43.5 ± 31.1 |
48 ± 35.5 |
| Teng N. I. et al. |
Malaysia |
2011 |
VLCD |
A(M) |
Non follow-up |
12 weeks |
300–500 kcal |
ND |
12 |
13 |
12/0 |
13/0 |
59.3 ± 3.4 |
58.3 ± 6.3 |
| Arai K. et al. |
Japan |
1992 |
VLCD |
A(W + M) |
Non follow-up |
8 weeks |
400 kcal |
ND |
20 |
25 |
— |
— |
31.6 ± 13.1 |
35.3 ± 11.7 |
| Teng N. I. et al. |
Malaysia |
2013 |
VLCD |
A(M) |
Non follow-up |
12 weeks |
300–500 kcal |
ND |
28 |
28 |
28/0 |
28/0 |
59.6 ± 5.4 |
59.1 ± 6.2 |
| Paisey R. B. et al. |
UK |
1995 |
VLCD |
A(W + M) |
Non follow-up |
12 weeks |
400–670 kcal |
D |
14 |
14 |
7/7 |
3/11 |
53.9 ± 5.7 |
55.4 ± 7.3 |
| Wing R. R. et al. |
US |
1994 |
VLCD |
A(W + M) |
Follow-up |
12 weeks |
400–500 kcal |
D |
45 |
48 |
15/30 |
18/30 |
52.3 ± 10.7 |
51.3 ± 8.7 |
| Torgerson J. S. et al. |
Sweden |
1997 |
VLCD |
A(W + M) |
Non follow-up |
12 weeks |
456–608 kcal |
ND |
58 |
55 |
22/36 |
17/38 |
47.3 ± 6.7 |
46.9 ± 5.8 |
| Wadden T. A. et al.a |
US |
1994 |
VLCD |
A(W) |
Non follow-up |
16 weeks |
420 kcal |
ND |
26 |
17 |
0/28 |
0/21 |
36.8 ± 8.9 |
42.9 ± 10.1 |
| Purcell K. et al.a |
Australia |
2014 |
VLCD |
A(W + M) |
Non follow-up |
12 weeks |
450–800 kcal |
ND |
76 |
51 |
26/71 |
25/78 |
49.6 ± 10.9 |
50.1 ± 11.1 |
| Stenius-Aarniala B. et al. |
Finland |
2000 |
VLCD |
A(W + M) |
Follow-up |
8 weeks |
420 kcal |
ND |
19 |
19 |
— |
— |
— |
— |
| Wadden T. A. et al. |
US |
1986 |
VLCD |
A(W + M) |
Non follow-up |
8 weeks |
400–500 kcal |
ND |
15 |
16 |
2/13 |
3/13 |
44.3 ± 8.7 |
44.3 ± 8.6 |
| Tuomilehto H. et al. |
Finland |
2010 |
VLCD |
A(W + M) |
Follow-up |
12 weeks |
600–800 kcal |
ND |
35 |
36 |
26/9 |
27/9 |
51.8 ± 9.0 |
51.7 ± 8.8 |
| Tuomilehto H. P. et al. |
Finland |
2009 |
VLCD |
A(W + M) |
Follow-up |
12 weeks |
600–800 kcal |
ND |
35 |
37 |
26/9 |
27/10 |
51.8 ± 9.0 |
50.9 ± 8.6 |
| Wadden T. A. et al. |
US |
1988 |
VLCD |
A(W + M) |
Follow-up |
8 weeks |
400–500 kcal |
ND |
15 |
16 |
2/13 |
3/13 |
44.3 ± 8.7 |
44.3 ± 8.6 |
| Williams K. V. et al.a |
US |
1998 |
PF |
A(W + M) |
Follow-up |
20 weeks |
400–600 kcal |
D |
16 |
14 |
9/9 |
7/11 |
51.4 ± 7.9 |
54.1 ± 7.0 |
| Author |
Body weight (kg) |
BMI (kg m−2) |
FEM (kg) |
FM (kg) |
WC (cm) |
TC (mmol L−1) |
LDL-C (mmol L−1) |
| IG |
CG |
IG |
CG |
IG |
CG |
IG |
CG |
IG |
CG |
IG |
CG |
IG |
CG |
| Bowen J. et al.a |
−10.0 ± 3.9 |
−12.5 ± 3.4 |
−3.8 ± 1.2 |
−4.4 ± 1.1 |
−1.4 ± 1.8 |
−1.9 ± 1.6 |
−8.4 ± 2.6 |
−10.3 ± 2.4 |
— |
— |
−0.5 ± 0.2 |
−0.6 ± 0.2 |
−0.4 ± 0.2 |
−0.4 ± 0.3 |
| Varady K. A. et al. |
−5.1 ± 1.0 |
−0.6 ± 1.0 |
— |
— |
−3.6 ± 0.5 |
−0.3 ± 0.5 |
−1.6 ± 0.5 |
−0.2 ± 0.5 |
— |
— |
−0.7 ± 0.2 |
−0.2 ± 0.1 |
−0.5 ± 0.2 |
−0.2 ± 0.1 |
| Bhutani S. et al.a |
−3.0 ± 1.0 |
0.0 ± 0.1 |
−1.0 ± 1.0 |
0.0 ± 1.0 |
−1.0 ± 1.0 |
−1.0 ± 1.0 |
−2.0 ± 1.0 |
0.0 ± 1.0 |
−5.0 ± 1.0 |
−1.0 ± 1.0 |
0.3 ± 0.1 |
0.1 ± 0.1 |
0.0 ± 0.1 |
0.1 ± 0.1 |
| Catenacci V. A. et al. |
−8.2 ± 0.9 |
−7.1 ± 1.0 |
−3.2 ± 0.3 |
−2.4 ± 0.3 |
— |
— |
−3.7 ± 0.5 |
−3.7 ± 0.5 |
— |
— |
−0.8 ± 0.2 |
−0.6 ± 0.2 |
−0.6 ± 0.1 |
−0.4 ± 0.1 |
| Hutchison A. T. et al.(1) |
−2.7 ± 0.5 |
0.4 ± 0.4 |
— |
— |
−0.5 ± 0.3 |
−0.4 ± 0.4 |
−2.3 ± 0.4 |
−0.2 ± 0.5 |
−4.3 ± 1.0 |
−1.4 ± 1.7 |
−0.4 ± 0.2 |
−0.3 ± 0.2 |
−0.2 ± 0.1 |
−0.2 ± 0.1 |
| Hutchison A. T. et al.(2) |
−5.4 ± 0.5 |
0.4 ± 0.4 |
— |
— |
−1.4 ± 0.3 |
−0.4 ± 0.4 |
−3.9 ± 0.4 |
−0.2 ± 0.5 |
−7.6 ± 1.2 |
−1.4 ± 1.7 |
−0.6 ± 0.1 |
−0.3 ± 0.2 |
−0.4 ± 0.1 |
−0.2 ± 0.1 |
| Moro T. et al. |
— |
— |
— |
— |
0.6 ± 0.9 |
0.5 ± 0.8 |
−1.6 ± 1.2 |
−0.3 ± 0.9 |
— |
— |
−0.1 ± 0.1 |
0.0 ± 0.2 |
−0.1 ± 0.1 |
0.0 ± 0.1 |
| Tinsley G. M. et al. |
−1.0 ± 4.0 |
3.0 ± 3.5 |
— |
— |
— |
— |
−0.6 ± 1.7 |
0.8 ± 1.1 |
— |
— |
— |
— |
— |
— |
| Li C. et al.a |
−3.5 ± 4.5 |
−2.0 ± 4.8 |
−1.2 ± 1.7 |
−0.6 ± 2.6 |
— |
— |
— |
— |
−4.4 ± 4.3 |
−0.3 ± 2.0 |
0.0 ± 0.7 |
−0.4 ± 0.7 |
−0.1 ± 0.7 |
−0.2 ± 0.4 |
| Haywood C. J. et al.(1) |
−11.6 ± 1.5 |
−4.0 ± 1.2 |
— |
— |
— |
— |
−7.8 ± 1.5 |
−2.8 ± 1.2 |
−10.8 ± 1.8 |
−3.9 ± 1.1 |
— |
— |
— |
— |
| Haywood C. J. et al.(2) |
−11.6 ± 1.5 |
−5.4 ± 1.2 |
— |
— |
— |
— |
−7.8 ± 1.5 |
−3.1 ± 0.9 |
−10.8 ± 1.8 |
−5.6 ± 1.6 |
— |
— |
— |
— |
| Hussin N. M. et al. |
−2.8 ± 1.6 |
−0.6 ± 1.5 |
−1.0 ± 0.4 |
−0.3 ± 0.5 |
— |
— |
— |
— |
— |
— |
— |
— |
— |
— |
| Burnand K. M. et al. |
−3.5 ± 2.0 |
−1.0 ± 1.7 |
−1.3 ± 0.7 |
−0.4 ± 0.6 |
— |
— |
— |
— |
— |
— |
— |
— |
— |
— |
| Teng N. I. et al. |
−2.3 ± 1.2 |
0.8 ± 1.7 |
−0.7 ± 0.6 |
0.3 ± 0.4 |
−0.5 ± 0.8 |
0.2 ± 1.0 |
— |
— |
— |
— |
— |
— |
— |
— |
| Arai K. et al. |
−9.0 ± 5.2 |
−5.2 ± 3.0 |
−4.1 ± 1.2 |
−2.1 ± 1.0 |
— |
— |
— |
— |
— |
— |
−0.7 ± 0.2 |
−0.2 ± 0.2 |
— |
— |
| Teng N. I. et al. |
−2.5 ± 1.4 |
0.0 ± 1.6 |
−0.9 ± 0.4 |
0.0 ± 0.4 |
0.2 ± 1.0 |
−0.9 ± 3.1 |
−1.5 ± 0.7 |
0.3 ± 1.4 |
— |
— |
−0.5 ± 0.2 |
0.1 ± 0.2 |
−0.3 ± 0.2 |
0.1 ± 0.2 |
| Paisey R. B. et al. |
−14.0 ± 7.0 |
−2.0 ± 4.6 |
−5.0 ± 2.4 |
−1.0 ± 2.4 |
— |
— |
— |
— |
−15.0 ± 7.4 |
0.0 ± 6.7 |
−0.6 ± 1.0 |
−0.1 ± 0.6 |
— |
— |
| Wing R. R. et al. |
−16.9 ± 0.6 |
−14.4 ± 0.9 |
— |
— |
— |
— |
— |
— |
— |
— |
−0.3 ± 0.3 |
−0.6 ± 0.2 |
−0.1 ± 0.3 |
−0.3 ± 0.2 |
| Torgerson J. S. et al. |
−15.8 ± 7.5 |
−6.4 ± 4.5 |
— |
— |
— |
— |
— |
— |
— |
— |
— |
— |
— |
— |
| Wadden T. A. et al.a |
−22.6 ± 6.0 |
−10.1 ± 6.2 |
— |
— |
−6.6 ± 3.5 |
−1.5 ± 2.9 |
— |
— |
— |
— |
— |
— |
— |
— |
| Purcell K. et al.a |
−14.6 ± 2.7 |
−14.3 ± 2.9 |
−5.3 ± 0.4 |
−5.2 ± 0.7 |
1.1 ± 4.4 |
0.5 ± 5.1 |
−12.7 ± 4.9 |
−14.1 ± 5.5 |
−15.5 ± 5.3 |
−16.2 ± 4.4 |
— |
— |
— |
— |
| Stenius-Aarniala B. et al. |
−14.2 ± 10.7 |
−0.3 ± 0.3 |
— |
— |
— |
— |
— |
— |
— |
— |
— |
— |
— |
— |
| Wadden T. A. et al. |
−13.2 ± 3.9 |
−9.6 ± 4.4 |
— |
— |
— |
— |
— |
— |
— |
— |
— |
— |
— |
— |
| Tuomilehto H. et al. |
−7.3 ± 6.5 |
−2.9 ± 7.5 |
−2.4 ± 2.1 |
−1.0 ± 2.6 |
— |
— |
— |
— |
−7.7 ± 6.7 |
−3.5 ± 7.3 |
0.1 ± 0.8 |
−0.1 ± 0.8 |
— |
— |
| Tuomilehto H. P. et al. |
−10.7 ± 6.5 |
−2.4 ± 5.6 |
−3.5 ± 2.1 |
−0.8 ± 2.0 |
— |
— |
— |
— |
−11.6 ± 6.6 |
−3.0 ± 6.0 |
— |
— |
— |
— |
| Wadden T. A. et al. |
−14.1 ± 5.1 |
−14.3 ± 6.7 |
— |
— |
— |
— |
— |
— |
— |
— |
— |
— |
— |
— |
| Williams K. V. et al.a |
−9.6 ± 1.4 |
−6.2 ± 1.4 |
— |
— |
— |
— |
— |
— |
— |
— |
−0.3 ± 0.4 |
−0.3 ± 0.2 |
−0.2 ± 0.3 |
−0.2 ± 0.3 |
| Author |
HDL-C (mmol L−1) |
TG (mmol L−1) |
SBP( mmHg) |
DBP (mmHg) |
Blood glucose (mmol L−1) |
Insulin (mIU L−1) |
| IG |
CG |
IG |
CG |
IG |
CG |
IG |
CG |
IG |
CG |
IG |
CG |
| IG, intervention group; CG, control group; ADMF, alternate day modified fasting; CADF, complete alternate-day fasting; TRF, time-restricted feeding; VLCD, very low calorie diet; PF, periodic fasting; A(W + M), Adult(women + men); A(W), Adult(women); A(M), Adult(men); ND, non-diabetes; D, diabetes; Gender(M/F), Gender(male/female); BMI, body mass index; FEM, fat free mass; FM, fat mass; WC, waist circumference; TC, total cholesterol; LDL-C, low density lipoprotein cholesterol; HDL-C, high density lipoprotein cholesterol; TG, triglycerides; SBP, systolic blood pressure; DBP, diastolic blood pressure. The variable of gender and age includes dropout. |
| Bowen J. et al.a |
−0.1 ± 0.1 |
0.0 ± 0.1 |
−0.2 ± 0.1 |
−0.4 ± 0.5 |
−7.2 ± 3.8 |
−8.4 ± 3.8 |
−4.1 ± 2.3 |
−3.6 ± 1.8 |
−0.1 ± 0.1 |
−0.2 ± 0.2 |
−4.3 ± 4.1 |
−4.4 ± 3.3 |
| Varady K. A. et al. |
−0.1 ± 0.1 |
0.0 ± 0.1 |
−0.2 ± 0.1 |
0.1 ± 0.1 |
−7.0 ± 2.0 |
1.0 ± 3.0 |
−6.0 ± 2.0 |
2.0 ± 6.0 |
— |
— |
— |
— |
| Bhutani S. et al.a |
0.0 ± 0.0 |
0.1 ± 0.0 |
0.1 ± 0.0 |
0.1 ± 0.0 |
−4.0 ± 0.6 |
−2.0 ± 1.5 |
−2.0 ± 0.4 |
−2.0 ± 2.1 |
−0.2 ± 0.1 |
0.1 ± 0.1 |
−2.0 ± 1.6 |
−4.0 ± 0.8 |
| Catenacci V. A. et al. |
−0.1 ± 0.0 |
−0.1 ± 0.0 |
−0.3 ± 0.1 |
0.0 ± 0.1 |
— |
— |
— |
— |
0.3 ± 0.1 |
0.2 ± 0.1 |
3.0 ± 2.3 |
−0.2 ± 2.4 |
| Hutchison A. T. et al.(1) |
−0.1 ± 0.1 |
0.0 ± 0.1 |
−0.3 ± 0.1 |
−0.3 ± 0.1 |
−5.6 ± 3.4 |
1.5 ± 1.7 |
−1.5 ± 2.0 |
−0.4 ± 1.0 |
0.1 ± 0.1 |
0.0 ± 0.1 |
2.9 ± 1.4 |
−0.4 ± 1.9 |
| Hutchison A. T. et al.(2) |
−0.1 ± 0.0 |
0.0 ± 0.1 |
−0.2 ± 0.1 |
−0.3 ± 0.1 |
−0.6 ± 3.2 |
1.5 ± 1.7 |
−2.5 ± 1.4 |
−0.4 ± 1.0 |
−0.2 ± 0.1 |
0.0 ± 0.1 |
−3.6 ± 1.0 |
−0.4 ± 1.9 |
| Moro T. et al. |
0.1 ± 0.0 |
0.0 ± 0.1 |
−0.1 ± 0.0 |
0.0 ± 0.0 |
— |
— |
— |
— |
−0.6 ± 0.1 |
0.0 ± 1.2 |
−1.0 ± 0.3 |
−0.3 ± 0.1 |
| Tinsley G. M. et al. |
— |
— |
— |
— |
— |
— |
— |
— |
— |
— |
— |
— |
| Li C. et al.a |
0.2 ± 0.6 |
−0.1 ± 0.2 |
−0.3 ± 1.0 |
0.0 ± 0.9 |
−13.9 ± 15.3 |
0.4 ± 15.8 |
−9.0 ± 12.3 |
3.2 ± 11.9 |
−0.6 ± 1.7 |
−2.1 ± 2.6 |
−3.5 ± 9.3 |
−0.2 ± 5.4 |
| Haywood C. J. et al.(1) |
— |
— |
— |
— |
— |
— |
— |
— |
— |
— |
— |
— |
| Haywood C. J. et al.(2) |
— |
— |
— |
— |
— |
— |
— |
— |
— |
— |
— |
— |
| Hussin N. M. et al. |
— |
— |
— |
— |
— |
— |
— |
— |
— |
— |
— |
— |
| Burnand K. M. et al. |
— |
— |
— |
— |
— |
— |
— |
— |
— |
— |
— |
— |
| Teng N. I. et al. |
— |
— |
— |
— |
— |
— |
— |
— |
— |
— |
— |
— |
| Arai K. et al. |
— |
— |
— |
— |
−15.6 ± 11.6 |
3.9 ± 7.5 |
−9.7 ± 7.1 |
−5.6 ± 10.9 |
−0.5 ± 0.9 |
−0.5 ± 0.4 |
— |
— |
| Teng N. I. et al. |
0.0 ± 0.0 |
0.0 ± 0.1 |
−0.2 ± 0.4 |
−0.1 ± 0.3 |
−6.5 ± 4.5 |
3.1 ± 3.4 |
−2.2 ± 2.1 |
2.1 ± 1.6 |
0.2 ± 0.1 |
0.5 ± 0.7 |
— |
— |
| Paisey R. B. et al. |
— |
— |
−1.4 ± 1.4 |
0.3 ± 1.0 |
0.0 ± 25.9 |
0.0 ± 22.2 |
−6.0 ± 18.5 |
−11.0 ± 16.3 |
— |
— |
— |
— |
| Wing R. R. et al. |
0.1 ± 0.0 |
0.1 ± 0.0 |
−0.8 ± 0.7 |
−1.0 ± 1.1 |
−9.0 ± 3.0 |
−6.0 ± 3.8 |
−6.0 ± 1.8 |
−3.0 ± 3.1 |
−3.6 ± 1.1 |
−3.2 ± 0.6 |
−12.3 ± 6.9 |
−9.3 ± 7.3 |
| Torgerson J. S. et al. |
— |
— |
— |
— |
— |
— |
— |
— |
— |
— |
— |
— |
| Wadden T. A. et al.a |
— |
— |
— |
— |
— |
— |
— |
— |
— |
— |
— |
— |
| Purcell K. et al.a |
— |
— |
— |
— |
— |
— |
— |
— |
— |
— |
— |
— |
| Stenius-Aarniala B. et al. |
— |
— |
— |
— |
— |
— |
— |
— |
— |
— |
— |
— |
| Wadden T. A. et al. |
— |
— |
— |
— |
— |
— |
— |
— |
— |
— |
— |
— |
| Tuomilehto H. et al. |
0.1 ± 0.2 |
0.1 ± 0.2 |
−0.2 ± 0.9 |
−0.1 ± 0.8 |
0.6 ± 8.5 |
−3.0 ± 11.3 |
0.0 ± 5.4 |
−1.7 ± 6.9 |
−0.4 ± 2.1 |
−0.3 ± 1.3 |
−2.2 ± 8.4 |
0.0 ± 4.6 |
| Tuomilehto H. P. et al. |
0.1 ± 0.2 |
0.1 ± 0.2 |
−0.5 ± 1.1 |
−0.1 ± 0.7 |
−1.7 ± 14.7 |
−1.1 ± 19.6 |
−1.9 ± 10.6 |
−0.4 ± 12.6 |
−0.6 ± 2.3 |
−0.4 ± 1.4 |
−5.9 ± 7.0 |
−1.2 ± 3.4 |
| Wadden T. A. et al. |
— |
— |
— |
— |
— |
— |
— |
— |
— |
— |
— |
— |
| Williams K. V. et al.a |
0.0 ± 0.0 |
−0.2 ± 0.1 |
−1.2 ± 0.2 |
−0.7 ± 0.8 |
— |
— |
— |
— |
−1.9 ± 0.6 |
−1.8 ± 0.6 |
−5.6 ± 1.0 |
−4.7 ± 3.1 |
Table 2 The summary of findings (SoF) with the GRADE system
|
Fasting intervention compared to no fasting intervention for regulating anthropometric and metabolic parameters
|
|
Population: subjects with overweight or obesity |
|
Settings: four studies were conducted in Asia, eight studies were conducted in Europe, nine studies were conducted in America and four studies were conducted in Oceania |
|
Intervention: fasting |
|
Comparison: no fasting intervention |
| Outcomesa |
SMD(95%CI)b |
No of participants (studies) |
Quality of the evidence comments (GRADE) |
| Body weight |
−2.16(−2.76, −1.56) kg |
1324 (24RCTs) |
⊕⊕⊕○ MODERATEc |
| BMI |
−1.18(−1.72, −0.65) kg m−2 |
725 (13RCTs) |
⊕⊕⊕○MODERATEc |
| FEM |
−0.82(−1.49, −0.15) kg |
537 (9RCTs) |
⊕⊕○ ○ LOWc,d |
| FM |
−2.20(−3.29, −1.11) kg |
629 (10RCTs) |
⊕⊕⊕○ MODERATEc |
| WC |
−2.31(−3.32, −1.30) cm |
534 (8RCTs) |
⊕⊕⊕○MODERATEc |
| TC |
−0.62(−1.36, 0.12) mmol L−1 |
666 (13RCTs) |
⊕⊕⊕○ MODERATEc |
| LDL-C |
−0.87(−1.57, −0.17) mmol L−1 |
522 (10RCTs) |
⊕⊕⊕○ MODERATEc |
| HDL-C |
−0.12(−0.75, 0.52) mmol L−1 |
665 (12RCTs) |
⊕⊕⊕○ MODERATEc |
| TG |
−0.61(−1.04, −0.18) mmol L−1 |
693 (13RCTs) |
⊕⊕⊕○ MODERATEc |
| SBP |
−1.08(−1.69, −0.47) mmHg |
649 (11RCTs) |
⊕⊕⊕○ MODERATEc |
| DBP |
−0.70(−1.13, −0.26) mmHg |
649 (11RCTs) |
⊕⊕⊕○ MODERATEc |
| Blood glucose |
−0.28(−0.75, 0.20) mmol L−1 |
680 (12RCTs) |
⊕⊕⊕○ MODERATEc |
| Insulin |
−0.21(−0.82, 0.40) mIU L−1 |
579 (10RCTs) |
⊕⊕⊕○ MODERATEc |
|
All subjects were followed up from 1 week to 5 months.
Results for variations of treatments compared with controls. SMD: standard mean deviation; CI: confidence interval; RCT: randomized controlled trial; BMI: body mass index; FEM: fat free mass; FM: fat mass; WC: waist circumference; TC: total cholesterol; LDL-C: low density lipoprotein cholesterol; HDL-C: high density lipoprotein cholesterol; TG: triglycerides; SBP: systolic blood pressure; DBP: diastolic blood pressure. Bias risk: Downgraded by one level as most of the included literature did not use the blind method (the main reason is that the intervention method cannot be blind). Inconsistency: Downgraded by one level as a high heterogeneity existed and its source was not completely clear. |
|
GRADE working group grades of evidence
|
|
High quality: We are very confident that the true effect lies close to that of the estimate of the effect |
|
Moderate quality: We are moderately confident in the effect estimate: The true effect is likely to be close to the estimate of the effect, but there is a possibility that it is substantially different |
|
Low quality: Our confidence in the effect estimate is limited: the true effect may be substantially different from the estimate of the effect |
|
Very low quality: We have very little confidence in the effect estimate: the true effect is likely to be substantially different from the estimate of effect |
The meta-analysis revealed that fasting intervention led to a significantly larger weight loss (SMD = −2.16 kg, 95%CI = −2.76, −1.56 kg; Fig. 3) compared with the control in subjects with overweight or obesity. Fasting intervention was associated with significantly larger reduction in BMI (SMD = −1.18 kg m−2, 95% CI = −1.72, −0.65 kg m−2; Fig. 4), FEM (SMD = −0.82 kg, 95% CI = −1.49, −0.15 kg; Fig. 5), FM (SMD = −2.20 kg, 95% CI = −3.29, −1.11 kg; Fig. 6), and WC (SMD = −2.31cm, 95% CI = −3.32, −1.30 cm; Fig. 7). Meanwhile, statistically significant differences in the variations in the LDL-C (SMD = −0.87 mmol L−1, 95% CI = −1.57, −0.17 mmol L−1; Fig. 8), TG (SMD = −0.61 mmol L−1,95% CI = −1.04, −0.18 mmol L−1; Fig. 9), SBP (SMD = −1.08 mmHg, 95% CI = −1.69, −0.47 mmHg; Fig. 10), and DBP (SMD = −0.70 mmHg, 95% CI = −1.13, −0.26 mmHg; Fig. 11) parameters were noticed between the intervention groups and the controls. However, the data obtained from the included literature did not indicate any significant effect of fasting on the TC (SMD = −0.62 mmol L−1, 95% CI = −1.36, 0.12 mmol L−1; Fig. 12), HDL-C (SMD = −0.12 mmol L−1, 95% CI = −0.75,0.52 mmol L−1; Fig. 13), blood glucose (SMD = −0.28 mmol L−1, 95% CI = −0.75, 0.20 mmol L−1; Fig. 14) and insulin (SMD = −0.21 mIU L−1, 95% CI = −0.82, 0.40 mIU L−1; Fig. 15) concentrations.
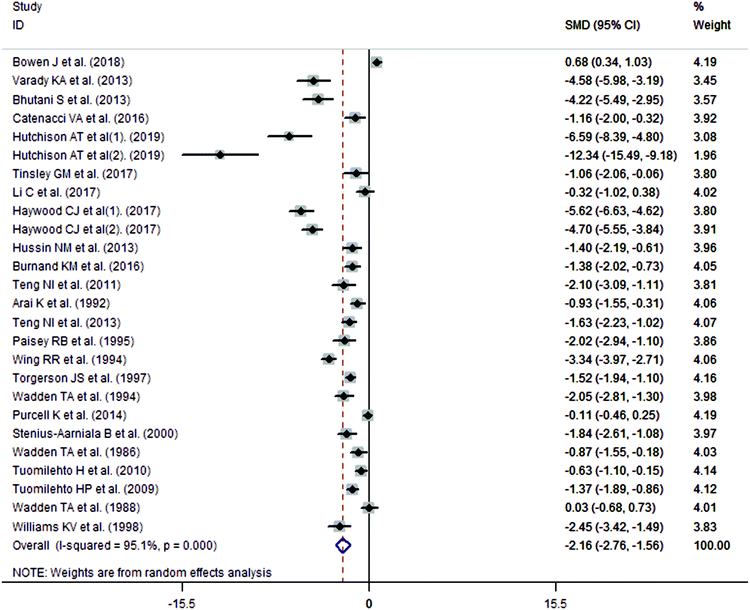 |
| | Fig. 3 Meta-analysis results of fasting intervention for the body weight in subjects with overweight or obesity. | |
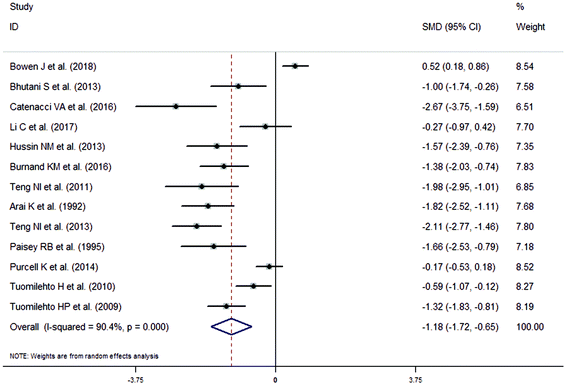 |
| | Fig. 4 Meta-analysis results of fasting intervention for the body mass index (BMI) in subjects with overweight or obesity. | |
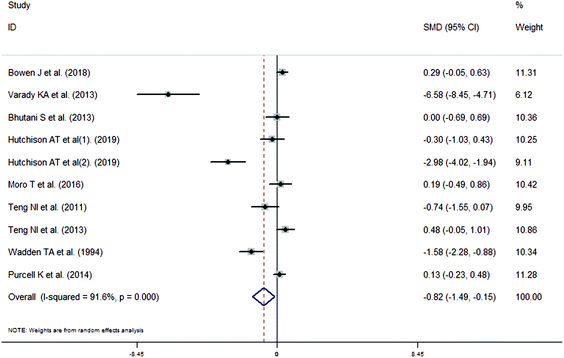 |
| | Fig. 5 Meta-analysis results of fasting intervention for the fat free mass (FEM) in subjects with overweight or obesity. | |
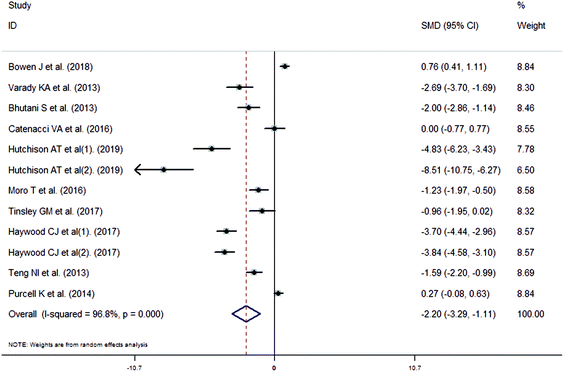 |
| | Fig. 6 Meta-analysis results of fasting intervention for the fat mass (FM) in subjects with overweight or obesity. | |
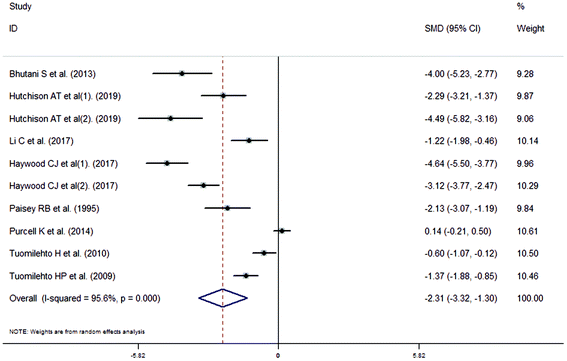 |
| | Fig. 7 Meta-analysis results of fasting intervention for the waist circumference (WC) in subjects with overweight or obesity. | |
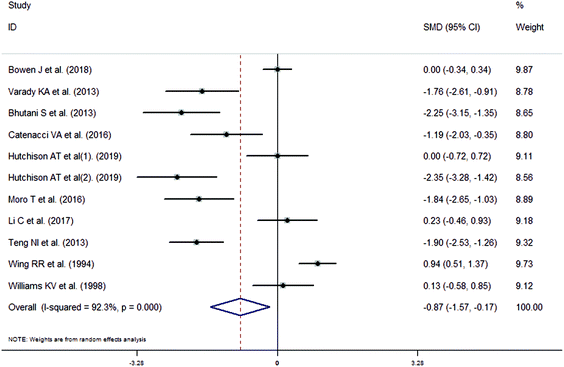 |
| | Fig. 8 Meta-analysis results of fasting intervention for the low density lipoprotein cholesterol (LDL-C) in subjects with overweight or obesity. | |
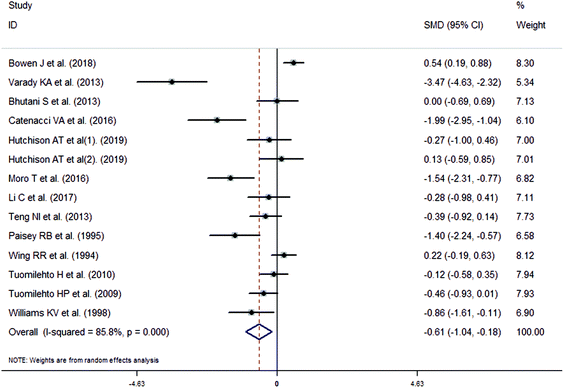 |
| | Fig. 9 Meta-analysis results of fasting intervention for the triglycerides (TG) in subjects with overweight or obesity. | |
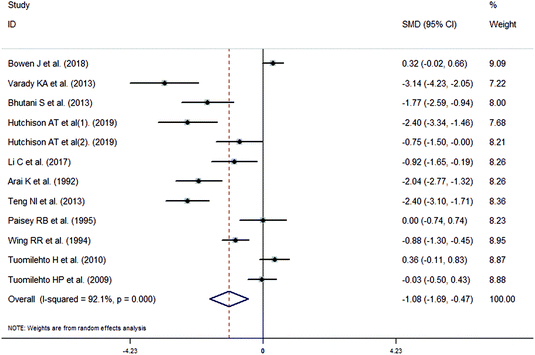 |
| | Fig. 10 Meta-analysis results of fasting intervention for the systolic blood pressure (SBP) in subjects with overweight or obesity. | |
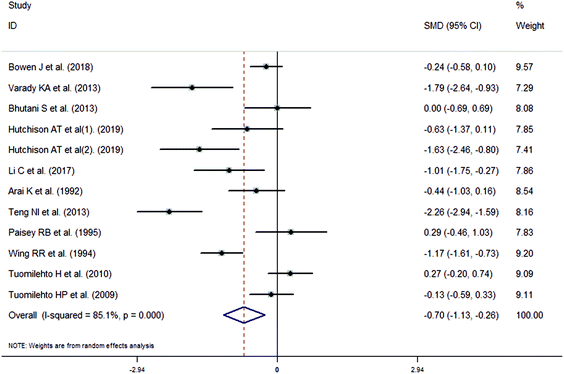 |
| | Fig. 11 Meta-analysis results of fasting intervention for the diastolic blood pressure (DBP) in subjects with overweight or obesity. | |
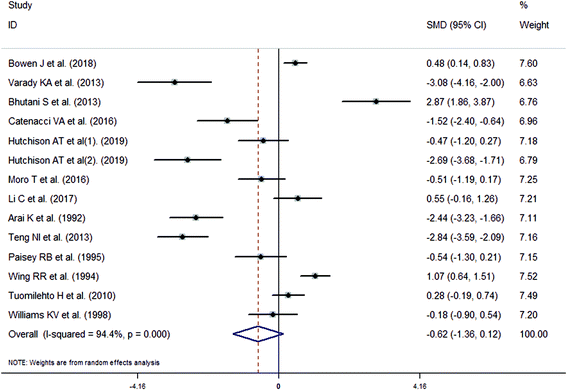 |
| | Fig. 12 Meta-analysis results of fasting intervention for the total cholesterol (TC) in subjects with overweight or obesity. | |
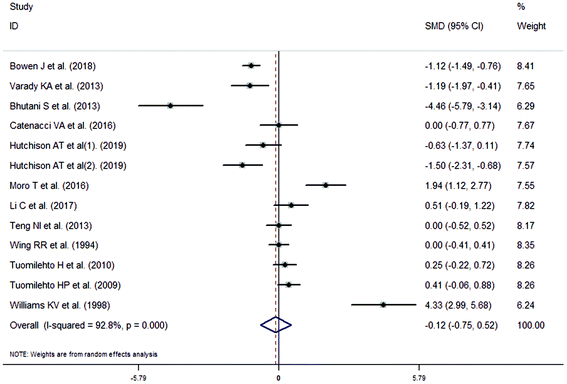 |
| | Fig. 13 Meta-analysis results of fasting intervention for the high density lipoprotein cholesterol (HDL-C) in subjects with overweight or obesity. | |
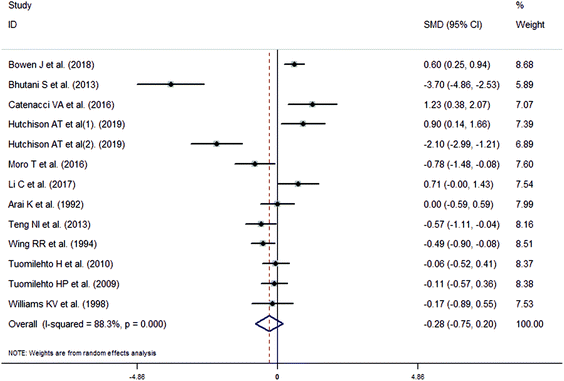 |
| | Fig. 14 Meta-analysis results of fasting intervention for the blood glucose in subjects with overweight or obesity. | |
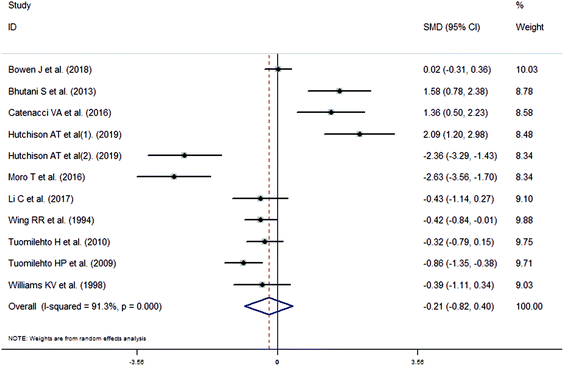 |
| | Fig. 15 Meta-analysis results of fasting intervention for the insulin in subjects with overweight or obesity. | |
The outcomes of subgroup analyses for fasting intervention and the change of anthropometric and metabolic parameters in the people with overweight or obesity are summarized in Table 3. Region may be the sources of heterogeneity for body weight, BMI, TC and SBP in the associated studies. Subject type may be the sources of heterogeneity for FM and LDL-C and outcome type may be the sources of heterogeneity for TG, blood glucose, WC and insulin. In addition, fasting type may be the sources of heterogeneity for HDL-C and fasting time may be the sources of heterogeneity for DBP.
Table 3 Subgroup analyses were performed for anthropometric and metabolic parameters
| Factors |
Number of studies |
| BW |
BMI |
FEM |
FM |
WC |
TC |
LDL-C |
HDL-C |
TG |
SBP |
DBP |
BG |
Insulin |
|
Fasting type
|
| ADMF |
3 |
2 |
3 |
3 |
— |
3 |
3 |
3 |
3 |
3 |
3 |
2 |
2 |
| CADF |
2 |
— |
1 |
2 |
1 |
2 |
2 |
2 |
2 |
1 |
1 |
2 |
2 |
| TRF |
— |
— |
— |
2 |
— |
— |
— |
— |
— |
— |
— |
— |
— |
| VLCD |
17 |
10 |
4 |
3 |
6 |
6 |
3 |
5 |
6 |
7 |
7 |
6 |
4 |
|
Subjects
|
| Adult(W + M) |
18 |
10 |
4 |
6 |
7 |
10 |
7 |
9 |
10 |
9 |
9 |
9 |
8 |
| Adult(W) |
2 |
— |
2 |
1 |
1 |
1 |
1 |
1 |
1 |
1 |
1 |
1 |
1 |
| Adult(M) |
4 |
3 |
3 |
3 |
— |
2 |
2 |
2 |
2 |
— |
— |
2 |
— |
|
Outcome type
|
| NF |
16 |
9 |
— |
— |
5 |
9 |
7 |
7 |
8 |
7 |
7 |
7 |
5 |
| F |
8 |
4 |
— |
— |
3 |
4 |
3 |
5 |
5 |
4 |
4 |
5 |
5 |
|
Fasting time
|
| <12 weeks |
9 |
4 |
2 |
4 |
2 |
5 |
4 |
4 |
4 |
3 |
3 |
5 |
4 |
| ≥12 weeks |
15 |
9 |
7 |
6 |
6 |
8 |
6 |
8 |
9 |
8 |
8 |
7 |
6 |
|
Region
|
| Oceania |
4 |
2 |
3 |
4 |
3 |
2 |
2 |
2 |
2 |
2 |
2 |
2 |
2 |
| America |
10 |
2 |
3 |
4 |
— |
5 |
5 |
5 |
5 |
3 |
3 |
4 |
4 |
| Europe |
7 |
5 |
— |
— |
4 |
4 |
2 |
4 |
5 |
4 |
4 |
4 |
4 |
| Asia |
4 |
4 |
2 |
— |
— |
2 |
— |
— |
— |
2 |
2 |
2 |
— |
|
Diabetes
|
| No |
20 |
11 |
— |
— |
6 |
9 |
7 |
9 |
9 |
8 |
8 |
9 |
7 |
| Yes |
4 |
2 |
— |
— |
2 |
4 |
3 |
3 |
4 |
3 |
3 |
3 |
3 |
| Factors |
Standard mean difference (95% CI), P |
| BW |
BMI |
FEM |
FM |
|
Fasting type
|
| ADMF |
−2.67(−6.67,1.34), 0.192 |
−0.20(−1.69,1.29), 0.790 |
−1.78(−3.93,0.37), 0.105 |
−1.28(−3.67,1.11), 0.295 |
| CADF |
−6.53(−12.33,−0.73), 0.027 |
— |
−1.61(−4.24,1.02), 0.229 |
−4.36(−9.13,0.42), 0.074 |
| TRF |
— |
— |
— |
−1.14(−1.73,−0.55), <0.001 |
| VLCD |
−1.73(−2.31,−1.15), <0.001 |
−1.25(−1.73,−0.76), <0.001 |
−0.39(−1.21,0.44), 0.360 |
−2.20(−4.31,−0.08), 0.042 |
|
Subjects
|
| Adult(W + M) |
−1.85(−2.53,−1.17), <0.001 |
−0.97(−1.54,−0.40), 0.001 |
−0.94(−2.04,0.17), 0.097 |
−1.58(−3.00,−0.15), 0.030 |
| Adult(W) |
−6.80(−11.97,−1.62), 0.010 |
— |
−1.58(−2.97,−0.18), 0.027 |
−6.56(−10.16,−2.96), <0.001 |
| Adult(M) |
−1.56(−1.95,−1.16), <0.001 |
−1.92(−2.37,−1.46), <0.001 |
0.03(−0.64,0.70), 0.926 |
−1.36(−1.78,−0.94), <0.001 |
|
Outcome type
|
| NF |
−2.58(−3.42,−1.75), <0.001 |
−1.34(−2.11,−0.56), 0.001 |
— |
— |
| F |
−1.40(−2.15,−0.65), <0.001 |
−0.90(−1.41,−0.39), 0.001 |
— |
— |
|
Fasting time
|
| <12 weeks |
−1.94(−2.85,−1.04), <0.001 |
−1.48(−2.37,−0.59), 0.001 |
−0.99(−2.65,0.68), 0.245 |
−2.88(−4.90,−0.86), 0.005 |
| ≥12 weeks |
−2.26(−3.06,−1.45), <0.001 |
−1.05(−1.68,−0.42), 0.001 |
−0.75(−1.52,0.02), 0.057 |
−1.80(−3.21,−0.39), 0.012 |
|
Region
|
| Oceania |
−4.39(−6.64,−2.15), <0.001 |
0.18(−0.51,0.86), 0.614 |
−0.57(−1.46,0.31), 0.205 |
−3.12(−5.07,−1.16), 0.002 |
| America |
−2.13(−3.09,−1.17), <0.001 |
−1.78(−3.42,−0.15), 0.032 |
−2.52(−5.02,−0.03), 0.047 |
−1.39(−2.59,−0.20), 0.022 |
| Europe |
−1.26(−1.68,−0.84), <0.001 |
−1.02(−1.50,−0.54), <0.001 |
— |
— |
| Asia |
−1.44(−1.89,−0.99), <0.001 |
−1.89(−2.27,−1.51), <0.001 |
−0.09(−1.28,1.11), 0.880 |
— |
|
Diabetes
|
| No |
−2.19(−2.84,−1.53), <0.001 |
−1.23(−1.82,−0.63), <0.001 |
— |
— |
| Yes |
−2.03(−3.47,−0.60), 0.006 |
−0.94(−2.30,0.42), 0.174 |
— |
— |
| Factors |
Standard mean difference (95% CI), P |
| WC |
TC |
LDL-C |
HDL-C |
|
Fasting type
|
| ADMF |
— |
0.10(−2.47,2.68), 0.937 |
−1.30(−2.86,0.27), 0.104 |
−2.11(−3.59,−0.64), 0.005 |
| CADF |
−3.33(−5.49,−1.18), 0.002 |
−1.53(−2.79,−0.26), 0.018 |
−1.16(−2.49,0.18), 0.091 |
−0.70(−1.53,0.13), 0.098 |
| TRF |
— |
— |
— |
— |
| VLCD |
−1.82(−2.95,−0.69), 0.002 |
−0.63(−1.86,0.60), 0.313 |
−0.23(−1.95,1.49), 0.790 |
0.19(−0.02,0.41), 0.082 |
|
Subjects
|
| Adult(W + M) |
−2.07(−3.17,−0.96), <0.001 |
−0.22(−1.01,0.56), 0.579 |
−0.50(−1.27,0.27), 0.200 |
−0.15(−0.94,0.64), 0.717 |
| Adult(W) |
−3.33(−5.49,−1.18), 0.002 |
−1.55(−3.74,0.63), 0.163 |
−1.16(−3.46,1.15), 0.325 |
−1.05(−1.89,−0.20), 0.015 |
| Adult(M) |
— |
−1.67(−3.95,0.61), 0.152 |
−1.87(−2.37,−1.37), <0.001 |
0.94(−0.96,2.85), 0.331 |
|
Outcome type
|
| NF |
−2.90(−4.56,−1.24), 0.001 |
−1.06(−2.09,−0.04), 0.042 |
−1.38(−2.15,−0.61), <0.001 |
−0.80(−1.66,0.07), 0.071 |
| F |
−1.04(−1.56,−0.52), <0.001 |
0.47(−0.07,1.00), 0.087 |
0.50(−0.06,1.06), 0.081 |
0.85(0.07,1.62), 0.032 |
|
Fasting time
|
| <12 weeks |
−2.59(−4.26,−0.91), 0.002 |
−1.15(−2.15,−0.16), 0.023 |
−1.00(−1.99,−0.02), 0.046 |
0.06(−1.01,1.14), 0.907 |
| ≥12 weeks |
−2.20(−3.44,−0.95), 0.001 |
−0.22(−1.18,0.74), 0.654 |
−0.77(−1.76,0.22), 0.129 |
−0.23(−1.06,0.60), 0.590 |
|
Region
|
| Oceania |
−2.85(−4.97,−0.73), 0.008 |
−0.84(−2.49,0.82), 0.321 |
−0.72(−1.96,0.51), 0.251 |
−1.09(−1.45,−0.72), <0.001 |
| America |
— |
−0.15(−1.79,1.49), 0.858 |
−0.79(−2.09,0.50), 0.228 |
−0.27(−1.97,1.43), 0.756 |
| Europe |
−1.25(−1.83,−0.67), <0.001 |
−0.03(−0.55,0.49), 0.914 |
−0.79(−2.82,1.23), 0.443 |
0.71(0.10,1.32), 0.024 |
| Asia |
— |
−2.65(−3.19,−2.11), <0.001 |
— |
— |
|
Diabetes
|
| No |
−2.48(−3.71,−1.26), <0.001 |
−0.98(−1.96,0.01), 0.052 |
−1.38(−2.15,−0.61), <0.001 |
−0.55(−1.24,0.15), 0.125 |
| Yes |
−1.63(−2.51,−0.75), <0.001 |
0.26(−0.51,1.03), 0.506 |
0.50(−0.06,1.06), 0.081 |
1.48(−0.32,3.29), 0.108 |
| Factors |
Standard mean difference (95% CI), P |
| TG |
SBP |
DBP |
BG |
|
Fasting type
|
| ADMF |
−0.89(−2.68,0.90), 0.331 |
−1.48(−3.58,0.62), 0.166 |
−0.62(−1.49,0.26), 0.168 |
−1.51(−5.72,2.69), 0.481 |
| CADF |
−0.67(−1.83,0.49), 0.255 |
−1.55(−3.16,0.07), 0.060 |
−1.11(−2.10,−0.13), 0.026 |
0.02(−1.97,2.01), 0.986 |
| TRF |
— |
— |
— |
— |
| VLCD |
−0.33(−0.69,0.04), 0.079 |
−0.83(−1.55,−0.10), 0.027 |
−0.63(−1.26,0.01), 0.054 |
−0.14(−0.45,0.17), 0.384 |
|
Subjects
|
| Adult(W + M) |
−0.66(−1.21,−0.12), 0.017 |
−0.82(−1.46,−0.19), 0.011 |
−0.44(−0.84,−0.04), 0.033 |
−0.13(−0.66,0.41), 0.644 |
| Adult(W) |
−0.07(−0.58,0.44), 0.791 |
−1.55(−3.16,0.07), 0.060 |
−1.11(−2.10,−0.13), 0.026 |
−0.59(−3.53,2.35), 0.694 |
| Adult(M) |
−0.93(−2.05,0.20), 0.107 |
— |
— |
−0.65(−1.07,−0.22), 0.003 |
|
Outcome type
|
| NF |
−0.86(−1.57,−0.14), 0.019 |
−1.49(−2.47,−0.51), 0.003 |
−0.81(−1.42,−0.21), 0.008 |
−0.49(−1.32,0.35), 0.252 |
| F |
−0.24(−0.58,0.11), 0.178 |
−0.35(−0.98,0.28), 0.280 |
−0.49(−1.20,0.22), 0.174 |
−0.08(−0.43,0.26), 0.641 |
|
Fasting time
|
| <12 weeks |
−0.76(−1.51,−0.00), 0.049 |
−1.50(−2.28,−0.72), 0.001 |
−0.88(−1.38,−0.38), 0.001 |
0.00(−0.88,0.89), 0.995 |
| ≥12 weeks |
−0.53(−1.05,−0.01), 0.046 |
−0.87(−1.61,−0.13), 0.021 |
−0.61(−1.18,−0.03), 0.039 |
−0.49(−1.10,0.11), 0.108 |
|
Region
|
| Oceania |
0.22(−0.27,0.71), 0.384 |
−0.89(−2.40,0.61), 0.245 |
−0.77(−1.56,0.02), 0.056 |
−0.16(−1.68,1.35), 0.832 |
| America |
−1.14(−2.28,−0.00), 0.049 |
−1.85(−3.08,−0.61), 0.003 |
−0.97(−1.88,−0.06), 0.037 |
−0.72(−2.13,0.69), 0.317 |
| Europe |
−0.69(−1.22,−0.17), 0.010 |
−0.10(−0.58,0.39), 0.692 |
−0.11(−0.62,0.40), 0.664 |
−0.06(−0.55,0.42), 0.793 |
| Asia |
— |
−2.23(−2.74,−1.73), <0.001 |
−1.34(−3.13,0.45), 0.141 |
−0.30(−0.86,0.26), 0.294 |
|
Diabetes
|
| No |
−0.65(−1.21,−0.10), 0.021 |
−1.26(−2.09,−0.43), 0.003 |
−0.71(−1.24,−0.19), 0.007 |
−0.38(−0.99,0.23), 0.221 |
| Yes |
−0.53(−1.25,0.20), 0.156 |
−0.64(−1.18,−0.11), 0.018 |
−0.66(−1.52,0.20), 0.134 |
−0.02(−0.73,0.68), 0.947 |
| Factors |
Standard mean difference (95% CI), P |
Heterogeneity I2(%), P |
| Insulin |
BW |
BMI |
FEM |
FM |
WC |
|
Fasting type
|
| ADMF |
0.76(−0.76,2.28), 0.329 |
98.0, <0.001 |
92.6, <0.001 |
96.0, <0.001 |
97.0, <0.001 |
— |
| CADF |
0.37(−2.27,3.01), 0.784 |
97.0, <0.001 |
— |
94.2, <0.001 |
97.3, <0.001 |
85.9, 0.008 |
| TRF |
— |
— |
— |
— |
0.0,0.667 |
— |
| VLCD |
−0.51(−0.75,−0.26), <0.001 |
93.5, <0.001 |
83.6, <0.001 |
88.3, <0.001 |
98.1, <0.001 |
96.2, <0.001 |
|
Subjects
|
| Adult(W + M) |
0.00(−0.47,0.47), 0.997 |
95.6, <0.001 |
90.3, <0.001 |
94.1, <0.001 |
97.6, <0.001 |
96.1, <0.001 |
| Adult(W) |
−0.13(−4.49,4.23), 0.953 |
96.4, <0.001 |
— |
88.8, <0.001 |
86.6, 0.006 |
85.9, <0.001 |
| Adult(M) |
— |
0.0, 0.509 |
0.0, 0.595 |
67.2, 0.047 |
0.0, 0.522 |
— |
|
Outcome type
|
| NF |
0.02(−1.31,1.35), 0.974 |
96.1, <0.001 |
92.9, <0.001 |
— |
— |
96.9, <0.001 |
| F |
−0.50(−0.73,−0.26), <0.001 |
90.8, <0.001 |
68.2, 0.024 |
— |
— |
60.0, 0.082 |
|
Fasting time
|
| <12 weeks |
−0.39(−2.15,1.37), 0.665 |
91.4, <0.001 |
81.9, 0.001 |
92.4, <0.001 |
94.7, <0.001 |
88.7, <0.001 |
| ≥12 weeks |
−0.12(−0.61,0.37), 0.628 |
96.3, <0.001 |
91.5, <0.001 |
92.2, <0.001 |
97.7, <0.001 |
96.6, <0.001 |
|
Region
|
| Oceania |
−0.07(−2.02,1.88), 0.941 |
98.5, <0.001 |
86.9, 0.006 |
91.6, <0.001 |
98.4, <0.001 |
97.7, <0.001 |
| America |
0.50(−0.56,1.55), 0.355 |
91.2, <0.001 |
84.0, 0.012 |
95.5, <0.001 |
85.9, <0.001 |
— |
| Europe |
−0.99(−1.77,−0.20), 0.014 |
70.4, 0.002 |
66.8, 0.017 |
— |
— |
69.9, 0.019 |
| Asia |
— |
35.5, 0.199 |
0.0, 0.778 |
83.5, 0.014 |
— |
— |
|
Diabetes
|
| No |
−0.13(−1.01,0.74), 0.764 |
95.3, <0.001 |
91.6, <0.001 |
— |
— |
96.6, <0.001 |
| Yes |
−0.42(−0.74,−0.10), 0.010 |
92.5, <0.001 |
83.3, 0.014 |
— |
— |
53.7, 0.142 |
| Factors |
Heterogeneity I2(%), P |
| TC |
LDL-C |
HDL-C |
TG |
SBP |
DBP |
BG |
Insulin |
| ADMF, alternate day modified fasting; CADF, complete alternate-day fasting; TRF, time-restricted feeding; VLCD, very low calorie diet; Adult(W + M), Adult(women + men); Adult(W), Adult(women); Adult(M), Adult(men); NF, non follow-up; F, follow-up; BW, body weight; BMI, body mass index; FEM, fat free mass; FM, fat mass; WC, waist circumference; TC, total cholesterol; LDL-C, low density lipoprotein cholesterol; HDL-C, high density lipoprotein cholesterol; TG, triglycerides; SBP, systolic blood pressure; DBP, diastolic blood pressure; BG, blood glucose. |
|
Fasting type
|
| ADMF |
96.8, <0.001 |
93.6, <0.001 |
91.2, <0.001 |
95.3, <0.001 |
96.1, <0.001 |
83.6, 0.002 |
97.9, <0.001 |
91.9, 0.001 |
| CADF |
84.4, 0.002 |
87.2, <0.001 |
70.9, 0.032 |
84.2, 0.002 |
86.2, 0.007 |
68.0, 0.077 |
94.2, <0.001 |
96.2, <0.001 |
| TRF |
— |
— |
— |
— |
— |
— |
— |
— |
| VLCD |
95.9, <0.001 |
96.2, <0.001 |
0.0, 0.550 |
63.7, 0.017 |
91.1, <0.001 |
88.8, <0.001 |
54.2, 0.053 |
0.0, 0.411 |
|
Subjects
|
| Adult(W + M) |
93.8, <0.001 |
91.1, <0.001 |
93.8, <0.001 |
88.5, <0.001 |
91.3, <0.001 |
79.5, <0.001 |
88.2, <0.001 |
83.5, <0.001 |
| Adult(W) |
92.1, <0.001 |
93.5, <0.001 |
57.8, 0.124 |
0.0, 0.445 |
86.2, 0.007 |
68.0, 0.077 |
96.0, <0.001 |
97.8, <0.001 |
| Adult(M) |
95.1, <0.001 |
0.0, 0.911 |
93.4, <0.001 |
82.9, 0.016 |
— |
— |
0.0, 0.645 |
— |
|
Outcome type
|
| NF |
95.0, <0.001 |
90.0, <0.001 |
92.3, <0.001 |
90.3, <0.001 |
93.7, <0.001 |
85.9, <0.001 |
92.6, <0.001 |
95.0, <0.001 |
| F |
72.3, 0.013 |
60.9, 0.078 |
89.2, <0.001 |
51.9, 0.081 |
83.9, <0.001 |
87.2, <0.001 |
52.1, 0.079 |
0.0, 0.563 |
|
Fasting time
|
| <12 weeks |
89.6, <0.001 |
87.1, <0.001 |
89.8, <0.001 |
79.3, 0.001 |
74.8, 0.008 |
48.1, 0.123 |
88.4, <0.001 |
95.3, <0.001 |
| ≥12 weeks |
95.3, <0.001 |
94.4, <0.001 |
94.4, <0.001 |
87.6, <0.001 |
93.2, <0.001 |
89.2, <0.001 |
89.8, <0.001 |
83.1, <0.001 |
|
Region
|
| Oceania |
94.7, <0.001 |
91.0, <0.001 |
18.8, 0.292 |
53.1, 0.119 |
93.7, <0.001 |
79.0, 0.009 |
93.9, <0.001 |
95.6, <0.001 |
| America |
95.7, <0.001 |
93.9, <0.001 |
95.6, <0.001 |
91.9, <0.001 |
87.4, <0.001 |
83.1, 0.003 |
93.4, <0.001 |
89.8, <0.001 |
| Europe |
61.3, 0.051 |
93.1, <0.001 |
76.8, 0.005 |
72.2, 0.006 |
64.0, 0.040 |
67.2, 0.027 |
65.0, 0.036 |
84.9, <0.001 |
| Asia |
0.0, 0.474 |
— |
— |
— |
0.0, 0.485 |
93.7, <0.001 |
49.7, 0.159 |
— |
|
Diabetes
|
| No |
95.3, <0.001 |
90.0, <0.001 |
92.2, <0.001 |
88.2, <0.001 |
94.0, <0.001 |
86.5, <0.001 |
90.4, <0.001 |
93.8, <0.001 |
| Yes |
82.8, 0.001 |
60.9, 0.078 |
94.6, <0.001 |
79.9, 0.002 |
54.9, 0.109 |
82.0, 0.004 |
75.4, 0.017 |
0.0, 0.995 |
The results of publication bias for included studies are given in Table 4. Publication biases were observed in the body weight, BMI, FEM, FM, WC, TC, LDL-C and SBP (P < 0.05). However, there was no significant difference between the SMD and that before the trim and fill. Therefore, the effect of publication bias was considered slight and the results were stable (Table 4).
Table 4 Publication bias (Egger test) and sensitivity analysis (trim and fill method) performed for included studies
| |
Egger test (t, P) |
Number of trim and fill |
SMD(95%CI), Pa |
SMD(95%CI), Pb |
| BMI: body mass index; FEM: fat free mass; FM: fat mass; WC: waist circumference; TC: total cholesterol; LDL-C: low density lipoprotein cholesterol; HDL-C: high density lipoprotein cholesterol; TG: triglycerides; SBP: systolic blood pressure; DBP: diastolic blood pressure. Original variation. Variation after trim and fill. |
| Body weight (kg) |
−5.72, <0.001 |
3 |
−2.16(−2.76,−1.56), <0.001 |
−2.58(−3.39,−1.77), <0.001 |
| BMI (kg m−2) |
−5.03, <0.001 |
0 |
−1.18(−1.72,−0.65), <0.001 |
−1.18(−1.72,−0.65), <0.001 |
| FEM (kg) |
−3.96, 0.004 |
1 |
−0.82(−1.49,−0.15), 0.016 |
−1.04(−1.79,−0.28), 0.007 |
| FM (kg) |
−4.60, 0.001 |
0 |
−2.20(−3.29,−1.11), <0.001 |
−2.20(−3.29,−1.11), <0.001 |
| WC (cm) |
−4.55, 0.002 |
0 |
−2.31(−3.32,−1.30), <0.001 |
−2.31(−3.32,−1.30), <0.001 |
| TC (mmol L−1) |
−2.42, 0.032 |
0 |
−0.62(−1.36,0.12), 0.099 |
−0.62(−1.36,0.12), 0.099 |
| LDL-C (mmol L−1) |
−2.88, 0.018 |
0 |
−0.87(−1.57,−0.17), 0.014 |
−0.87(−1.57,−0.17), 0.014 |
| HDL-C (mmol L−1) |
0.37, 0.717 |
— |
−0.12(−0.75,0.52), 0.720 |
— |
| TG (mmol L−1) |
−5.29, <0.001 |
— |
−0.61(−1.04,−0.18), 0.005 |
−0.61(−1.04,−0.18), 0.005 |
| SBP (mmHg) |
−3.93, 0.003 |
0 |
−1.08(−1.69,−0.47), 0.001 |
−1.08(−1.69,−0.47), 0.001 |
| DBP (mmHg) |
−1.44, 0.181 |
— |
−0.70(−1.13,−0.26), 0.002 |
— |
| Blood glucose (mmol L−1) |
−1.47, 0.169 |
— |
−0.28(−0.75,0.20), 0.253 |
— |
| Insulin (mIU L−1) |
0.08, 0.941 |
— |
−0.21(−0.82,0.40), 0.496 |
— |
4. Discussion
According to the existing evidence of relevant animal and human studies, fasting has a beneficial effect on advancing health and reduces the risk of several chronic illnesses in adults, especially for overweight and sedentary people.6 Similarly, our study found that participants with overweight or obesity receiving fasting intervention had significantly larger reductions in body weight, BMI, FEM, FM, WC, LDL-C, TG, SBP and DBP parameters than the control subjects. One crucial mechanism resulting in these profitable influences seems to be “flipping” of the metabolic switch.8 When the hepatic glycogen is depleted due to fasting, some metabolic adaptations are observed in the liver, thus retaining systemic energy balance and supplying the major organs, tissues and cells with sufficient nutrients.48 The characteristics are increased numbers of circulating ketones, whereas circulating fatty acids, amino acids, glucose, and insulin are preserved at low concentrations.49 And it is owing to the fat mobilization and the oxidative decomposition of fatty acids.50,51 Ketones are metabolized to acetyl coenzyme A, which then enters the tricarboxylic acid (TCA) cycle to generate ATP, thus serving as an energy source to sustain the function of muscle and brain cells during fasting.51 In other words, the primary energy source for the body shifts from glucose to free fatty acids derived from adipose tissue lipolysis and ketones, which means “flipping” of the metabolic switch.8 For this reason, fasting may have a potential effect on the regulation of obesity and related metabolic parameters.
The existence of small LDL particles and higher post-prandial hyperlipemia are markers of myocardial infarction (MI) and ischemic heart disease (IHD) progression.52,53 Our study found that the fasting intervention group had significant decreases more in LDL-C, and TG parameters than the control group. Recent clinic trials have demonstrated that alternate day fasting could reduce the ratio of small LDL particles, thereby causing the reduction of LDL-C and TG parameters.25,54 Meanwhile, weight loss may also be an important factor. Previous literature indicated that only subjects with more weight loss had a significant blood lipid decrease, as with blood pressure.8 Similarly, in view of our outcomes of the subgroup meta-analysis, after fasting was stopped for a period of time, the amount of weight loss was smaller based on SMD values. Correspondingly, the variations in blood lipids and blood pressure between the fasting intervention subjects and controls change to no statistically significant differences.
Based on the outcomes of the subgroup meta-analysis, apart from HDL-C, blood glucose and insulin, the anthropometric and metabolic parameters had a larger reduction in the CADF group than the VLCD group in view of SMD values (especially at body weight, WC, TC and DBP parameters). Although the previous literature showed that the differences between intermittent and continuous energy restriction were not observed in boosting weight reduction and metabolic improvements, our study especially indicated that CADF is more effective in regulating anthropometric and metabolic parameters than VLCD for people with overweight or obesity.55 The possible mechanisms include improving autophagy via sirtuin-1 activity stimulation, changing cell apoptosis, increasing the expression of vascular endothelial growth factor (VEGF), and reducing glycosylation end products.56–59 Meanwhile, some studies indicated that subjects of IF usually did not take enough energy in the normal diet period to compensate for the fasting period, thus indicating that IF could decrease the total energy intake.8,60 In addition, the incidence of adverse events of short-term intermittent fasting was lower than that of long-term fasting.8 Similarly, the results of subgroup analysis indicated no differences in the influence of fasting time on regulating anthropometric and metabolic parameters. Therefore, short-term CADF may be a better choice for people with overweight or obesity. However, as previous studies have shown, due to differences in trial design, participant characteristics, and subject compliance, as well as limited sample size and studies, more clinic trials are needed to estimate the role of CADF in people with overweight or obesity.61
Although the differences between the fasting intervention and control subjects were not found in the variations in the insulin parameter, significant differences were noticed for the VLCD intervention in view of subgroup analysis. It is universally known that weight gain and obesity are critical risk factors in terms of insulin resistance.62 Simultaneously, insulin-resistant patients with obesity need more insulin to regulate blood glucose, leading to weight gain progressively, thus a vicious circle formation.63 Previous studies found that the VLCD could normalize insulin sensitivity and total insulin secretion via reducing the hepatic and pancreatic fat.64 Meanwhile, as an anabolic hormone, insulin could induce cell growth and advance the storage of fatty acids in adipose and muscle tissue, irritating muscle hypertrophy and restraining proteolysis.65,66 Therefore, the insulin secretion returns to normal and can reduce body weight and a virtuous circle is established. Correspondingly, fasting intervention can effectively improve patients with obesity and diabetes through the dual regulation of body weight and insulin levels in terms of the outcomes of subgroup analysis. Moreover, statistically significant differences in the variations in insulin parameter were noticed between the fasting intervention and control subjects after fasting was stopped for a period of time. This beneficial effect may result from a cellular stress response induced by the fasting state. However, the theory has been proved only in animal experiments, human trials are needed.67
This study has some limitations. The blind method is not applicable to all included studies due to the intervention contents and methods for participants and nutritionists could not be masked. Although the research staff of some studies evaluating the outcome were unaware of the apportion of the participants, true intervention effects could be biased by the restricted quality of the methodology.68 Meanwhile, the heterogeneity of most results is high. The reasons may be the differences of subjects and region, as well as the outcome type and other factors. In addition, due to the lack of control or changes before and after the intervention in many studies, there are few studies of IF meeting the inclusion criteria.
5. Conclusion
Our study found that fasting intervention had a significant effect on the regulation of anthropometric and metabolic parameters by significantly reducing the body weight, BMI, FEM, FM, WC, LDL-C, TG, SBP and DBP in people with overweight or obesity. Considering some limitations found in this study, more data from large clinical trials are needed to affirm the efficacy of fasting for the regulation of anthropometric and metabolic parameters in people with overweight or obesity.
Author contributions
BL, WC, and SY made the study design; SY, CW, and HZ conducted the study; SY, CW, and YP analyzed the data and wrote the manuscript; SY, HW, YG and NY attended the manuscript revision. All authors agreed with the final manuscript.
Conflicts of interest
The authors declare that there are no conflicts of interest regarding the publication of this paper.
Acknowledgements
This work was supported by the National Natural Science Foundation of China (No. 81973129).
References
- D. K. Dahiya, Renuka, M. Puniya, U. K. Shandilya and T. Dhewa,
et al., Gut Microbiota Modulation and Its Relationship with Obesity Using Prebiotic Fibers and Probiotics: A Review, Front. Microbiol., 2017, 8, 563 CrossRef PubMed.
- A. Afshin, M. H. Forouzanfar, M. B. Reitsma, P. Sur and K. Estep,
et al., Health Effects of Overweight and Obesity in 195 Countries over 25 Years, N. Engl. J. Med., 2017, 377, 13–27 CrossRef PubMed.
- Y. C. Wang, K. McPherson, T. Marsh, S. L. Gortmaker and M. Brown, Health and economic burden of the projected obesity trends in the USA and the UK, Lancet, 2011, 378, 815–825 CrossRef.
- K. Rtveladze, T. Marsh, S. Barquera, L. M. Sanchez Romero and D. Levy,
et al., Obesity prevalence in Mexico: impact on health and economic burden, Public Health Nutr., 2014, 17, 233–239 CrossRef PubMed.
- L. Keaver, L. Webber, A. Dee, F. Shiely and T. Marsh,
et al., Application of the UK foresight obesity model in Ireland: the health and economic consequences of projected obesity trends in Ireland, PLoS One, 2013, 8, e79827 CrossRef PubMed.
- V. D. Longo and M. P. Mattson, Fasting: molecular mechanisms and clinical applications, Cell Metab., 2014, 19, 181–192 CrossRef CAS PubMed.
- A. Michalsen and C. Li, Fasting therapy for treating and preventing disease - current state of evidence, Forsch. Komplementarmedi., 2013, 20, 444–453 CrossRef PubMed.
- S. D. Anton, K. Moehl, W. T. Donahoo, K. Marosi and S. A. Lee,
et al., Flipping the Metabolic Switch: Understanding and Applying the Health Benefits of Fasting, Obesity, 2018, 26, 254–268 CrossRef PubMed.
- L. Harris, S. Hamilton, L. B. Azevedo, J. Olajide and C. De Brun,
et al., Intermittent fasting interventions for treatment of overweight and obesity in adults: a systematic review and meta-analysis, JBI Database Syst. Rev. Implement. Repo., 2018, 16, 507–547 CrossRef PubMed.
- A. R. Barnosky, K. K. Hoddy, T. G. Unterman and K. A. Varady, Intermittent fasting vs daily calorie restriction for type 2 diabetes prevention: a review of human findings, Transl. Res., 2014, 164, 302–311 CrossRef PubMed.
- R. E. Patterson and D. D. Sears, Metabolic Effects of Intermittent Fasting, Annu. Rev. Nutr., 2017, 37, 371 CrossRef CAS PubMed.
- J. Bowen, E. Brindal, G. James-Martin and M. Noakes, Randomized Trial of a High Protein, Partial Meal Replacement Program with or without Alternate Day Fasting: Similar Effects on Weight Loss, Retention Status, Nutritional, Metabolic, and Behavioral Outcomes, Nutrients, 2018, 10, 1145–1160 CrossRef PubMed.
- M. P. Mattson, V. D. Longo and M. Harvie, Impact of intermittent fasting on health and disease processes, Ageing Res. Rev., 2017, 39, 46–58 CrossRef PubMed.
- L. G. Darlington, N. W. Ramsey and J. R. Mansfield, Placebo-controlled, blind study of dietary manipulation therapy in rheumatoid arthritis, Lancet, 1986, 1, 236–238 CrossRef CAS.
- L. Skoldstam, L. Larsson and F. D. Lindstrom, Effect of fasting and lactovegetarian diet on rheumatoid arthritis, Scand. J. Rheumatol., 1979, 8, 249–255 CrossRef CAS PubMed.
- J. Guevara-Aguirre, P. Balasubramanian, M. Guevara-Aguirre, M. Wei and F. Madia,
et al., Growth hormone receptor deficiency is associated with a major reduction in pro-aging signaling, cancer, and diabetes in humans, Sci. Transl. Med., 2011, 3, 70ra13 Search PubMed.
- A. Nencioni, I. Caffa, S. Cortellino and V. D. Longo, Fasting and cancer: molecular mechanisms and clinical application, Nat. Rev. Cancer, 2018, 18, 707–719 CrossRef CAS PubMed.
- A. Zubrzycki, K. Cierpka-Kmiec, Z. Kmiec and A. Wronska, The role of low-calorie diets and intermittent fasting in the treatment of obesity and type-2 diabetes, J. Physiol. Pharmacol., 2018, 69, 663–683 CAS.
- L. Sellahewa, C. Khan, S. Lakkunarajah and I. Idris, A Systematic Review of Evidence on the Use of Very Low Calorie Diets in People with Diabetes, Curr. Diabetes Rev., 2017, 13, 35–46 CrossRef PubMed.
- J. F. Trepanowski, C. M. Kroeger, A. Barnosky, M. C. Klempel and S. Bhutani,
et al., Effect of Alternate-Day Fasting on Weight Loss, Weight Maintenance, and Cardioprotection Among Metabolically Healthy Obese Adults: A Randomized Clinical Trial, JAMA Intern. Med., 2017, 177, 930–938 CrossRef PubMed.
- J. P. Higgins, D. G. Altman, P. C. Gotzsche, P. Juni and D. Moher,
et al., The Cochrane Collaboration's tool for assessing risk of bias in randomised trials, BMJ (Clin. Res. Ed.), 2011, 343, d5928 CrossRef PubMed.
- G. H. Guyatt, A. D. Oxman, G. E. Vist, R. Kunz and Y. Falck-Ytter,
et al., GRADE: an emerging consensus on rating quality of evidence and strength of recommendations, BMJ (Clin. Res. Ed.), 2008, 336, 924–926 CrossRef PubMed.
- M. Tarsilla, Cochrane Handbook for Systematic Reviews of Interventions, J. Multidiscip. Eval., 2008, 6, 142–148 Search PubMed.
- K. A. Varady, S. Bhutani, M. C. Klempel, C. M. Kroeger and J. F. Trepanowski,
et al., Alternate day fasting for weight loss in normal weight and overweight subjects: a randomized controlled trial, Nutr. J., 2013, 12, 146 CrossRef PubMed.
- S. Bhutani, M. C. Klempel, C. M. Kroeger, J. F. Trepanowski and K. A. Varady, Alternate day fasting and endurance exercise combine to reduce body weight and favorably alter plasma lipids in obese humans, Obesity, 2013, 21, 1370–1379 CrossRef CAS PubMed.
- V. A. Catenacci, Z. Pan, D. Ostendorf, S. Brannon and W. S. Gozansky,
et al., A randomized pilot study comparing zero-calorie alternate-day fasting to daily caloric restriction in adults with obesity, Obesity, 2016, 24, 1874–1883 CrossRef CAS PubMed.
- A. T. Hutchison, B. Liu, R. E. Wood, A. D. Vincent and C. H. Thompson,
et al., Effects of Intermittent Versus Continuous Energy Intakes on Insulin Sensitivity and Metabolic Risk in Women with Overweight, Obesity, 2019, 27, 50–58 CrossRef CAS PubMed.
- T. Moro, G. Tinsley, A. Bianco, G. Marcolin and Q. F. Pacelli,
et al., Effects of eight weeks of time-restricted feeding (16/8) on basal metabolism, maximal strength, body composition, inflammation, and cardiovascular risk factors in resistance-trained males, J. Transl. Med., 2016, 14, 290 CrossRef PubMed.
- G. M. Tinsley, J. S. Forsse, N. K. Butler, A. Paoli and A. A. Bane,
et al., Time-restricted feeding in young men performing resistance training: A randomized controlled trial, Eur. J. Sport Sci., 2017, 17, 200–207 CrossRef PubMed.
- C. Li, B. Sadraie, N. Steckhan, C. Kessler and R. Stange,
et al., Effects of A One-week Fasting Therapy in Patients with Type-2 Diabetes Mellitus and Metabolic Syndrome - A Randomized Controlled Explorative Study, Exp. Clin. Endocrinol. Diabetes, 2017, 125, 618–624 CrossRef CAS PubMed.
- C. J. Haywood, L. A. Prendergast, K. Purcell, L. Le Fevre and W. K. Lim,
et al., Very Low Calorie Diets for Weight Loss in Obese Older Adults-A Randomized Trial, J. Gerontol., Ser. A, 2017, 73, 59–65 CrossRef PubMed.
- N. M. Hussin, S. Shahar, N. I. Teng, W. Z. Ngah and S. K. Das, Efficacy of fasting and calorie restriction (FCR) on mood and depression among ageing men, J. Nutr., Health Aging, 2013, 17, 674–680 CrossRef CAS PubMed.
- K. M. Burnand, R. P. Lahiri, N. Burr, L. Jansen van Rensburg and M. P. Lewis, A randomised, single blinded trial, assessing the effect of a two week preoperative very low calorie diet on laparoscopic cholecystectomy in obese patients, HPB, 2016, 18, 456–461 CrossRef PubMed.
- N. I. Teng, S. Shahar, Z. A. Manaf, S. K. Das and C. S. Taha,
et al., Efficacy of fasting calorie restriction on quality of life among aging men, Physiol. Behav., 2011, 104, 1059–1064 CrossRef CAS PubMed.
- K. Arai, J. Miura, M. Ohno, J. Yokoyama and Y. Ikeda, Comparison of
clinical usefulness of very-low-calorie diet and supplemental low-calorie diet, Am. J. Clin. Nutr., 1992, 56, 275s–276s CrossRef CAS PubMed.
- N. I. Teng, S. Shahar, N. F. Rajab, Z. A. Manaf and M. H. Johari,
et al., Improvement of metabolic parameters in healthy older adult men following a fasting calorie restriction intervention, Aging male, 2013, 16, 177–183 CrossRef CAS PubMed.
- R. B. Paisey, P. Harvey, S. Rice, I. Belka and I. Ash, Short-term results of an open trial of very low calorie diet or intensive conventional diet in Type 2 diabetes, Practical Diabetes Int., 2011, 12, 263–267 CrossRef.
- R. R. Wing, E. Blair, M. Marcus, L. H. Epstein and J. Harvey, Year-long weight loss treatment for obese patients with type II diabetes: does including an intermittent very-low-calorie diet improve outcome?, Am. J. Med., 1994, 97, 354–362 CrossRef CAS PubMed.
- J. S. Torgerson, L. Lissner, A. K. Lindroos, H. Kruijer and L. Sjostrom, VLCD plus dietary and behavioural support versus support alone in the treatment of severe obesity. A randomised two-year clinical trial, Int. J. Obes. Relat. Metab. Disord., 1997, 21, 987–994 CrossRef CAS PubMed.
- T. A. Wadden, G. D. Foster and K. A. Letizia, One-year behavioral treatment of obesity: comparison of moderate and severe caloric restriction and the effects of weight maintenance therapy, J. Consult. Clini. Psychol., 1994, 62, 165–171 CAS.
- K. Purcell, P. Sumithran, L. A. Prendergast, C. J. Bouniu and E. Delbridge,
et al., The effect of rate of weight loss on long-term weight management: a randomised controlled trial, Lancet Diabetes Endocrinol., 2014, 2, 954–962 CrossRef PubMed.
- B. Stenius-Aarniala, T. Poussa, J. Kvarnstrom, E. L. Gronlund and M. Ylikahri,
et al., Immediate and long term effects of weight reduction in obese people with asthma: randomised controlled study, BMJ (Clin. Res. Ed.), 2000, 320, 827–832 CrossRef CAS PubMed.
- T. A. Wadden and A. J. Stunkard, Controlled trial of very low calorie diet, behavior therapy, and their combination in the treatment of obesity, J. Consult. Clin. Psychol., 1986, 54, 482–488 CAS.
- H. Tuomilehto, H. Gylling, M. Peltonen, T. Martikainen and J. Sahlman,
et al., Sustained improvement in mild obstructive sleep apnea after a diet- and physical activity-based lifestyle intervention: postinterventional follow-up, Am. J. Clin. Nutr., 2010, 92, 688–696 CrossRef CAS PubMed.
- H. P. Tuomilehto, J. M. Seppa, M. M. Partinen, M. Peltonen and H. Gylling,
et al., Lifestyle intervention with weight reduction: first-line treatment in mild obstructive sleep apnea, Am. J. Respir. Crit. Care Med., 2009, 179, 320–327 CrossRef PubMed.
- T. A. Wadden, A. J. Stunkard and J. Liebschutz, Three-year follow-up of the treatment of obesity by very low calorie diet, behavior therapy, and their combination, J. Consult. Clin. Psychol., 1988, 56, 925–928 CAS.
- K. V. Williams, M. L. Mullen, D. E. Kelley and R. R. Wing, The effect of short periods of caloric restriction on weight loss and glycemic control in type 2 diabetes, Diabetes Care, 1998, 21, 2–8 CrossRef CAS PubMed.
- F. G. Cahill, Fuel Metabolism in Starvation, Annu. Rev. Nutr., 2006, 26, 1–22 CrossRef PubMed.
- A. Di Francesco, C. Di Germanio, M. Bernier and R. de Cabo, A time to fast, Science, 2018, 362, 770–775 CrossRef CAS.
- L. B. Gano, M. Patel and J. M. Rho, Ketogenic diets, mitochondria, and neurological diseases, J. Lipid Res., 2014, 55, 2211–2228 CrossRef CAS PubMed.
- G. F. Cahill Jr., Fuel metabolism in starvation, Annu. Rev. Nutr., 2006, 26, 1–22 CrossRef PubMed.
- A. C. St-Pierre, I. L. Ruel, B. Cantin, G. R. Dagenais and P. M. Bernard,
et al., Comparison of various electrophoretic characteristics of LDL particles and their relationship to the risk of ischemic heart disease, Circulation, 2001, 104, 2295–2299 CrossRef CAS PubMed.
- B. G. Nordestgaard, M. Benn, P. Schnohr and A. Tybjaerg-Hansen, Nonfasting triglycerides
and risk of myocardial infarction, ischemic heart disease, and death in men and women, J. Am. Med. Assoc., 2007, 298, 299–308 CrossRef CAS PubMed.
- K. A. Varady, S. Bhutani, M. C. Klempel and B. Lamarche, Improvements in LDL particle size and distribution by short-term alternate day modified fasting in obese adults, Br. J. Nutr., 2011, 105, 580–583 CrossRef CAS PubMed.
- I. Cioffi, A. Evangelista, V. Ponzo, G. Ciccone and L. Soldati,
et al., Intermittent versus continuous energy restriction on weight loss and cardiometabolic outcomes: a systematic review and meta-analysis of randomized controlled trials, J. Transl. Med., 2018, 16, 15 CrossRef PubMed.
- B. D. Horne, J. B. Muhlestein and J. L. Anderson, Health effects of intermittent fasting: hormesis or harm? A systematic review, Am. J. Clin. Nutr., 2015, 102, 464–470 CrossRef CAS PubMed.
- V. D. Longo and M. P. Mattson, Fasting: Molecular Mechanisms and Clinical Applications, Cell Metab., 2014, 19, 181–192 CrossRef CAS PubMed.
- S. Golbidi, A. Daiber, B. Korac, H. Li and M. F. Essop,
et al., Health Benefits of Fasting and Caloric Restriction, Curr. Diabetes Rep., 2017, 17, 11 CrossRef PubMed.
- K. H. Kim, Y. H. Kim, J. E. Son, J. H. Lee and S. Kim,
et al., Intermittent fasting promotes adipose thermogenesis and metabolic homeostasis via VEGF-mediated alternative activation of macrophage, Cell Res., 2017, 27, 1309–1326 CrossRef CAS PubMed.
- R. V. Seimon, J. A. Roekenes, J. Zibellini, B. Zhu and A. A. Gibson,
et al., Do intermittent diets provide physiological benefits over continuous diets for weight loss? A systematic review of clinical trials, Mol. Cell. Endocrinol., 2015, 418(Pt 2), 153–172 CrossRef CAS PubMed.
- G. M. Tinsley and P. M. La Bounty, Effects of intermittent fasting on body composition and clinical health markers in humans, Nutr. Rev., 2015, 73, 661–674 CrossRef PubMed.
- S. E. Shoelson, L. Herrero and A. Naaz, Obesity, Inflammation, and Insulin Resistance, Gastroenterology, 2007, 132, 2169–2180 CrossRef CAS PubMed.
- A. Brown, N. Guess, A. Dornhorst, S. Taheri and G. Frost, Insulin-associated weight gain in obese type 2 diabetes mellitus patients: What can be done?, Diabetes, Obes. Metab., 2017, 19, 1655–1668 CrossRef PubMed.
- E. L. Lim, K. G. Hollingsworth, B. S. Aribisala, M. J. Chen and J. C. Mathers,
et al., Reversal of type 2 diabetes: normalisation of beta cell function in association with decreased pancreas and liver triacylglycerol, Diabetologia, 2011, 54, 2506–2514 CrossRef CAS PubMed.
- R. R. Wolfe, Effects of insulin on muscle tissue, Curr. Opin. Clin. Nutr. Metab. Care, 2000, 3, 67–71 CrossRef CAS PubMed.
- A. R. Saltiel and C. R. Kahn, Insulin signalling and the regulation of glucose and lipid metabolism, Nature, 2001, 414, 799–806 CrossRef CAS PubMed.
- R. M. Anson, Z. Guo, R. de Cabo, T. Iyun and M. Rios,
et al., Intermittent fasting dissociates beneficial effects of dietary restriction on glucose metabolism and neuronal resistance to injury from calorie intake, Proc. Natl. Acad. Sci. U. S. A., 2003, 100, 6216–6220 CrossRef CAS PubMed.
- S. Yan, Z. Tian, M. Li, B. Li and W. Cui, Effects of probiotic supplementation on the regulation of blood lipid levels in overweight or obese subjects: a meta-analysis, Food Funct., 2019, 10, 1747–1759 RSC.
Footnote |
| † Electronic supplementary information (ESI) available. See DOI: 10.1039/d0fo00287a |
|
| This journal is © The Royal Society of Chemistry 2020 |
Click here to see how this site uses Cookies. View our privacy policy here.  Open Access Article
 *b
*b


