
 Open Access Article
 This Open Access Article is licensed under a
 Creative Commons Attribution 3.0 Unported Licence
Reliable, accessible and transferable method for the quantification of flavanols and procyanidins in foodstuffs and dietary supplements†
Ugo
Bussy
 *a,
Brian R.
May‡
a,
Yusuf
Olanrewaju‡
a,
Gregory
Hewitt
a,
Nicholas
Anderson
a,
Alan
Crozier
b,
Javier I.
Ottaviani
ab and
Catherine
Kwik-Uribe
a
*a,
Brian R.
May‡
a,
Yusuf
Olanrewaju‡
a,
Gregory
Hewitt
a,
Nicholas
Anderson
a,
Alan
Crozier
b,
Javier I.
Ottaviani
ab and
Catherine
Kwik-Uribe
a
aMars, Incorporated, 6885 Elm St, McLean, VA 22101, USA. E-mail: ugo.bussy@effem.com
bDepartment of Nutrition, University of California, Davis, CA 95616-5270, USA
First published on 8th January 2020
Abstract
Flavanols and procyanidins are plant-derived bioactives that are receiving increasing attention because of their potential health benefits. Analytical tools that can accurately identify and reproducibly quantify these bioactives are critical to researchers for test material characterization, as well as to the food industry and regulators, notably for product labeling. However, the chemical complexity of procyanidins, and the absence of analytical standards have prevented the development of methods that could serve the needs of these different sectors. This report describes the development and validation of a reliable, accessible and transferable method for the quantification of flavanol monomers and procyanidins in cocoa-derived dietary supplements and foodstuffs. To accomplish this, flavanols and procyandins from cocoa, one of the most studied dietary sources of these compounds, were used as a model system. To overcome limitations related to the absence of analytical standards, a cocoa extract was thoroughly characterized for use as a calibrant. It was then used in the development and validation of a method based on reliable and accessible instrumentation, namely HPLC coupled with fluorescence detection. The resulting method permitted the quantification of flavanols and procyanidins in amounts ranging from 2 to 500 mg g−1, with high precision (%RSD 0.2 to 1.9%) and accuracy (100.7 to 102.9%). The method was successfully applied to assess the flavanol and procyanidin content of different cocoa-based commercial products. Furthermore, the high precision of the methods showed the feasibility of using principal component analysis of flavanol and procyanidin profiles to discriminate cocoa-derived products by origin and manufacturing processes. A feature that offers advantages in monitoring product authenticity/adulteration. Overall, these findings support the application of this method for the routine analysis of cocoa flavanols and procyandins.
1 Introduction
Flavanols, including (−)-epicatechin and (+)-catechin, and their related oligomers, the procyanidins (Fig. 1), are dietary bioactives present in many foods and beverages that are consumed worldwide. Flavanols and procyanidins are receiving increasing attention for their cardiovascular1 and cognitive benefits.2 For example, health claims for these bioactives have been granted for cocoa in the European Union,3 and a growing number of foods and dietary supplements, some specifically formulated with high levels of flavanols and procyanidins, are being sold to the general public. In this context, there is a need for analytical methods that are not only able to quantify flavanols and procyanidins in a reliable manner, but that are also accessible and easily transferred. Such testing will assure the harmonization of methods across laboratories, thus enabling comparability of results. This will further support research on the bioactivity and health effects of flavanols and procyanidins as well as provide much needed tools for food industry and regulators with regard to reliable content claims, proper labeling of products, and ultimately empower individuals to make informed decisions on their diet.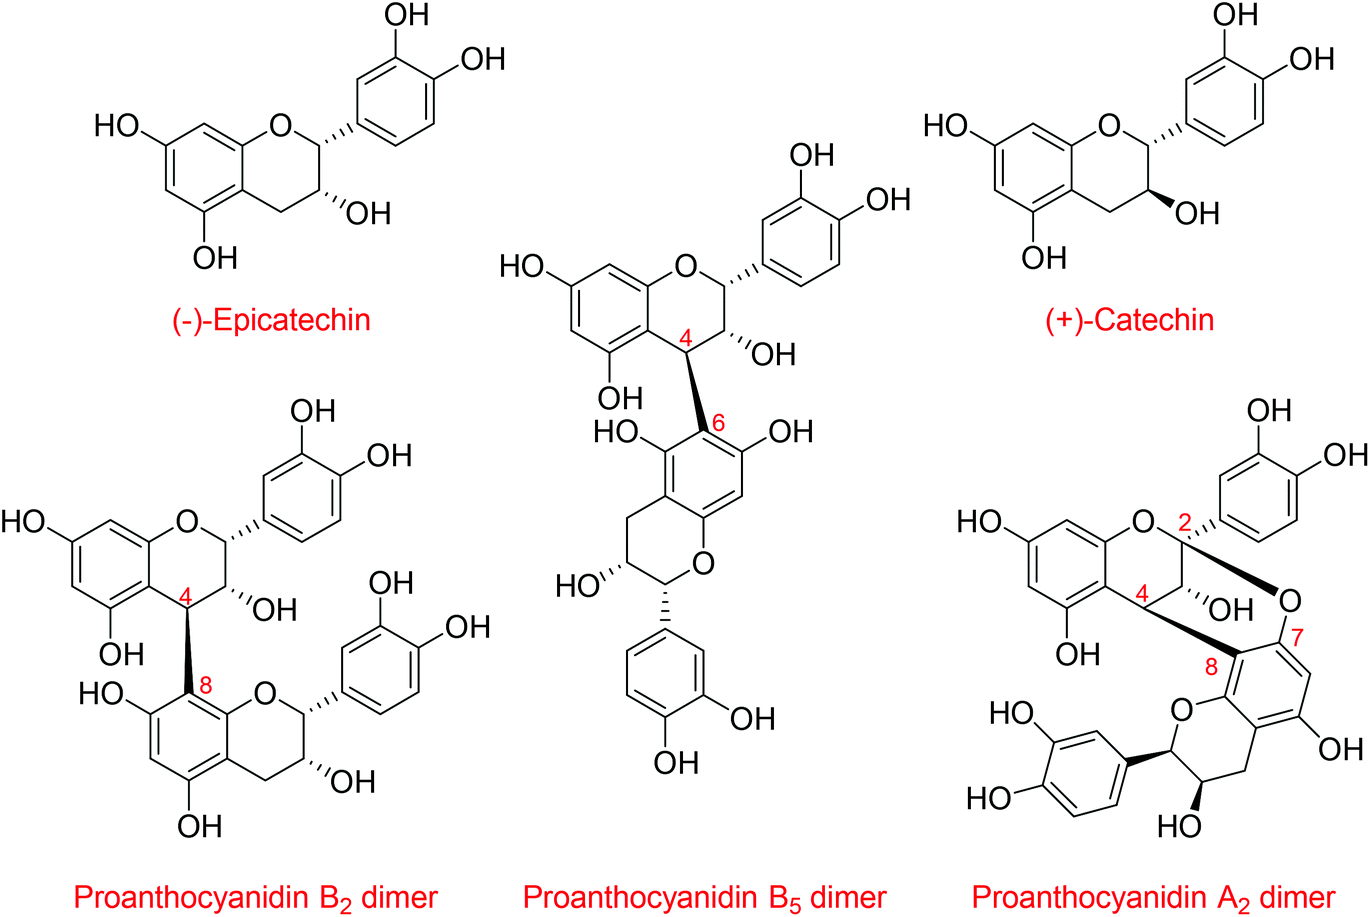 | ||
| Fig. 1 Structures of (−)-epicatechin, (+)-catechin and type-A and type-B procyanidins. | ||
Methods have been developed and validated for the quantification of flavanols and procyanidins, the majority relying on HILIC chromatography4 coupled to fluorescence detection (FLD).5,6 This approach provides good sensivitiy via FLD7 while HILIC conditions enable the resolution of flavanol and procyanidins based on their degree of polymerization (DP) up to seven or more units,6,8,9 thereby retaining information on the complex compositional character of these components. One of the unresolved challenges for flavanol and procyanidin quantification is the absence of analytical standards. Flavanols and procyanidins comprise numerous structures,10,11 and except for monomeric flavanols and procyanidin dimers, analytical standards are sparse and acquiring them for routine analysis is prohibitively expensive. Relative response factors (RRFs), determined as the ratio of the fluorescence response of procyanidins with the same degree of polymerization relative to that of (−)-epicatechin, have been used to circumvent this problem.12 However, this approach is very restrictive as RRFs can only be used under the very specific predefined HPLC conditions in which the RRFs were determined, thus preventing any future refinements or adaptations of the method.13 The use of a well-characterized reference material as a secondary analytical standard/external calibrant, instead of RRFs, could represent a robust alternative. The availability of a suitable external calibrant would assure method transferability and harmonization across laboratories, and unlike RRFs, it would also support further optimization of analytical methods that could take advantage of the continuous improvements in HPLC/UHPLC stationary phase chemistry.14
In this investigation, we focused on the development of a reliable, accessible and transferable protocol for analyzing flavanols and procyanidins in food and dietary supplements that could be easily integrated into routine testing. To accomplish this, flavanols and procyanidins from cocoa (collectively referred to as cocoa flavanols, CF) were used as a model system. The different steps of this study included: (i) the characterization a cocoa extract to be used as a secondary standard/calibrant (CEC), (ii) the use of the CEC for the development and validation of an HPLC-HILIC-FLD method, and (iii) the evaluation of the suitability of the method for its application in the quantification of CF in various cocoa-derived products.
2 Materials and methods
2.1 Chemicals
(−)-Epicatechin and HPLC grade solvents were purchased from Sigma-Aldrich (Sigma-Aldrich Corp., Saint-Louis, MO, USA). Cocoa procyanidins with DP from 2 to 10 were isolated from the seeds of Theobroma cacao L. by Mars Wrigley Confectionary (Mars Inc., Hacketstown, NJ, USA). A primary standard for each degree of polymerization of cocoa procyanidin was purified and characterized by Analyticon Discovery (Gmbh, Potsdam, Germany). Purity assessed using HPLC-UV was >94% (experimental conditions are detailed in ESI:† purity assessment of primary standards). These purity values of cocoa procyandin primary standards were verified by two additional laboratories. A CF-enriched extract from cocoa beans was supplied by Mars Symbioscience (Mars Inc., Germantown, MD, USA). This cocoa extract was produced by the aqueous acetone extraction of cocoa cake prepared from unfermented, dried cocoa beans. The resulting CF-enriched extract was dried to a powder and used to create the CEC. A one-time sampling of a number of commercial cocoa-based products purchased from local sources by a third-party were used to evaluate application of the analytical methodology. These products included cocoa powder, dark chocolate, dietary supplement capsules and drink mixes. Further details of the materials used are presented in ESI Table S1.†2.2 Method development
![[thin space (1/6-em)]](https://www.rsc.org/images/entities/char_2009.gif) :30:1, v/v-AWAc). Dilution of WS5, namely WS1–4, were prepared respectively by pipetting 2.5 mL (WS1), 4.0 mL (WS2), 5.0 mL (WS3) and 8.0 mL (WS4) in 10 mL volumetric flasks. Dilutions were made to volume using AWAc. WS1–5 were filtered (0.45 μm PTFE) and aliquots transferred to amber glass LC-autosampler vials which were stored at 5 °C for no longer than 4 days prior to analysis. A 50 mL volume of AWAc containing 50 ± 5 mg of CEC was filtered (0.45 μm PTFE) and used as a check working standard within 24 h of preparation. WS3 was used as a bracketing standard and AWAc as a blank. Acetonitrile:water (1:1,) was used as needle wash.
:30:1, v/v-AWAc). Dilution of WS5, namely WS1–4, were prepared respectively by pipetting 2.5 mL (WS1), 4.0 mL (WS2), 5.0 mL (WS3) and 8.0 mL (WS4) in 10 mL volumetric flasks. Dilutions were made to volume using AWAc. WS1–5 were filtered (0.45 μm PTFE) and aliquots transferred to amber glass LC-autosampler vials which were stored at 5 °C for no longer than 4 days prior to analysis. A 50 mL volume of AWAc containing 50 ± 5 mg of CEC was filtered (0.45 μm PTFE) and used as a check working standard within 24 h of preparation. WS3 was used as a bracketing standard and AWAc as a blank. Acetonitrile:water (1:1,) was used as needle wash.
For dark chocolate, the supernatant obtained after centrifuging was purified using a solid phase extraction cartridge (Strata SCX-500 mg, 55 μm, 70 Å). The cartridge was conditioned with water until 5 mm of water remained on top of the sorbent cartridge, which was then loaded with the analytical solution and eluted. The eluted analytical solution was discarded until 5 mm remained on top of the sorbent bed, after which the cartridge was reloaded with analytical solution and the eluent collected. Finally, the collected eluent was filtered through a 0.45 μm PTFE syringe filter, transferred to an amber glass LC-autosampler vial and stored at 5 °C for no longer than 4 days prior to analysis.
When fully soluble-dietary supplements were dissolved in AWAc. When products were not fully soluble, the solid was weighed in a centrifuge tube and exact volume of AWAc added. The mixture was then sonicated for 5 min at 50 °C and centrifuged for 5 min at 1700 rcf. The supernatant was filtered through 0.45 PTFE syringe filter, transferred to an amber glass LC-autosampler vial and stored at 5 °C for up to 4 days prior to analysis.
All method development and validation experiments were carried out on Agilent 1260, 1290 and 1290 Infinity II UHPLC instruments equipped with FLD (Agilent FLD G1321B – excitation 230 nm, emission 321 nm). Gain was optimized to reach highest sensitivity on WS5 without compromising linearity or peak shape. Optimized chromatographic separation of procyanidins with a DP of 1–7 was achieved by a binary gradient between mobile phases A (acetonitrile:acetic acid; 98:2) and B (methanol:water:acetic acid; 95:3:2) at a flow rate of 1.0 mL min−1. For cocoa extracts, the following gradient was used: (0.0 min, 0%B), (0.37 min, 0%B), (10.40 min, 45%B), (10.65 min, 95%B), (13.00 min, 95%B) and (13.10 min, 0%B), with a post-run time set to 1 min. This was determined to be sufficient for the UHPLC instrument to achieve full re-equilibration and recovery of the column back pressure between each run. The recovery time should be extended for HPLC instrument. For each analysis, 2 μL volumes of sample were injected on the Waters Torus Diol column (3.0 × 100 mm, 1.7 μm, 130 Å) at 50 °C. The auto-sampler temperature was maintained at 5 °C.
Signals were manually integrated valley-to-valley for each DP. Calibration curves ignored the origin and were built from mg mL−1 values of standard solutions (WS1–5) using individual CF content of the CEC. System suitability was demonstrated by determining: (i) %RSD on signal area of five consecutive injections of WS3 below or equal to 5%; (ii) coefficient of determination (r2) higher or equal to 0.99; and (iii) bracketing standard agreement within 82 to 118%. For simplicity of reporting, total flavanols and procyanidins concentration are reported as the sum of flavanol monomers and DPs up to and including 7. Where necessary, total flavanol and procyanidin concentrations were corrected based on fat content (chocolate and cocoa powder samples).
2.3 Method validation
Method validation included the evaluation of the accuracy, repeatability, intermediate precision, specificity, interferences, linearity, robustness, stability and limit of quantification parameters. Details on method validation conditions are available in ESI:† method validation experimental design.Principal component analysis (PCA) of correlation (Pearson) was performed using relative abundance of each cocoa flavanol and procaynidin oligomers as variables. Relative abundances were calculated for each analytes as the ratio of its concentration to the total flavanol and procyanidin concentration (DP1–7). No threshold was applied for the statistical analysis as the PCA was unsupervised. PCA analysis was performed using XLSTAT-base by Addinsoft (Addinsoft LLC, Paris, France).
3. Results and discussion
3.1 Characterization of cocoa extract calibrant
In the absence of commercially-available procyanidin standards for the wide-ranging size of procyanidins, we characterized a cocoa extract to be used as a secondary analytical standard/calibrant. The characterization of the CEC included the quantification of flavanols and procyanidins with a degree of polymerization up to 7 units (DP1–7), which were determined to be 522.6 ± 3.1 mg g−1 (Table 1). Three independent analyses (different columns, analysts, instrument and time) showed %RSD ≤5.3% for DP1–6 and 12.2% for DP7. The %RSD of total DP1–7 was low (0.6%), highlighting the reliability of the characterization protocol. While previous methods have included the quantification of procyanidins with a DP up to 10 units,12 reliable quantification of DP8–10 could not be achieved. DP8–10 were, therefore, excluded from the characterization of CEC. As DP8–10 represent a small fraction of procyandins in cocoa (<15%, w/w),15 this incurs only in a slight undestimation of procyanidin content.| DP1 | DP2 | DP3 | DP4 | DP5 | DP6 | DP7 | Total DP1–7 | |
|---|---|---|---|---|---|---|---|---|
| Analyst 1 (mg g−1) | 110.3 | 86.7 | 89.1 | 80.3 | 63.8 | 49.7 | 43.2 | 523.1 |
| Analyst 2 (mg g−1) | 119.6 | 82.1 | 87.7 | 76.1 | 67.5 | 51.6 | 34.7 | 519.3 |
| Analyst 3(mg g−1) | 122.1 | 87.4 | 93.7 | 74.4 | 63.6 | 48.5 | 35.8 | 525.5 |
| Mean (mg g−1) | 117.3 | 85.4 | 90.2 | 76.9 | 65.0 | 49.9 | 37.9 | 522.6 |
| SD (mg g−1) | 6.2 | 2.8 | 3.1 | 3.0 | 2.2 | 1.6 | 4.6 | 3.1 |
| RSD (%) | 5.3 | 3.3 | 3.5 | 4.0 | 3.4 | 3.1 | 12.2 | 0.6 |
3.2 Method development
The newly characterized CEC was used to identify optimal conditions for the resolution of procyanidins based on their DP. In this context, fifteen columns with different stationary phases (diol, amide and unbonded silica particle) were evaluated under HILIC conditions (see ESI, Table S2†). Although reverse phase (C18) chromatography has been reported for the separation of procyanidins, resolution deteriorates as the DP increases beyond 3.16 In keeping with published methods,5,9,17 diol columns proved to yield the best resolution of procyanidins across all DPs (Fig. 2).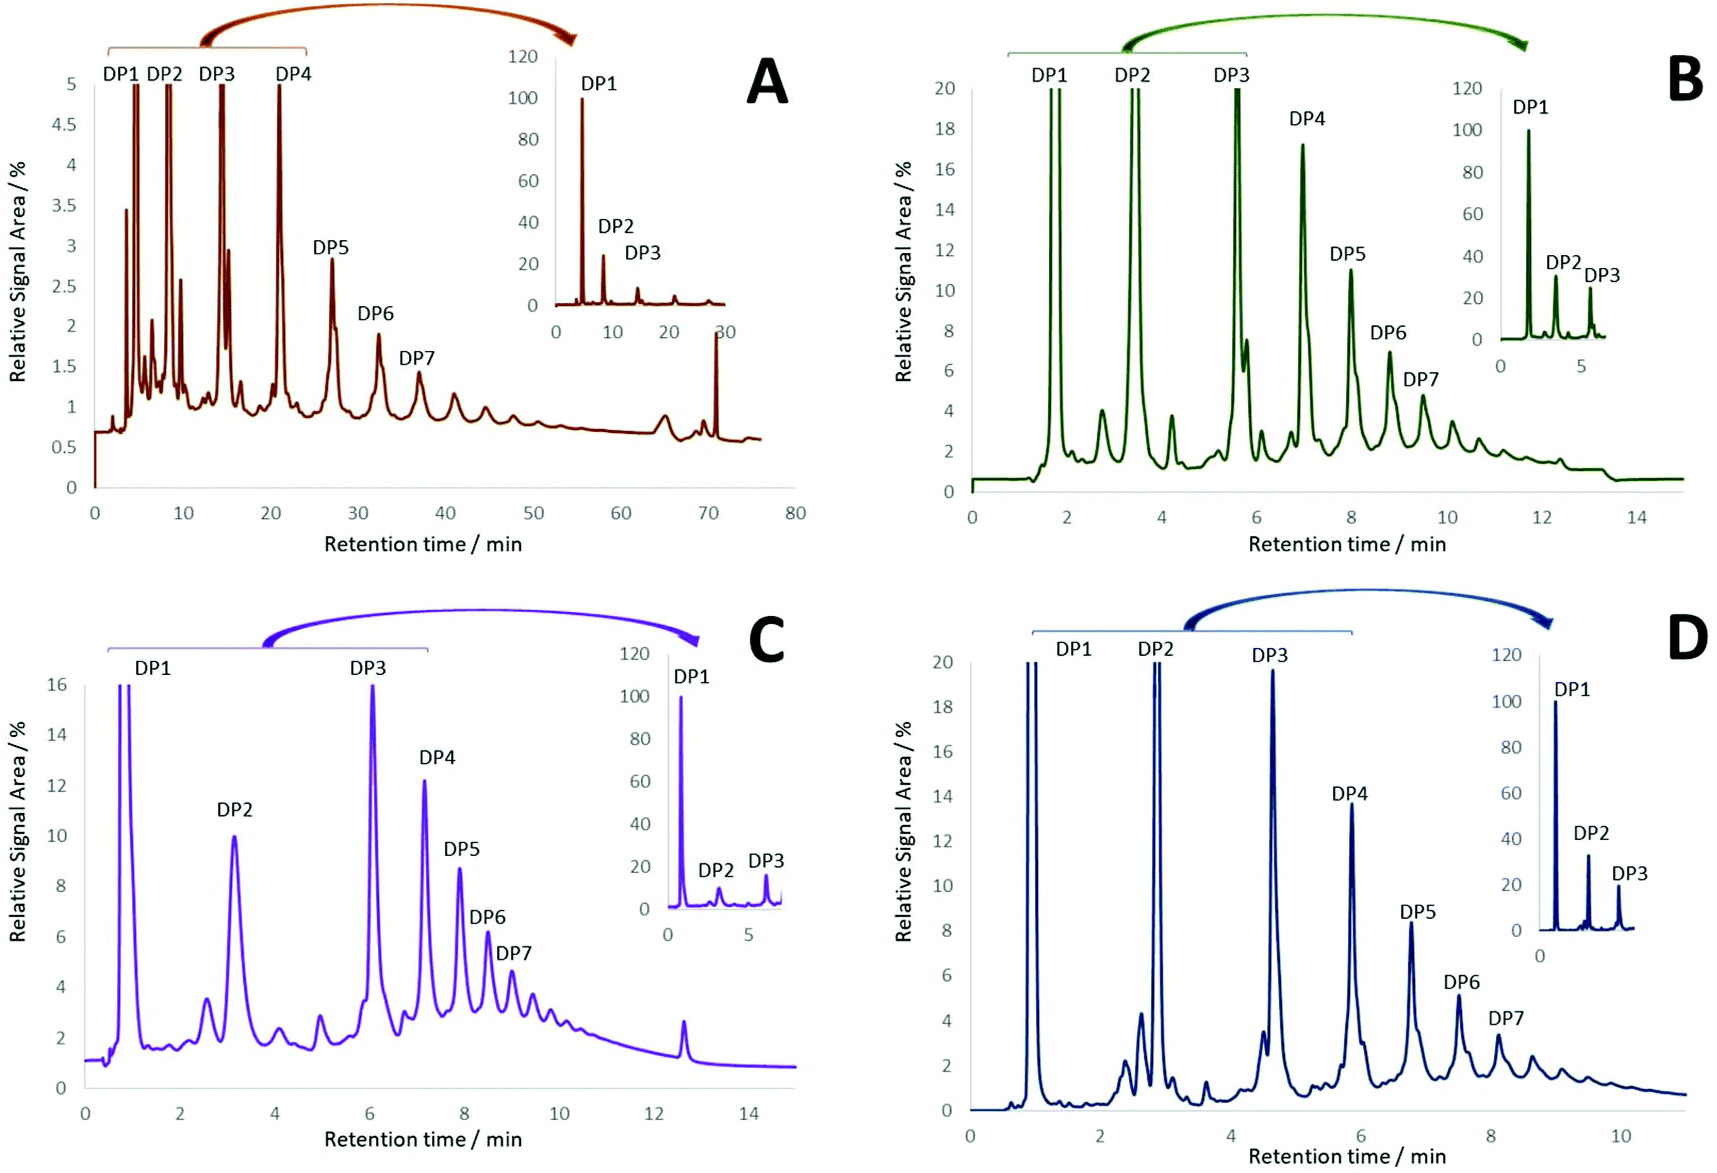 | ||
| Fig. 2 HPLC-FLD chromatograms of the cocoa extract calibrant using different HPLC columns: (A) Nomura Develosil Polar Diol 4.6 × 250 mm, 5.0 μm particle size, 120 Å pore size; (B) Phenomenex Luna Diol 4.6 × 100 mm, 3.0 μm particle size, 200 Å pore size; (C) Supelco Kromasil Diol 2.1 × 100 mm, 5.0 μm particle size, 100 Å pore size and; (D) Waters Torus Diol 3.0 × 100 mm, 1.7 μm particle size, 130 Å pore size. | ||
Further optimization was pursued testing diol columns under different mobile phase compositions (solvent, solvent ratio, additive, additive concentration), binary gradients, injection volumes and column temperatures (data not shown). In depth evaluation showed that the best sensitivity and repeatability of DP1–7 quantification were achieved with the Waters Torus Diol (3.0 × 100 mm, 1.7 μm, 130 Å) column (Fig. 2D). This optimized method showed not only an improvement in resolution, but also a significant enhancement in the speed of analysis (∼6-fold) compared to previous methods for CF quantification.12
3.3 Method validation
The newly developed method was subsequently validated for the analysis of total CF, determined as the sum of DP1–7 [CF(DP1–7)], in a variety of cocoa-derived products, including cocoa extracts, cocoa powders, dark chocolate, ready-to-drink powder mixtures and dietary supplement capsules. Accuracy, determined using standard addition of the CEC, ranged from 100.7 to 102.9% across the different cocoa-based materials (Table 2). This demonstrates the ability of the method to accurately analyse CF(DP1–7) across different matrices, representing a significant improvement from previous methods that did not inform on accuracy due to the absence of reference materials.18 In addition, precision was investigated at three different levels, including (i) repeatability (single operator and instrument), (ii) intermediate-precision (three analysts, each with different instruments within the same laboratory), and (iii) reproducibility (three different analysts, each with different instruments in different laboratories). This last dimension of precision also gives an insight in method transferability. All matrices showed excellent precision at the three levels evaluated (Table 3). Further validation parameters were studied (ESI:† method validation results). In this context, linearity was systematically demonstrated with a coefficient of determination of >0.99. Limits of quantification across DP and matrices were estimated at ≤8.1 μg mL−1, which were consistently lower than the lowest calibration point. Stability was demonstrated by observing that the loss of total CF of <−7% over the course of 4 days in autosampler conditions (5 °C). Taken together, these results showed that the validated HPLC-FLD method represents a very reliable analytical protocol for the quantification of CF, surpassing the performance of previous methodologies in terms of accuracy, precision, versatility and robustness.| Matrix | Accuracy (%) | SD (%) |
|---|---|---|
| Cocoa extract | 100.8 | 2.0 |
| Cocoa extract suppplement capsules | 102.9 | 2.5 |
| Powdered drink mix | 101.6 | 0.2 |
| Cocoa powder | 100.7 | 4.7 |
| Dark chocolate | 102.3 | 0.7 |
| Matrix | Repeatability | Intermediate precision | Reproducibility | ||||||||
|---|---|---|---|---|---|---|---|---|---|---|---|
| Mean (mg g−1) | SD (mg g−1) | RSD (%) | AOAC 2012.24 RSD (%) | Mean (mg g−1) | SD (mg g−1) | RSD (%) | Mean (mg g−1) | SD (mg g−1) | RSD (%) | AOAC 2012.24 RSD (%) | |
| a On defatted basis. N/A – not analysed. | |||||||||||
| Cocoa extract | 476.8 | 8.9 | 1.9 | 5.1 | 481.7 | 9.7 | 2.0 | 493.6 | 12.7 | 2.6 | 9.8 |
| Supplement capsules | 355.2 | 0.8 | 0.2 | N/A | 358.8 | 11.1 | 3.1 | 388.6 | 37.7 | 9.7 | N/A |
| Drink mix | 126.8 | 1.3 | 1.0 | N/A | 128.0 | 2.7 | 2.1 | 135.3 | 10.7 | 7.9 | N/A |
| Cocoa powder | 28.4 | 0.6 | 1.9 | 4.8a | 28.0 | 1.0 | 3.5 | 27.9 | 1.7 | 6.2 | 7.7a |
| Dark chocolate | 3.4 | 0.0 | 1.4 | 4.6a | 3.7 | 0.3 | 8.2 | 3.7 | 0.8 | 22.4 | 10.7a |
3.4 Determination of commercial food and dietary supplement products
Suitability of the newly validated method was investigated by analyzing the CF(DP1–7) content in a range of commercially-available and consumer-relevant food and dietary supplement products (Table S5†). Concentrations ranged from 1.8 to 374 mg g−1 and covered the most commonly consumed cocoa-based products, illustrating the applicability of the protocol for analyzing a wide range of CF concentrations in a diversity of commodities with a varied range of concentrations. Chocolate products had the lowest CF content, which is expected due to formulation (i.e. lower cocoa solids content), as well bean handling and cocoa processing conditions during chocolate manufacture which are known to impact on CF content.19 Dietary supplements were among the products with the highest CF concentrations. Most of the supplements showed CF concentrations in close agreement with the amounts stated on the package label. However, supplement B contained only DP1 and DP2, and the amounts were well below the claimed 400 mg of “plant flavanols”. It should be noted, however, that although cocoa-based, supplement B also claimed to contain flavanols from green tea. Green tea contains (−)-epigallocatechin and (−)-epigallocatechin-O-gallate which do not fluoresce,20 and so are not detected via HPLC-FLD, which highlights the specificity of the method for CF quantification.3.5 Proof of concept: discrimination of cocoa based samples using flavanol and procyanidins profile
Given the improved accuracy and precision of the newly developed method, the possibility to discriminate sample solely on their flavanol and procyanidin profiles was evaluated. To this end, PCA was carried out using individual amounts of DP 1 to 7 as variables, and expressing their levels as a percentage of the total CF(DP1–7) content. PCA is widely used to process experimental data sets, especially those with a food safety application.21–23 PCA has also been used for cocoa-based samples in which, HPLC15,24 and/or 1H NMR data25 was used to distinguish samples by geographical origin and processing methods. When focusing on CF bioactives, it is important to part unspecific food components (e.g. caffeine, theobromine, etc.…) from the bioactives studied, their profile and how this profile reflects differences in origin. While 1H NMR can provide a valuable insight in the origin of cocoa-based products, this type of analysis alone cannot attest for the origin of the bioactive themselves. For example, a cocoa based product adulterated with high flavanol and procyanidin ingredient from another source (synthetic or botanical) might show all major markers of cocoa matrices and will thus not be detected as adulterated. While 1H NMR constitutes a powerful tool to assess geographical origin, processing methods or even adulteration, the possibility of relying on the relative distribution of flavanols and procyanidins to assess these parameters would represent a valuable alternative. The results illustrated in Fig. 3 showed that the two first components of the PCA expressed 75% and 24%, respectively, of the variability across samples. Consistent with the notion that supplement B contained flavanols from green tea, the two samples analyzed from this product were identified as outliers. However, other products that were cocoa-based also showed a clear discrimination in the PCA, particularly between type of cocoa-based material (cocoa powders, dark chocolates and dietary supplements) and manufacturers. Cocoa powders showed a higher abundance of DP2 relative to the total CF content compared to the other products, while dark chocolate showed higher relative content of DP4–7. These trends were observed consistently across manufacturers and were confirmed by the loading plot of PCA analysis B (Fig. 3). Dark chocolate C is the only sample that did not group with other samples of the same matrix. However, Chocolate C showed a CF content 2–3 times higher than other chocolate products and was plotted near supplement C (drink mix) produced by the same manufacturer. We hypothesise that the high CF-containing dark chocolate and drink mix are produced using the same high-CF cocoa beans, or alternatively, that the same raw ingredient is added to a low CF-containing chocolate and drink mix. It is thus feasible to use CF profiles determined by HPLC-FLD to discriminate bioactives in cocoa-based products by origins. Because the variability expressed by a PCA is limited to the variability of the data set,26 additional variables extend the possibility to differentiate sample groups. For cocoa based products, bioactive profiles determined by HPLC-FLD can be complementary to the existing analytical arsenal dedicated in building robust discriminatory PCA models.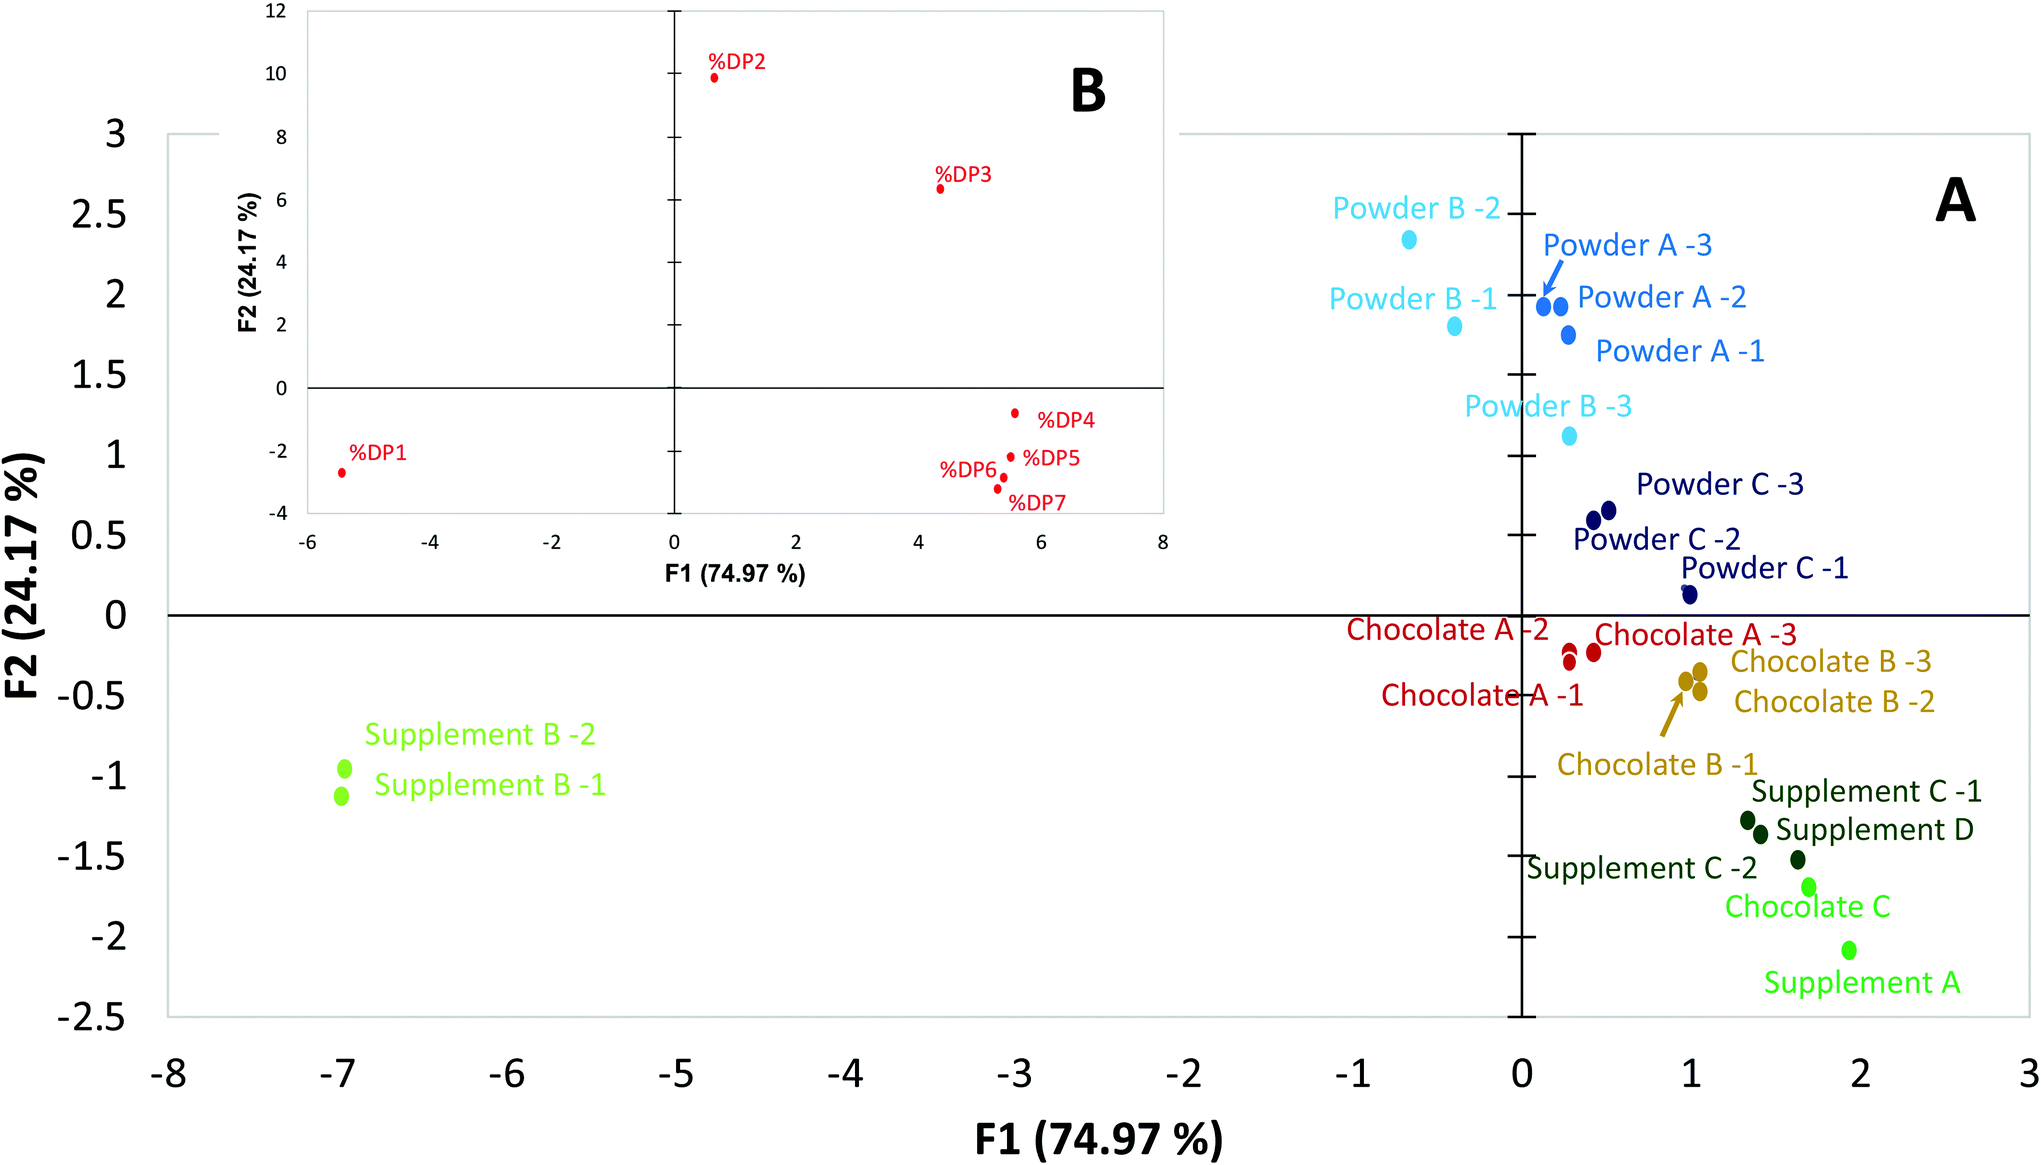 | ||
| Fig. 3 Principal component analysis (PCA) plots of cocoa flavanol and procyanidin (CF) profile determined in selected products. (A) plot of PCA1 and PCA2 representing 99.14% of variability in cocoa flavanols oligomer profile and (B) loading plots representing contribution of each variable to PCA1 and PCA2. Colors represent different manufacturers and numbers represent different lots for a given product. | ||
Taking together, these results showed that the method developed is suitable for the reliable quantification of CF in various matrices. These matrices represent good examples of commercially available products claiming content of flavanols and procyanidins, as well as test materials commonly used to investigate health benefits of flavanols and procyanidins in dietary intervention studies. The fact that the protocol utilises a basic HPLC-FLD-based approach supports its application for practical routine analysis, including its use to support product labeling. Furthermore, the demonstrated accuracy and precision of this method enables its potential use for identifying products by manufacture, origin and processing when combined with a PCA.
4 Conclusions
This study described the development, validation and application of a new reliable method for the determination of flavanols and procyanidins in cocoa. Importantly, the method enabled the detection and quantification of flavanols and procyanidins based on degree of polymerisation in a single run, thus retaining information on the complex chemical composition that typically occurs in natural products such as cocoa. In addition, the deliberate selection of instruments found in routine analytical laboratory settings assured method accessibility. Like previous approaches to quantify flavanols and procyanidins, this protocol was based on fluorescence detection which is a robust and accessible method for laboratories that may have limited access or resources to implement high end MS or MS-MS detection.The HPLC-HILIC-FLD method that retains the compositional characterization of the natural product is an ideal option to replace non-specific methods still used for flavanol and procyanidin quantifications such as the Porter assay, Folin Ciocalteu, or ORAC, which have been deemed unsuitable for the characterization of these compounds in test materials used for dietary intervention studies.27 Furthermore, the high precision and accuracy in addition to a significant reduction in analysis time, the method presented here may represent a valuable alternative to current methods for the quantification of CF published by AOAC.18 The ability to accurately and precisely analyze and quantify based on DP provides important information about the natural product that can be used to distinguish cocoa-based products, and importantly can also offer compositional detail that can be used to monitor for adulteration.
The development of this method was facilitated by the use of an external calibrant, in this case a highly characterized CEC. Currently, the National Institute of Standards and Technology (NIST; U.S. Department of Commerce) is developing a cocoa reference material (RM 8403) from the same CEC used in this study. The material owned and distributed by http://www.nist.gov/srm will provide the scientific community with a tool that promotes method transferability. Furthermore, the availability of CEC reference material will allow for further improvements in cocoa flavanol and procyanidin analysis. The current study showed that the characterization and use of an external calibrant represents a valid approach to overcome limitations regarding the absence of primary analytical standards and use of RRFs for the quantification of CF. Importantly, while this study used CF as a model system, it should be possible to develop a secondary calibrant for the characterization of other flavanol- and procyanidin-containing matrices, such as apple and grapes.
Conflicts of interest
UB, NA, BM, JO, GH, YO and CKU are employed by Mars Incorporated, a company engaged in flavanol research and flavanol-related commercial activities. AC is a consultant for Mars, Incorporated.Funding
Mars, Incorporated funded the study.Acknowledgements
The authors thank James Harnly and Pei Chen from US Department of Agriculture, Reedmond Fong from University California Davis and Julia Li, Brian McCormack and Karl Ritter from Mars Wrigley Confectionary for supporting the multi-laboratory implementation of the method.References
- J. I. Ottaviani, C. Heiss, J. P. E. Spencer, M. Kelm and H. Schroeter, Recommending flavanols and procyanidins for cardiovascular health: Revisited, Mol. Asp. Med., 2018, 61, 63–75 CrossRef CAS PubMed.
- A. M. Brickman, U. A. Khan, F. A. Provenzano, L. K. Yeung, W. Suzuki, H. Schroeter, M. Wall, R. P. Sloan and S. A. Small, Enhancing dentate gyrus function with dietary flavanols improves cognition in older adults, Nat. Neurosci., 2014, 17, 1798–1803 CrossRef CAS PubMed.
- C. Agostoni, J.-L. Bresson, S. Fairweather-Tait, A. Flynn, I. Golly, H. Korhonen, P. Lagiou, M. Løvik, R. Marchelli, A. Martin, B. Moseley, M. Neuhäuser-Berthold, H. Przyrembel, S. Salminen, Y. Sanz, S. (J. J.) Strain, S. Strobel, I. Tetens, D. Tomé, H. van Loveren and H. Verhagen, Scientific Opinion on the substantiation of health claims related to cocoa flavanols and protection of lipids from oxidative damage (ID 652, 1372, 1506, 3143), and maintenance of normal blood pressure (ID 1507) pursuant to Article 13(1) of Regulation (EC), EFSA J, 2010, 8(10), 1792–1823 CrossRef.
- A. Yanagida, H. Murao, M. Ohnishi-Kameyama, Y. Yamakawa, A. Shoji, M. Tagashira, T. Kanda, H. Shindo and Y. Shibusawa, Retention behavior of oligomeric proanthocyanidins in hydrophilic interaction chromatography, J. Chromatogr. A, 2007, 1143, 153–161 CrossRef CAS PubMed.
- R. J. Robbins, J. Leonczak, J. C. Johnson, J. Li, C. Kwik-Uribe, R. L. Prior and L. Gu, Method performance and multi-laboratory assessment of a normal phase high pressure liquid chromatography-fluorescence detection method for the quantitation of flavanols and procyanidins in cocoa and chocolate containing samples, J. Chromatogr. A, 2009, 1216, 4831–4840 CrossRef CAS PubMed.
- W. J. Hollands, S. Voorspoels, G. Jacobs, K. Aaby, A. Meisland, R. Garcia-Villalba, F. Tomas-Barberan, M. K. Piskula, D. Mawson, I. Vovk, P. W. Needs and P. A. Kroon, Development, validation and evaluation of an analytical method for the determination of monomeric and oligomeric procyanidins in apple extracts, J. Chromatogr. A, 2017, 1495, 46–56 CrossRef CAS PubMed.
- L. Wang, Y. Yamashita, A. Saito and H. Ashida, An analysis method for flavan-3-ols using high performance liquid chromatography coupled with a fluorescence detector, J. Food Drug Anal., 2017, 25, 478–487 CrossRef CAS PubMed.
- J. F. Hammerstone, S. A. Lazarus, A. E. Mitchell, R. Rucker and H. H. Schmitz, Identification of Procyanidins in Cocoa (Theobromacacao) and Chocolate Using High-Performance Liquid Chromatography/Mass Spectrometry, J. Agric. Food Chem., 1999, 47, 490–496 CrossRef CAS PubMed.
- W. J. Hurst, B. Stanley, J. A. Glinski, M. Davey, M. J. Payne and D. A. Stuart, Characterization of primary standards for use in the HPLC analysis of the procyanidin content of cocoa and chocolate containing products, Molecules, 2009, 14, 4136–4146 CrossRef CAS PubMed.
- L. Z. Lin, J. Sun, P. Chen, M. J. Monagas and J. M. Harnly, UHPLC-PDA-ESI/HRMSn profiling method to identify and quantify oligomeric proanthocyanidins in plant products, J. Agric. Food Chem., 2014, 62, 9387–9400 CrossRef CAS PubMed.
- E. A. Rue, M. D. Rush and R. B. van Breemen, Procyanidins: a comprehensive review encompassing structure elucidation via mass spectrometry, Phytochem. Rev., 2018, 17, 1–16 CrossRef CAS PubMed.
- R. J. Robbins, J. Leonczak, J. Li, J. C. Johnson, T. Collins, C. Kwik-Uribe and H. H. Schmitz, Determination of Flavanol and Procyanidin (by Degree of Polymerization 1–10) Content of Chocolate, Cocoa Liquors, Powder(s), and Cocoa Flavanol Extracts by Normal Phase High-Performance Liquid Chromatography: Collaborative Study, J. AOAC Int., 2012, 95, 1153–1160 CrossRef CAS PubMed.
- B. A. Olsen and M. D. Argentine, Investigation of response factor ruggedness for the determination of drug impurities using high-performance liquid chromatography with ultraviolet detection, J. Chromatogr. A, 1997, 762, 227–233 CrossRef CAS PubMed.
- S. Fekete, J. Schappler, J.-L. Veuthey and D. Guillarme, Current and future trends in UHPLC, TrAC, Trends Anal. Chem., 2014, 63, 2–13 CrossRef CAS.
- K. B. Miller, W. J. Hurst, N. Flannigan, B. Ou, C. Y. Lee, N. Smith and D. A. Stuart, Survey of commercially available chocolate- and cocoa-containing products in the United States. 2. Comparison of flavan-3-ol content with nonfat cocoa solids, total polyphenols, and percent cacao, J. Agric. Food Chem., 2009, 57, 9169–9180 CrossRef CAS PubMed.
- K. Redeuil, R. Bertholet, M. Kussmann, H. Steiling, S. Rezzi and K. Nagy, Quantification of flavan-3-ols and phenolic acids in milk-based food products by reversed-phase liquid chromatography-tandem mass spectrometry, J. Chromatogr. A, 2009, 1216, 8362–8370 CrossRef CAS PubMed.
- P. R. Machonis, M. A. Jones and C. Kwik-Uribe, Analysis of Cocoa Flavanols and Procyanidins (DP 1–10) in Cocoa-Containing Ingredients and Products by Rapid Resolution Liquid Chromatography: Single-Laboratory Validation, J. AOAC Int., 2014, 97, 166–172 CrossRef CAS PubMed.
- Method AOAC2012.24, Journal, 2012.
- F. Ioannone, C. D. Di Mattia, M. De Gregorio, M. Sergi, M. Serafini and G. Sacchetti, Flavanols, proanthocyanidins and antioxidant activity changes during cocoa (Theobroma cacao L.) roasting as affected by temperature and time of processing, Food Chem., 2015, 174, 256–262 CrossRef CAS PubMed.
- W. J. Cheong, M. H. Park, G. W. Kang, J. H. Ko and Y. J. Seo, Determination of Catechin Compounds in Korean Green Tea Infusions under Various Extraction Conditions by High Performance Liquid Chromatography, Bull. Korean Chem. Soc., 2005, 26, 747–754 CrossRef CAS.
- E. Csomós, K. Héberger and L. Simon-Sarkadi, Principal Component Analysis of Biogenic Amines and Polyphenols in Hungarian Wines, J. Agric. Food Chem., 2002, 50, 3768–3774 CrossRef PubMed.
- S. Gerbig, S. Neese, A. Penner, B. Spengler and S. Schulz, Real-Time Food Authentication Using a Miniature Mass Spectrometer, Anal. Chem., 2017, 89, 10717–10725 CrossRef CAS PubMed.
- K. Inoue, C. Tanada, T. Hosoya, S. Yoshida, T. Akiba, J. Z. Min, K. Todoroki, Y. Yamano, S. Kumazawa and T. Toyo'oka, Principal component analysis of molecularly based signals from infant formula contaminations using LC-MS and NMR in foodomics, J. Sci. Food Agric., 2016, 96, 3876–3881 CrossRef CAS PubMed.
- J. Rodriguez-Campos, Dynamics of volatile and non-volatile compounds in cocoa (Theobroma cacao L.) during fermentation and drying processes using principal components analysis, Food Res. Int., 2011, 44, 250–258 CrossRef CAS.
- A. Caligiani, L. Palla, D. Acquotti, A. Marseglia and G. Palla, Application of 1H NMR for the characterisation of cocoa beans of different geographical origins and fermentation levels, Food Chem., 2014, 157, 94–99 CrossRef CAS PubMed.
- R. Bro and A. K. Smilde, Principal component analysis, Anal. Methods, 2014, 6, 2812–2831 RSC.
- R. J. Robbins, C. Kwik-Uribe, J. F. Hammerstone and H. H. Schmitz, Analysis of flavanols in foods: what methods are required to enable meaningful health recommendations?, J. Cardiovasc. Pharmacol., 2006, 47(Suppl 2), S110–S118 CrossRef CAS PubMed ; discussion S119–121.
Footnotes |
| † Electronic supplementary information (ESI) available. See DOI: 10.1039/c9fo02762a |
| ‡ These authors contributed equally to this work. |
| This journal is © The Royal Society of Chemistry 2020 |