
 Open Access Article
 This Open Access Article is licensed under a Creative Commons Attribution-Non Commercial 3.0 Unported Licence
Graphene stimulates the nucleation and growth rate of NaCl crystals from hypersaline solution via membrane crystallization†
Maria Luisa Perrottaa,
Francesca Macedonio a,
Elena Toccia,
Lidietta Giornoa,
Enrico Drioliab and
Annarosa Gugliuzza*a
a,
Elena Toccia,
Lidietta Giornoa,
Enrico Drioliab and
Annarosa Gugliuzza*a
aInstitute on Membrane Technology – National Research Council, ITM-CNR, Via P. Bucci 17C, 87036 Rende, CS, Italy. E-mail: a.gugliuzza@itm.cnr.it
bDepartment of Environmental and Chemical Engineering, University of Calabria, Via P. Bucci, 87036 Rende, CS, Italy
First published on 28th April 2020
Abstract
Membrane crystallization (MCr) is regarded as a powerful tool for promoting the formation of crystals of salt from hypersaline solutions such as seawater brine. In this kind of process, a hydrophobic membrane is used to remove water in the form of vapor from a saline solution. As a consequence, super-saturation is produced and crystals of salt are formed in the retentate. Today, the major concern is the restricted industrial process scale up for this technology. This is due to the lack of membranes with features designed to handle MCr processes suitably. A higher yield of uniformly sized and shaped crystals is targetable. Herein, composite PVDF–graphene membranes are proposed as interactive interfaces for adjusting nucleation-and-growth events in the MCr process. An experimental in silico study is proposed to examine the steps which precede the crystallization and regulate the formation of crystals. Well-established interactions at the graphene–solution interface are envisaged to stimulate continually water sequestration from ion–water clusters and promote ion–ion aggregation. Reduced nucleation time and increased growth rate of the crystals are detected. Coefficients of variation of 26.7–32.2% are estimated, yielding an indication of a major uniformity of the crystals. Both the experimental and theoretical findings provide interesting indications of the capacity of the graphene to direct the nucleation and growth of minerals on a scale of time and space.
Water impactMembrane crystallization is a promising eco-sustainable technology to recover minerals from seawater and preserve sensitive ecosystems. Today, there are no suitable membranes to yield uniform crystals for real-world practices. This study suggests that graphene is able to direct better-quality crystallization through temporary in situ adsorption of water. This is a great leap forward and delivers tangible results focused on novel membranes for controlled and fruitful crystallization. |
1. Introduction
A practical route for producing fresh water and high-quality minerals is to manage natural resources such as seawater. A rational combination of materials and technologies could enable one to obtain a larger and timely supply of precious commodities.1–3 Fresh water can be reused for urban landscaping, aquatic ecology, household consumption and industrial cooling systems so that extractions from sensitive ecosystems should be limited.4,5 Also, the management of large amounts of concentrated brine is predicted to reduce the environmental impact. The brine should not be waste but rather the mother liquor from which massive high-quality salt crystals can be produced. In this case, saleable minerals for pharmaceutical, domestic and agricultural use could be obtained easily.6–9 Hybrid thermal/membrane technologies10 such as membrane distillation (MD) and membrane crystallization (MCr) could represent an effective alternative with reliable prospects to recover simultaneously fresh water and minerals from brine at competitive costs.11–18 High quality of water and extracted salts with recovery factors above 90% is expected from the integration of these two techniques.19 Additionally, the requirement of lower operational temperature and pressure makes these two technologies economically attractive and competitive. Osmotic pressure and concentration polarization are also limited, while affecting severely a more traditional seawater reverse osmosis (SWRO).20Precisely, in MD and MCr devices, a hydrophobic membrane works as a physical interface between two phases, preventing the dispersion of one phase within another.21 The two phases in the form of liquid–liquid or liquid–gas come in contact at the entrance of the membrane pores. Volatile chemical species diffuse from one side to the other under a driving force, whilst non-volatile compounds including salts do not permeate.
The driving force is usually a difference of partial pressure due to a gradient of temperature and/or concentration between the two sides of the membrane. The separation factor depends on the distribution coefficient of the component in the two phases. High interfacial area per unit of volume and controlled mutual membrane–liquid interactions are imperative for successful processes.22,23 However, the lack of suitable membranes with well-designed structural and physicochemical features is a current limitation to scale up these operations to an industrial size.11,24 The major aim is to shift productivity–efficiency trade-offs beyond the state of the art.8,11 The accomplishment of this target would imply not only a larger supply of fresh water but also a fruitful production of high-quality minerals with shapes and sizes manageable for specific productive needs.
In this work, active interfaces are proposed in place of the traditional inert physical barriers.24–26 The purpose is to activate water vapor transfer in order to favor supersaturation conditions and control the kinetics and thermodynamics that direct the crystallization process. Graphene platelets have been confined in membrane matrixes in order to provide new functions to the host polymer networks, such as enhanced hydrophobicity, antifouling properties, sorption sites for water molecules, and so on.27–36 Graphene laminar membranes have been recently proposed for ion filtration and water desalination, providing evidence of a better performance than pristine membranes concerning the productivity and selectivity of the process.37–40 This work explores instead the behavior of graphene platelets confined in PVDF membranes during the crystallization processes. An experimental in silico approach is proposed in order to demonstrate that graphene can also stimulate nucleation-and-growth steps for the formation of better-quality minerals. It is demonstrated that nanocomposite membranes have the ability to remove water more quickly from hypersaline solutions. This behavior fits well with that reported in the literature.40,41 Also, this study provides new insights about the ability of graphene to assist adsorption–desorption mechanisms with a rapid and controlled turnover. The consequence is faster ionic core shrinking due to reinforced attractive ion–ion Coulomb interactions, which lead to shortened times of crystallization. Experimental and theoretical investigations have been carried out in supersaturated conditions in order to provide a comprehensive explanation of the events, which control mass transfer through engineered graphene-based membranes. Despite a different time scale, experimental and theoretical outcomes are in good agreement. Nucleation, which is not detectable at the macroscopic level normally, is investigated by fully atomistic simulations and examined in relation to the experimental induction time. Hence, short-time dynamics provide insights having implications for the crystallization processes occurring on considerably longer time scales.42 Experimentally, local property changes induced by graphene in the membrane surface are investigated. Thermodynamic magnitudes, i.e. base electron donor component (γ−, mJ m−2) of the overall surface free energy, work of hydration (Wiw, mJ m−2) and work of interfacial attraction (Wiwi, mJ m−2),43 are envisioned as powerful tools to detect the ability of the membrane to speed up water uptake from salt solutions. Fully atomistic simulations also yield an indication of quicker water sequestration from liquid solutions, suggesting quicker ion–ion core shrinking. As a consequence, better-quality crystals are obtained by directing nucleation and growth events on the scale of time and space. More specifically, this study explores the potential of graphene platelets confined in polymeric frameworks when coming in contact with a hypersaline solution of NaCl (5.3 M). This stream is used as a solution model, although it should be appropriate to assert that seawater brine is a much more complex mixture of salts and organic compounds. In this respect, it needs to be stressed that ions normally present in seawater together with antiscalant and other chemicals added during the desalination process can affect the crystallization of NaCl. However, this matter is outside the scope of the present work. The aim of this study is to provide preliminary insights about the ability of graphene to accelerate successfully the events that precede crystallization. Thus, the confinement of a material such as graphene may be regarded as a promising strategy to design new suitable membranes for MCr and fill the gap with existing commercial membranes.44
2. Experimental
2.1 Materials
PVDF (Solef®6020, Solvay Solexis: water adsorption <0.040% @23 °C after 24 h; dp = 1.78 kg m−3) was kindly supplied by Solvay Solexis. Graphene platelet (GP) powder (carbon, >95 wt%; oxygen, <2 wt%; area, 10![[thin space (1/6-em)]](https://www.rsc.org/images/entities/char_2009.gif) 000 nm2; morphology, irregular symmetry typical of platelets) was purchased from Sigma Aldrich. The thicknesses of GPs in powder state and after confinement in the polymer matrix are peaked at around five layers, as confirmed by Raman spectra discussed in ref. 27. 1-Methyl-2-pyrrolidinone (NMP, Riedel de Haëm: max 0.05% in water, d = 1.03 kg m−3) and propan-2-olo (IPA, WWR PROLABO: d = 0.78 kg m−3) were used as a solvent and non solvent, respectively. FC-40 (Fluorinert Novec, p.eb 155 °C) was used for pore size and overall porosity estimation. Probe liquids for contact angle measurements were ultra-pure water (filtered by USF ELGA plant), glycerol (Fluka AG, 88%), and di-iodomethane (Aldrich, 99%). NaCl (WVR Chemicals, 100%) and deionized water were used for preparing solutions at 5.3 M. The latter were used as probe liquids to perform contact angle measurements and membrane crystallization (MCr) tests. All materials were used as received.
000 nm2; morphology, irregular symmetry typical of platelets) was purchased from Sigma Aldrich. The thicknesses of GPs in powder state and after confinement in the polymer matrix are peaked at around five layers, as confirmed by Raman spectra discussed in ref. 27. 1-Methyl-2-pyrrolidinone (NMP, Riedel de Haëm: max 0.05% in water, d = 1.03 kg m−3) and propan-2-olo (IPA, WWR PROLABO: d = 0.78 kg m−3) were used as a solvent and non solvent, respectively. FC-40 (Fluorinert Novec, p.eb 155 °C) was used for pore size and overall porosity estimation. Probe liquids for contact angle measurements were ultra-pure water (filtered by USF ELGA plant), glycerol (Fluka AG, 88%), and di-iodomethane (Aldrich, 99%). NaCl (WVR Chemicals, 100%) and deionized water were used for preparing solutions at 5.3 M. The latter were used as probe liquids to perform contact angle measurements and membrane crystallization (MCr) tests. All materials were used as received.
2.2 Membrane preparation
The membranes were prepared by a dry–wet phase inversion according to the procedure detailed in Gugliuzza et al.45,46 GPs were dispersed in NMP using an ultrasonic bath at 80 °C for 4 h. Then, the dispersion was equilibrated under mechanical stirring at 30 °C and PVDF powder was added to the mixture at a concentration of 12 wt%. The mixtures were left under mechanical stirring at 30 °C for 24 h, with the GP loading ranging from 0.5% to 10%. Hereafter, the content of the filler will be referred to as GP05, GP5, and GP10. After degassing, the mixtures were uniformly cast on glass plates by using a casting knife regulated at 250 μm (Elcometer Instruments Inc). The casting solutions were coagulated in a bath containing IPA in order to promote solid–liquid demixing and shifting the polymer precipitation in the crystalline region. Then, the membranes were washed in ultra-pure water, air-dried at room temperature overnight and annealed at 30 °C for 1 hour.2.3 Buildup of simulated systems
The Materials Studio package (version 7.0) of BIOVIA (formerly Accelrys) and the COMPASS (condensed-phase optimized molecular potentials for atomistic simulation studies) force field were used for the simulations of the pristine PVDF and PVDF/GP composite membrane models.47,48The PVDF template chain consisted of 100 monomers for a total of 602 atoms. Every polymeric model contained 13 polymer chains. Graphene sheets were created by connecting six-membered carbon rings in planar form. Each graphene platelet contained 162 atoms with a dimensions of 1.5 × 2.55 nm2. Hydrogens were added to the edge carbon atoms for saturating the graphene platelets. The PVDF and PVDF/GP systems were randomly packed in an amorphous two-dimensional periodic box using the Amorphous Cell tool of BIOVIA (ex Accelrys software). This tool grows the chain molecules in the box one segment at a time, with random torsion, by Monte Carlo moves. The probability of the Monte Carlo algorithm is calculated with respect to Flory's RIS theory.49 Thus, a total of 7826 atoms were grown for the pristine PVDF. Three and six graphene sheets were used in PVDF/GP5 and PVDF/GP10, respectively, thus leading to a total number of atoms of 8312 for PVDF-GP 5 wt% and 8798 for PVDF-GP 10 wt%.
The models were then prepared according to the procedure detailed in Tocci et al.50–52
In brief, all the models were energy-minimized and then molecular dynamics (MD) simulations, both at constant particle number, pressure, and temperature (NPT) and at constant particle number, volume, and temperature (NVT), considering different temperatures, were performed for equilibrating the cells and obtaining the final densities.
In the simulated PVDF/GP systems the polymer chains surrounded distinctly the nanofiller. The platelets were dispersed in the amorphous polymer phase and were not interacting with each other. Moreover, graphene agglomerates were not observed, indicating the lack of local phase separation. In summary, a good miscibility between graphene and polymer was found.
The consequent calculations of the crystallization process were performed using the GROMACS software version 5.1.4 (ref. 53) after the scrutiny of the equilibration of the models.
The size of the PVDF and PVDF/GP5-G10 models were 5.63 × 5.63 × 11.38 nm3 for pristine PVDF, 5.55 × 5.55 × 10.90 nm3 for PVDF/GP5 and 5.71 × 5.71 × 10.91 nm3 for PVDF/G10. The simulation boxes were filled with 7637, 6989 and 7194 SPC/E water molecules, respectively.54
Supersaturated conditions were considered with a concentration of solutions of about 6 M with almost 759–800 pairs of Na+ and Cl− ions chosen in order to simulate the condition near a membrane surface during the crystallization experiments. The behaviour of dense surfaces was supposed to be comparable with that of experimental microporous membranes because the simulations were carried out in supersaturated solutions. The simulations were focusing on the crystallization process at nanoscale level. The theoretical parameters of models achieved are reported in the ESI.†
3. Methods
3.1 Structural and physicochemical properties
The morphology features of the composite polymeric membranes were examined by SEM (Zeiss EVO MA10, Germany). Pore size and distribution were estimated according to the gas–liquid displacement technique (PM, Instruments). An average of five samples with an effective area of 3.5 cm2 were filled with FC-40 and the liquid was displaced from bigger to smaller pores with increasing pressure. The overall porosity was measured by filling them with FC-40. The membrane weight was estimated before and after filling and the porosity was expressed in percentage as the ratio between the volume occupied by the Fluorinert liquid and the volume of the membrane. ATR spectra were directly collected and averaged from the sample surfaces after fluxing water vapor for 2 h at 25 °C (UATR crystal diamond/ZnSe-Spectrum One System by Perkin Elmer Instruments). The resistance to wetting of the membranes was evaluated by using contact angle measurements according to the sessile drop method (CAM 200, KSV Instruments, Ltd.). The overall surface free energy (γs, mJ m−2) and related polar and non polar components together with the work of hydration (Wiw, mJ m−2) and the work of interfacial interaction (Wiwi, mJ m−2) were calculated using eqn (1)–(5) described in the ESI.†43 Crystal formation and growth were detected using an optical microscope (Nikon Eclipse LV100ND) by taking representative samples from supersaturated solutions at different consecutive times. Pictures of NaCl crystals were captured at three consecutive times from their nucleation in order to assess the size, shape and kinetics. Major details are provided in the ESI.†3.2 Transport properties
Thermally driven MCr experiments were performed accordingly with the direct contact (DC) configuration21 using 5.3 M NaCl solutions as a feed. All experiments were carried out over six continuous hours at Tfeed = 36.5 ± 0.5 °C, Vfeed = 37500 m s−1 (Refeed = 9.25 × 10⁶) and Vperm = 15000 m s−1 (Reperm = 3.37 × 10⁶).
Retentate and distillate streams were converged, in a counter-current way, toward the membrane module containing the membrane with an area of 11.33 cm2, where the liquid water was evaporated. The flux was calculated considering the effective free area of the membranes and it was normalized with respect to the thickness of the pristine PVDF membrane. Samples of the solution were frequently collected to evaluate the formation of the first small crystals formed at an early stage and related growth with time.
The quality of the crystals was evaluated by examining the evolution of the particle size distribution with time according to the Randolph–Larson general-population balance, which is valid for a steady-state crystallizer receiving solid-free feed and containing a well-mixed suspension of crystals experiencing negligible breakage – as in the case of MCr.55,56 The density of the nuclei population (B0), coefficient of variation (CV) and growth rate of the crystals (G) were estimated according to eqn (8)–(10) described in the ESI.† For each membrane system, two/three MCr tests were repeated on membranes prepared under the same conditions.
3.3 Fully atomistic simulation
The simulations were conducted in the isothermal–isobaric ensemble (NPT) at 300 K and 1 atm using the velocity rescaling thermostat (τt = 0.1 ps) for temperature coupling and the Berendsen barostat57 with a compressibility of 4.5 × 10⁵ bar−1 (τp = 1 ps) for pressure coupling. The initial configuration for the models was obtained by minimizing the total energy in the box, and then equilibrated via the isothermal ensemble (NVT) followed by NPT for each 2000 ps with a time step of 0.2 fs. Finally, the systems were carried out with a production run of 200 ns. All trajectories were visualized using Visual Molecular Dynamics, version 1.9.3.58–61 The behavior of dense surfaces was supposed to be comparable with that of experimental microporous membranes. The simulations were carried out in supersaturated solutions and focused on the crystallization process at the nanoscale level. Major details, including the calculated heat of crystallization for each system, are provided in the ESI.†4. Results and discussion
Structure–transport relationships
As a basic concept, graphene platelets have been confined within spherulitic-like frameworks of PVDF according to dry–wet phase inversion.45,46 The purpose was to obtain a quite discrete dispersion of graphene in the matrix to prevent undesired thermal polarization, graphene being a material with the highest thermal conductivity.62Fig. 1 shows particulate-like polymer networks of PVDF nanocomposite membranes; graphene platelets (GPs) are randomly entrapped throughout the surfaces (Fig. 1a) and along the cross section of the membranes (Fig. 1b). The pores are free gaps frozen in interlinked polymer particles whose distribution is broadened when the loading of graphene is increased (Fig. 2a). This means that wider pathways at the polymer–platelet interface could be generated, leading to a quite heterogeneous and larger distribution of the free volume fraction – pore size (r) and overall porosity (ε) – in the presence of a larger amount of nanofiller.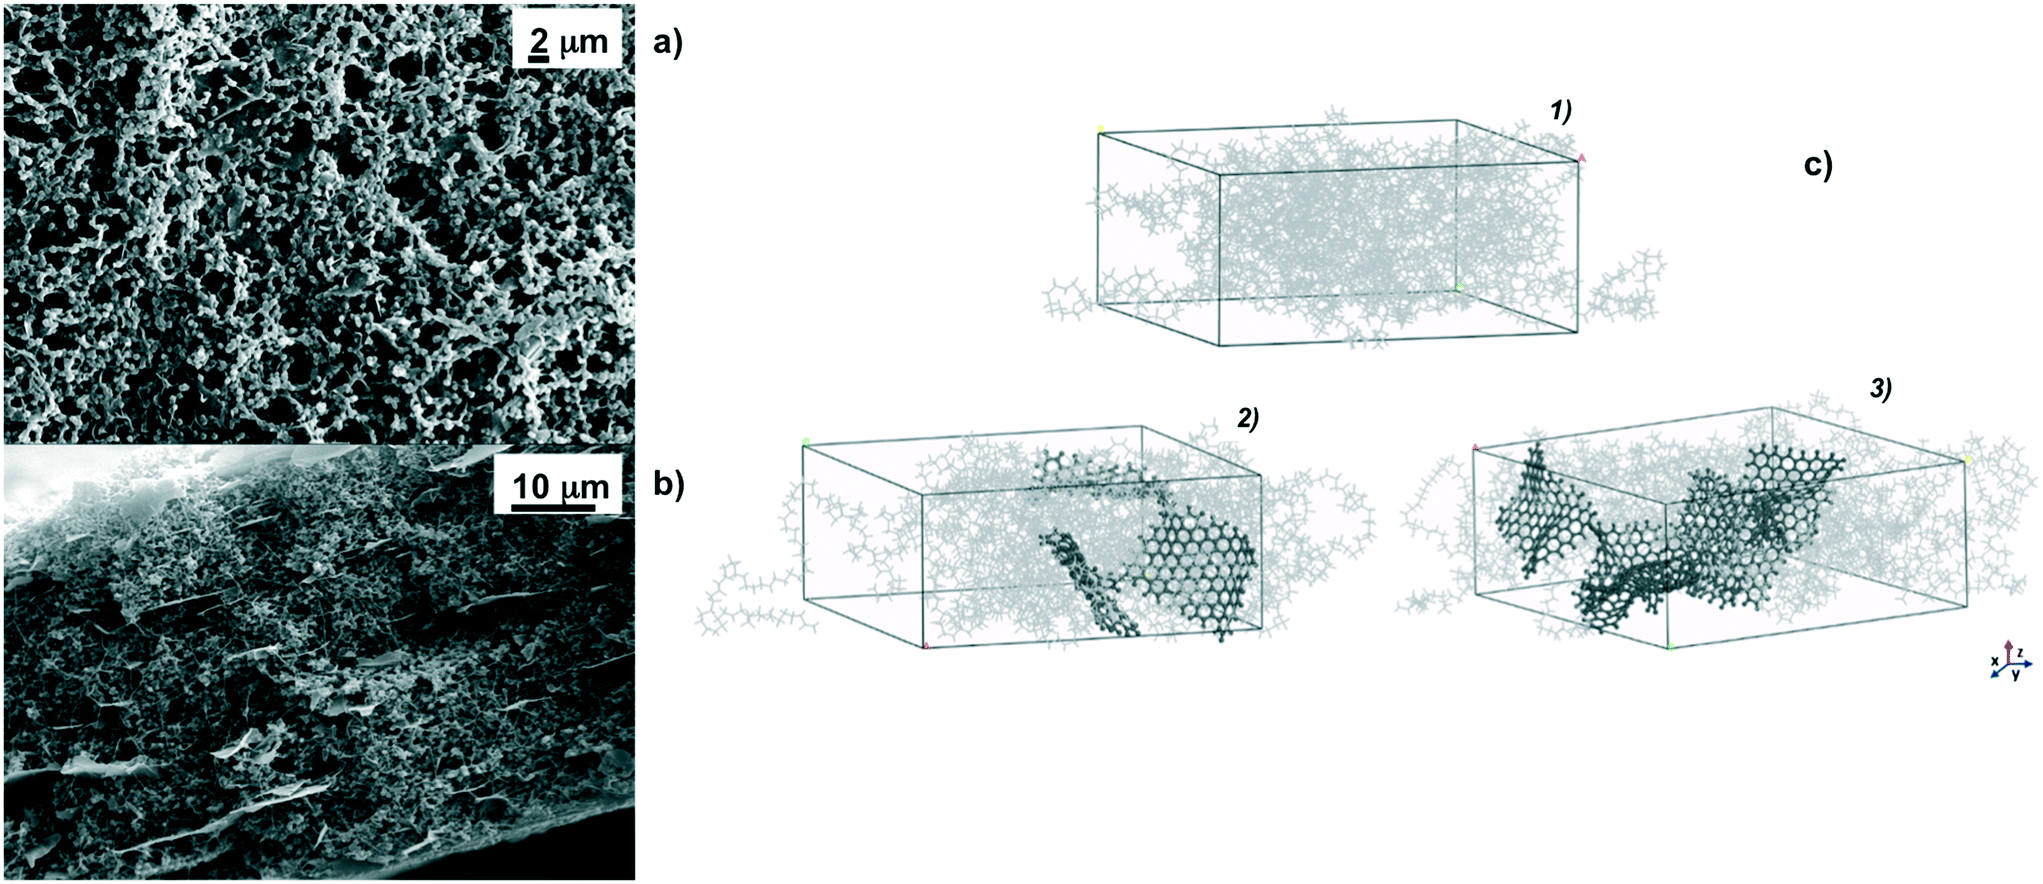 | ||
| Fig. 1 SEM micrographs of the top PVDF/G5 surface at a magnification of 5k× (a) and along the cross section of the PVDF/G5 membrane at a magnification of 4k× (b); simulated boxes (c) for pristine PVDF (1) and PVDF/GP5 (2) and PVDF/GP10 (3) composite membranes constructed by using Materials Studio software: grey light lines for PVDF chains, black ball-and-stick aromatic structures for graphene. | ||
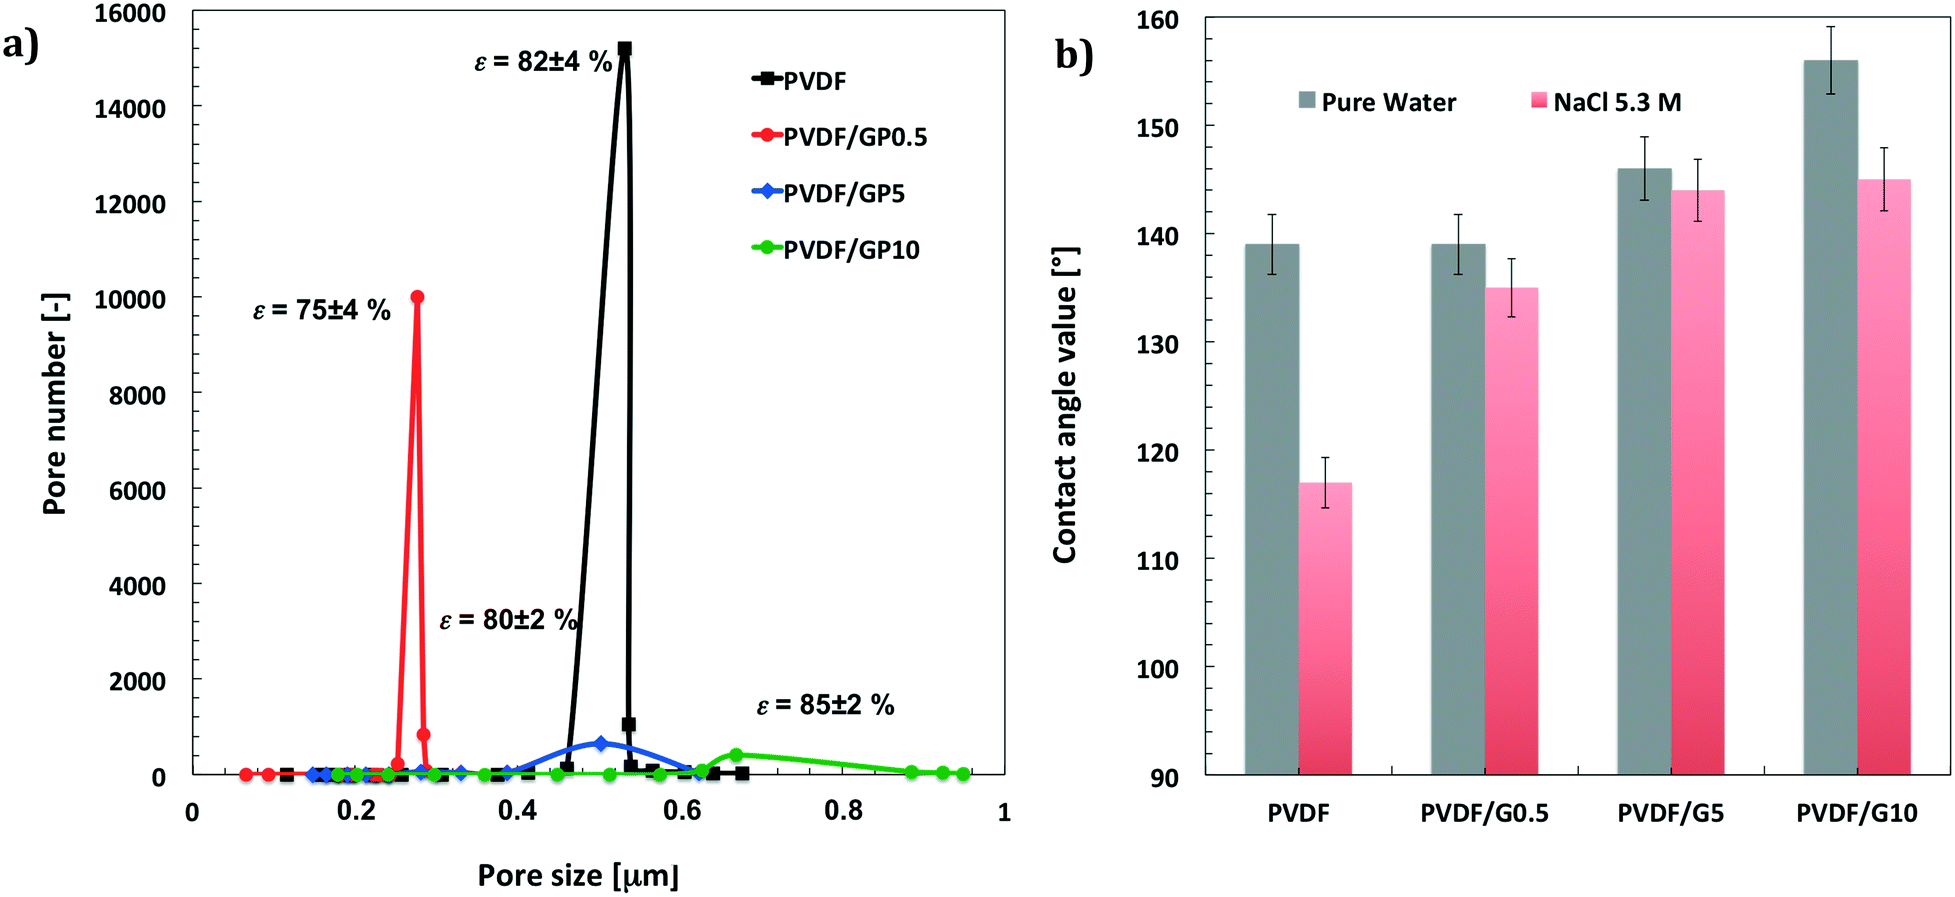 | ||
| Fig. 2 (a) Morphological parameters of PVDF membranes filled with GPs at various loading: changes in pore distribution vs. mean pore size. (b) Contact angle values estimated for all membranes with pure water and 5.3 M NaCl solution. | ||
Concerning fully atomistic simulation, three boxes simulating pristine PVDF and PVDF/graphene (PVDF/GP) composites at 5% and 10% graphene have been assembled by using Materials Studio software (Fig. 1c).63 The platelets have been dispersed into the amorphous polymer phase and have not been interacting with each other. Graphene agglomerates were not observed, suggesting the lack of local phase separation.
Chemistry and topography make these membranes have more hydrophobic surfaces. Pristine membranes exhibit contact angle values of 139 ± 3° for pure water and 117 ± 6° for 5.3 M NaCl solution. The addition of graphene causes a further increase in waterproofness, reaching values of 156 ± 5° for pure water and 145 ± 4° for 5.3 M NaCl at the highest content of nanofiller. Fig. 2b shows the increase in hydrophobicity for all membrane surfaces when pure water and concentrated salt solution (5.3 M) are used as liquid probes. The lowest values measured for the NaCl solution are due to the lowest surface free tension of the hypersaline liquid, which causes relatively little spreading. However, it should be noted that the decrease in the contact angle value for the salt solution is less than that estimated for the pristine membrane.
Pristine PVDF and composite PVDF/GP membranes have been tested in direct contact configuration by applying a difference of temperature of 25 °C across the membrane as a driving force for the process. The intent was to promote passage of water vapor from the feed (hot side consisting of salt solution) to the permeate (cooled side consisting of pure water). Salt crystals have been retrieved in the retentate side with rejection values of 99.99–99.98%, thereby confirming good resistance of the membranes to wetting. Major details concerning the process and working conditions can be found in the ESI.†
Fig. 3a shows the values of the flux calculated by considering the effective free area of the membranes. The fluxes have been further normalized with respect to the thickness of the pristine PVDF membrane. The membranes with the major loading of graphene (PVDF/GP5 and PVDF/GP10) exhibit the highest values of flux by the first 250 min of operation (Fig. 3a). The membrane with the lowest content of nanofiller (PVDF/GP05) exhibits instead a lower flux value (Fig. 3a) according to the reduced free gaps (Fig. 3b).
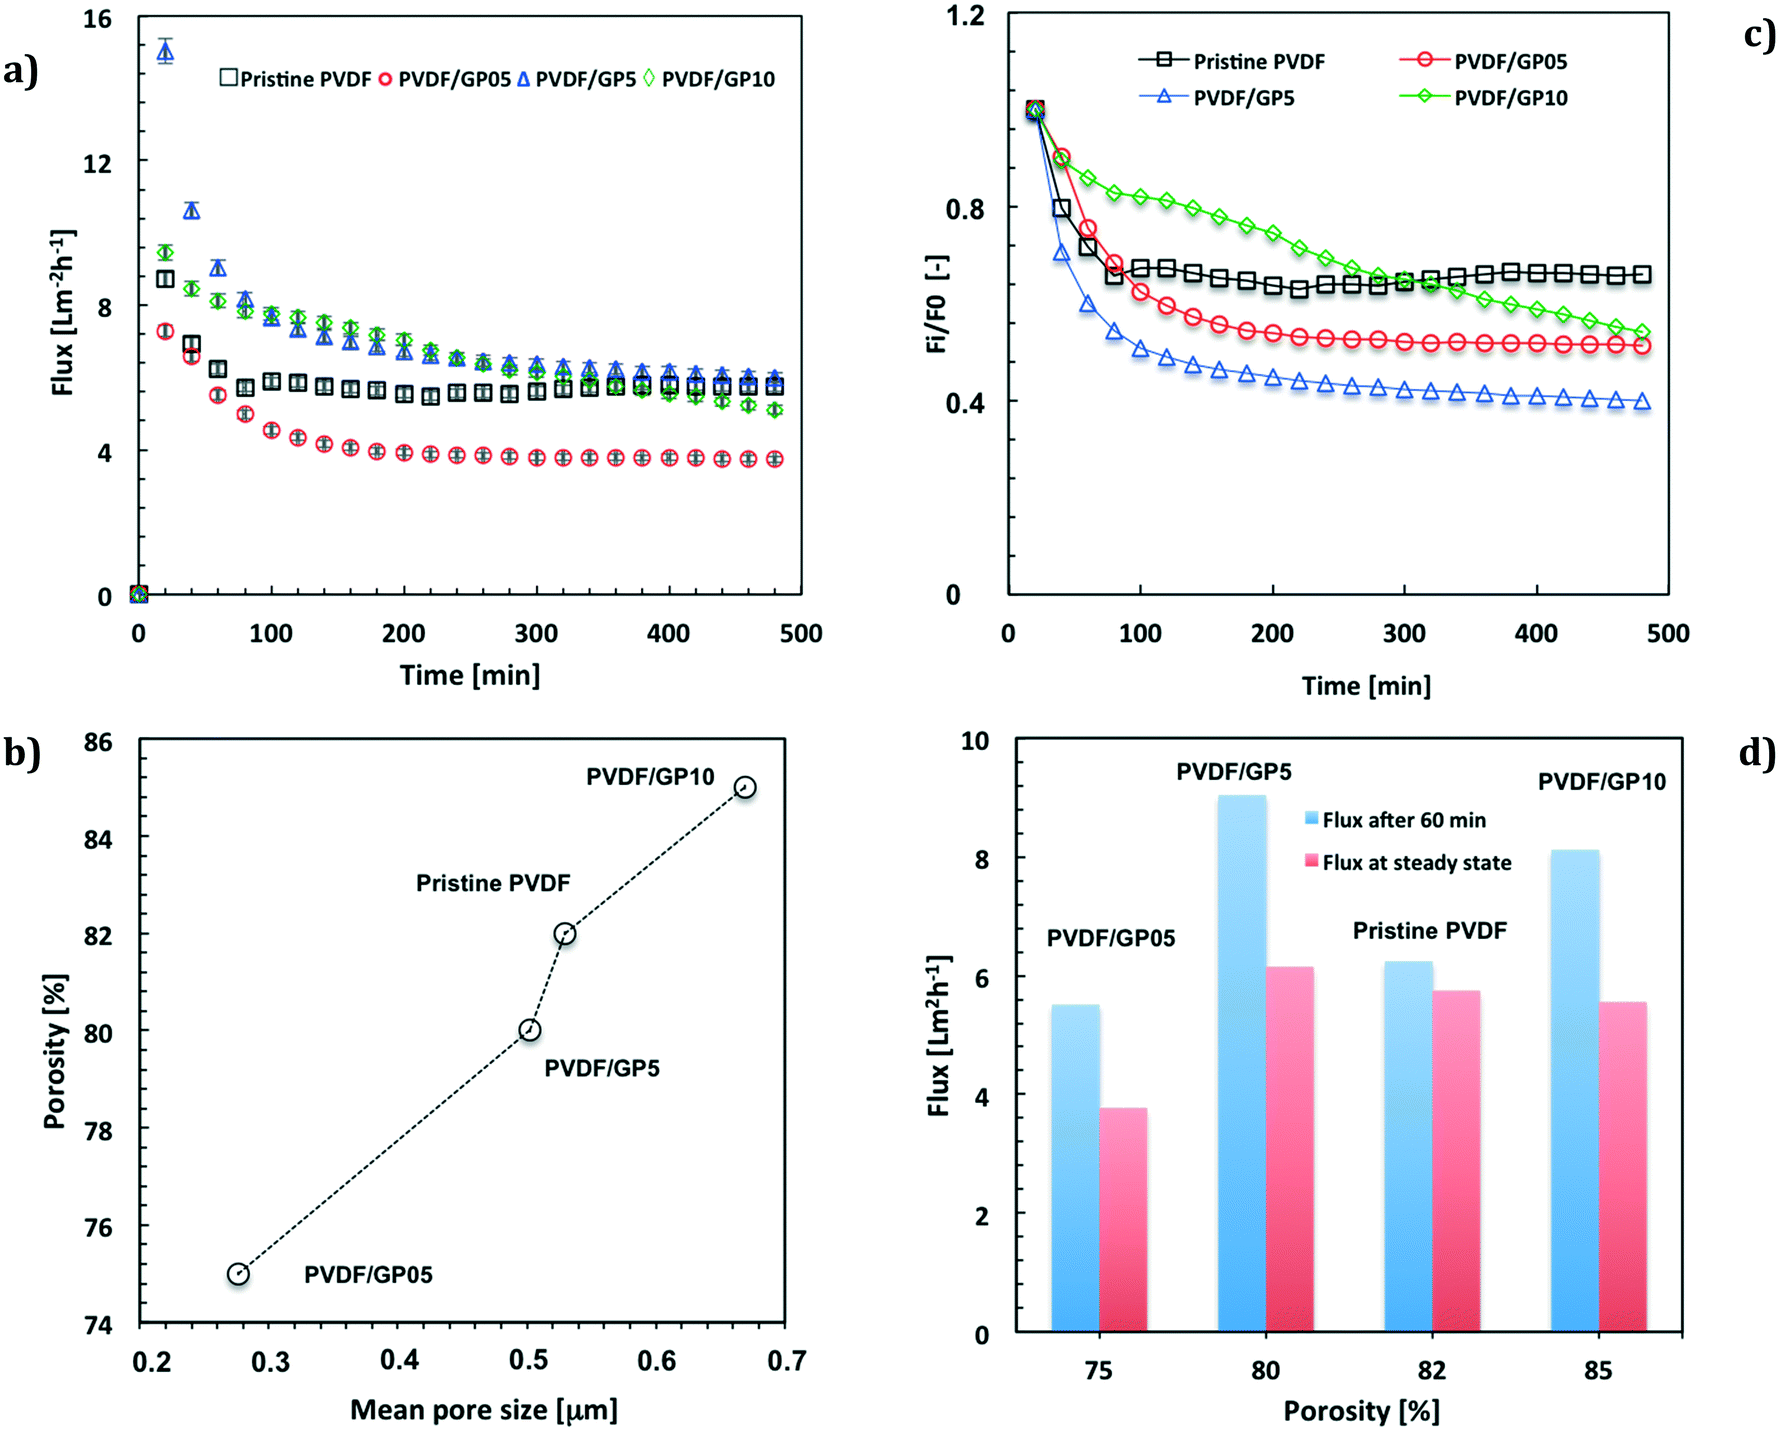 | ||
| Fig. 3 Water flux vs. time (a); relation between overall porosity and mean pore size (b); relative flux (Fi/F0) vs. time (c); flux estimated after 60 running minutes and at steady state for all membranes (d). | ||
A decline of the flux is observed for all membranes functionalized with graphene (Fig. 3a and c). This is much more marked at higher content of nanofiller, whereas the pristine PVDF membrane reaches a steady state more quickly (Fig. 3a and c).
Comparing the fluxes estimated under the same operating conditions, it is interesting to observe a higher ability to permeate for the PVDF/GP5 membrane (Fig. 3d), although the morphological features are similar to those estimated for the pristine membrane (Fig. 3b).
In line with the morphological properties, the PVDF/GP05 membrane exhibits a lower capability to permeate water vapor than that of all membranes, including the pristine one (Fig. 3d). PVDF/GP10 shows a different trend due to a constant decline with time. Initially, it exhibits a high flux, which becomes comparable to the others at the end of the process (Fig. 3d).
Crystal nucleation
Analyzing the data of the flux with those related to the crystallization events, the role of the morphological properties appears to be less decisive in controlling the solvent evaporation and diffusion rate. Experimentally, the formation time of the first detectable crystals appears to be shortened for all membranes containing graphene (Fig. 4a). A reduction in the detection time of up to 190% is estimated for the PVDF/GP05 and PVDF/GP5 nanocomposite membranes according to the Randolph–Larson general population balance. The first small crystals are detectable in less than 4 h, suggesting the occurrence of cooperative events at the solution–membrane interface (Fig. 4a). A short appearance of small crystals is also detected for the PVDF/GP10 membrane (Fig. 4a).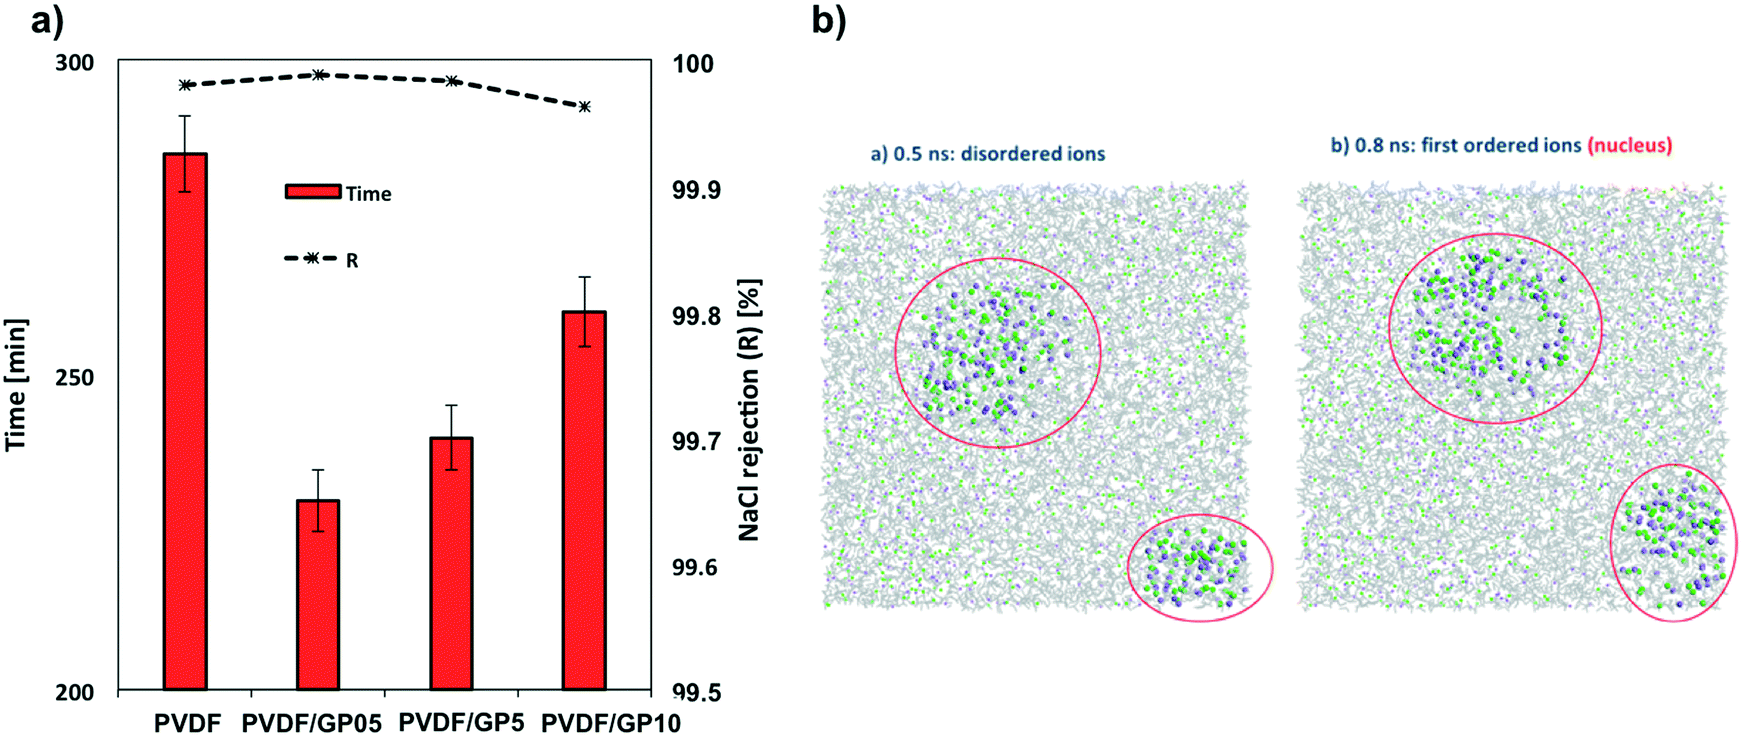 | ||
| Fig. 4 First detection time for small crystals and salt rejection values (a). Snapshots showing amorphous and crystal phases of Na+ and Cl− in supersaturated solutions of PVDF/GP5. Red circles indicate the regions with higher density and partial order of NaCl ions. Na+ in purple, Cl− in green, water molecules in grey (b). | ||
Molecular dynamics simulations indicate a reduction of the nucleation time of nanocomposite membranes (Table 1). This insight is in agreement with the temporary appearance of small crystals observed experimentally. It is well known that nuclei are unstable and form only transiently, making explorations difficult in real time. However, recent progress in computational methodology64–72 has allowed the use of fully atomistic simulations for investigating crystallization events under supersaturation conditions,73–75 providing a valid support to events occurring on longer time scales. Nahtigal et al.76 reported that the size of the initial clusters is between 14 and 24 ions for systems at concentrations lower than that used in this work (of about 6.01 M). Here, the first appearance of nuclei was observed from random ion arrangements, and then the growth of the stable nuclei is followed along the simulation time. The simulations indicated a multi-pathway nucleation (or crystallization) mechanism: first, local regions of relatively high salt concentration in the supersaturated solution appear, with the early-stage salt nucleus containing a significant amount of water, followed by a second step that includes nucleation and development of spatial ordering of the ions.68–71,73,74
| System | Theoretical disordered ions, time (ns) | Theoretical nucleation time, first ordered (ns) ions |
|---|---|---|
| PVDF | 0.9 | 1.0 |
| PVDF/G5 | 0.5 | 0.8 |
| PVDF/G10 | 0.6 | 0.8 |
In Table 1 we have indicated both when the first amorphous aggregate in a metastable equilibrium appeared and when the first stable ions with nuclei larger than the critical ones are observed. In the presence of graphene this induction time is slightly shorter than that in the presence of pristine PVDF.
It is evident in Fig. 4b how the ions organize themselves in such a way that at the beginning of the simulation time, some local regions of relatively high concentration of salts appear followed by visible spatial ordering indicating the early-stage salt nuclei surrounded by a significant amount of water. Then, in a second step, stable nuclei appear together with the development of spatial ordering of the ions. The consequence is the increase in ion–ion interactions, which leads to the formation of several small nuclei favourable entropically.
At the same time, a reduction of the water–ion interactions is investigated as an effect of water exclusion from saturated solutions. Also, crystal growth is observed within 200 ns in supersaturated solutions. Despite the different time scales, the theoretical data fit with the experimental evidence, which indicates a reduced time to detect crystals in the presence of graphene platelets.
Regarding the number and shape of the experimentally formed crystals, Fig. 5a shows a different population density of small crystals per membrane type. In particular, the highest number of small crystals has been observed for PVDF/GP5 (Fig. 5a), in agreement with the nucleation B0 (Fig. 5b). Unexpectedly, this kind of membrane also promotes a higher growth rate of crystals with time (orange line in Fig. 5b).
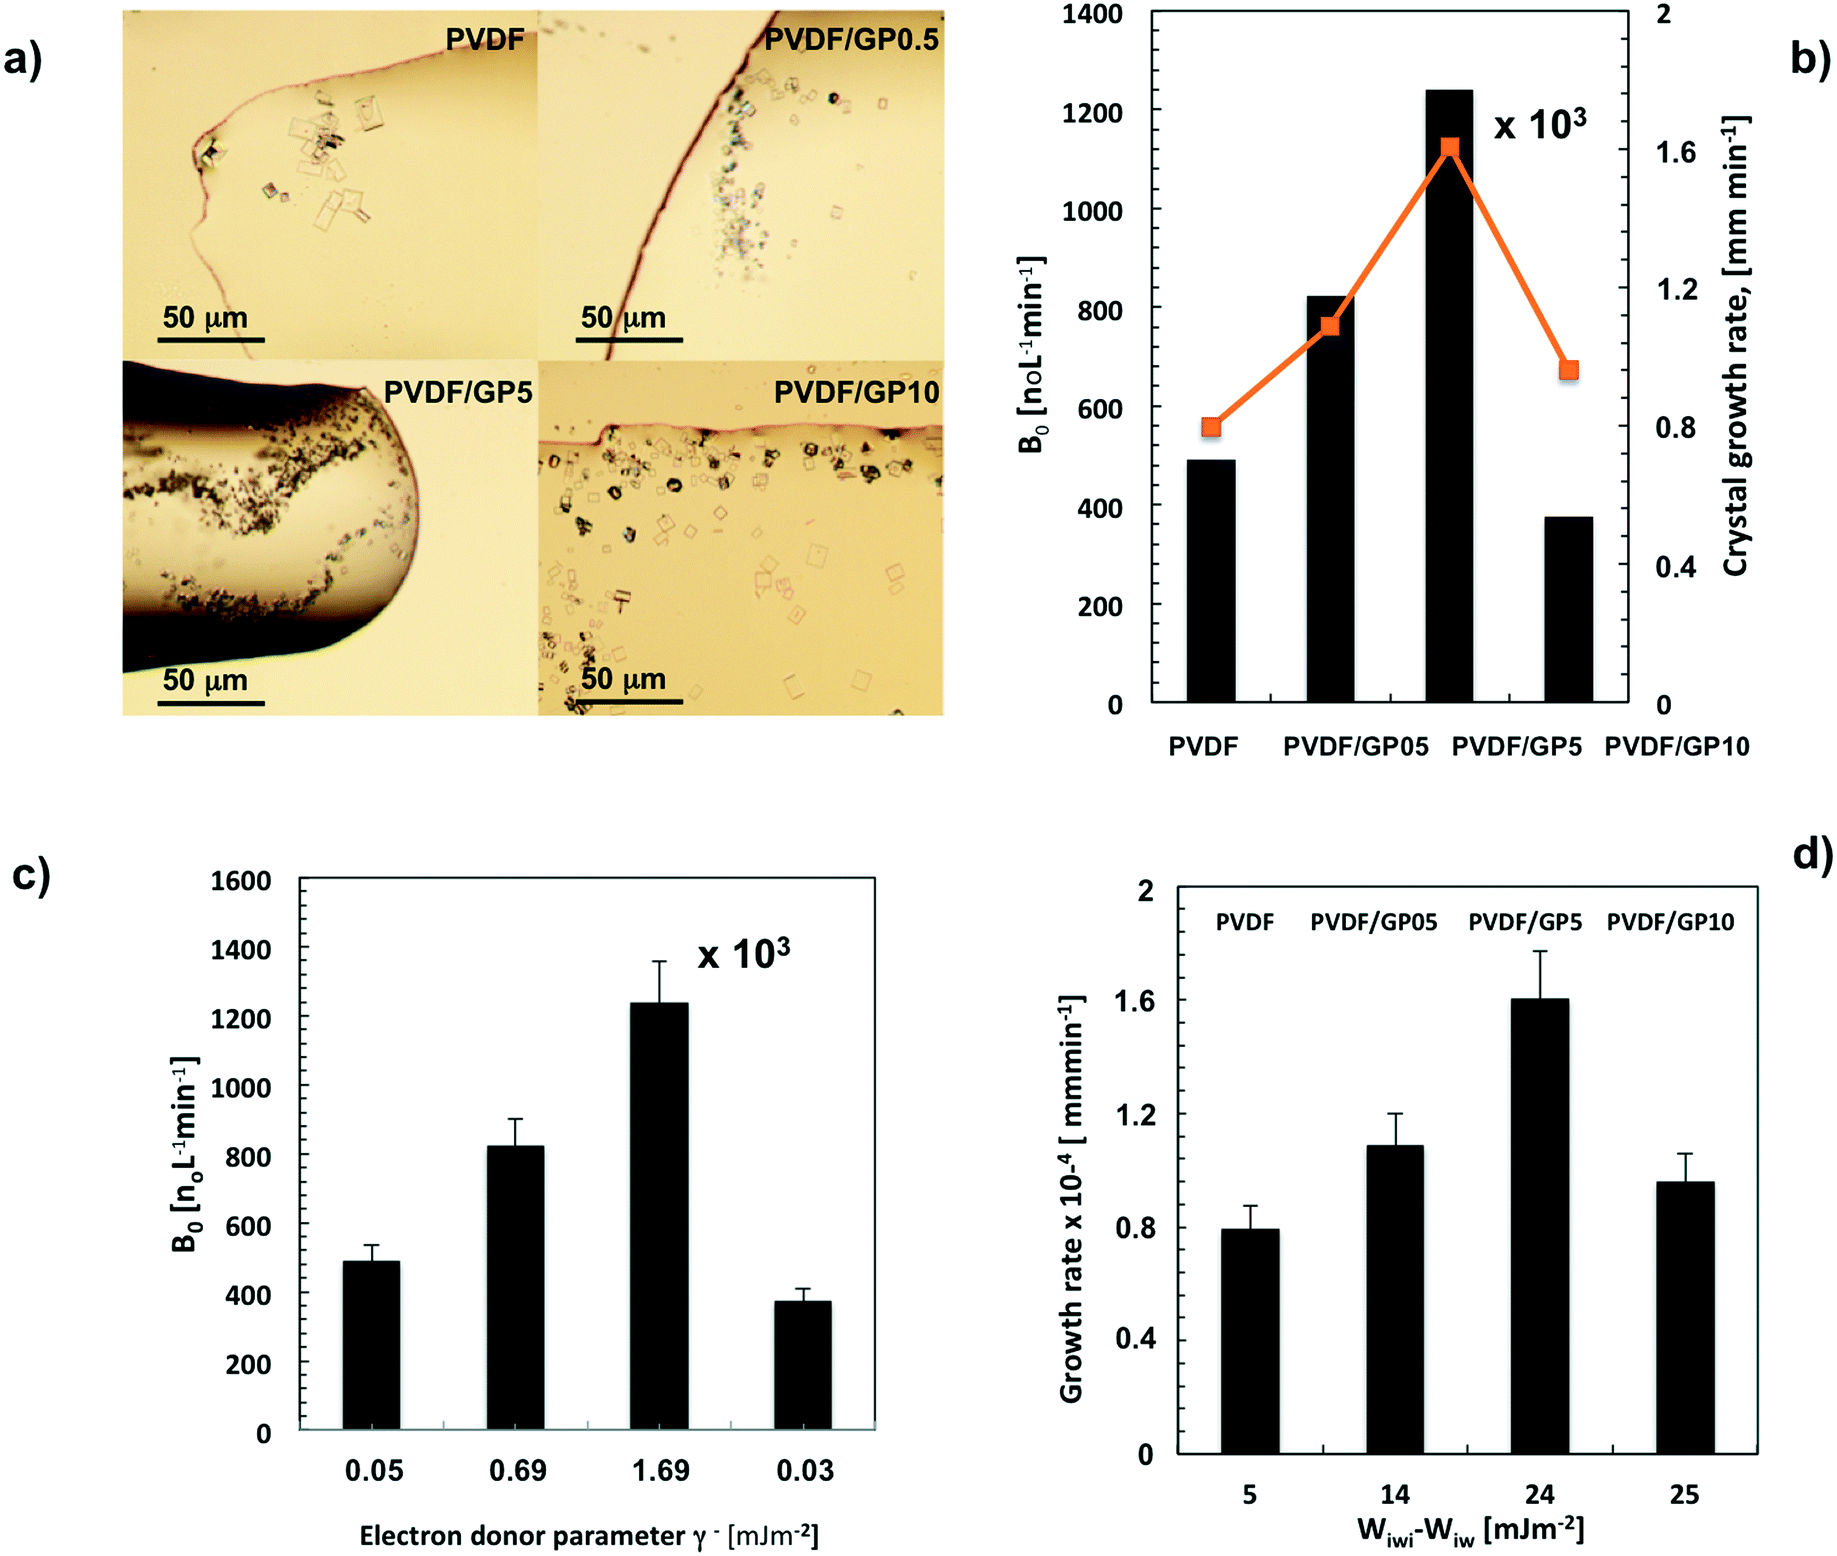 | ||
| Fig. 5 Spotlight pictures related to first formed crystals detectable by optical microscopy for all membrane-types (magnification 10×) (a); density of nuclei population (B0) and related growth rate (G) estimated for all membrane types (b); relationships between number of crystal nuclei (B0) and the electron donor (γ−) parameter of the overall surface free tension (c); crystal growth rate vs. difference between work of hydration and work of interfacial attraction (d). | ||
In contrast to the flux data, the PVDF/GP05 membrane comes second in inducing massive nucleation (B0) compared to the pristine one (Fig. 5b). The lowest value of B0 is instead estimated for the PVDF/GP10 membrane, independently of the high flux estimated within the first 250 min of the process (Fig. 5b).
This is because there is a different distribution of hydration sites throughout the membrane surfaces, where water molecules could be attached. This distribution is well expressed by a semi-quantitative thermodynamic parameter of hydrophilicity such as the electron donor component (γ−, mJ m−2) of the overall surface free energy (γs, mJ m−2).43,77 The higher the value, the larger the affinity to water. In particular, γ− gives an indication of the water uptake capacity of the composite membranes. It is interesting to note that the base electron donor component follows the same trend of experimentally estimated nucleation (B0). The highest values of this parameter are estimated for PVDF/G5 and PVDF/G05, respectively (Fig. 5c).
A value of B0 of more than 1 million per L min−1 of nuclei is calculated for PVDF/GP5 membranes, which bring a larger number of hydration sites. In this case, the value of γ− is 1.69 mJ m−2 (Fig. 5c). This suggests a better capability of the membrane to stimulate hydration mechanisms, which give rise to a rapid water exclusion from ion–water clusters. The result is a less time-consuming ion–ion aggregation and a shortened nuclei formation (Fig. 4b). The fast decline of the flux estimated for the nanocomposite membranes indicates indeed a certain ability to interact with the slurry phase.
The hypothesis of quicker water removal is also sufficiently supported by fully atomistic calculation. An increasing water removal from NaCl solutions coming in contact with composite membranes is predicted after 1 ns of simulation (Table 2). The radial distribution function, g(r),69 yields an indication of specific interactions between water and composite membranes. The g(r) function is related to specific interactions between the oxygen of water molecules and PVDF (red line in Fig. 6b) and graphene, which touch the salt solution (black line in Fig. 6b). It is calculated over 200 ns of simulation time and the peak at around 3.8 Å from the graphene sheet shows a small but more intense attractive interaction between graphene and water. For the pristine PVDF model, the shape of the g(r) graph is similar but much smoother, thus suggesting a much weaker water–membrane interaction in the absence of filler.
| System | NaCl at 0 ns [mol L−1] | NaCl at 1 ns [mol L−1] | Water uptake [%] |
|---|---|---|---|
| PVDF | 6.020 | 6.087 | 1.10 |
| PVDF/GP5 | 6.012 | 6.095 | 1.37 |
| PVDF/GP10 | 6.004 | 6.089 | 1.40 |
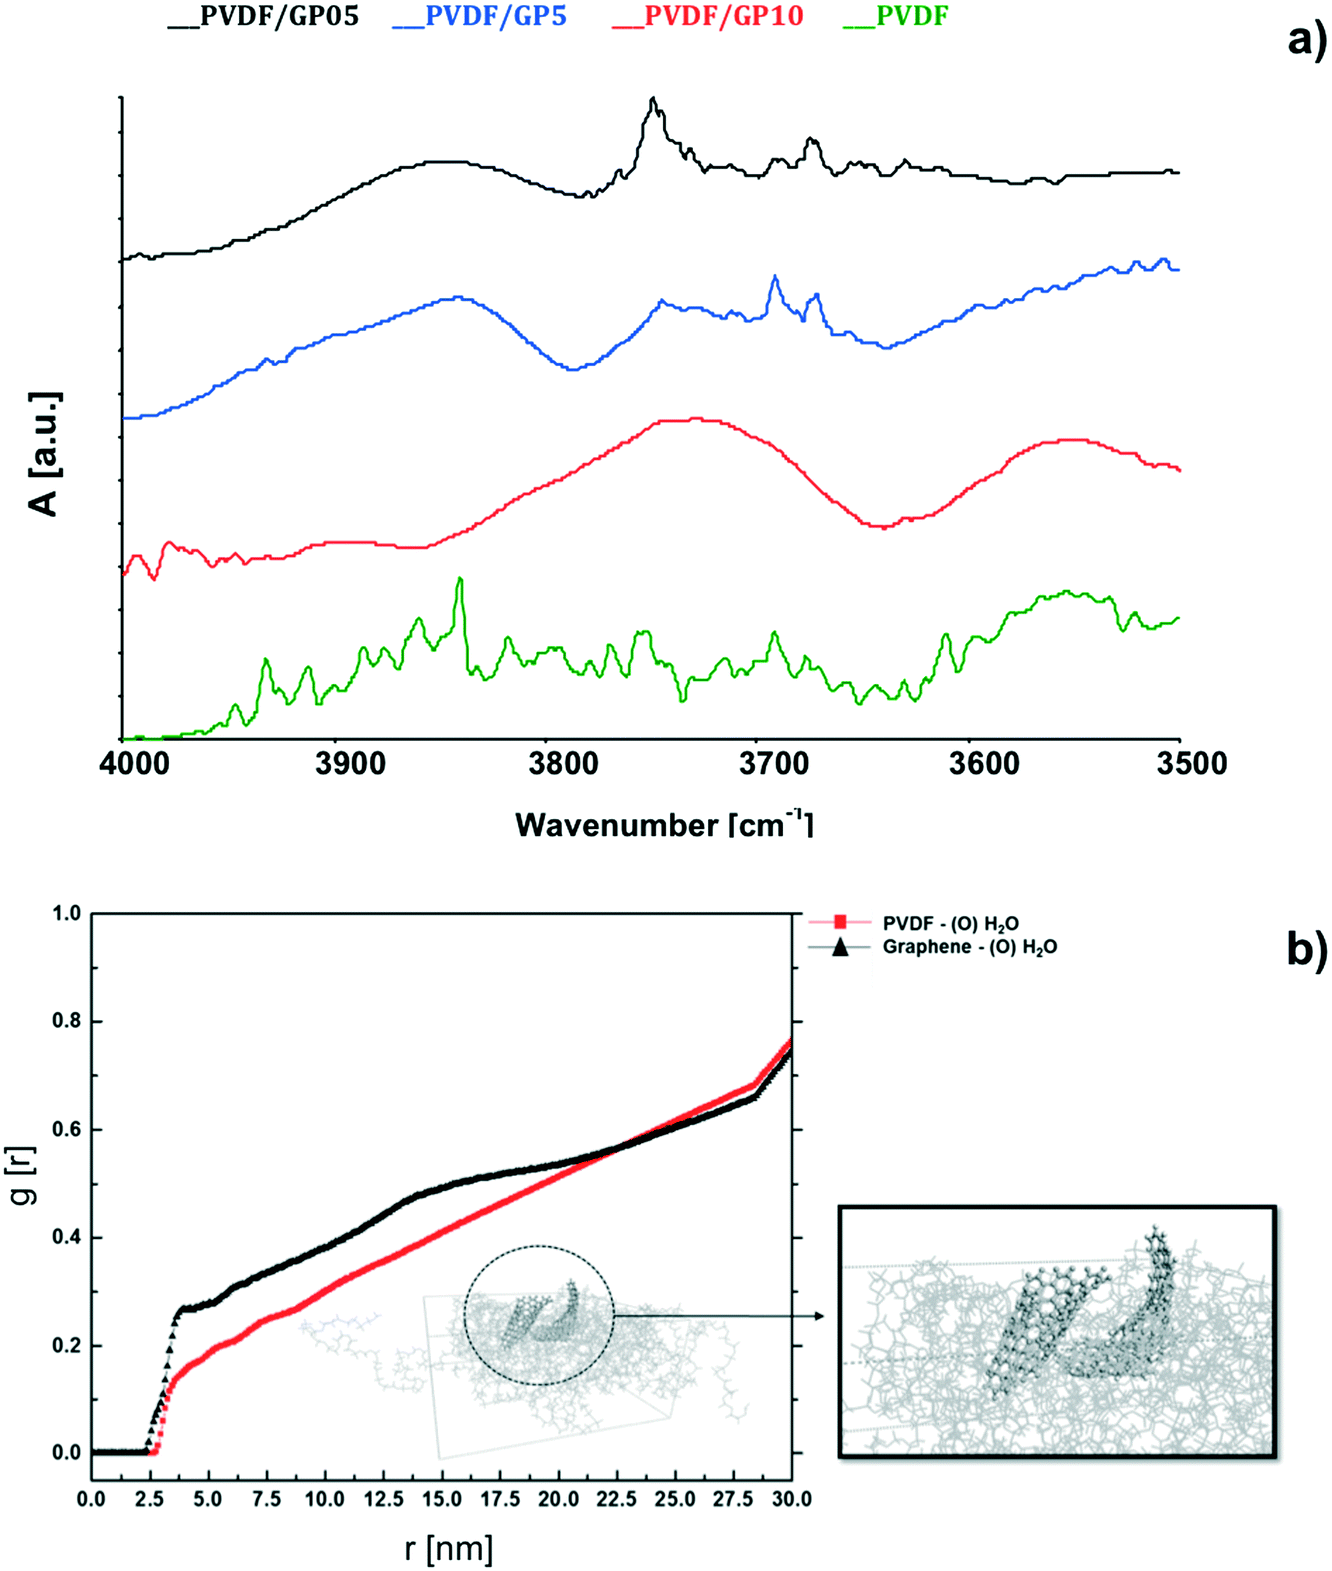 | ||
| Fig. 6 ATR spectra collected at the surface of membrane-types after 2 h of water vapor diffusion (a); radial distribution function (RDF) related to the interaction between graphene and water (element O), black line, and PVDF chains and water (element O), red line in the PVDF/GP5 model (b). | ||
From the experimental point of view, the major ability of water to interact with PVDF/GP surfaces is also confirmed by ATR analyses (Fig. 6a). After fluxing the membranes with water vapor for 2 h, the spectra reveal broad infrared modes typical of O–H stretching, which are detectable for nanocomposite membranes only. Instead, no water adsorption is visible for pristine membranes. The shift of the wavenumbers associated to O–H is due to the different chemical environments generated through the composite membranes. The appearance of these infrared modes yields an indication of a certain capability of graphene to interact with water. This is in full agreement with the literature, which refers to interactions established between water and defective graphene.78–81
Crystal growth
However, a large amount of water adsorption (Table 2 and Fig. 6a) does not necessarily lead to a massive nucleation but rather to a better growth rate (Fig. 8d). The PVDF/G10 membrane is an example of this.In a previous work,27 it was discussed that the surface-area ratio of graphene entrapped in the polymeric matrix is somewhat low when a very large number of platelets is confined. Indeed, the contribution to the electron donor parameter of the overall surface free energy is low, suggesting a lower accessibility to the hydration sites. Thus, it is not surprising to estimate low values of B0 for the PVDF/GP10 membrane.
In this regard, it is useful to examine the role of some controlling forces for the crystal growth rate. First of all, the crystal growth rate is found to be reliant on the work of interfacial attraction (Wiwi, mJ m−2) (Table 3). This parameter is a thermodynamic expression of the wide-ranging autophilic character of the surface and of a major ability of the surface to detach water adsorbed on it.43 When the work of adhesion of water (Wiw, hydration) is smaller than the work of interfacial attraction (Wiwi), the detachment of water from hydrophobic surfaces is easier than breaking cohesive water bonds at the surface. Large differences between Wiwi and Wiw imply favored formation of cavitations near the hydrophobic surface–water interface.
| Membrane | W iw | W iwi |
|---|---|---|
| [mJ m−2] | [mJ m−2] | |
| PVDF | 68 | 74 |
| PVDF/GP05 | 65 | 79 |
| PVDF/GP5 | 70 | 93 |
| PVDF/GP10 | 64 | 89 |
The difference can be regarded as responsible for a fast detachment of water. Normally, fluorinated surfaces exhibit differences larger than those estimated for hydrocarbons. In this case, the presence of graphene amplifies the capacity of fluorinated surfaces to remove much quicker the water adsorbed from hypersaline solutions.
Let's examine what happens for each membrane. The PVDF/GP5 membrane exhibits the highest work hydration (Wiw = 70 mJ m−2) due to the largest number of hydration sites (γ− = 1.69 mJ m−2) dispersed throughout the surface. This membrane also exhibits the highest autophilic character (Wiwi = 93 mJ m−2). This can be regarded as the precondition to promote a temporary adsorption of a large amount of water, followed by a very quick detachment of water from the surface. An ‘attachment–detachment’ mechanism could be therefore envisaged for this membrane. A rapid ion aggregation due to a very fast ion–ion core shrinking is expected, leading to a massive formation of small crystals. Thus, it is plausible to ascribe a higher growth rate to a very large aggregation of small ion–ion clusters as well (Fig. 5d).
This event finds confirmation in short-term dynamics insights. Shorter distances are calculated along the x-y-z directions for ion–ion aggregates when the NaCl solution touches the PVDF/GP5 surface (Fig. 7a). The dimensions along the x-y-z directions of crystals in the three systems are between 4.5 and 6 nm and the number of ions is about 95% of the total (1500–1636).
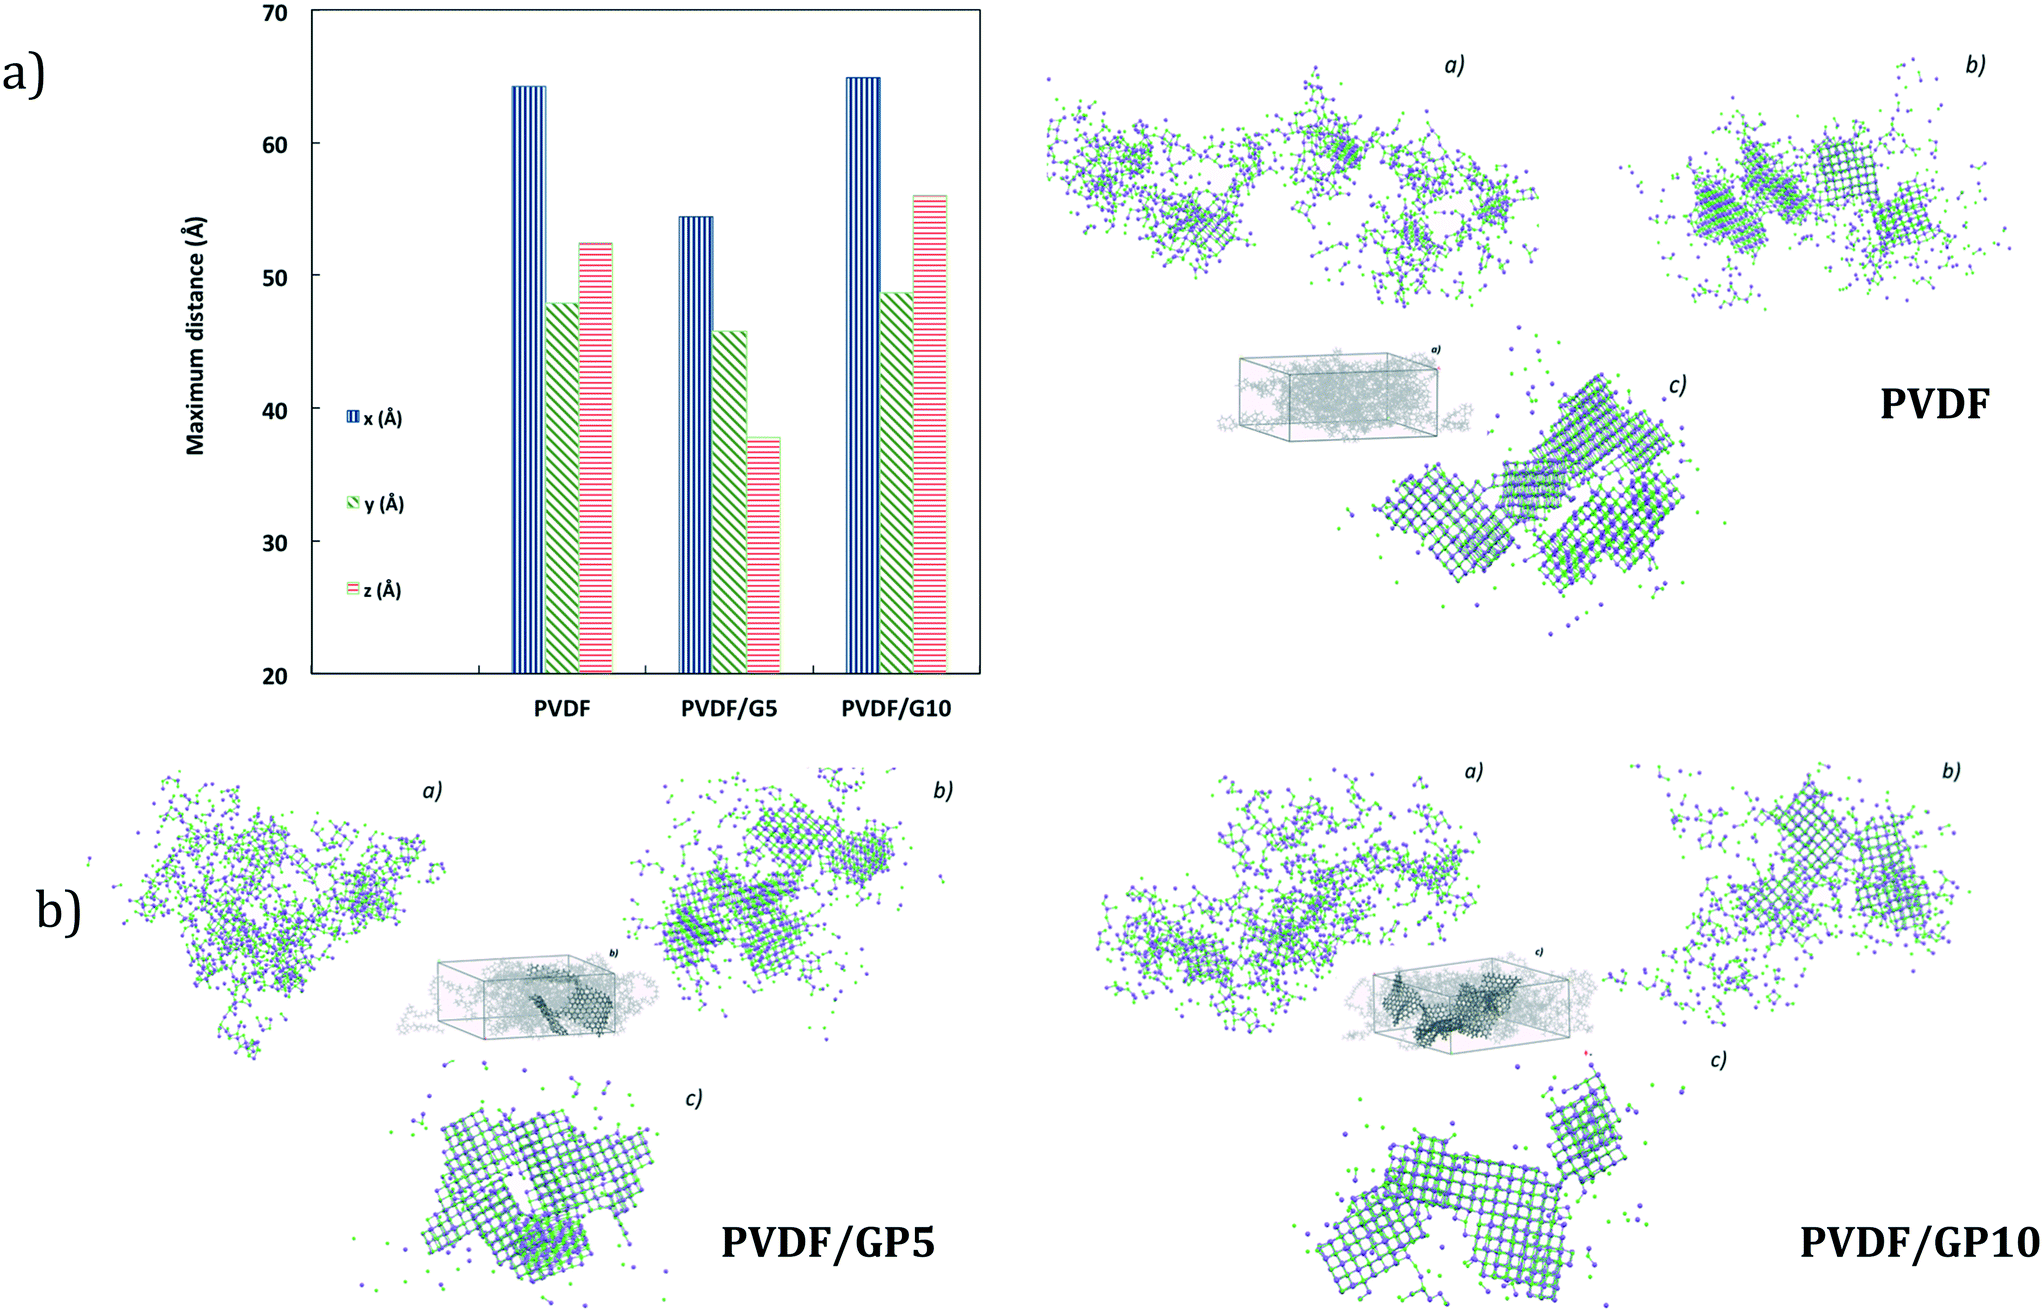 | ||
| Fig. 7 Theoretical maximum distance along the x-y-z directions (a) and snapshot aggregates (b) calculated for all membrane types at 0 (a), 20 (b) and 200 (c) ns. Here, both water molecules and polymeric membranes are not shown. | ||
Multiple regularly structured crystals are obtained in high numbers with smaller dimensions for nanocomposite membranes. This is more evident if compared to the NaCl bulk solution73 and pristine PVDF simulated under the same conditions (Fig. 7b). Consistently, a higher assembly of ion lattices is estimated for the PVDF/GP5 membrane. Hence, it is not surprising that a massive nucleation is followed by a larger growth rate of the crystals.
Massive nucleation (B0) is not experimentally detectable for PVDF/GP10 membranes. However, the crystals formed with this membrane continue to increase quite quickly (Fig. 5d). Although the work of hydration for this membrane is the lowest one, the work of interfacial attraction continues to be high enough to detach water previously adsorbed at the graphene-functionalized surface (Table 3). In this case, a smaller number of hydration sites (Wiw) associated to a higher autophilic character (Wiwi) of the surface promotes the growth of a few crystals, which results in a larger size if compared with the pristine membrane (Fig. 5b and d).
This argument continues to be valid for PVDF/GP05 membranes. In this case, the production of crystals is shortened; however, the lowest water flux prevents a massive formation of crystals. Nevertheless, a growth rate higher than that of pristine PVDF continues to be observed. A higher number of hydration sites is indeed estimated throughout the surface of this membrane (Fig. 5c). This lets a large number of water molecules attach to the surface, reaching supersaturation in a short time. However, the number of small crystals is not such to promote sizeable aggregation like that of the PVDF/GP5 membrane. Thus, the length/width ratio – related to the growth of the crystal – better evolves towards smaller cubic crystals (Fig. 8a).
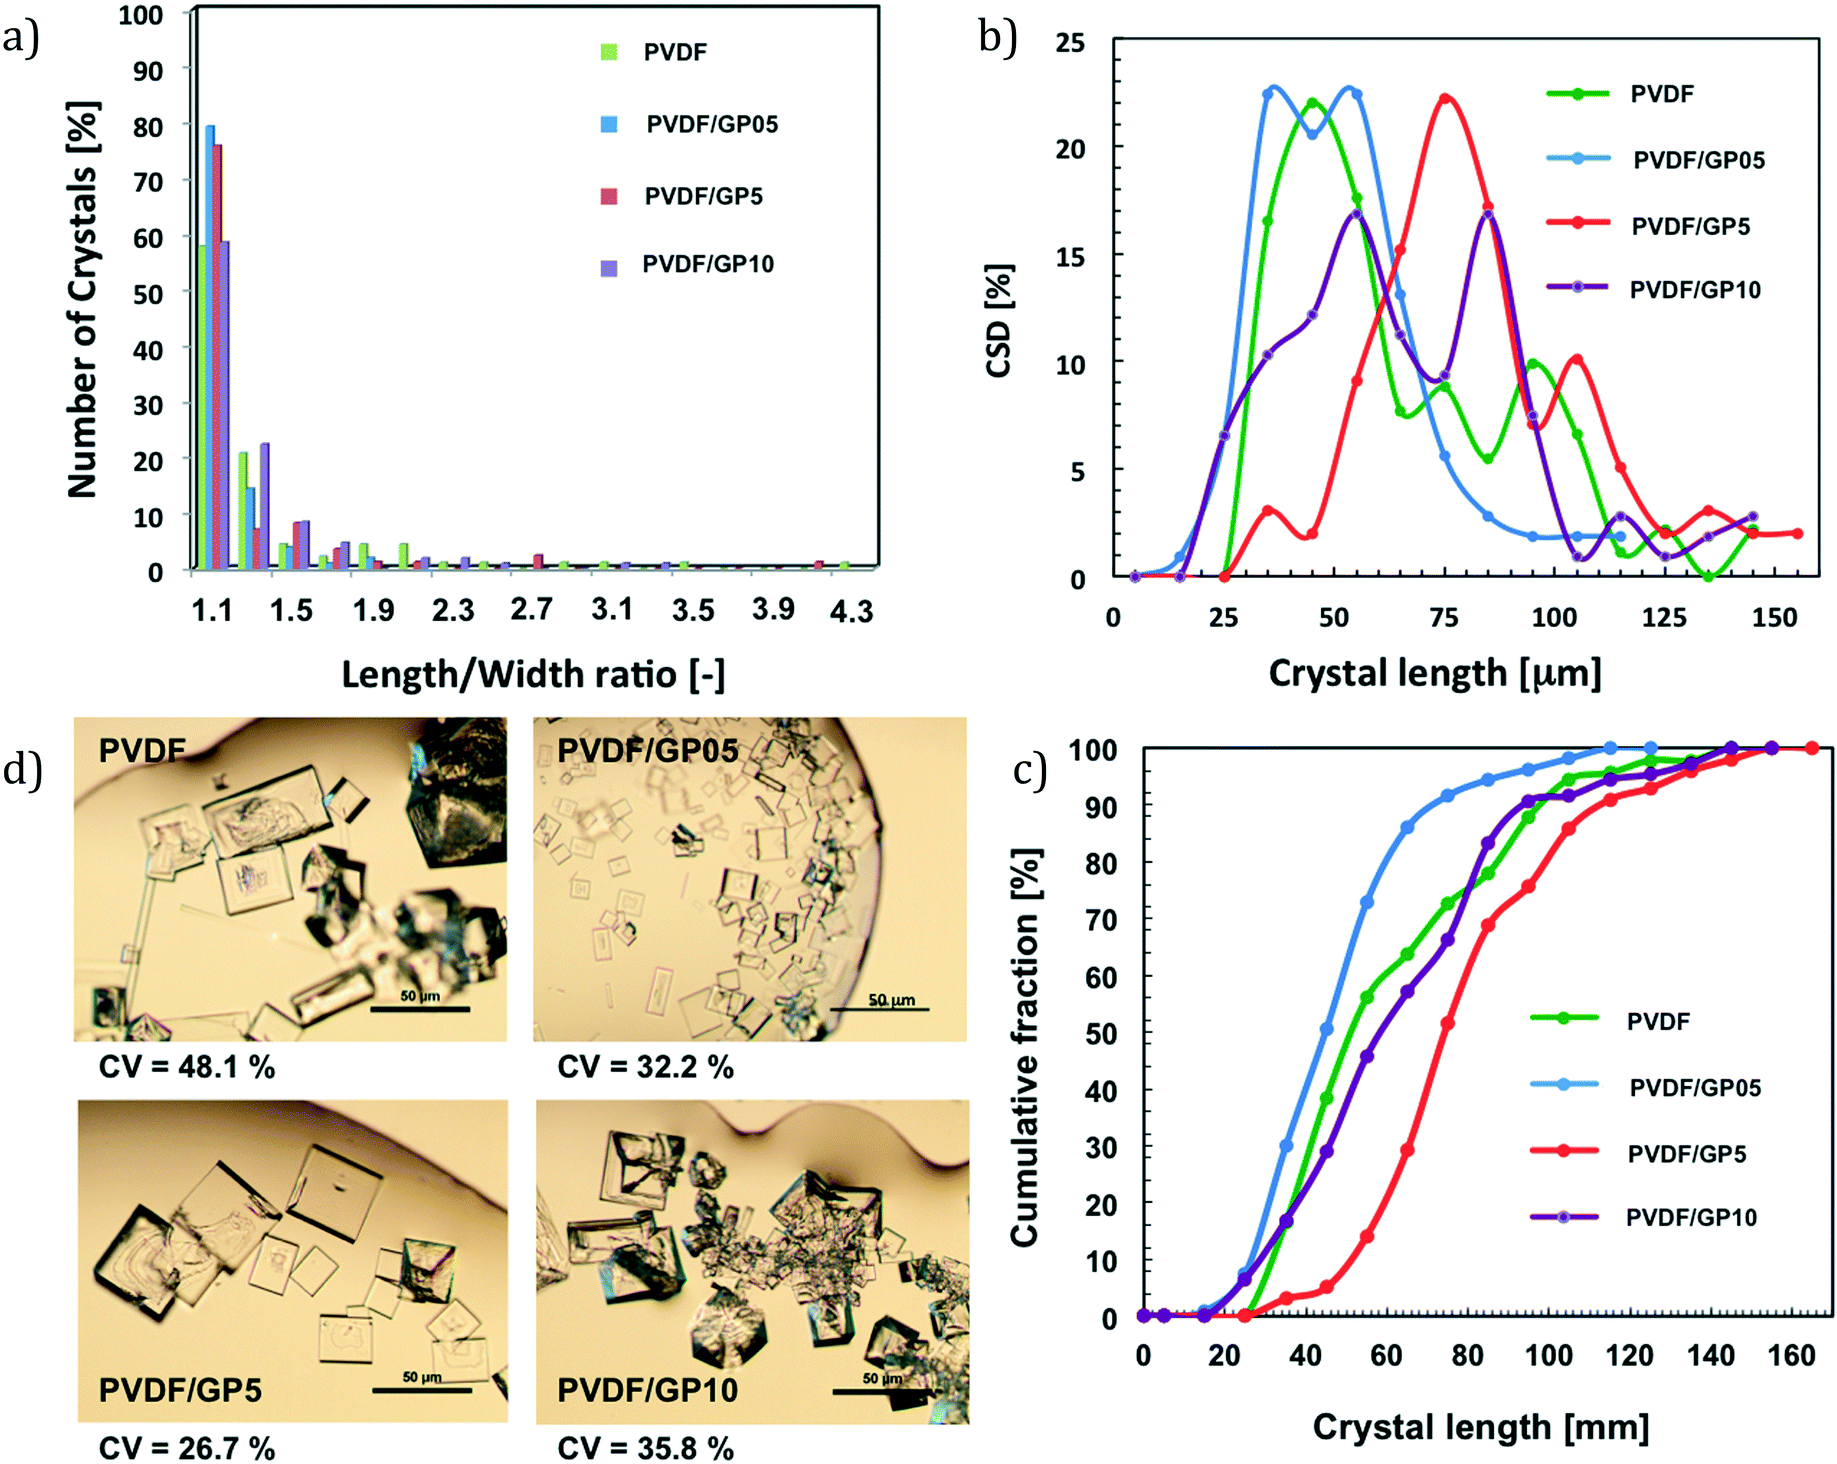 | ||
| Fig. 8 Evaluation of the crystal shape (approximately more than 100 pictures using an optical microscope for all membrane types, magnification 10×) (a); crystal size distribution and related cumulative fraction (CSD) (b and c); coefficient of variation and crystal spotlight pictures (d) of all membrane types. | ||
It should be stressed that a low value of length/width ratio indicates a cubic shape, while a high value indicates an elongated shape. In this case, a good balance of hydration sites and autophilic character of the surface leads to crystals with a predominantly cubic shape (Fig. 8a).
Although in a counter-current system secondary nucleation cannot be suppressed completely, more uniformly distributed crystals are achieved as the coefficients of variation (CV) reveal (Fig. 8d). It is pertinent to note that low percentages of CV are indicators of narrower crystal distribution:
- The PVDF/GP5 membrane exhibits a low coefficient of variation (CV) of 26.7%, suggesting that accelerated and synchronized ion–ion core shrinking and crystal aggregation lead to bigger and much more uniform crystals (Fig. 8b and c).
- A lower loading of graphene (i.e., PVDF/GP05) causes a displacement towards large nucleation but limited aggregation, thus evolving towards a predominantly cubic shape with a coefficient of variation (CV) of 32.2%.
In both cases, the results are of great interest if it is considered that an ideal mixed suspension mixed product removal (MSMPR) crystallizer has a CV of 50% for size-independent growth on an industrial scale.55,56,81
- Very large amounts of graphene confined in the PVDF framework (i.e., PVDF/GP10) result in a value of CV (35.8%) that continues however to be lower than that estimated for the pristine PVDF membrane (48.1%) (Fig. 8d).
Conclusion
Experimental evidence aided by atomistic simulation provides insights about the performance of graphene confined in polymer networks. The formation of better-quality crystals is obtained when functional membranes equip a crystallization device. Nanocomposite membranes enable one to direct the nucleation and growth of NaCl crystals depending upon the loading of the nanofiller. Thus, thermodynamic forces and kinetic factors can be manipulated to direct the process. Despite the different scale, experimental findings together with dynamic simulations data suggest the occurrence of a water ‘attachment–detachment’ mechanism type. The polymer–graphene ratio can be adjusted to stimulate nucleation and growth rate events towards a better quotient of crystals. Definitely, for membranes where assisted water exclusion leads to stimulated nucleation and growth of crystals on a scale of time and space, values of CV down to 26.7% could be obtained. This evidence can be regarded as the accomplishment of a promising target.It is conceivable that graphene dispersed in a hydrophobic continuum can be managed to function as a source of hydration sites isolated in a very low-energy surface so much that water can be adsorbed and desorbed according to the desired nucleation–growth trade-offs.
Conflicts of interest
There are no conflicts of interest to declare.Acknowledgements
We acknowledge financial support by a grant from the Italian Ministry of Foreign Affairs and International Cooperation (2DMEMPUR project) within the framework of the Great Relevance International Project Italy (MAECI)-China (NSFC) 2018–2020 – New materials, with particular reference to two-dimensional systems and graphene.References
- P. H. Gleivk, A look at Twenty-first Century Water Resources Development, Water Int., 2000, 25, 127 CrossRef.
- P. Badiuzzaman, E. McLaughlin and D. McCauley, Substituting freshwater: Can ocean desalination and water recycling capacities substitute for groundwater depletion in California?, J. Environ. Manage., 2017, 203, 123 CrossRef PubMed.
- A. Subramani and J. C. Jacangelo, Emerging desalination technologies for water treatment: A critical review, Water Res., 2015, 75, 164 CrossRef CAS PubMed.
- C. A. Quist-Jensen, F. Macedonio and E. Drioli, Membrane technology for water production in agriculture: Desalination and wastewater reuse, Desalination, 2015, 364, 17 CrossRef CAS.
- C. E. Scruggs and B. M. Thomson, Opportunities and Challenges for Direct Potable Water Reuse in Arid Inland Communities, J. Water Resour. Plan. Manag., 2017, 143, 04017064-1 Search PubMed.
- N. E. R. Zimmermann, B. Vorselaars, J. R. Espinosa, D. Quigley, W. R. Smith, E. Sanz, C. Vega and B. Peters, NaCl nucleation from brine in seeded simulations: Sources of uncertainty in rate estimates, J. Chem. Phys., 2018, 148, 222838-1 Search PubMed.
- C. A. Quist-Jensen, A. Ali, E. Drioli and F. Macedonio, Perspectives on mining from sea and other alternative strategies for minerals and water recovery–The development of novel membrane operations, J. Taiwan Inst. Chem. Eng., 2019, 94, 129 CrossRef CAS.
- F. Macedonio, C. A. Quist-Jensen, O. Al-Harbi, H. Alromaih, S. A. Al-Jlil, F. Al Shabouna and E. Drioli, Thermodynamic modeling of brine and its use in membrane crystallizer, Desalination, 2013, 323, 83 CrossRef CAS.
- E. Jones, M. Qadir, M. T. H. van Vliet, V. Smakhtin and S.-M. Kang, The state of desalination and brine production: A global outlook, Sci. Total Environ., 2019, 657, 1343 CrossRef CAS PubMed.
- E. Drioli, A. Ali and F. Macedonio, Membrane Operations for Process Intensification in Desalination, Appl. Sci., 2017, 7, 100 CrossRef.
- M. L. Perrotta, G. Saielli, G. Casella, F. Macedonio, L. Giorno, E. Drioli and A. Gugliuzza, An ultrathin suspended hydrophobic porous membrane for high-efficiency water desalination, Appl. Mater. Today, 2017, 9, 1 CrossRef.
- W. Chen, S. Chen, T. Liang, Q. Zhang, Z. Fan, H. Yin, K.-W. Huang, X. Zhang, Z. Lai and P. Sheng, High-flux water desalination with interfacial salt sieving effect in nanoporous carbon composite membranes, Nat. Nanotechnol., 2018, 13, 345 CrossRef CAS PubMed.
- D. Lizeth, M. Mendez, C. Castel, C. Lemaitre and E. Favre, Membrane distillation (MD) processes for water desalination applications. Can dense selfstanding membranes compete with microporous hydrophobic materials?, Chem. Eng. Sci., 2018, 188, 84 CrossRef.
- G. Zaragoza, J. A. Andrés-Mañas and A. Ruiz-Aguirre, Commercial scale membrane distillation for solar desalination, NPJ Clean Water, 2018, 20, 2 Search PubMed.
- S. Daneshyar and F. Farhbod, Experimental Study of Evaporation Process; Salt Crystals, Int. J. Chem. Biomol. Sci., 2016, 2, 4 Search PubMed.
- C. A. Quist-Jensen, A. Ali, S. Mondal, F. Macedonio and E. Drioli, A study of membrane distillation and crystallization for lithium recovery from high concentrated aqueous solutions, J. Membr. Sci., 2016, 505, 167 CrossRef CAS.
- E. Chabanon, D. Mangin and C. Charcosset, Membranes and crystallization processes: State of the art and prospects, J. Membr. Sci., 2016, 509, 57 CrossRef CAS.
- E. Drioli, G. Di Profio and E. Curcio, Membrane-Assited Crystallization Technology, Advances in Chemical and Process Engineering, Imperial College Press, London, 2015, vol. 2 Search PubMed.
- F. Macedonio and E. Drioli, Zero Liquid Discharge in Desalination in: Sustainable Membrane Technology for Water and Wastewater Treatment, Book Series: Green Chemistry and Sustainable Technology, ed. A. Figoli and A. Criscuoli, Springer-Verlag, Berlin, Germany, 2017, p. 221 Search PubMed.
- X. Jiang, L. Tuo, D. Lu, B. Hou, W. Chen and G. He, Progress in membrane distillation crystallization: Process models, crystallization control and innovative applications, Front. Chem. Sci. Eng., 2017, 11, 647 CrossRef.
- B. K. Pramanik, K. Thangavadivel, L. Shu and V. Jegatheesan, A critical review of membrane crystallization for the purification of water and recovery of minerals, Rev. Environ. Sci. Bio/Technol., 2016, 15, 411 CrossRef CAS.
- S. Mosadegh-Sedghi, D. Rodrigue, J. Brisson and M. C. Iliuta, Wetting phenomenon in membrane contactors – Causes and prevention, ACS Nano, 2014, 452, 332 CAS.
- A. Gugliuzza, M. C. Aceto, F. Macedonio and E. Drioli, Water droplets as template for next generation self-assembled poly-(etheretherketone) with Cardo membranes, J. Phys. Chem. B, 2008, 112, 10483 CrossRef CAS PubMed.
- V. Speranza, F. Trotta, E. Drioli and A. Gugliuzza, High-Definition Polymeric Membranes: Construction of 3D Lithographed Channel Arrays through Control of Natural Building Blocks Dynamics, ACS Appl. Mater. Interfaces, 2010, 2, 459 CrossRef CAS PubMed.
- A. Gugliuzza, F. Macedonio, A. Politano and E. Drioli, Prospects of 2D Materials-based Membranes in Water Desalination, Chem. Eng. Trans., 2019, 73, 265 Search PubMed.
- A. Gugliuzza, A. Politano and E. Drioli, The advent of graphene and other two-dimensional materials in membrane science and technology, Curr. Opin. Chem. Eng., 2017, 16, 78 CrossRef.
- E. Gontarek, F. Macedonio, F. Militano, L. Giorno, M. Lieder, A. Politano, E. Drioli and A. Gugliuzza, Adsorption-assisted transport of water vapour in super-hydrophobic membranes filled with multilayer graphene platelets, Nanoscale, 2019, 11, 11521 RSC.
- Y. Gogotsi, Moving ions confined between graphene sheets, Nat. Nanotechnol., 2018, 13, 625 CrossRef CAS PubMed.
- J. Muscatello, F. Jaeger, O. K. Matar and E. A. Müller, Optimizing Water Transport through Graphene-Based Membranes: Insights from Nonequilibrium Molecular Dynamics, ACS Appl. Mater. Interfaces, 2016, 819, 12330 CrossRef PubMed.
- Y. Wang, K. Ahuja, S. Sinha, P. R. Desai and S. V. Das, Water–Holey-Graphene Interactions: Route to Highly Enhanced Water-Accessible Graphene Surface Area, ACS Appl. Nano Mater., 2018, 1, 5907 CrossRef CAS.
- Y. Si and E. T. Samulski, Synthesis of Water Soluble Graphene, Nano Lett., 2008, 8, 1679 CrossRef CAS PubMed.
- E. Papadopoulou, C. M. Megaridis, J. H. Walther and P. Koumoutsakos, Ultrafast Propulsion of Water Nanodroplets on Patterned Graphene, ACS Nano, 2019, 13, 5465 CrossRef CAS PubMed.
- S. Homaeigohar and M. Elbahri, Graphene membranes for water desalination, NPG Asia Mater., 2017, 9, e427 CrossRef CAS.
- A. Karkooti, A. Z. Yazdi, P. Chen, M. McGregor, N. Nazemifar and M. Sadrzade, Development of advanced nanocomposite membranes using graphene nanoribbons and nanosheets for water treatment, J. Membr. Sci., 2018, 560, 97 CrossRef CAS.
- Q. Xie, M. A. Alibakhshi, S. Jiao, Z. Xu, M. Hempel, J. Kong, H. G. Park and C. Duan, Fast water transport in graphene nanofluidic channels, Nat. Nanotechnol., 2018, 13, 238 CrossRef CAS PubMed.
- Y. C. Woo, L. D. Tijing, W. G. Shim, J. S. Choi, S. H. Kim, T. He, E. Drioli and H. K. Shon, Graphene/PVDF flat-sheet membrane for the treatment of RO brine from coal seam gas produced water by air gap membrane distillation, J. Membr. Sci., 2016, 520, 99 CrossRef CAS.
- L. Chen, G. Shi, J. Shen, B. Peng, B. Zhang, Y. Wang, F. Bian, J. Wang, D. Li, Z. Qian, G. Xu, G. Liu, J. Zeng, L. Zhang, Y. Yang, G. Zhou, M. Wu, W. Jin, J. Li and H. Fang, Ion sieving in graphene oxide membranes via cationic control of interlayer spacing, Nature, 2017, 550, 380 CrossRef CAS PubMed.
- A. Boretti, S. Al-Zubaidy, M. Vaclavikova, M. Al-Abri, S. Castelletto and S. Mikhalovsky, Outlook for graphene-based desalination membranes, NPJ Clean Water, 2018, 5, 1 Search PubMed.
- K. A. Mahmoud, B. Mansoor, A. Mansour and M. Khraisheh, Functional graphene nanosheets: The next generation membranes for water desalination, Desalination, 2015, 356, 208 CrossRef CAS.
- M. X. Wang, Z. H. Huang, W. Lv, Q. H. Yang, F. Kang and K. Liang, Water vapor adsorption on low-temperature exfoliated graphene nanosheets, J. Phys. Chem. Solids, 2012, 73, 1440 CrossRef CAS.
- Z. Zhen, Z. Li, X. Zhao, Y. Zhong, L. Zhang, Q. Chen, T. Yang and H. Zhu, Formation of Uniform Water Microdroplets on Wrinkled Graphene for Ultrafast Humidity Sensing, Small, 2018, 14, 1703848 CrossRef PubMed.
- S. Toxvaerd, Molecular dynamics simulation of heterogeneous nucleation at a structureless solid surface, Molecular dynamics simulation of heterogeneous nucleation at a structureless solid surface, J. Chem. Phys., 2002, 117, 10303 CrossRef CAS.
- R. J. Good and C. J. van Oss, Modern Approaches to Wettability, ed. M. E. Schrader and G. L. Loeb, Plenum Press, New York, 1992 Search PubMed.
- L. J. Sonter, S. H. Ali and J. E. M. Watson, Mining and biodiversity: key issues and research needs in conservation science, Proc. Biol. Sci., 2018, 285, 20181926-1 Search PubMed.
- A. Gugliuzza and E. Drioli, New performance of hydrophobic fluorinated porous membranes exhibiting particulate-like morphology, Desalination, 2009, 240, 14 CrossRef CAS.
- A. Gugliuzza and E. Drioli, PVDF and HYFLON AD membranes: Ideal interfaces for contactor applications, J. Membr. Sci., 2007, 300, 51 CrossRef CAS.
- P. U. G. P. S. BIOVIA, (ex Material Studio 7.0) package, Classical simulation theory section, Accelrys Software Inc, 2013 Search PubMed.
- H. Sun, COMPASS, An ab Initio Force-Field Optimized for Condensed-Phase Applications Overview with Details on Alkane and Benzene Compounds, J. Phys. Chem. B, 1998, 102, 7338 CrossRef CAS.
- P. J. Flory and M. Volkenstein, Statistical mechanics of chain molecules, J. Polym. Sci., Part A-2, 1970, 8, 174 CrossRef.
- E. Tocci and P. Pullumbi, Molecular simulation of realistic membrane models of alkylated PEEK membranes, Mol. Simul., 2006, 32, 145 CrossRef CAS.
- L. De Lorenzo, E. Tocci, A. Gugliuzza and E. Drioli, Assembly of nanocomposite PEBAX membranes: A complementary study of affinity and clusterization phenomena, J. Membr. Sci., 2012, 421–422, 75 CrossRef CAS.
- C. Rizzuto, A. Caravella, A. Brunetti, C. H. Park, Y. M. Lee, E. Drioli, G. Barbieri and E. Tocci, Sorption and Diffusion of CO2/N2 in gas mixture in thermally-rearranged polymeric membranes: A molecular investigation, J. Membr. Sci., 2017, 528, 135 CrossRef CAS.
- M. J. Abrahama, T. Murtola, R. Schulz, S. Pàll, J. C. Smith, B. Hessa and E. Lindahl, GROMACS: High performance molecular simulations through multi-level parallelism from laptops to supercomputers, SoftwareX, 2015, 1-2, 19 CrossRef.
- H. Stephen, T. Stephen and H. L. Silcock, in Solubilities of inorganic and organic compounds, ed. H. Stephen and T. S. Macmillan, A Pergamon Press, NY, USA, 1963 Search PubMed.
- F. Macedonio, E. Curcio and E. Drioli, Integrated membrane systems for seawater desalination: energetic and exergetic analysis, economic evaluation,experimental study, Desalination, 2007, 203, 260 CrossRef CAS.
- Perry's Chemical Engineers' Handbook, ed. R. H. Perry and D. W. Green, 7th edn, Section 18.38, 1997 Search PubMed.
- H. J. C. Berendsen, D. van der Spoel and R. van Drunen, Molecular dynamics with coupling to an external bath, Comput. Phys. Commun., 1995, 91, 43 CrossRef CAS.
- B. Hess, C. Kutzner, D. van der Spoel and E. Lindahl, GROMACS 4: Algorithms for Highly Efficient, Load-Balanced, and Scalable Molecular Simulation, J. Chem. Theory Comput., 2008, 4, 435 CrossRef CAS PubMed.
- O. G. Byutner and G. D. Smith, Quantum chemistry based force field for simulations of poly(vinylidene fluoride), Macromolecules, 2000, 33, 4264 CrossRef CAS.
- H. J. C. Berendsen, J. P. M. Postma, W. F. Gunsteren, A. DiNola and J. R. Haak, Molecular dynamics with coupling to an external bath, J. Chem. Phys., 1984, 81, 3684 CrossRef CAS.
- W. Humphrey, A. Dalke and K. Schulten, VMD: Visual molecular dynamics, J. Mol. Graphics, 1996, 14, 33 CrossRef CAS PubMed.
- A. A. Balandin, S. Ghosh, W. Bao, I. Calizo, D. Teweldebrhan, F. Miao and C. N. Lau, Superior Thermal Conductivity of Single-Layer Graphene, Nano Lett., 2008, 8, 902 CrossRef CAS PubMed.
- P. U. G. P. S. BIOVIA, (ex Material Studio 7.0) package, Classical simulation theory section, Accelrys Software Inc., San Diego, 2013 Search PubMed.
- A. Cacciuto, S. Auer and D. Frenkel, Onset of heterogeneous crystal nucleation in colloidal suspensions, Nature, 2004, 428, 404 CrossRef CAS PubMed.
- Y. Yang and S. Meng, Atomistic nature of NaCl nucleation at the solid-liquid interface, J. Chem. Phys., 2007, 126, 044708 CrossRef PubMed.
- S. Yamanaka, A. Shimosaka, Y. Shirakawa and J. Hidaka, Molecular dynamics simulations of the formation for NaCl cluster at the interface between the supersaturated solution and the substrate, J. Nanopart. Res., 2010, 12, 831 CrossRef CAS.
- H. Dashtian, H. Wang and M. Sahimi, Nucleation of Salt Crystals in Clay Minerals: Molecular Dynamics Simulation, J. Phys. Chem. Lett., 2017, 8, 3166 CrossRef CAS PubMed.
- D. Chakraborty and G. N. Patey, How Crystals Nucleate and Grow in Aqueous NaCl Solution, J. Phys. Chem. Lett., 2013, 4, 573 CrossRef CAS PubMed.
- P. G. Vekilov, The two-step mechanism of nucleation of crystals in solution, Nanoscale, 2010, 2, 2346 RSC.
- T. Yamazaki, Y. Kimura, P. G. Vekilov, E. Furukawa, M. Shirai, H. Matsumoto, A. E. S. Van Driessche and K. Tsukamoto, Two types of amorphous protein particles facilitate crystal nucleation, Proc. Natl. Acad. Sci. U. S. A., 2017, 114, 2154 CrossRef CAS PubMed.
- A. E. S. Van Driessche, N. Van Gerven, P. H. H. Bomans, R. R. M. Joosten, H. Friedrich, D. Gil-Carton, N. A. J. M. Sommerdijk and M. Sleutel, Molecular nucleation mechanisms and control strategies for crystal polymorph selection, Nature, 2018, 556, 89 CrossRef CAS PubMed.
- R. G. Alberstein and F. A. Tezcan, Observations of the birth of crystals, Nature, 2018, 556, 41 CrossRef CAS PubMed.
- J.-H. Tsai, F. Macedonio, M. L. Perrotta, A. Gugliuzza, L. Giorno, K.-L. Tung, E. Drioli and E. Tocci, Membrane-Assisted Crystallization: A Molecular View of NaCl Nucleation and Growth, Appl. Sci., 2018, 8, 2145 CrossRef CAS.
- A. Sauter, F. Roosen-Runge, F. Zhang, G. Lotze, A. Feoktystov, R. M. J. Jacobs and F. Schreiber, On the question of two-step nucleation in protein crystallization, Faraday Discuss., 2015, 179, 41 RSC.
- P. R. Wolde, M. J. Ruiz-Montero and D. Frenkel, Numerical evidence for BCC ordering at the surface of a critical FCC nucleus, Phys. Rev. Lett., 1995, 75, 2714 CrossRef PubMed.
- I. G. Nahtigal, A. Y. Zasetsky and I. M. Svishchev, Nucleation of NaCl Nanoparticles in Supercritical Water: Molecular Dynamics Simulations, J. Phys. Chem. B, 2008, 112, 7537 CrossRef CAS PubMed.
- A. Gugliuzza, M. C. Aceto and E. Drioli, Interactive functional poly (vinylidene fluoride) membranes with modulated lysozyme affinity: a promising class of new interfaces for contactor crystallizers, Polym. Int., 2009, 58, 1452 CrossRef CAS.
- S. Singla, E. Anim-Danso, A. E. Islam, Y. Ngo, S. S. Kim, R. R. Naik and A. Dhinojwala, Insight on Structure of Water and Ice Next to Graphene Using Surface-Sensitive Spectroscopy, ACS Nano, 2017, 11, 4899 CrossRef CAS PubMed.
- Y. Han, Z. Zhang and L. Qu, Power generation from graphene-water interactions, FlatChem, 2019, 14, 100090-1 CrossRef.
- A. Akaishi, T. Yonemaru and T. Nakamura, Formation of Water Layers on Graphene, ACS Omega, 2017, 2, 2184 CrossRef CAS PubMed.
- S. J. Jancic and P. A. M. Grootscholten, Industrial Crystallization, Delft University Press, Delft, Holland, 1984 Search PubMed.
Footnote |
| † Electronic supplementary information (ESI) available. See DOI: 10.1039/c9ew01124b |
| This journal is © The Royal Society of Chemistry 2020 |