 Open Access Article
Creative Commons Attribution 3.0 Unported Licence
Molecular level characterisation of ion-exchange water treatment coupled to ceramic membrane filtration†
Alan J. R.
Smith
a,
Graeme
Moore
b,
Andrea J. C.
Semiao
c and
Dušan
Uhrín
 *a
*a
aEaStCHEM School of Chemistry, University of Edinburgh, Joseph Black Building, David Brewster Rd, Edinburgh EH9 3FJ, UK. E-mail: dusan.uhrin@ed.ac.uk; Tel: +44 (0)131 650 4742
bScottish Water, Castle House, 6 Castle Drive, Dunfermline KY11 8GG, UK
cSchool of Engineering, Institute for Infrastructure and Environment, University of Edinburgh, Edinburgh EH8 9YL, UK
First published on 1st April 2020
Abstract
FT-ICR MS, NMR and ATR-FTIR were used to gain insight into the dissolved organic matter (DOM) removal process throughout a pilot water treatment system. The pilot plant under study utilises suspended ion exchange (SIX) followed by in-line coagulation with (ILCA) polyaluminium chloride and ceramic membrane filtration (CMF). MS results indicate that the SIX treatment is removing DOM irrespective of the compound type (>90% formulae similarity between SIX treated and raw water). However, the ILCA–CMF treatment substantially altered the chemical composition of the DOM by removing a high proportion of the aromatic and phenolic compounds. This was also confirmed by NMR and ATR-FTIR. An adjoining WTW plant which uses the same coagulant as the pilot plant, flocculation mixers for inline flocculation and filtration via MEMCOR® hydrophilic membranes did not show any selectivity when processing the same inlet water. Removal of aromatics/polyphenols in the pilot plant can therefore be attributed to the CMF step. Removal of aromatic/phenolic compounds is important, as these are known to react more readily with chlorine, potentially producing trihalomethanes – substances regulated in potable water.
Water impactThe effects of suspended ion exchange, in-line coagulation and ceramic membrane filtration (CMF) on dissolved organic matter removal during water treatment were investigated on a molecular level using FT-ICR MS, NMR and ATR-FTIR. Unlike flocculation followed by filtration, CMF resulted in a dramatic decrease of aromatic, highly oxygenated compounds prone to form DBPs. CMF thus has a potential to reduce formation of DBPs. |
1. Introduction
Dissolved organic matter (DOM) is a source of numerous issues in water treatment. DOM reacts with the disinfectants producing harmful, potentially carcinogenic disinfection by-products (DBPs). It acts as an energy source for bacteria and other microorganisms causing regrowth in the distribution system. This increases energy required for water flow as it adds to the resistance to water transport; growth of bacteria also increases turbidity and hence reduces water quality. From a consumer point of view, DOM can cause colouring of water, unpleasant odour and taste.1–3Climate change and anthropogenic activities over the last few decades have caused DOM levels to rise across the northern hemisphere, placing high demands on its removal. Studies have linked increasing organic carbon levels in water to increased temperature, which in turn has been linked to an increase in microbial activity, enhancing the breakdown of organic matter (OM) into more soluble compounds.4–6 It was suggested that higher sulphur deposition of the past had led to increased soil and water acidity, which hampered microbial activity and therefore slowed down the release of OM into waters.7,8 Since sulphur emissions were regulated, aquatic and terrestrial systems began to recover and microbial activity has been returning to normal levels, increasing DOM concentration. This impacts on the performance of the treatment processes and some treatment plants are now operating at or beyond their original design envelope for DOM.
To address the increasing DOM levels, water treatment companies are introducing more efficient methods for DOM removal, upgrading existing technology, e.g. coupling coagulation with hollow-fibre nanofiltration or advanced oxidation processes for alteration and removal of DOM.9–11 Scottish Water are exploring alternative and complimentary treatment technologies of DOM removal, including ceramic filtration and ion exchange processes. The interests in ceramic membranes goes beyond DOM removal and DBP reduction, as ceramic membranes act as bacterial barriers. Their long operational lives, potentially beyond 20 years, are attractive and their performance, especially when part of a coagulated treatment process is promising. Another method for DOM removal, suspended ion exchange, was investigated in combination with coagulation using model organic compounds. However, due to the complexity and variability of NOM in real source waters, the removal mechanism is not well understood.
To address these issues, Scottish Water based on preliminary lab experiments, designed a pilot plant that combines suspended ion exchange (SIX®) with in-line coagulation (ILCA®) and ceramic membrane filtration (CMF®).12 These processes have been studied, both individually and in combination, with liquid chromatography-organic carbon detection (LC-OCD) results suggesting that the SIX and ILCA–CMF are removing different size fractions of NOM,12 however, this technique cannot provide information about types of molecules being removed.
Fourier transform ion cyclotron resonance mass spectrometry (FT-ICR MS), nuclear magnetic resonance (NMR) spectroscopy and Fourier transform attenuated total reflection infrared spectroscopy (ATR-FTIR) have been increasingly used to provide molecular insight into the water treatment processes.13–17 Here they are used to determine which molecular species are most affected, removed or altered by SIX and ILCA–CMF. For comparison, an adjoining water treatment works (WTW) using coagulant flocculation followed by filtration, is also included in this study.
2. Materials and methods
2.1. Pilot plant setup
Schematic setup of the pilot plant is shown in Fig. S1 and S2.† The pilot plant, located in the north east of Scotland, combines three processes, all integrated into a shipping container setup capable of producing 150 m3 per day. The three purification steps were suspended ion exchange (SIX®), in-line coagulation (ILCA®) and ceramic membrane filtration (CMF, CeraMac®) produced by PWN Technologies, Netherlands. The SIX resin used was an acrylic quaternary amine, anionic resin in chloride form (Lewatit S5128, Germany). At the point of sampling the resin had been in circulation for 5–7 months. Resin is removed from water flow via a lamella separator and regenerated using approximately 30 g L−1 NaCl solution every 30 minutes. ILCA was performed using polyaluminium chloride (Water Treatment Solutions, UK). Water was adjusted to pH 6.4 using NaOH and/or HCl and mixed in a static mixer and flocculated for approximately 4 minutes with optimal coagulant dose and pH established by jar testing on site and through zeta potential analysis using a Zetasizer. CMF is a vertically mounted 25 m2 element with a nominal pore size of 0.1 μm, operating via dead end filtration backflush every 10 minutes in order to prevent fouling. The adjoining WTW (schematic shown in Fig. S3†) uses polyaluminium chloride as a coagulant, flocculation mixers for inline flocculation and filtration using Memcor hydrophilic membranes (polymeric ultrafiltration membranes) with a pore size of 0.045 μm.2.2. Sample collection and processing
Water samples were collected in acid washed amber glass bottles. Samples from the pilot plant were taken on the 12th of June 2017 and on the 17th of July 2017 of the raw water (raw-June and raw-July, 2.5 L), post SIX (SIX-June and SIX-July, 5 L) and post ILCA/CMF (ILCA/CMF-June and ILCA/CMF-July,10 L) steps. Samples from the adjoining WTW samples were taken on the 17th of July 2017 of the raw water (WTW-raw, 2.5 L) and post coagulation/filtration (WTW-UF, 10 L).Processing of the collected water samples outlined below was dictated by the requirements of the FT-ICR MS and NMR. Samples needed to be concentrated, desalted and freeze-dried so that sufficient amount of DOM was obtained and exact masses of organic material determined to allow for a comparison of NMR spectra of the reconstituted samples. Desalting is also important for FT-ICR MS, as the complexity of mass spectra increases in the presence of salts through the creation of adducts. The filtration and concentration methods used were adopted as per IHSS guidelines.18,19 Samples were filtered through a Whatman ME25 mixed cellulose ester filter (0.45 μm) on the day of collection. Solutions were then concentrated using a custom built cross-flow reverse osmosis (RO) rig utilising BW30 membranes (DOW Filmtec), a cross flow rate of approximately 1 litre per min and pressure between 13–15 bar. The solution was concentrated ∼20×, portions were taken and reconstituted using ultrapure water (Milli-Q, 18.2 Ω) for total organic carbon (TOC) analyses. This allowed sample concentration with minimal losses of DOM, as elaborated on in section 3.1. In order to remove monovalent and divalent salts and metals, the solutions were subjected to electrodialysis. A two chamber electrodialysis cell (PCCell) containing 10 cell pairs with a membrane area of 0.25 m2 was used, each pair consisting of a cation and anion exchange membrane. The process was stopped when the initial conductivity (between 250–350 μS) dropped to less than 50 μS. Samples were then freeze dried and stored in glass vials for further analyses. TOC values (Shimadzu, TOC-V CPH) reported are the average of five injections.
2.3. Advantages and limitations of the chosen analytical methods
MS techniques are very sensitive, potentially requiring only nanograms of compounds to produce a response. Thousands of peaks can be observed in FT-ICR MS spectra, although with many isomers contributing to one peak. Because of that, but mainly due to differing efficiency of ionisation, MS is not a quantitative technique. However, resolution of FT-ICR MS (∼1![[thin space (1/6-em)]](https://www.rsc.org/images/entities/char_2009.gif) 000
000![[thin space (1/6-em)]](https://www.rsc.org/images/entities/char_2009.gif) 000) is substantial, allowing unambiguous identification of thousands of molecular formulae of small/medium size organic molecules, typically in the molecular range of 200–600 m/z. Large molecules cannot be observed at the same time. NMR spectroscopy on the other hand lacks the resolution and sensitivity (tens of micrograms of a single compound are required as a minimum), nevertheless, the dispersion of 1H chemical shifts and the quantitative nature of NMR means that it can be used to estimate the compound class distribution at various stages of water treatment. At the same time, one should bear in mind that 1H NMR spectra record signals of individual protons or groups of protons making up the compounds i.e. a compound is not represented by a single peak. Compounds containing many hydrogen atoms will therefore contribute more heavily to proton integrals, while the low proton density compounds, such as substituted aromatics, will be underrepresented. It should also be emphasised that 1H NMR spectra contain signal from DOM molecules regardless of the size, typically with Mw from tens to tens of thousands g mol−1, as long as they are dissolved and not part of aggregates. NMR and MS are thus highly complementary, albeit expensive techniques. The third selected method, ATR-IR, a low-resolution technique, is much more economical. Its potential for following changes in DOM composition during the water treatment was therefore explored.
000) is substantial, allowing unambiguous identification of thousands of molecular formulae of small/medium size organic molecules, typically in the molecular range of 200–600 m/z. Large molecules cannot be observed at the same time. NMR spectroscopy on the other hand lacks the resolution and sensitivity (tens of micrograms of a single compound are required as a minimum), nevertheless, the dispersion of 1H chemical shifts and the quantitative nature of NMR means that it can be used to estimate the compound class distribution at various stages of water treatment. At the same time, one should bear in mind that 1H NMR spectra record signals of individual protons or groups of protons making up the compounds i.e. a compound is not represented by a single peak. Compounds containing many hydrogen atoms will therefore contribute more heavily to proton integrals, while the low proton density compounds, such as substituted aromatics, will be underrepresented. It should also be emphasised that 1H NMR spectra contain signal from DOM molecules regardless of the size, typically with Mw from tens to tens of thousands g mol−1, as long as they are dissolved and not part of aggregates. NMR and MS are thus highly complementary, albeit expensive techniques. The third selected method, ATR-IR, a low-resolution technique, is much more economical. Its potential for following changes in DOM composition during the water treatment was therefore explored.
2.4. Collection and processing of spectra
FT-ICR MS spectra were acquired on a Bruker 12T SolariX FT-ICR mass spectrometer with an infinity cell. Samples were dissolved in 50![[thin space (1/6-em)]](https://www.rsc.org/images/entities/char_2009.gif) :
:![[thin space (1/6-em)]](https://www.rsc.org/images/entities/char_2009.gif) 50 MeOH/H2O and sprayed at 200 μL h−1 using a syringe pump. Negative mode ESI, (−) ESI, was used as the ionisation technique. Ion accumulation time and the time of flight were set to 0.25 sec and 0.6 ms, respectively. Spectra were acquired at 4 MW and 600 transients were accumulated. Solvent and system blanks were performed, and any present masses were removed from peak lists prior to analysis. Spectra were externally calibrated using an ESI tuning mix (Agilent). The accuracy was enhanced by using internal calibration based on masses of compounds known to be present in DOM samples (Table S1†). Peaks between 200–600 m/z and those with a signal-to-noise ratio, SNR > 5 were analysed. Molecular formulae were assigned using python scripts produced by W. Kew,20 considering elemental compositions of 12C0–661H0–126 and 16O0–27, using an error threshold of ±0.5 ppm. A modified aromaticity index was calculated using the following formula, AImod = (1 + C–0.5O–0.5H)/(C–0.5O). The modified aromaticity index is more suitable for the characterisation of DOM samples as it ensures that only half of the oxygen atoms present within abundant carboxyl groups contribute to the definition of aromaticity.21
50 MeOH/H2O and sprayed at 200 μL h−1 using a syringe pump. Negative mode ESI, (−) ESI, was used as the ionisation technique. Ion accumulation time and the time of flight were set to 0.25 sec and 0.6 ms, respectively. Spectra were acquired at 4 MW and 600 transients were accumulated. Solvent and system blanks were performed, and any present masses were removed from peak lists prior to analysis. Spectra were externally calibrated using an ESI tuning mix (Agilent). The accuracy was enhanced by using internal calibration based on masses of compounds known to be present in DOM samples (Table S1†). Peaks between 200–600 m/z and those with a signal-to-noise ratio, SNR > 5 were analysed. Molecular formulae were assigned using python scripts produced by W. Kew,20 considering elemental compositions of 12C0–661H0–126 and 16O0–27, using an error threshold of ±0.5 ppm. A modified aromaticity index was calculated using the following formula, AImod = (1 + C–0.5O–0.5H)/(C–0.5O). The modified aromaticity index is more suitable for the characterisation of DOM samples as it ensures that only half of the oxygen atoms present within abundant carboxyl groups contribute to the definition of aromaticity.21
NMR spectra were acquired on an Avance III HD 600 MHz Bruker spectrometer equipped with a 5 mm TCI cryoprobe. 1 mg of sample was dissolved in 600 μl of D2O. Spectra were collected using the NOESY based water suppression technique with relaxation and acquisition times set to 8.3 and 1.3 seconds respectively. 128 scans were acquired per spectrum. Spectra were zero filled to 128k points and exponential line broadening of 5 Hz was applied prior to Fourier transformation.
ATR-FTIR spectra were acquired (Perkin Elmer Spectrum Two) between 450 and 4000 cm−1 with a resolution of 0.5 cm−1. Samples were run in triplicate; a standard normal variate correction was applied to each individual spectrum. Data was input into SIMCA version 14.1 (Umetrics) and principal component analysis (PCA) was performed using Pareto scaling for wavenumbers 800–2000 cm−1 due to either sparsity of signals or instrumental interference out with this region. A broad band centred at ∼3375 cm−1 (H-bonded OH stretch), which could be affected by a varying amount of moisture in the samples was also excluded. Relative signal intensities were calculated individually for each spectrum as Ti/∑Ti, where Ti is the transmittance at individual wave number.
The graphs presented throughout this paper were plotted in R version 3.5.2, using the ggplot2 package (version 3.2.1).
3. Results and discussion
3.1. TOC analysis
TOC measurements were taken at the time and point of sampling and are presented in Table 1 below. Despite much larger TOC levels in June, the combined SIX and ILCA–CMF treatment has lowered the TOC to a similar absolute (<1 mg L−1) and relative level (8 and 14% of the raw water values) in both months. The ILCA–CMF was however approximately twice as efficient in DOM removal as the SIX treatment.| Sample | TOC (mg C per L) | |
|---|---|---|
| June | July | |
| a Standard deviations are based on five injections. | ||
| Raw | 8.6 ± 0.23 | 3.5 ± 0.22 |
| SIX | 5.4 ± 0.26 | 1.8 ± 0.07 |
| ILCA–CMF | 0.7 ± 0.18 | 0.5 ± 0.08 |
| WTW-raw | — | 3.7 ± 0.11 |
| WTW-UF | — | 0.9 ± 0.16 |
The DOM retention by reverse osmosis was assessed by measuring the TOC after the RO concentration step by diluting a portion of the sample to the appropriate original volume. The yields found were 92 ± 3%. This method of concentration thus performed better than some other methods, e.g. SPE;22 RO generally achieves much higher level of organic matter retention.23
3.2. FT-ICR MS analysis
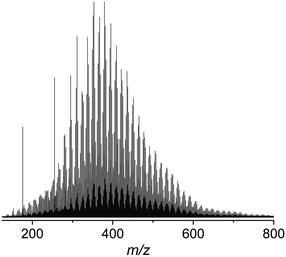
The sample set, prepared as described in the Materials and methods, was investigated using negative mode electrospray ionisation, (−) ESI. Fig. 1 shows a representative (−) ESI FTI-ICR mass spectrum of the raw water between m/z 150 and 800, consisting of a distribution of peaks at every odd m/z value assigned to monoisotopic masses, and a corresponding lower intensity distribution at even m/z values belonging to isotopic masses.Sufficient peak intensities were obtained for masses between m/z 200 and 600. This region was analysed in terms of molecular formulae (Table 2). Only CHO compounds were considered, as nitrogen species are typically not represented in (−) ESI spectra.24 The average assignment rate of 81.5 (±5) % was achieved.
| Sample | Total peaks picked | Monoisotopic | Isotopic | Unassigned | Assigned (%) | |||||
|---|---|---|---|---|---|---|---|---|---|---|
| June | July | June | July | June | July | June | July | June | July | |
| Raw | 4956 | 4845 | 2518 | 2427 | 1364 | 1301 | 1074 | 1117 | 78 | 77 |
| SIX | 4217 | 4440 | 2568 | 2543 | 1104 | 1072 | 545 | 825 | 87 | 81 |
| ILCA–CMF | 3482 | 2885 | 1981 | 1656 | 920 | 631 | 581 | 598 | 83 | 79 |
| WTW-raw | — | 4083 | — | 2393 | — | 1091 | — | 599 | — | 85 |
| WTW-UF | — | 4090 | — | 2266 | — | 1079 | — | 745 | — | 82 |
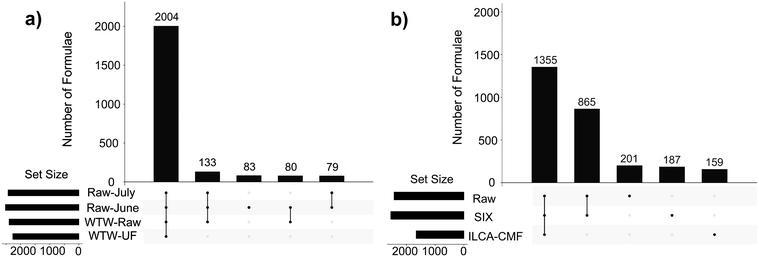
Differences/similarities between samples were investigated by examining the intersections of assigned molecular formulae using UpSet plots.25 These plots show in a graphical way the number of formulae that are common to different subsets of samples within the interrogated sample set. Here, the UpSet plots were initially used to compare the raw and final WTW samples (Fig. 2a). Their inspection indicates that a vast majority of assigned formulae (2004) is identical between the four samples compared and therefore shows that (i) the raw-July and raw-June samples are of a very similar composition of ionisable compounds despite a dramatic difference in TOC values (Table 1); (ii) the inlet water into the pilot plant (raw-June and raw-July) and the July water works water (WTW-raw) is very similar, and (iii) the WTW treatment did not change the DOM profile, as can be seen by 2004 identical molecular formulae detected by FT-ICR MS in the WTW-raw and WTF-UF samples. A perhaps surprising finding, as coagulation has been shown in previous studies to result in the targeted removal of high O/C containing species.26,27
On the other hand, the UpSet plot for the pilot plant samples (Fig. 2b) showed selectivity in the removal of compounds. They revealed a large similarity between the July-Raw and July-SIX samples (1355 + 865 compounds, i.e. 93.2%). Practically the same number was obtained for the equivalent June samples (91.5%, Fig. S4†) suggesting that the SIX treatment is indiscriminately removing DOM (Table 1) or is targeting a range of masses much larger than observed by the FT-ICR-MS. At the same time the final ILCA–CMF treated samples were substantially different with 865 compounds (or 39.0%) common to the raw and SIX treated water missing.
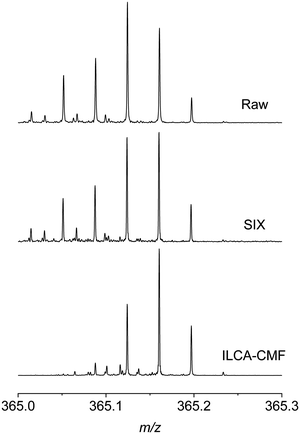
To investigate these differences on the level of MS spectra, individual m/z regions of several mass spectra were inspected. Fig. 3 shows, as an example, a comparison of m/z 365 region of three spectra obtained from different stages of the pilot plant water treatment, including raw water, SIX treated and ILCA–CMF treated July samples.
It can be seen that the signals on the left-hand side of the displayed m/z range are missing or have a substantially reduced intensity, often below the specified SNR of 5 used for peak picking. A similar profile was observed across all m/z values. This comparison and the UpSet plots in Fig. 2b highlight the significant differences between the organic matter profile of the input and output waters in the pilot plant. It also indicates that the SIX treatment did not alter the chemical composition of the species observed, while the ILCA–CMF treatment did.
To analyse this difference in term of compound classes, van Krevelen diagrams were produced. These diagrams show individual molecular formulae as dots with coordinates of hydrogen/carbon (H/C) vs. oxygen/carbon (O/C). Different regions of van Krevelen diagrams are occupied by different compound classes, e.g. carbohydrate, lipids, aliphatic or aromatic compounds.28
Although not unambiguous, these diagrams can be used to visualise the compound class distribution in DOM samples. Fig. 4 shows a comparison of van Krevelen diagrams focusing on the SIX and ILCA–CMF treated samples. The middle plot (Fig. 4b) shows the molecular formulae that were removed by the ILCA–CMF treatment. As can be seen, the majority of these compounds have H/C ratios between 0.5 and 1. This is typical for highly aromatic species. A portion of the removed compounds also have high oxygen content, potentially indicating that these are polyphenolic carboxylic acids. It is known that such compounds tend to produce higher levels of disinfection by-products,29 hence their removal by ILCA–CMF is expected to reduce DBP formation after disinfection.
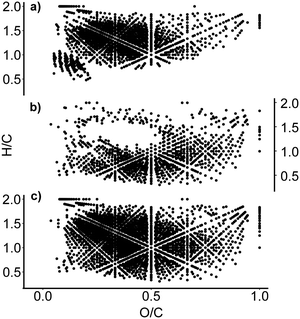 | ||
| Fig. 4 Van Krevelen diagrams of (a) the July pilot plant sample after the ILCA–CMF treatment; (b) formulae that are no longer present after ILCA–CMF treatment and (c) the SIX-July sample. An equivalent plot for June sample is in Fig. S5.† | ||
To investigate the distribution of compound classes further, assigned molecular formulae were characterised using a modified aromaticity index (AImod),21 a classification that categorises compounds as non-aromatic, aromatic and condensed aromatic (see Materials and methods). Here the formulae with an AImod value ≤ 0.5 are designated as non-aromatic species, those with a value between 0.5 and 0.67 are deemed aromatic, and those which are ≥0.67 are categorised as condensed aromatics. Fig. 5 shows the relative abundance of individual compound types at different treatment stages normalised to 100% individually for each July sample. This metric shows practically no change between the raw and SIX treated pilot plant water, while the ILCA–CMF treated water shows a significant drop in the aromatic compounds and almost complete depletion of condensed aromatics, further expanding on the classification presented in van Krevelen plots in Fig. 4. In contrast, the July WTW-UF samples show slight reduction in the aromatic fraction; there is however a significant reduction in the condensed aromatic species (47% less than in July WTW-raw samples).
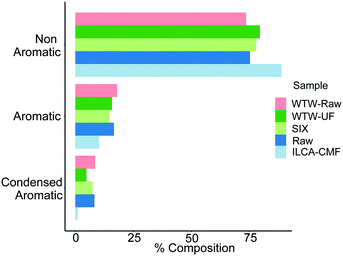 | ||
| Fig. 5 Distribution of compounds based on the modified aromaticity index, AImod, in the July pilot plant and WTW samples. Equivalent plot for June samples is shown in Fig. S6.† Bar order is consistent with legend order. | ||
The van Krevelen plot in Fig. 4 highlighted that a large proportion of oxygen containing compounds have been removed by the ILCA–CMF treatment. To investigate their distribution in terms of the number of oxygen atoms they contain, oxygen class plots were produced that visualise the oxygen distribution in the compounds of the pilot plant samples. As can be seen in Fig. 6, the proportion of assignments above O6 started declining for the ILCA–CMF samples, while those in the raw and SIX treated water were still growing. This trend further accelerated at O11, and depletion of higher oxygen species became more and more severe. For example, the O15 species represent almost 4 percent of the raw sample assignments but only 0.2 percent for the ILCA–CMF treated samples. The higher oxygen class compounds removed are generally larger, mostly aromatic molecules (data not shown).
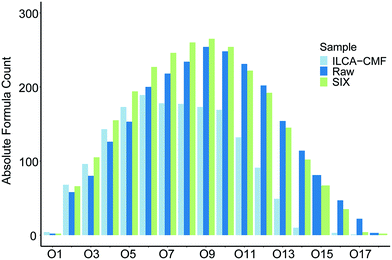 | ||
| Fig. 6 Oxygen class plot of the July pilot plant samples. Equivalent plot for June samples is shown in Fig. S7.† Bar order is consistent with legend order. | ||
In summary, analysis of FT-ICR MS spectra of the pilot plant and adjacent WTWs showed that while the ion exchange significantly reduced the TOC content, it was non-selective in terms of the species removal of small organic molecules and less efficient in overall TOC removal than ILCA–CMF (see Table 1). On the other hand, the ILCA–CMF treatment selectively removed aromatic/condensed aromatics with high oxygen numbers.
3.3. NMR analysis
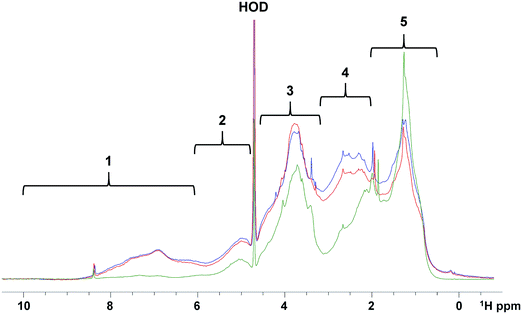
In order to determine the relative abundance of different compound classes in samples (1 mg each) of the raw, SIX and ILCA–CMF treated water, their 1D 1H NMR spectra were acquired. These do not report on the overall efficiency of the two methods of DOM removal, and should be interpreted through a comparison of corresponding spectral regions. A visual inspection of spectra showed that the ILCA–CMF spectrum is characterised by increased intensity in the 1–2 ppm region, decreased intensity in the 2–3 ppm range and almost complete disappearance of signals in the aromatic part of the spectrum between 6 and 9 ppm. Spectra of the raw and SIX samples are very similar, although a slight drop in the carbohydrate region (3.5–4.5 ppm) after the SIX treatment is evident. To obtain a more quantitative comparison, a previously described classification of 1H spectra30 (Fig. 7) was used to produce integrals of five spectral regions.These results are summarised in Fig. 8. It can be seen that the SIX treatment did not affect the ratios of individual proton types substantially. In the ILCA–CMF sample, the relative amount of aliphatic compounds has increased, while the amount of carbohydrates has increased. At the same time, aromatic compounds have been significantly depleted with the aromatic signals representing 9% and 1% of the total signal intensity in the raw and the ILCA–CMF treated water, respectively. The 1H NMR spectra of WTW samples also corroborate the result from the mass spectrometry. Here a reduction in aromatic signal intensities from 9 to 5%, was observed, i.e. much less than seen for the ILCA–CMF treated water in the pilot plant.
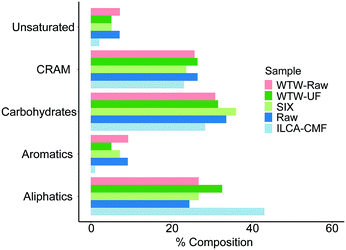 | ||
| Fig. 8 NMR integration results for July pilot plant samples and WTW samples. Equivalent plot for the pilot plant June samples is show in Fig. S8.† Bar order is consistent with legend order. | ||
It is interesting to note that the NMR results follow the compound distribution determined by MS, albeit at a much higher concentration range. This indicates a genuine significant reduction in the aromatic molecules, as no ionisation is required for them to appear in NMR spectra.
3.4. ATR-FTIR
Having established by MS and NMR that the majority of compounds which were removed by ILCA–CMF treatment were aromatic, we decided to test if ATR-FTIR would corroborate this result. ATR-FTIR is a particularly accessible and economical technique, which makes it the method of choice for industry compared to high field NMR or high-resolution MS. Twenty-four ATR-FTIR spectra of solid freeze-dried samples (triplicates of eight July pilot plant samples listed in Table 1) were therefore acquired. An overlay of three representative spectra is shown in Fig. S9.† While the spectra of raw and SIX samples are very similar, clear differences can be seen for the ILCA–CMF sample. Most notable are the intensity reduction between 1800 and 1250 cm−1 and increased absorption at around 1060 cm−1. The first wide region contains the stretching vibrations of carbonyls, alkenes and arenes and bending vibrations of CH2 and CH3 groups and OH and COH bending. The increased intensity around 1060 cm−1 corresponds to C–O stretching.To identify more subtle differences in the spectra, PCA analysis was performed. The principal component 1 (PC1) explained 83% of the data, with 6% being explained by PC2 (R2, a goodness of fit parameters), while the goodness of model parameters (Q2) were 0.82 and 0.05 for the PC1 and PC2, respectively. The corresponding score plots are shown in Fig. 9a. A close grouping in the PCA score plots along PC1 and PC2 for groups of sample triplicates from each month indicates a good reproducibility of the method.
 | ||
| Fig. 9 (a) PCA scores plot of ATR-FTIR data for triplicates of samples listed in Table 1. The Hotelling's T2 ellipse represents 95% confidence interval. The June and July samples are represented by squares and circles respectively; (b) loadings plot for PC1 vs. wavenumber (a black and white friendly figure is presented Fig. S10†). | ||
Both June and July pilot plant ILCA–CMF samples are clearly separated from the rest along PC1. As the intermonth variations along PC2 exceed those between samples receiving different treatment, it cannot be claimed that PC2 can add more information with regard to sample differences, a premise that would have to be investigated on a larger data set. Nevertheless, the separation along PC1 of the ILCA–CMF is significant. A loadings plot (Fig. 9b) indicates that the variables contributing most to the definition of PC1 (negative values – i.e. those which decreased in the ILCA–CMF samples) are the wavenumbers 1380 cm−1 (phenolic CH2 and CH3 deformations),31 1610 cm−1 (olefinic and aromatic C![[double bond, length as m-dash]](https://www.rsc.org/images/entities/char_e001.gif) C),32 and 1710 cm−1 (C
C),32 and 1710 cm−1 (C![[double bond, length as m-dash]](https://www.rsc.org/images/entities/char_e001.gif) O stretch).33 Positive values (i.e. those that increased in the ILCA–CMF samples) correspond to 1060 cm−1 that can be attributed to C–O stretching, while that at 950 cm−1 corresponds to
O stretch).33 Positive values (i.e. those that increased in the ILCA–CMF samples) correspond to 1060 cm−1 that can be attributed to C–O stretching, while that at 950 cm−1 corresponds to ![[double bond, length as m-dash]](https://www.rsc.org/images/entities/char_e001.gif) C–H,
C–H, ![[double bond, length as m-dash]](https://www.rsc.org/images/entities/char_e001.gif) CH2 bending.34
CH2 bending.34
The IR spectra therefore are in a broad agreement with the 1H spectra, where resonances of aromatic/olefinic and CH2 groups were seen to be depleted. On the other hand, it is difficult to explain the increase of the C–O stretches, despite a small decrease in carbohydrates seen by NMR.
As both the pilot plant and the WTW plant use the same coagulant and the WTW did not show any selectivity when processing the same inlet water, removal of aromatics/polyphenols in the pilot plant can therefore be attributed to the CMF step. A previous study by Metcalfe (2015), used the same combination of processes, SIX and ILCA–CMF to assess their ability to remove disinfection by-product precursors. They found via LC-OCD that SIX treatment preferentially removed low molecular weight species, while ILCA–CMF was more effective in removal of high molecular weight species. As discussed in section 2.3 these findings cannot be corroborated by FT-ICR-MS due to inability of this technique to observe simultaneously large and small compounds (in large numbers). Indeed, we saw little difference between the SIX treated and the raw water DOM. NMR spectroscopy would be able to observe proton signals from these larger molecular weight species, yet there is still little difference in the spectral profile. Metcalfe (2015) did find however, that the potential to form disinfection by-products was greatly reduced after CMF; this could be explained by the removal of the aromatic species seen in this study.35
Similar to our observations, high-resolution MS and differential absorbance and fluorescence were able to detect changes in DOM composition, which could not be detected with commonly used DOC-normalized parameters, emphasising the usefulness of high-end analytical techniques in assessing the efficiency of new water treatment technologies.36 As demonstrated by our work, while FT-ICR MS provides the most comprehensive, yet only qualitative information concerning small and medium size molecules, 1H NMR is a quantitative, low resolution technique, capable of unambiguously identifying the lack or presence of aromatic compounds. ATR-FTIR on the other hand is the most economical technique that is also sensitive to these types of compounds, although the overlap between the IR absorption bands can prevent unambiguous identification of structural fragments.
4. Conclusions
Application of FT-ICR MS, NMR and ATR-FTIR provided independent evidence for selective removal of aromatic/phenolic species by the in-line coagulation and CeraMac® filtration (ILCA–CMF), while the suspended ion exchange (SIX) was found to be non-selective in the species it removed. Near complete removal of these compound classes following a combined treatment by SIX and ILCA–CMF is significant, as phenolics/aromatic species are known to react readily with chlorine and are a proven source of trihalomethanes – substances regulated in potable water.36,37 Suspended ion exchange thus has the potential to reduce concentration of species that coagulation and filtration did not remove, but ILCA–CMF is required to reduce formation of DBPs through selective removal of aromatic, highly oxygenated species. This study thus provides a molecular level explanation to the observed reduction of DBPs made previously using an identical water treatment system.12Conflicts of interest
There are no conflicts to declare.Acknowledgements
The authors would like to thank Dr. Logan Mackay for maintenance of the MS facility, Mr. Juraj Bella and Dr. Lorna Murray for maintenance of the NMR facility. Support and funding was provided by the Scottish Water and EPSRC grant EP/N509644/1.References
- K. P. Cantor, Water chlorination, mutagenicity and cancer epidemiology, Am. J. Public Health, 1994, 84, 1211–1213 CrossRef PubMed.
- M. J. Plewa, Y. Kargalioglu, D. Vankerk, R. A. Minear and E. D. Wagner, Mammalian cell cytotoxicity and genotoxicity analysis of drinking water disinfection by-products, Environ. Mol. Mutagen., 2002, 40, 134–142 CrossRef PubMed.
- S. Ndiongue, P. M. Huck and R. M. Slawson, Effects of temperature and biodegradable organic matter on control of biofilms by free chlorine in a model drinking water distribution system, Water Res., 2005, 39, 953–964 CrossRef PubMed.
- C. Freeman, N. Fenner, N. J. Ostle, H. Kang, D. J. Dowrick, B. Reynolds, M. A. Lock, D. Sleep, S. Hughes and J. Hudson, Export of dissolved organic carbon from peatlands under elevated carbon dioxide levels, Nature, 2004, 430, 195–198 CrossRef PubMed.
- F. Worrall, R. Harriman, C. D. Evans, C. D. Watts, J. Adamson, C. Neal, E. Tipping, T. Burt, I. Grieve, D. Monteith, P. S. Naden, T. Nisbet, B. Reynolds and P. Stevens, Trends in dissolved organic carbon in UK rivers and lakes, Biogeochemistry, 2004, 70, 369–402 CrossRef.
- K. Kalbitz, J. Schmerwitz, D. Schwesig and E. Matzner, Biodegradation of soil-derived dissolved organic matter as related to its properties, Geoderma, 2003, 113, 273–291 CrossRef.
- R. B. Davis, D. S. Anderson and F. Berge, Palaeolimnological evidence that lake acidification is accompanied by loss of organic matter, Nature, 1985, 316, 436–438 CrossRef.
- D. Rocker, V. Kisand, B. Scholz-Böttcher, T. Kneib, A. Lemke, J. Rullkötter and M. Simon, Differential decomposition of humic acids by marine and estuarine bacterial communities at varying salinities, Biogeochemistry, 2012, 111, 331–346 CrossRef.
- S. J. Köhler, E. Lavonen, A. Keucken, P. Schmitt-Kopplin, T. Spanjer and K. Persson, Upgrading coagulation with hollow-fibre nanofiltration for improved organic matter removal during surface water treatment, Water Res., 2015, 89, 232–240 CrossRef PubMed.
- M. S. Siddiqui, G. L. Amy and B. D. Murphy, Ozone enhanced removal of natural organic matter from drinking water sources, Water Res., 1997, 31, 3098–3106 CrossRef.
- I. Ilisz, A. Dombi, K. Mogyorósi and I. Dékány, Photocatalytic water treatment with different TiO2 nanoparticles and hydrophilic/hydrophobic layer silicate adsorbents, Colloids Surf., A, 2003, 230, 89–97 CrossRef.
- D. Metcalfe, C. Rockey, B. Jefferson, S. Judd and P. Jarvis, Removal of disinfection by-product precursors by coagulation and an innovative suspended ion exchange process, Water Res., 2015, 87, 20–28 CrossRef PubMed.
- M. Gonsior, P. Schmitt-Kopplin, H. Stavklint, S. D. Richardson, N. Hertkorn and D. Bastviken, Changes in dissolved organic matter during the treatment processes of a drinking water plant in Sweden and formation of previously unknown disinfection byproducts, Environ. Sci. Technol., 2014, 48, 12714–12722 CrossRef PubMed.
- F. F. Zhang, M. Harir, F. Moritz, J. Zhang, M. Witting, Y. Wu, P. Schmitt-Kopplin, A. Fekete, A. Gaspar and N. Hertkorn, Molecular and structural characterization of dissolved organic matter during and post cyanobacterial bloom in Taihu by combination of NMR spectroscopy and FTICR mass spectrometry, Water Res., 2014, 57, 280–294 CrossRef PubMed.
- J. Raeke, O. J. Lechtenfeld, J. Tittel, M. R. Oosterwoud, K. Bornmann and T. Reemtsma, Linking the mobilization of dissolved organic matter in catchments and its removal in drinking water treatment to its molecular characteristics, Water Res., 2017, 113, 149–159 CrossRef PubMed.
- M. G. Lusk, G. S. Toor and P. W. Inglett, Characterization of dissolved organic nitrogen in leachate from a newly established and fertilized turfgrass, Water Res., 2018, 131, 52–61 CrossRef PubMed.
- N. Kamjunke, N. Hertkorn, M. Harir, P. Schmitt-Kopplin, C. Griebler, M. Brauns, W. von Tumpling, M. Weitere and P. Herzsprung, Molecular change of dissolved organic matter and patterns of bacterial activity in a stream along a land-use gradient, Water Res., 2019, 164, 114919 CrossRef PubMed.
- S. M. Serkiz and E. M. Perdue, Isolation of dissolved organic matter from Suwannee River using reverse osmosis, Water Res., 1990, 24, 911–916 CrossRef.
- L. Sun, E. M. Perdue and J. F. McCarthy, Using reverse osmosis to obtain organic matter from surface and ground waters, Water Res., 1995, 29, 1471–1477 CrossRef.
- W. Kew, J. W. T. Blackburn, D. J. Clarke and D. Uhrín, Interactive van Krevelen diagrams – Advanced visualisation of mass spectrometry data of complex mixtures, Rapid Commun. Mass Spectrom., 2017, 31, 658–662 CrossRef PubMed.
- B. P. Koch and T. Dittmar, From mass to structure: an aromaticity index for high-resolution mass data of natural organic matter, Rapid Commun. Mass Spectrom., 2006, 20, 2386 CrossRef.
- T. Dittmar, B. Koch, N. Hertkorn and G. Kattner, A simple and efficient method for the solid-phase extraction of dissolved organic matter (SPE-DOM) from seawater, Limnol. Oceanogr.: Methods, 2008, 6, 230 CrossRef.
- T. A. Vetter, E. M. Perdue, E. Ingall, J. F. Koprivnjak and P. H. Pfromm, Combining reverse osmosis and electrodialysis for more complete recovery of dissolved organic matter from seawater, Sep. Purif. Technol., 2007, 56, 383–387 CrossRef.
- D. M. Osborne, D. C. Podgorski, D. A. Bronk, Q. Roberts, R. E. Sipler, D. Austin, J. S. Bays and W. T. Cooper, Molecular-level characterization of reactive and refractory dissolved natural organic nitrogen compounds by atmospheric pressure photoionization coupled to Fourier transform ion cyclotron resonance mass spectrometry, Rapid Commun. Mass Spectrom., 2013, 27, 6521 CrossRef PubMed.
- A. Lex, N. Gehlenborg, H. Strobelt, R. Vuillemot and H. Pfister, UpSet: Visualization of Intersecting Sets, IEEE Trans. Vis. Comput. Graph., 2014, 20, 1983–1992 Search PubMed.
- Z. Yuan, C. He, Q. Shi, C. Xu, Z. Li, C. Wang, H. Zhao and J. Ni, Molecular Insights into the Transformation of Dissolved Organic Matter in Landfill Leachate Concentrate during Biodegradation and Coagulation Processes Using ESI FT-ICR MS, Environ. Sci. Technol., 2017, 51, 8110–8118 CrossRef PubMed.
- E. E. Lavonen, D. N. Kothawala, L. J. Tranvik, M. Gonsior, P. Schmitt-Kopplin and S. J. Köhler, Tracking changes in the optical properties and molecular composition of dissolved organic matter during drinking water production, Water Res., 2015, 85, 286–294 CrossRef PubMed.
- E. C. Minor, C. J. Steinbring, K. Longnecker and E. B. Kujawinski, Characterization of dissolved organic matter in Lake Superior and its watershed using ultrahigh resolution mass spectrometry, Org. Geochem., 2012, 43, 1–11 CrossRef.
- T. Bond, E. H. Goslan, S. A. Parsons and B. Jefferson, Treatment of disinfection by-product precursors, Environ. Technol., 2011, 32, 1–25 CrossRef PubMed.
- B. Lam and A. J. Simpson, Direct 1H NMR spectroscopy of dissolved organic matter in natural waters, Analyst, 2008, 133, 263–269 RSC.
- R. R. E. Artz, S. J. Chapman, A. H. Jean Robertson, J. M. Potts, F. Laggoun-Défarge, S. Gogo, L. Comont, J. R. Disnar and A. J. Francez, FTIR spectroscopy can be used as a screening tool for organic matter quality in regenerating cutover peatlands, Soil Biol. Biochem., 2008, 40, 515–527 CrossRef.
- C. Cocozza, V. D'Orazio, T. M. Miano and W. Shotyk, Characterization of solid and aqueous phases of a peat bog profile using molecular fluorescence spectroscopy, ESR and FT-IR, and comparison with physical properties, Org. Geochem., 2003, 34, 49–60 CrossRef.
- D. Gondar, R. Lopez, S. Fiol, J. M. Antelo and F. Arce, Characterization and acid–base properties of fulvic and humic acids isolated from two horizons of an ombrotrophic peat bog, Geoderma, 2005, 126, 367–374 CrossRef.
- P. Zaccheo, G. Cabassi, G. Ricca and L. Crippa, Decomposition of organic residues in soil: experimental technique and spectroscopic approach, Org. Geochem., 2002, 33, 327–345 CrossRef.
- M. Deborde and U. von Gunten, Reactions of chlorine with inorganic and organic compounds during water treatment—Kinetics and mechanisms: A critical review, Water Res., 2008, 42, 13–51 CrossRef PubMed.
- S. D. Boyce and J. F. Hornig, Reaction pathways of trihalomethane formation from the halogenation of dihydroxyaromatic model compounds for humic acid, Environ. Sci. Technol., 1983, 17, 202–211 CrossRef PubMed.
- H. Gallard and U. Von Gunten, Chlorination of natural organic matter: kinetics of chlorination and of THM formation, Water Res., 2002, 36, 65–74 CrossRef.
Footnote |
| † Electronic supplementary information (ESI) available. See DOI: 10.1039/c9ew01042d |
| This journal is © The Royal Society of Chemistry 2020 |

