
 Open Access Article
 This Open Access Article is licensed under a
 Creative Commons Attribution 3.0 Unported Licence
Effects of natural organic matter (NOM), metal-to-sulfide ratio and Mn2+ on cadmium sulfide nanoparticle growth and colloidal stability†
Kevin
Hoffmann
 a,
Iso
Christl
a,
Ralf
Kaegi
b and
Ruben
Kretzschmar
*a
a,
Iso
Christl
a,
Ralf
Kaegi
b and
Ruben
Kretzschmar
*a
aInstitute of Biogeochemistry and Pollutant Dynamics, CHN, ETH Zürich, 8092 Zürich, Switzerland. E-mail: ruben.kretzschmar@env.ethz.ch
bEawag, Swiss Federal Institute of Aquatic Science and Technology, 8060 Dübendorf, Switzerland
First published on 9th October 2020
Abstract
Redox-dynamic environments such as river floodplains and wetlands have been identified as sources of natural metal sulfide nanoparticles (MS NPs). However, little information is available on how their growth and colloidal stability are affected by the concentrations of metals and sulfide in solution, the presence of natural organic matter (NOM), and the possible incorporation of other metal cations such as Fe2+ or Mn2+. Here, we performed experiments on the formation of CdS nanoparticles (CdS NPs) in anoxic solutions with varying Cd (50, 100, 500 μmol L−1) and sulfide (50, 100, 1000 μmol L−1) concentrations in the absence and presence of Suwannee River fulvic acid (SRFA, 0, 5, 50 mg C per L). Additionally, we studied the influence of different metal-to-sulfide ratios and varying Mn2+ (0, 0.1, 0.5, 1 mmol L−1) concentrations on CdS aggregation using dynamic light scattering (DLS), transmission electron microscopy (TEM), and electrophoretic mobility measurements. The incorporation of Mn into the crystal lattice of CdS over 8 weeks was investigated with X-ray diffraction (XRD) and X-ray absorption spectroscopy (XAS). Our results show that after 24 hours, small CdS primary particles with median diameters of a few nanometers (![[d with combining tilde]](https://www.rsc.org/images/entities/i_char_0064_0303.gif) TEM = 2–14 nm) formed large aggregates (TEM = 167 nm) and that increasing SRFA concentrations progressively constrained the size of these aggregates (down to 19 nm) irrespective of the initial reactant stoichiometry. When NOM was absent or at low concentration, higher metal-to-sulfide ratios (≥1) and Mn2+ concentrations (≥0.5 mmol L−1) led to reduced colloidal stability of the suspensions. We found that in suspensions containing Mn2+, 10–30% of the Cd atoms in the crystal lattice were substituted by Mn during the formation of CdS, which was prevented by NOM.
TEM = 2–14 nm) formed large aggregates (TEM = 167 nm) and that increasing SRFA concentrations progressively constrained the size of these aggregates (down to 19 nm) irrespective of the initial reactant stoichiometry. When NOM was absent or at low concentration, higher metal-to-sulfide ratios (≥1) and Mn2+ concentrations (≥0.5 mmol L−1) led to reduced colloidal stability of the suspensions. We found that in suspensions containing Mn2+, 10–30% of the Cd atoms in the crystal lattice were substituted by Mn during the formation of CdS, which was prevented by NOM.
Environmental significanceIn many natural ecosystems such as e.g., wetlands, riparian soils, and rice paddy fields, redox conditions fluctuate due to natural or anthropogenic variations of water supply. Natural metal sulfide nanoparticles (MS NPs) have recently been reported to form preferably under such conditions. As a consequence, their formation and colloidal stability, and thus trace metal (e.g., Cd, Cu, Hg) mobility, are expected to be influenced by typical variations in pore water composition (natural organic matter (NOM), metal and sulfide ions). We show that, irrespective of the cadmium-to-sulfide ratio, NOM restricts the aggregation of CdS nanoparticles and counteracts the aggregating effect of divalent cations such as Mn2+. Further, we demonstrate that Mn2+ can substitute for Cd2+ in the crystal lattice of CdS and that this process is effectively inhibited by NOM. Based on our findings, we believe that trace metal mobility is largely controlled by the concentration of NOM and that divalent cations affect the release of toxic metals from sulfides primarily in NOM-depleted environments. |
1. Introduction
Within the last century, cadmium (Cd) contamination of wetland soils has become a widespread environmental issue in many parts of the world.1–6 The past and ongoing industrialization in many countries has given rise to an incessant demand for various elements which induced the exploitation of geological resources by mining and caused the release of associated heavy metals such as Cd to natural environments. Soil contamination can occur via emissions of Cd from mining sites to surface waters, affecting natural wetlands and floodplains downstream, but also due to the weathering of Cd-enriched bedrock material in situ. In agricultural soils, irrigation with contaminated water (e.g., in rice paddy soils) and the application of phosphate fertilizers or sewage sludge containing considerable Cd impurities can lead to Cd pollution.7–11 Compared to other crops, rice (Oryza sativa L.) plants can take up high amounts of Cd which is translocated to the shoots and accumulated in the grain.12–14 Cadmium as a toxic and carcinogenic trace metal is known to cause severe chronic diseases in humans such as the ‘Itai-Itai’ disease upon prolonged exposure or long-term consumption of contaminated food.15–17 Since rice is the staple food for about half of the world's population, this environmental issue has become a serious food safety issue of enormous dimension.18–20 Especially in many Asian countries, where insufficient environmental regulations together with a weak enforcement of regulations have led to the severe contamination of agricultural land with heavy metals and where rice often contributes at least half of the total dietary intake, the implications are most critical.20–22 Likewise, trace metal contamination in such areas poses a serious threat to soil fertility and ecosystem health.6 Therefore, it is important to understand the biogeochemical processes that control Cd availability and mobility in these redox-dynamic systems.Farmers commonly flood their paddy fields during the rice growing season for several weeks to months and drain the soil two to five weeks before harvest.14,23 These periodical changes in soil redox conditions influence solid-phase speciation as well as solubility of Cd and thus affect its bioavailability in the soil pore space. The prolonged waterlogging continuously decreases the soil redox potential and induces the reductive dissolution of Mn(III/IV)- and Fe(III)-(oxyhydr)oxide sorbent phases, thereby releasing adsorbed metals (e.g., Cd, Cu, Hg, Pb, Zn) into the pore water and increasing dissolved Mn2+, Fe2+ and e.g. Cd2+ concentrations in the pore water.24–26 With ongoing waterlogging, sulfate-reducing microorganisms (SRM) produce dissolved sulfide species such as HS− that react with dissolved chalcophile metals in the pore water to form nanoparticulate metal sulfide precipitates (e.g., CdS, CuxS, HgS).27–29 The concomitant pH increase towards near neutral conditions with prolonged reducing conditions and the typically very low solubility of metal sulfides decreases the metal availability to plants, soil- and microorganisms,9,30 which may explain reduced Cd contents observed in rice grains grown under permanently flooded conditions.23,31,32 For a long time, these sparingly soluble chalcogenides were thought to contribute to the immobilization of trace metals in soils and to be irrelevant for contaminant transport.33 However, such metal sulfides have been found in the colloidal fraction of pore waters of wetland soils,27–29 estuarine waters,34 as well as in freshwater systems such as rivers.35–38 Even though prominent sequestration patterns following the order of solubility products of the metal sulfides (log![[thin space (1/6-em)]](https://www.rsc.org/images/entities/char_2009.gif) Ksp values: HgS < Ag2S < CuxS < CdS ≈ PbS < ZnS < FeS) have been discovered,27 distinct CdS entities have been proposed to co-exist at least temporarily with other metal sulfides possessing lower solubility products such as CuxS in reduced mixed-metal contaminated natural soils enriched in reducible sulfur.27 Spectroscopic evidence for the formation of pure CdS during the flooding of a highly contaminated, alkaline Thai paddy soil was provided by Khaokaew et al.5 using X-ray absorption spectroscopy (XAS). In another XAS study with a metal-spiked paddy soil from Bangladesh, Fulda et al.39 confirmed the nanoparticulate character of distinct CdS and mixed-metal sulfides which were identified via TEM analysis in earlier experiments in another contaminated floodplain soil.27,28 Hence, if Cd is bound in nanoscale sulfide precipitates, this can affect Cd cycling in redox-dynamic environments, as stable colloidal particles can potentially be transported with flowing water through natural porous media such as soils and aquifers.40
Ksp values: HgS < Ag2S < CuxS < CdS ≈ PbS < ZnS < FeS) have been discovered,27 distinct CdS entities have been proposed to co-exist at least temporarily with other metal sulfides possessing lower solubility products such as CuxS in reduced mixed-metal contaminated natural soils enriched in reducible sulfur.27 Spectroscopic evidence for the formation of pure CdS during the flooding of a highly contaminated, alkaline Thai paddy soil was provided by Khaokaew et al.5 using X-ray absorption spectroscopy (XAS). In another XAS study with a metal-spiked paddy soil from Bangladesh, Fulda et al.39 confirmed the nanoparticulate character of distinct CdS and mixed-metal sulfides which were identified via TEM analysis in earlier experiments in another contaminated floodplain soil.27,28 Hence, if Cd is bound in nanoscale sulfide precipitates, this can affect Cd cycling in redox-dynamic environments, as stable colloidal particles can potentially be transported with flowing water through natural porous media such as soils and aquifers.40
While studies on CdS nanoparticles (CdS NPs), particularly in an environmental context, are scarce,41–43 their formation in synthetic solutions is better understood. Due to their unique optical and electrical properties,44,45 they are widely used as semiconductors in a variety of technical applications including optoelectronic devices such as solar cells and photodetectors,46–48 photocatalysts,49,50 next-generation LED displays and other high-end electronics,45,51 and biomedical imaging.52,53 Most often however, the technical synthesis of these engineered CdS nanoparticles or quantum dots (QDs) requires high temperatures,54,55 non-aqueous solvents,48,56 and various surfactants56–60 (to stabilize the particles) and thus can only give limited understanding of the actual processes taking place in the formation of CdS nanoparticles in natural environments.
Nevertheless, established knowledge in colloid science points out particle characteristics such as particle size, morphology, surface charge and aggregation behavior controlling colloidal transport.61–64 As described by DLVO theory, the total of all DLVO forces, such as attractive van der Waals forces and repulsive electrostatic forces (surface charge) as well as non-DLVO forces (e.g., steric repulsion, hydrophobic interactions, bridging effects) that act on a particle, determine its aggregation behavior.61,65–67 In this respect, colloidal particles can only be mobile if they are stable in suspension, i.e. if aggregation is very slow.40 The nature of these particles is highly dependent on key environmental factors such as ionic strength, pH as well as dissolved cadmium, sulfide, organic matter, and surrounding cation concentrations in the pore water.64 These parameters can largely vary in dynamic wetland systems as a consequence of local contamination history, seasonal changes in the natural flooding regime or agricultural management among others. For instance, wetlands are known as hotspots of fresh organic matter production and accumulation.25,68 Numerous studies on engineered nanoparticles and even on other metal sulfides such as ZnS and HgS have demonstrated the strong (stabilizing) effect of natural organic matter (NOM) on colloidal stability and aggregation behavior of these particles.69–74 However, there is a lack of mechanistic studies investigating the influence of NOM on the formation and stability of CdS NPs.
In highly contaminated soils, pore water concentrations of trace metals can be in excess with respect to sulfide, or in deficit in sulfur-rich environments. Environmental concentrations of Cd >300 μmol L−1 and SO42− ≫1000 μmol L−1 (surface waters) have been reported for numerous catchments impacted by metal mining.6 In this regard, the reaction stoichiometry has been shown to influence particle size and surface site composition of CdS NPs formed in the presence of cysteine.41 However, effects of various reaction stoichiometries on formation of CdS NPs in the presence of NOM are still unknown.
As in waterlogged soils, microbial respiration leads to the reductive dissolution of Mn(III/IV)-(oxyhydr)oxide phases, also the resulting elevated Mn2+ concentrations in the pore water28 may influence particle formation of metal sulfides. Though several divalent cations are known to induce aggregation,40,75–79 the impact of Mn2+ ions on formation and aggregation of CdS NPs at environmental conditions has not been addressed, yet. Based on the use of Mn as a dopant in synthetic solutions for improvement and tuning of CdS and CdSe semiconducting materials50,80,81 we speculate a similar incorporation of Mn into the CdS crystal structure in natural environments, which has not been considered, so far.
Considering the limited understanding of CdS NP behavior and fate in relevant natural environments, the aim of this study was to investigate the influence of NOM, reactant (cadmium and sulfide) and Mn2+ concentration as well as reactant stoichiometry on particle size, particle morphology, and aggregation behavior of CdS. To this end, we used dynamic light scattering (DLS) techniques and transmission electron microscopy (TEM) to assess the properties of the CdS after 24 h reaction time. Additionally, X-ray diffraction (XRD) and X-ray absorption spectroscopy (XAS) was used to elucidate the process of Mn substitution in CdS crystals in the absence and presence of NOM.
2. Materials and methods
Materials
All solutions were prepared with filtered (0.22 μm, sterile Millipak® 40, Millipore) ultrapure deionized water (Milli-Q®, 18 MΩ cm, Millipore). All chemicals used were of at least analytical grade. Before anoxic solutions were prepared, purging of ultrapure water was done with N2 for at least 2 h under vigorous stirring. Work under anoxic conditions was performed in a glovebox (Labmaster 130, MBraun, Germany) under N2 atmosphere (O2 < 1 ppm). All glassware was soaked overnight in an acid bath of 1 mol L−1 HCl/1.5 mol L−1 HNO3 and rinsed three times afterwards with ultrapure water. Preparation of all stock solutions with subsequent filtration (0.22 μm mixed cellulose ester membrane filters, BGB Analytik AG, Switzerland) was carried out in the glovebox.Stock solutions of dissolved Cd(II) and Mn(II) were prepared with CdCl2 (Sigma-Aldrich) and MnCl2 · 4 H2O (VWR), respectively. The pH adjustment of the 3-(N-morpholino)propanesulfonic acid (MOPS, Amresco) buffer stock solution to pH 7.5 was carried out with 0.1 mol L−1 HCl and 0.1 mol L−1 NaOH. In the same manner, the stock solution of Suwannee River fulvic acid II (SRFA, Cat. No. 2S101F, IHSS), was adjusted to pH 6.1 and stored outside the glovebox in an air-tight bottle in the dark at 4 °C. Inductively coupled plasma optical emission spectroscopy (5100 ICP-OES, Agilent) and TOC analysis (DIMATOC® 2000, DIMATEC, Germany) were employed to determine the concentrations of Cd, Mn, and SRFA in stock solutions. In order to remove oxidized or polysulfidic surface coatings82 from crystals of Na2S·9H2O (Sigma-Aldrich) used in the preparation of the sulfide stock solutions, crystals were thoroughly rinsed with ultrapure water and dried for at least 24 h in the glovebox. Checking for sulfide stock concentrations and verification of its stability over 4 weeks in the glovebox atmosphere was achieved by applying an iodometric titration method, which was standardized against a thiosulfate solution (Titrisol®, Merck). Respective sulfide working solutions were diluted daily from this stock solution.
Preparation of experimental cadmium sulfide suspensions
We performed experiments on CdS nanoparticle formation from anoxic solutions with low cadmium (50, 100 μmol L−1) and sulfide concentrations (50, 100 μmol L−1) at different cadmium-to-sulfide ratios (1:2, 1:1, 2:1), in absence and presence of SRFA (0, 5, 50 mg C per L), and varying Mn2+ concentrations (0, 0.1, 0.5, 1 mmol L−1). Additionally, the influence of higher cadmium (500, 1000 μmol L−1) and sulfide concentrations (500, 1000 μmol L−1) on particle characteristics was examined. All experiments were conducted at pH 7.5 (1 mmol L−1 MOPS) in a 10 mmol L−1 NaCl electrolyte at 25 ± 2 °C. Preparation of the solutions in 100 mL serum glass bottles began with mixing NaCl, MOPS buffer, SRFA, Mn2+ and Cd2+ at given concentrations followed by the addition of sulfide in one spike under vigorous stirring to initiate particle formation. Serum bottles were then closed with a butyl rubber stopper (Rubberbv, Netherlands) and an aluminum cap (Chromacol 20-ACB, Thermo Scientific, Germany). After addition of all aqueous reagents, the bottle headspace remained filled with 16 mL N2. For the majority of experiments, aliquots were withdrawn after 24 hours for subsequent analyses using a plastic syringe (Amefa, Braun, Germany) equipped with a stainless steel needle (Sterican, Braun, Germany). However, in experiments for XAS analysis, XRD analysis (Mn-spiked CdS samples) and acid digestion including subsequent determination of Mn content in the solids, specimens for analysis were prepared after 1 week or 8 weeks of equilibration time. Chemical speciation modeling of the prepared solutions was calculated with Visual MINTEQ 3.1 and served as comparison of experimental conditions to thermodynamic equilibria.83 Details can be found in the Supplementary Information.
DLS analysis
The hydrodynamic diameter (dh) of the CdS nanoparticles was determined by dynamic light scattering (DLS, Nano ZS, Malvern Instruments, UK). Suspension aliquots were filled into plastic folded capillary cells (DTS1070, Malvern) and measured in backscatter mode at a 173° angle (λ = 532 nm) at 25 °C. Aliquots were measured without further purification or dilution. Only directly before measurement, samples came into contact with ambient air. A minimum of five consecutive measurements per aliquot was performed, each consisting of at least 11 runs of 10 seconds. For each sample, 2 to 5 true replicates were measured. In order to calculate particle size distributions of the suspensions, recorded autocorrelation functions were processed with the in-built multiple narrow peak (MNP) algorithm of the Malvern Software (Zetasizer Software 7.11, Malvern), which is highly recommended by some authors84 to be used for more complex or polydisperse samples in contrast to the general purpose (GP) algorithm. In fact, with the GP algorithm, we were not able to resolve the bi- or multimodal character of our suspensions. Intensity-weighted particle size distributions were used for all subsequent data analyses. Sample runs showing very noisy autocorrelation functions or with average count rates <100 kcps were discarded from the database. Control measurements with various experimental solutions without Na2S exhibited low count rates and extremely distorted autocorrelation functions, thus excluding substantial particle formation before the final sulfide addition step.Electrophoretic mobility measurements
Immediately after the DLS run, electrophoretic mobility measurements were conducted via laser Doppler velocimetry combined with phase analysis light scattering (LDV-PALS, Nano ZS, Malvern Instruments, UK) to gather information on the surface charge of the cadmium sulfides. Data were recorded in a minimum of six runs per aliquot, each comprising 22 individual measurements at an applied voltage of 150 V at 25 °C. Electrophoretic mobility data were transformed into zeta potentials (ZP) by applying the Smoluchowski approximation model85 with the Henry function F(κα) = 3/2 for aqueous media. Runs showing distorted phase plots were rejected.TEM analysis
Scanning transmission electron microscopy (STEM, HD2700-Cs operated at 200 kV, Hitachi, Japan) with a high-angle annular dark-field (HAADF) detector for image formation was used to study the size, aggregation state, and morphology of the CdS particles. Energy dispersive X-ray spectroscopy (EDX, EDAX, USA) was applied to determine the elemental composition of individual particles. Preparation of samples for TEM analyses was done in the glovebox. The Formvar®/carbon-coated Ni grids (S162N4, Ni grids, 400 mesh, Plano) were functionalized with 0.1% (w/v) poly-L-lysine (Sigma-Aldrich) to create a positively charged collector surface. Then, custom-made aluminum cones that fitted tightly into the bottom of 1.5 mL Eppendorf tubes, were top-coated with Parafilm® upon which the Ni grid was placed. After insertion of the aluminum cone into the Eppendorf tube, 1 mL of the diluted sample suspension (1:10–1:225, depending on suspension concentration) was added. Samples were centrifuged (14000 rpm, 16215g, 1 hour, 15 °C, swinging-bucket rotor, Unicen MR, Herolab) to spin down the nanoparticles onto the grid. After disposal of the supernatant, the grid was recovered and washed with one drop of ultrapure water. Excess liquid remaining on the grid was wicked away from underneath with a lint-free tissue. Prepared grids were stored under argon atmosphere in a dark chamber until analysis. Image analysis of the recorded TEM images was carried out using different software packages (Digital Micrograph v3.01, ImageJ Fiji v1.51n, Adobe Illustrator CC v2015.0.0, Adobe Photoshop CC v2005.1.2). For particle and aggregate sizing, either the Nanodefine Particle Sizer plugin86 incorporated into the ImageJ Fiji software was used or manual size determination and counting was performed using the Digital Micrograph software. For sizing the aggregates, the maximum Feret diameter was selected as aggregate diameter. Selected area diffraction (SAED) patterns were calculated by applying a fast Fourier transformation to high-resolution TEM images that displayed crystal lattice fringes of CdS particles. Calculations on particle size distributions as well as statistical significance tests were carried out with Origin 2018.
XRD analysis
Mineralogical phases were identified by X-ray diffraction (XRD, D8 Advance, Bruker) analysis. For this, 10 mL of the concentrated sample suspensions were ultracentrifuged under anoxic conditions (polycarbonate tubes, 40000 rpm, 193000g, 3 h, 15 °C, fixed-angle rotor, Centrikon T-1080, Kontron). After careful decanting of the supernatant, 1 mL of ultrapure water was used to resuspend the fragile pellet at the bottom of the tube. The dispersed suspension was then centrifuged a second time for 30 min at otherwise identical conditions. The supernatant was discarded again and the new pellet was dispersed in 0.2 mL ethanol. Sample preparation was completed by depositing and drying the ethanolic suspension in repetitive (5–10 times) 10 μL pipetting steps onto a zero background silicon wafer (orientation (510), Siltronix, France) until a thin CdS layer was visible. This last preparation step was carried out under ambient conditions. Using Cu Kα radiation (λ = 1.5419 Å, 40 kV, 40 mA), the loaded silicon wafers were measured in Bragg–Brentano geometry. X-ray diffractograms were recorded with a high-resolution energy dispersive 1D detector (LynxEye XE) from 4–90° 2θ in 0.02° steps with 10 s acquisition time per step. Quantification of mineralogical phases was accomplished by Rietveld quantitative phase analysis (QPA) based on the published structures for hawleyite (ICSD 31075)87 and greenockite (ICSD 31074)87 using the Bruker TOPAS (Version 5) software. The quality of the fits was evaluated based on the calculated GOF parameter (= Rwp/Rexp).
After the samples of the Mn-spike experiments were measured, a thin layer of crystalline corundum (Al2O3, Fluka) was deposited onto the same loaded wafers (using a 100 g L−1 corundum suspension) and measured again to correct for vertical sample displacement. This allowed a more precise determination of unit cell dimensions of hawleyite and greenockite and their change with Mn addition, despite the broad XRD reflections of these nanoparticles.
Analysis of CdS-Mn solids
In order to determine the amount of Mn2+ associated with the CdS nano-precipitates, an acid digestion procedure with subsequent inductively coupled plasma – mass spectrometry (ICP-MS) analysis was applied. In addition and to investigate the speciation and coordination environment of Cd and Mn, the samples were analyzed by Cd K-edge and Mn K-edge extended X-ray absorption fine-structure (EXAFS) spectroscopy. Differing from the prior experiments, concentrated CdS suspensions at a 1:2 molar metal-to-sulfide ratio (500 μmol L−1 Cd(II), 1000 μmol L−1 S(−II)) were aged in the absence and presence of SRFA (0, 50 mg C per L) and Mn2+ concentrations (0, 0.5 and 5 mmol L−1) for 1 to 8 weeks. Otherwise, the experimental procedure for inducing particle formation remained unchanged. After completion of aging, the suspensions of physical duplicates were merged (total volume: 200 mL) and filtered (0.22 μm nylon membrane filters) using a vacuum manifold. The obtained filtrate was colorless and the filter surface was yellow-orange colored, confirming that the CdS precipitates were deposited on the nylon filters. The precipitate was washed on the filter with 10 mL of ultrapure water. Afterwards, the loaded filters were dried under vacuum. The deposited precipitates were then scratched off the filter surface and collected for further analyses. To determine the portion of Mn2+ associated (adsorbed, incorporated and/or co-precipitated) with the CdS, 1 mg of the material was digested in 20% (v/v) HCl for 30 min (cCdS = 0.1 g L−1) and diluted by a factor of 100 (cCdS = 1 mg L−1) for the ICP-MS analysis.
X-ray absorption spectroscopy
The speciation and coordination environment of Cd and Mn in the CdS–Mn solids (as described above) was investigated by Cd K-edge and Mn K-edge extended X-ray absorption fine-structure (EXAFS) spectroscopy. For EXAFS analysis, samples were ground and homogenized with an agate mortar and pestle, pressed into 7 mm pellets (10 mg sample with 35 mg boron nitride and 25 mg wax) and placed between Kapton tape under ambient conditions. Immediately before the measurement at the beamline, the samples were mounted onto a cryostat rod, pre-cooled in a liquid nitrogen bath and quickly loaded into the cryostat. Cd K-edge and Mn K-edge EXAFS spectra of the samples were collected at the SAMBA beamline at the SOLEIL synchrotron (Saint-Aubin, France) equipped with a double-crystal, platin-plated Si (220) monochromator. For energy calibration, the first inflection point of the K-edge absorption spectrum of a metallic Ag foil was set to 25514 eV for Cd K-edge EXAFS measurements, and the first inflection point of the K-edge absorption spectrum of a metallic Mn foil was set to 6540 eV for Mn K-edge EXAFS measurements. For data collection, the samples were cooled to 20 K with a He-cryostat to reduce thermal disorder and to prevent beam damage. While Cd K-edge spectra of the samples were recorded in transmission mode with an ionization chamber (path length = 30 cm), Mn K-edge spectra were recorded in fluorescence mode using a 35-element Ge solid state detector (Canberra).
Multiple scans (5–20) were recorded and averaged for each sample. Data extraction and analysis of the recorded spectra was performed using the software Athena.88 The edge-step energy, E0, was fixed to 26711 eV for Cd K-edge and to 6547 eV for Mn K-edge absorption spectra. Data normalization was carried out by subtracting a first-order polynomial fit to the pre-edge region (−150 to −60 eV for both Cd and Mn K-edge) and subsequently dividing by a second-order polynomial fit to the post-edge region (95–1280 eV for Cd K-edge, 85.6–745.6 eV for Mn K-edge). For the extraction of EXAFS spectra, a background spline was adjusted using the Autobk algorithm implemented in Athena (Rbkg = 0.8; k-weight = 2; k-range 0–18 Å−1 for Cd K-edge, Rbkg = 0.8; k-weight = 3; k-range 0–14 Å−1 for Mn K-edge). After background subtraction, the data were converted into k-space via Fourier transformation over a k-range of 3.0–18.0 Å−1 (Cd) or 2.6–10.0 Å−1 (Mn) using a Hanning apodization with a window parameter of 1 Å−1. Shell-fits of the k3-weighted EXAFS spectra were performed in R-space over a R + ΔR-range of 1.4–4.3 Å using the software Artemis.88 All fitting k-weights (1, 2 and 3) were selected for fit evaluation. Fitting of the data was achieved by defining theoretical shells of the scattering atoms around a central absorber atom (Cd or Mn). For this, theoretical EXAFS phase-shift and amplitude functions were calculated with FEFF v.6.0189 for first- (Cd–S) and second-shell (Cd–Cd) single scattering paths and minor contributing Cd–S–S and Cd–S–Cd double scattering paths based on the cubic zinc-blende structure of hawleyite (ICSD reference code: 31075)87 for fitting the Cd K-edge data. Likewise, first- (Mn–O, Mn–S) and second-shell (Mn–Mn, Mn–Cd) single scattering paths were calculated for fitting the Mn K-edge data using a modified hawleyite structure, in which 1–4 Cd atoms (out of 12) have been substituted by Mn atoms. No multiple scattering paths were employed for shell-fits of Mn K-edge spectra. Mixed interactions for the first- and second-shell fits were attempted (i.e., both Mn–Mn and Mn–Cd contribution in second-shell fit of Mn K-edge data) and often led to improved fit results. Before the fitting of the actual sample spectra took place, the amplitude reduction factor, S02, was determined based on single-shell fit results of the well-crystalline reference model compounds CdS (Sigma Aldrich) for Cd K-edge spectra (S02 = 0.98) and hausmannite (ICSD ref. code 31094)90 for Mn K-edge spectra (S02 = 0.60), with their coordination numbers being fixed to theoretical values. The edge energy, ΔE0, was allowed to float for each sample during the fitting procedure of the first shell, but was kept constant for subsequent fittings of further shells of the same sample. Both the interatomic distance (R) and the Debye–Waller factor (σ2), which is a measure for thermal vibration and static disorder around a central atom, were first allowed to float. Thereafter, coordination numbers (CN) for each shell were determined, letting σ2 float and keeping R fixed. Following this procedure, shell by shell was refined with the goal to minimize the overall R-factor (a least-squared residual and goodness of fit factor) of the fits.
3. Results and discussion
Characterization of CdS nanoparticles formed at sulfide excess in the absence of NOM
The morphology, size, and aggregation state of the pure CdS nanoparticles formed in dilute (50 μmol L−1 Cd) suspensions at sulfide excess (Cd/S = 0.5) was examined in the absence of fulvic acid after 24 h equilibration. Recorded TEM images, corresponding primary particle size (PPS) and aggregate size (AS) distributions as well as determined median DLS sizes are shown in Fig. 1a and b. The primary particles of CdS were 7.4 nm (TEM) and arranged as aggregates of different size as indicated by a wide aggregate size distribution with a median TEM aggregate size of 167 nm. Large aggregates >1 μm made up about 10% (number of aggregates) in these batches. Dynamic light scattering measurements featured the presence of two aggregate size classes (bimodal distribution) with median hydrodynamic diameters of 59 nm and 222 nm. CdS particles formed open fractal aggregates, in which they often appeared fused together at connection points, without a clearly defined morphological shape of the primary particles.
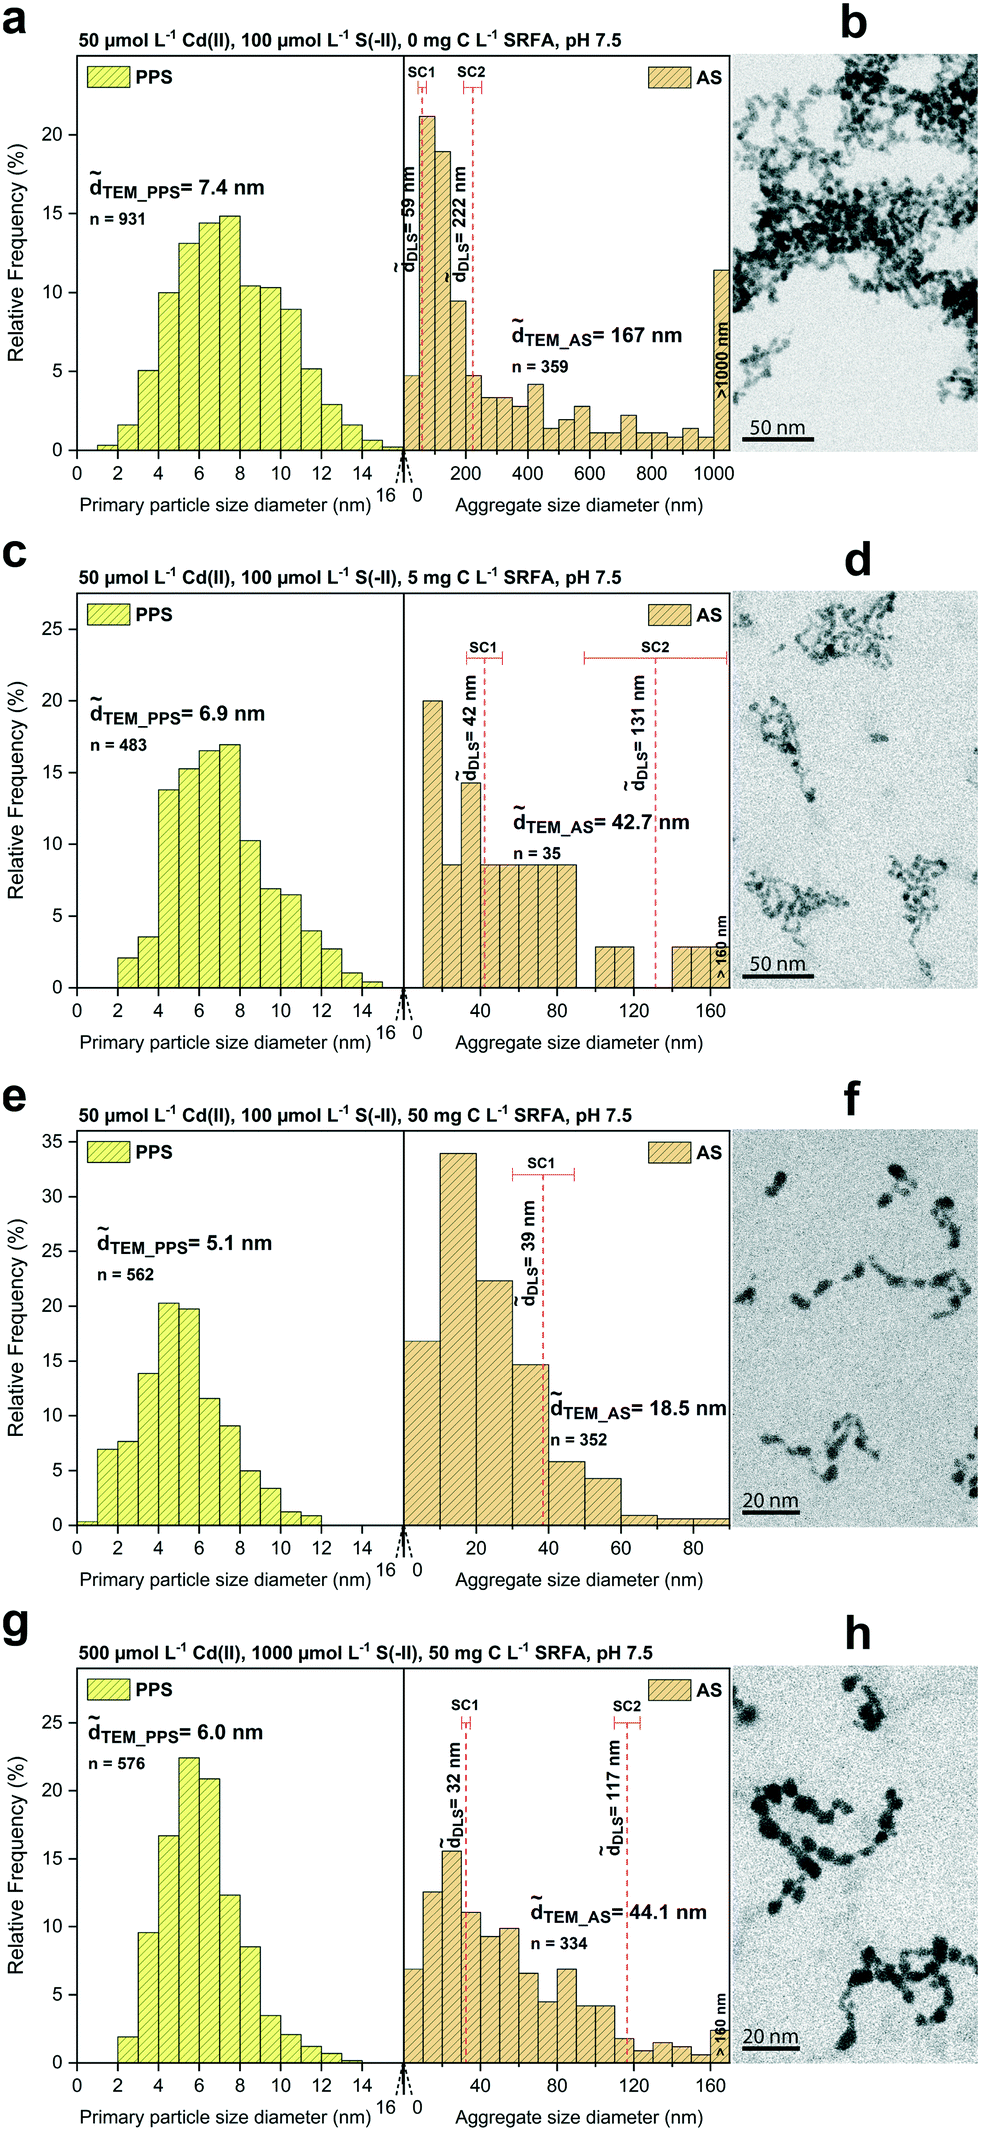 | ||
| Fig. 1 STEM primary particle size (PPS) and aggregate size (AS) distributions (a, c, e and g) of different CdS suspensions with median TEM diameters (TEM) and hydrodynamic diameters (h). Median hydrodynamic diameters (h) are shown in two considered size classes (SC1: smaller size class, SC2: larger size class). Selected HAADF-TEM images of the corresponding CdS nanoparticles are given in b, d, f and h (shown as inverted images). Panels a and b show CdS in the absence of fulvic acid. Samples in the presence of fulvic acid are shown in panels c and d (5 mg C L−1) and e and f (50 mg C L−1). A batch with a tenfold concentration of reactants is shown in g and h. Additional TEM images are depicted in Fig. S1.† | ||
Metal sulfide nanoparticles evolve from a multi-stage process, beginning as mononuclear metal (bi-)sulfide complex that forms immediately when metals and (bi-)sulfides react.38,91 Under the loss of water and protons, these complexes rapidly combine in solution to polynuclear metal sulfide clusters of sizes <1 nm,38 which constitute the building blocks of the nanoparticles. In this formation process, the actual supply rate of the reactants in the system is crucial for particle development.92,93 In the formation of CdS particles in our experiments, the reactant supply was not limited by kinetic constraints (e.g., template growth from other pre-existing mineral phases).93 Hence, the Cd2+ and (bi-)sulfide ions were readily available for cluster generation. This facilitates a faster assembly of the CdS nanoparticles. Fast reaction rates in the formation of nanoparticles without kinetic restrictions have been shown to cause the development of less crystalline structures and to provoke defects or dislocations in the crystal structure and even on the particle surface.92,94 Such defects can weaken the surface structure of a particle and affect the net total interaction surface energy, thereby (temporarily) inducing charge heterogeneity.95 Such sites increase the attachment efficiency of the particles, which would explain the aggregation tendency in our CdS suspensions despite a generally highly negative surface charge at sulfide excess (Fig. 2).
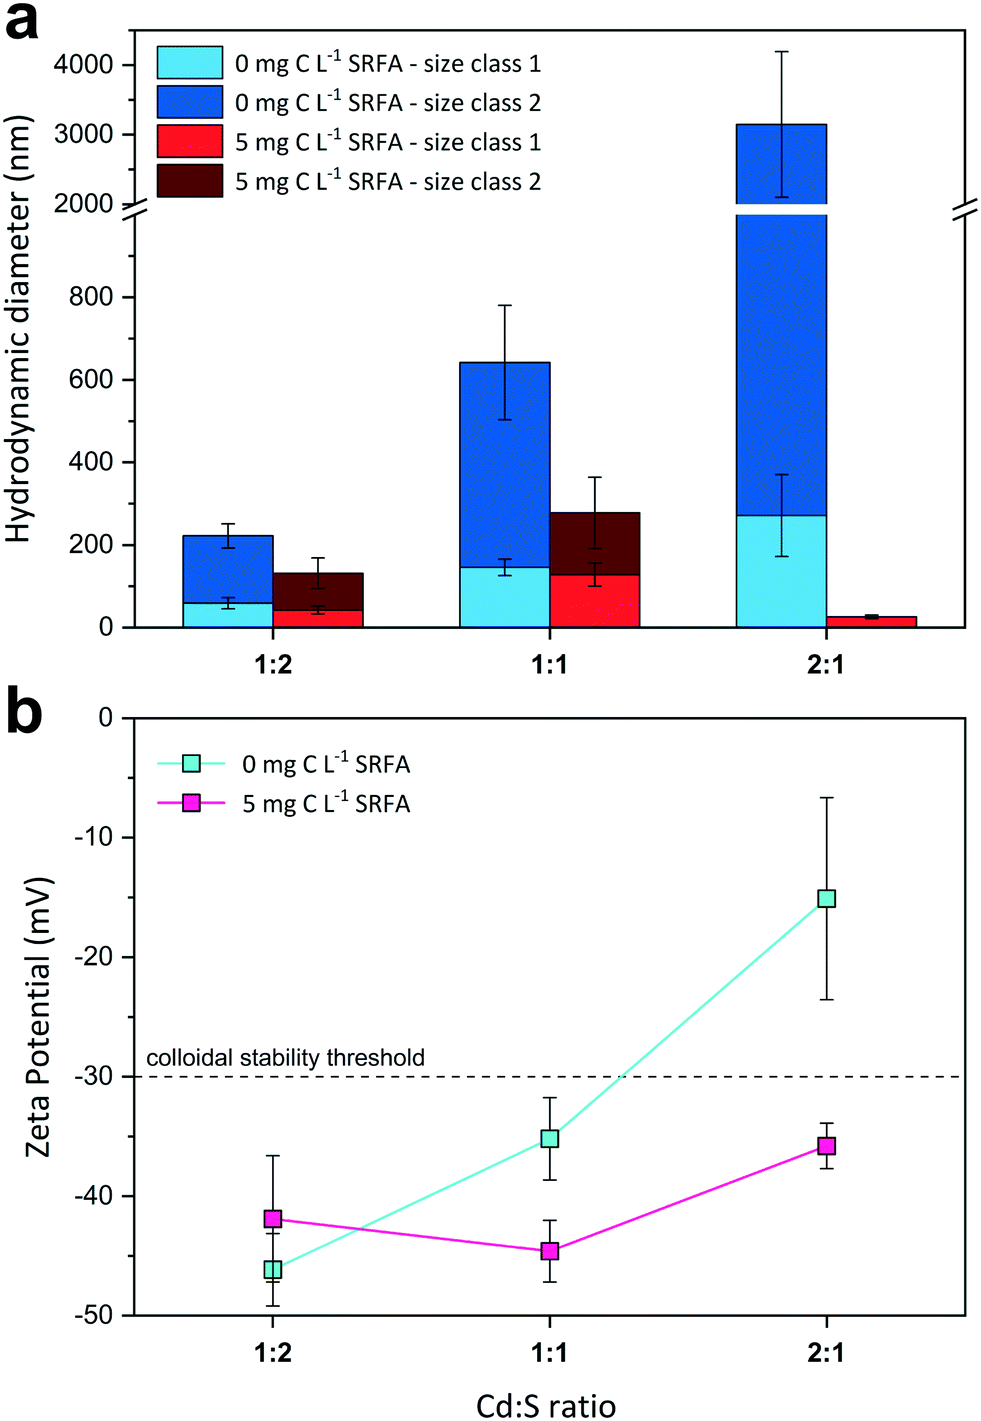 | ||
| Fig. 2 Influence of the molar metal-to-sulfide ratio on median hydrodynamic diameters h (a) and zeta potentials (b) of dilute CdS suspensions (50 or 100 μmol L−1 Cd(II) and 50 or 100 μmol L−1 S(−II)) at pH 7.5 and 10 mmol L−1 NaCl electrolyte after 24 h equilibration time. Due to bimodal size distributions of the NPs, two size classes were considered for size evaluation using the multi narrow mode algorithm in the DLS software. All values were compiled from at least two sample replicates (n = 2–5). The dashed line at −30 mV in (b) indicates the electrostatic colloidal stability threshold. | ||
In addition, there are several other processes that may be responsible for the observed aggregation. The protonation/deprotonation of functional groups at the surface of the particles influences their net surface charge. As for CdS, thiol (![[triple bond, length as m-dash]](https://www.rsc.org/images/entities/char_e002.gif) CdHS) and hydroxyl (CdOH) functionalities control their net surface charge depending on the pH of the suspension medium. The closer this pH value is to the point of zero charge (PZC) of the species, the thinner will be its electrical double layer (EDL) and the higher will be the attachment efficiency among particles. Reported PZCs for CdS range between pH 1–3.96–100 Nevertheless, specific sites or patches at the CdS surface (i.e., arising from crystal lattice imperfections near the surface or surface defect sites) can serve as spots for aggregation processes due to their surface functionalization (e.g., preferred CdOH sites).100 Already a low abundance (as expected in our suspensions, considering the ligand ratio of HS−/OH− ≫ 1) of such neutral or less negatively charged sites for a very short time period in the beginning of CdS formation would probably be sufficient to trigger aggregation. Even though zeta potentials for CdS suspensions at sulfide excess were highly negative in our study (Fig. 2), these measurements do not account for possible charge heterogeneity. Thus, such sensitive sites may also explain the aggregation tendency in our CdS suspensions at experimental pH of 7.5.
CdHS) and hydroxyl (CdOH) functionalities control their net surface charge depending on the pH of the suspension medium. The closer this pH value is to the point of zero charge (PZC) of the species, the thinner will be its electrical double layer (EDL) and the higher will be the attachment efficiency among particles. Reported PZCs for CdS range between pH 1–3.96–100 Nevertheless, specific sites or patches at the CdS surface (i.e., arising from crystal lattice imperfections near the surface or surface defect sites) can serve as spots for aggregation processes due to their surface functionalization (e.g., preferred CdOH sites).100 Already a low abundance (as expected in our suspensions, considering the ligand ratio of HS−/OH− ≫ 1) of such neutral or less negatively charged sites for a very short time period in the beginning of CdS formation would probably be sufficient to trigger aggregation. Even though zeta potentials for CdS suspensions at sulfide excess were highly negative in our study (Fig. 2), these measurements do not account for possible charge heterogeneity. Thus, such sensitive sites may also explain the aggregation tendency in our CdS suspensions at experimental pH of 7.5.
Furthermore, reported solubility products for CdS (e.g., greenockite, logKsp = −14.4 for Cd2+ + HS− → CdS(s) + H+)101,102 are several orders of magnitude higher than for other metal sulfides (corresponding logKsp for: CuS, covellite = −22.3; Ag2S, acanthite = −36.2; HgS, cinnabar = −45.7).101,102 At equivalent supersaturations, more soluble crystals (or less sparingly soluble crystals as for CdS) grow faster than sparingly soluble crystals.94 Accordingly, this increases the probability for dissolution and reprecipitation events. In this respect, it is essential that such events can repeatedly impair the surface integrity of a particle favoring the generation of surface defect sites, but conversely also accelerate the healing of such surface defects.94 Consequently, the surfaces of such particles can exhibit a very dynamic energy transfer regime.94,95
Moreover, imperfect surface structures, the degree of crystallinity near the particle surface as well as particle geometry (including surface curvature) have been shown to strongly influence short-range, non-DLVO forces (i.e., attractive hydration forces, hydrophilic/hydrophobic interactions).95 As such forces can be very strong (either attractive or repulsive, or even oscillatory) at short-range (sometimes by far exceeding the magnitude of common DLVO forces), they can sometimes be the determining factor for aggregation in a colloidal system.95 In addition, temporal charge heterogeneity (or charge non-uniformity) has been suggested to allow strong hydrophobic interactions between particles, which may also have occurred in our suspensions.103
All the aforementioned DLVO and non-DLVO forces acting on the surface of a particle have important consequences for the colloidal state of a suspension and can even notably differ between supposedly very similar systems. On that account, the striking difference between aggregating CdS suspensions from this study and well-dispersed CuxS suspensions of very high colloidal stability from an earlier study in our lab, both formed at the same conditions, can be conceived.93 For instance, a 7 nm small, irregularly-shaped particle with temporary surface defects (typical pure CdS nanoparticle in this study), and a 4 nm small, hexagonally-shaped particle without considerable surface imperfections (typical pure CuxS nanoparticle in our former study), both residing in the same solvent medium, will be subject to fairly different surface energy regimes.93,95
The effect of NOM on CdS nanoparticles at sulfide excess conditions
To investigate the effect of fulvic acid on the morphology and growth of CdS, we compared dilute (50 μmol L−1 Cd) SRFA-free with SRFA-containing suspensions after 24 h equilibration time at sulfide excess (Cd/S = 0.5, Fig. 1c and d, S2 and Table S3†). With 5 mg C per L SRFA present in the suspension, TEM median primary particle size of CdS decreased only slightly from 7.4 nm (no SRFA) to 6.9 nm. However, SRFA drastically lowered the tendency for aggregation, demonstrated by the much smaller aggregates found (TEM_AS = 42.7 nm, h_SC1 = 42 nm). Only very few aggregates >100 nm were observed in the TEM images. These were also represented in a corresponding second DLS size class (h_SC2 = 131 nm). Higher concentrations of SRFA (50 mg C per L) led to a further decrease in primary size of CdS NPs to 5.1 nm as well as in aggregate size to 18.5 nm (Fig. 1e and f). The second (larger) size class in the DLS data disappeared, thus matching the observed narrower aggregate size distribution. No aggregates >100 nm were found. Based on visual inspection, the fractal dimension of the aggregates decreased with increasing fulvic acid concentrations.
In our earlier study on CuxS nanoparticle formation, we found that chemical speciation of the metal ion in the precursor solution can control the reaction rate of the nucleating and growing particles via formation of intermediate phases, thus indirectly affecting final particle characteristics such as particle size.93 Therefore, we performed thermodynamic calculations on CdS suspensions in the absence and presence of SRFA to determine Cd speciation before sulfide addition. While in the SRFA-free suspensions, Cd2+ was predicted to be present predominantly as aqueous CdCl2 complex (Table S1a†), Cd2+ speciation was different at low (5 mg C per L) and high (50 mg C per L) SRFA concentration with 21% (Table S1b†) and 91% (Table S1c†) of the Cd present as Cd–SRFA-complex, respectively. No formation of intermediate solid phases was predicted. Despite this seemingly high stabilization potential from the SRFA for the subsequently formed CdS nanoparticles, aggregation was not completely inhibited. However, the effect of the SRFA on the CdS particles was reflected by a decrease in primary particle size suggesting a limiting mechanism to the growth of the CdS primary particles controlled by the SRFA concentration. On larger aggregates, SRFA prevented the aggregation of CdS into micron-sized precipitates (within the timeframe of the experiments in this study) and higher amounts of SRFA (50 mg C per L) were more effective in stabilizing small aggregates (<60 nm), mostly likely due to a decrease in attachment efficiencies.
In a previous study, we found a similar effect of SRFA in restricting the particle size of CuxS nanoparticles formed at the same experimental conditions as the CdS here.93 However, Cd2+ ions form much weaker complexes with fulvic acids than Cu2+,104–106 implying a less efficient capping of the CdS particle surface if surface complexation is assumed to be the only sorption mechanism. This weaker SRFA surface protection of CdS modulates the attachment efficiency in the suspension medium.40,61
Since some metal sulfide minerals exhibit natural hydrophobic characteristics under anoxic conditions,107,108 other sorption mechanisms based on hydrophobic interactions of non-polar particle surface patches with hydrophobic moieties of NOM may also contribute to the capping of the particle surface, especially in systems with a sulfide excess. Natural hydrophobicity among different metal sulfides has been a matter of debate for decades, also depending on predominating surface entities.107,109 While it is widely accepted that copper sulfide minerals possess a natural hydrophobicity,107,109 we found no study elaborating on the natural floatability of CdS phases. However, given the distinct differences in intrinsic hydrophobic properties reported between various metal sulfides,107,109,110 it can be expected that the degree of hydrophobic interactions differed between CdS nanoparticles in this study and CuxS in our earlier study, thus providing an additional explanation for the different aggregation behaviors.
Effect of reactant concentrations and ratios on CdS nanoparticles
TEM_PPS = 6.0 nm) remained comparable to the size observed in the diluted (50 μmol L−1 Cd) SRFA-containing (5 mg C per L) suspensions (TEM_PPS = 6.9 nm). Interestingly, also the aggregate size (TEM_AS = 42.7 nm vs. TEM_AS = 44.1 nm; h_SC1 = 42 nm vs. h_SC1 = 32 nm; h_SC2 = 131 nm vs. h_SC2 = 117 nm) was very similar in both TEM and DLS data of these batches (cf.Fig. 1cvs. g). Even the morphology of the aggregates looked almost identical (cf.Fig. 1dvs. h).
The terminal primary particle size of nanoparticles is strongly dependent on nucleus abundance at the very beginning of their formation. If the initial nucleus population is large, particle size at the end of the main growth phase will be smaller, and vice versa.92 In that respect, the degree of supersaturation determines how many nuclei are formed at initial stages. The difference in calculated supersaturations between dilute and concentrated SRFA-containing suspensions with respect to CdS formation was predicted to be rather small (difference <0.7 units in the saturation index). Hence, in both systems, the growth of CdS NPs started at a similar nuclei number, conforming to the similar primary particle sizes observed in these suspensions. All dissolved Cd2+ and HS− were readily available, so that formation of the CdS particles in this study most likely proceeded immediately. This is supported by various TEM images showing particles within the aggregates fused together, indicating that the processes of nucleus formation, nanoparticle growth and aggregation have occurred almost simultaneously and were not temporally decoupled. As seen in the previous section and also in other studies on metal sulfides, the presence of SRFA functional groups available for capping of the metal sulfide surfaces will additionally affect the terminal size of the particles.72,93 The proportion of Cd present as SRFA–Cd complexes before the initiation of particle formation (before sulfide addition) was predicted to be 21% in dilute and 35% in concentrated suspensions. In both suspensions, this would require similar fractions of SRFA sites for Cd2+ complexation (16.2% in dilute and 18.4% in concentrated suspensions). Accordingly, these rather small differences in predicted Cd speciation with respect to SRFA are consistent with the small variations in observed CdS particle sizes and the small differences in limiting aggregate size.
:2, 1:1, and 2:1) on CdS size and surface charge was evaluated for SRFA-free and SRFA-containing suspensions after 24 h equilibration (Fig. 2, Table S3†). In the absence of SRFA, an excess of the metal over sulfide favored aggregation of CdS NPs as the hydrodynamic diameters increased from h_SC1 = 59 nm and h_SC2 = 222 nm for 1:2 metal-to-sulfide stoichiometry to h_SC1 = 271 nm and h_SC2 > 3000 nm for 2:1 stoichiometry (Fig. 2a). Concomitantly, zeta potential values became less negative from −46.2 mV to −15.1 mV with increasing Cd concentration (Fig. 2b), with the latter value even exceeding the electrostatic suspension stability threshold of −30 mV.111,112 The presence of only 5 mg C per L SRFA counteracted this effect and substantially diminished aggregation tendency, with the 2:1 variant exhibiting the smallest aggregates (h_SC1 = 26 nm, TEM = 34.9 nm) (Fig. 2a and S3c and d†). Irrespective of the metal-to-sulfide ratio, zeta potentials now remained highly negative between −44.6 mV and −35.8 mV (Fig. 2b).
Very few studies have suggested reaction stoichiometry in colloidal metal sulfide systems to exert an effect on particle characteristics.41,113 In the absence of an additional capping agent, terminating functional groups and the existence/abundance of adsorbed ions on the nanoparticle surface are responsible for its ultimate charge and thus stability. Suspensions rich in sulfide contain particles that are predominantly S-terminated on their surface. Additionally, remaining metal-terminated surface sites are effectively saturated by excess sulfide in suspension. Consequently, if deprotonated, these particles possess highly negative surface potentials, which exert repulsion forces on neighboring particles and aggregates, restricting aggregate growth (e.g., in the case of Cd:S < 1). On the other hand, an excess of metal ions in the suspension medium (e.g., Cd:S > 1) favors Cd-terminated surface sites (Cd2+) and additionally leads to adsorption of excess Cd2+ ions on residual sulfur-terminated sites (CdS− + Cd2+ = Cd–S–Cd+). This greatly lowers the relative charge contribution of such negative sites to the total surface charge and reduces the total negative charge by transforming these sites into positive patches. Moreover, further excess Cd2+ ions compress the EDL of the CdS particles. By this means, zeta potential becomes less negative (Fig. 2b) and attachment efficiency increases dramatically as seen in the formation of very large aggregates. Aggregates at stoichiometric concentrations (Cd:S = 1) showed intermediate sizes and zeta potentials compared to Cd-excess and Cd-deficient suspensions. In such suspensions, the particle surface is neither altered by sulfide anions nor by cadmium cations, resulting in a surface charge that is not severely modified by these strongly adsorbing ions, therefore reflecting the actual surface charge of a pure CdS particle. The presence of an organic stabilization agent such as fulvic acid strongly affected the colloidal stabilities of the suspensions (Fig. 2, red columns and symbols, Fig. S3†). With the dominance of Cd-terminated particle surface sites in suspensions with a metal excess, additional sites for complexation by affinity functional groups of the fulvic acid are available. In this way, more effective stabilization can be established. On the contrary, this surplus in complexation capacity for fulvic acid is lost in suspensions having an excess of bisulfide (Cd:S < 1), in which sulfur-terminated sites predominate. This explains the rather slight change in aggregate size and the constancy in zeta potential compared to the no-SRFA suspensions. Similar patterns were observed by Mullaugh and Luther III (2010) for CdS particles formed in the presence of thiolate molecules originating from a diverse set of organic agents.41
Influence of Mn2+ ions on colloidal stability of CdS suspensions
The effect of increasing Mn2+ concentrations on CdS size and surface charge was investigated at different SRFA concentrations (0, 5, 50 mg C per L) after 24 h equilibration (Fig. 3). With increasing Mn2+ concentration, CdS aggregates detected by DLS became larger when SRFA was absent (Fig. 3a) and zeta potentials moved towards less negative values, eventually passing over the −30 mV threshold (Fig. 3b). Mn2+ concentrations above 0.1 mmol L−1 caused a strong aggregation of the particles in these samples. A rather low fulvic acid concentration (5 mg C per L) could not keep zeta potential values within the strongly negative range upon Mn2+ additions above 0.5 mmol L−1, so that strong aggregation processes were still dominant. Only in the presence of 50 mg C per L SRFA, zeta potential values remained highly negative (between −46.9 mV and −34.0 mV) despite a Mn2+ addition up to 1 mmol L−1. Nonetheless, Mn2+ concentrations above 0.1 mmol L−1 provoked aggregation of CdS in these samples even though the particles did not grow larger than 1 μm after 24 h.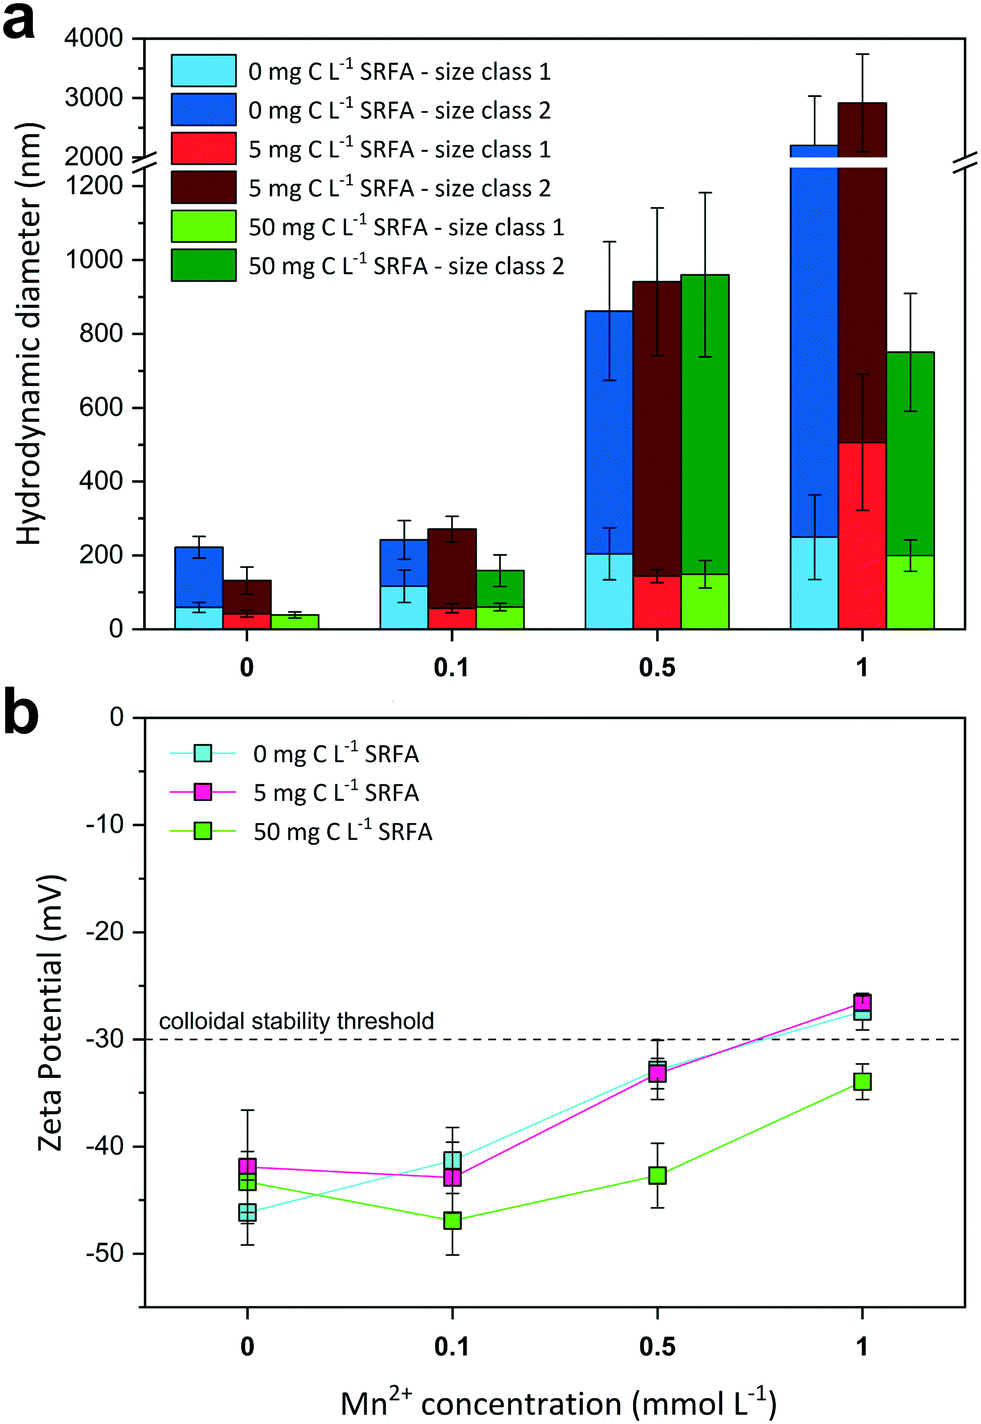 | ||
| Fig. 3 Influence of the Mn2+ concentration on median hydrodynamic diameters h (a) and zeta potentials (b) of dilute CdS suspensions (50 μmol L−1 Cd(II) and 100 μmol L−1 S(−II)) at pH 7.5 and 10 mmol L−1 NaCl electrolyte after 24 h equilibration time. Due to bimodal size distributions of the NP aggregates, two size classes were considered for size evaluation using the multi narrow mode algorithm in the DLS software. All values were compiled from at least two sample replicates (n = 2–5). The dashed line at −30 mV in (b) indicates the electrostatic colloidal stability threshold. | ||
In the absence of SRFA, the negative surface charge of the CdS NPs formed at sulfide excess is effectively diminished by Mn2+ ions in solution. Mn2+ exerts two distinct effects on the nanoparticle. Firstly, the electrical double layer repulsion force of the CdS particles is screened by the Mn2+ ions due to EDL compression. By this means, the total net interaction energy is shifted towards the attractive regime (dominance of van der Waals forces) so that approaching particles aggregate. Additionally, Mn2+ can adsorb onto the particle surface, preferably at negatively charged sulfidic sites, which are actively charge-reversed. Similar charge reversal effects in other colloidal systems have already been demonstrated for other divalent cations such as Ca2+.64,75 The critical coagulation concentration (CCC) for the CdS NPs lies between 0.1–0.5 mmol L−1 MnCl2. The DLS data suggest higher SRFA concentrations are necessary for effective competitive (against Mn2+ effect) particle stabilization. The surface coating of the CdS NPs caused by 5 mg C per L SRFA does not exert a pronounced stabilization effect when compared with the SRFA-absent samples. Identical zeta potential values for both sample series suggest that there is no charge stabilization by the NOM. A higher SRFA concentration (50 mg C per L) does indeed keep the zeta potential of the CdS particles more negative when Mn2+ concentrations increase, but particle size still increased when MnCl2 >0.1 mmol L−1, demonstrating that the zeta potential is not a sufficient measure for evaluating the colloidal stability in this case. A reason for particle growth not exceeding 1 μm in the highest Mn2+- and SRFA-including sample could be a steric stabilization mechanism of the fulvic acid. Even though steric stabilization is more likely for humic acids, a multilayering of fulvic acid molecules on the nanoparticle surface would create a repulsive shield protecting it from effective collisions.71
Influence of Mn2+ on CdS mineral phase composition
Energy dispersive X-ray (EDX) spectra and XRD results confirmed the expected elemental 1:1 stoichiometry of the CdS particles (Fig. S4†). The solution composition can affect the relative mass fractions of the precipitating phases. For this reason, we recorded X-ray diffractograms of selected CdS samples and examined via Rietveld fitting if the presence of SRFA and Mn2+ has altered the mineral phase composition in the CdS system over several weeks (Fig. 4a and S7†). This quantitative phase analysis (QPA) of the CdS suspensions revealed the existence of the two mineral phases hawleyite (cubic zinc-blende structure) and greenockite (hexagonal wurtzite structure) in slightly varying composition. Selected area diffraction patterns of the CdS suspensions confirmed these observations (Fig. S5†). In all samples, hawleyite was the dominant phase, with relative contributions of 67–84%. Except in one sample (CdS pure, 8 weeks aged), the shares of the two phases were very similar (77–84% hawleyite, 16–23% greenockite), irrespective of the aging time or the presence of SRFA or Mn2+. This finding is in accordance with a study of Heiba et al. (2015), reporting negligible impacts of Mn2+ ions on the crystal phase composition of Cd1−xMnxS.114
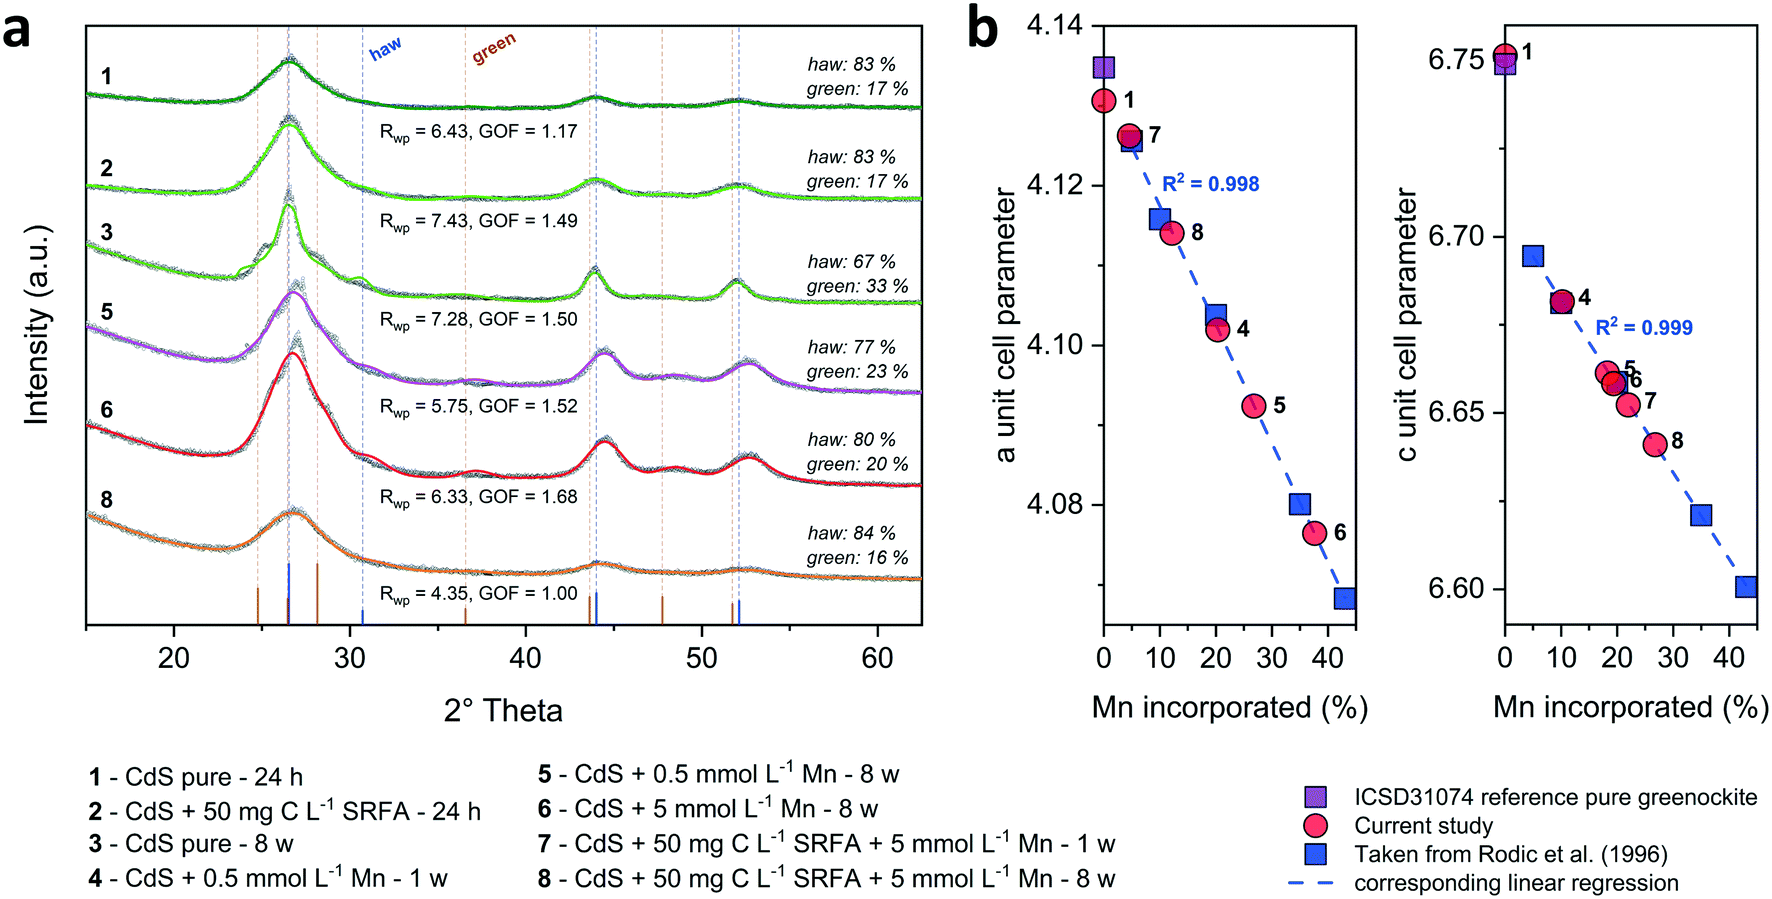 | ||
| Fig. 4 Recorded X-ray diffractograms (a) of CdS (concentrated suspensions at 1:2 metal-to-sulfide ratio: 500 μmol L−1 Cd(II) and 1000 μmol L−1 S(−II)) in the absence or presence of 50 mg C per L SRFA and different Mn2+ concentrations (0.5 and 5 mmol L−1) shown as gray symbols and corresponding quantitative phase analysis (QPA) using Rietveld fits (colored lines). Individual indicators for fit quality (Rwp and GOF) are given below and relative composition of the minerals hawleyite (haw) and greenockite (green) is shown on the right side of the respective sample diffractogram. Goodness of fit (GOF) is defined as Rwp/Rexp. The bottom part of (a) illustrates the major reflections (with their relative intensities) of the CdS phases hawleyite and greenockite. Dashed lines originating from these reflections show the peak matching with the recorded diffractograms. In panel (b), the correlation between the a and c unit cell dimensions of the mineral greenockite, and the percentage of moles of Cd substituted by Mn (= Mn incorporated) in the crystal structure of CdS samples that were incubated with Mn2+ from a study of Rodic et al. (1996),130 is shown in blue squares. The corresponding linear regression is represented by the blue dotted line. Unit cell dimensions from selected samples of this study were projected onto the regression line (red circles) to evaluate a potential Mn incorporation range in our samples. For the sake of clarity, numbers were assigned to the samples. Corresponding sample composition can be withdrawn from the list underneath the diagrams. | ||
Incorporation of Mn into the crystal structure of CdS
Before focusing on a potential incorporation of Mn into the crystal structure of the CdS particles, we determined the amount of Mn that was associated with the CdS (either adsorbed to the CdS surface, incorporated into crystal structure or co-precipitated with CdS). For that purpose, we incubated individual samples at two different Mn2+ concentrations (0.5, 5 mmol L−1) which was added to the reacting suspension for 1 and 8 weeks in the absence and presence of SRFA (Fig. S6†). In SRFA-free samples, a Mn2+ spike concentration of 0.5 mmol L−1 resulted in 29.4 ± 0.1% Mn associated (Mnas) with the CdS particles relative to the total Cd (Mnas = (Mn/(Cd + Mn)) × 100; hence, 70.6 ± 0.1% Cd) within the CdS solid after 1 week. When the Mn2+ spike concentration was increased to 5 mmol L−1, this amount rose to 46.2 ± 0.2% Mn after 1 week and decreased after 8 weeks to 40.0 ± 0.3%. When compared to the respective samples reacted in the presence of additional 50 mg C per L SRFA, the fraction of Mn associated with CdS was smaller after 1 (41.2 ± 0.2%) and 8 weeks (37.6 ± 0.1%). In this context, several studies have underlined the importance of adsorption of divalent cations (e.g., Mn2+, Ni2+) onto metal sulfide surfaces between pH 6–7.5.115,116 For instance, Arakaki and Morse (1993) suggested that adsorption of Mn2+ onto mackinawite (FeS) phases dominates over co-precipitation of MnS phases in sulfidic solutions at circumneutral pH, thus making the relatively high Mn/Cd ratios in our digested samples plausible.116 However, our solid digestion data only proved that a certain fraction of the total spiked Mn was somehow associated with the CdS solid phase, without providing any information if this Mn was adsorbed to the surface, incorporated into the crystal structure of CdS or present in a co-precipitated secondary phase.Combining the Mn/Cd ratios determined from solid digestion data (Fig. S6†) and the amount of Mn that was potentially incorporated into the CdS crystal structure (inferred from consulting the study results of Rodic et al. (1996),130Fig. 4 and Table S4†) in a semi-quantitative approach (ESI† section 10, Table S5), suggests that a considerable portion of Mn is adsorbed to the CdS surface in the samples with a lower initial Mn concentration (0.5 mmol L−1) after 1 week (30–61%). In samples with higher initial Mn concentration, this relative fraction of adsorbed Mn is smaller (6–49%).
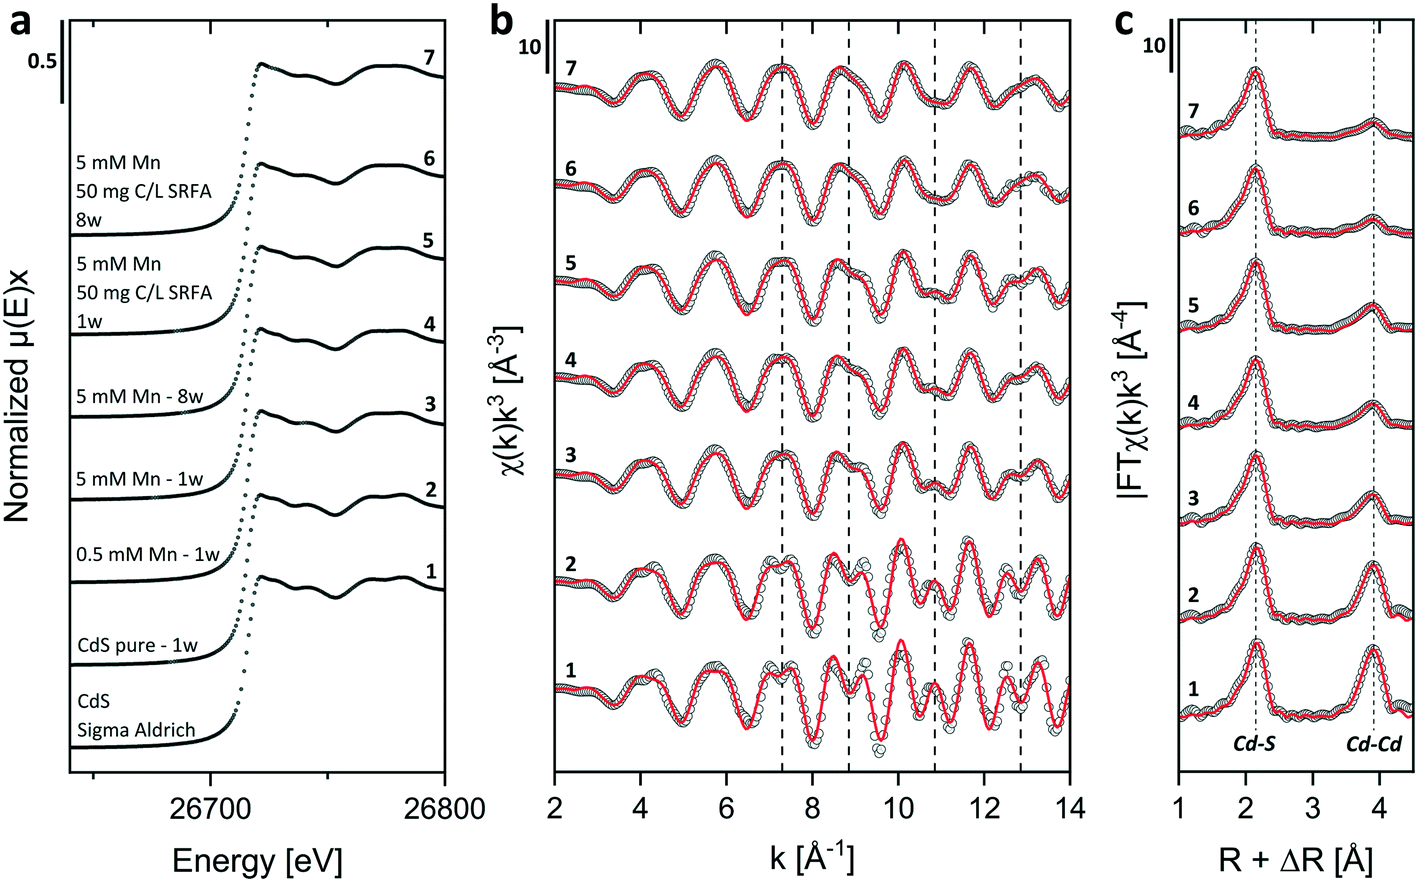 | ||
| Fig. 5 Cd K-edge XANES (a) and k3-weighted EXAFS (b) spectra and Fourier-transform magnitudes (c) of concentrated colloidal CdS suspensions (500 μmol L−1 Cd(II) and 1000 μmol L−1 S(−II)) formed in the absence and presence of Mn2+ (0.5 and 5 mmol L−1) and SRFA (50 mg C per L) at pH 7.5 in 10 mmol L−1 NaCl electrolyte after different aging times (numbers 2–7) compared to the spectra of a crystalline CdS Sigma Aldrich reference (number 1). In (b and c) open circles represent experimental data and red lines designate the respective model fits. Dotted lines in (b) serve as orientation for comparing oscillations among data and in (c), they mark the R + ΔR values of coordination shell peaks. The slight misfit in reference CdS (Sigma Aldrich) is due to the fact that only 2 paths were fitted to this crystalline phase. | ||
We performed shell fit analyses of k3-weighted Cd K-edge EXAFS spectra to gain insights into atomic distances and coordination numbers (CN) in different samples. Since our XRD analyses identified hawleyite (cubic zinc-blende CdS) as the major mineral phase in the samples, we used this phase as input structure for creating scattering paths for the shell fits. Our basic fit model comprised two single scattering paths (Cd–S and Cd–Cd with nominal coordination numbers of 4 and 12, as well as nominal path lengths of 2.525 Å and 4.124 Å, respectively) and two multiple scattering paths (Cd–S–S and Cd–S–Cd with nominal path degeneracies CN = 12 and 24, respectively, both with a nominal path length to the central Cd atom of 4.59 Å). Multiple scattering path parameters were linked to those used for the Cd–S and Cd–Cd shells. Including the multiple scattering paths consistently improved the fits. Results of these shell fits are shown in Fig. 5 and corresponding parameters are listed in Table 1. Cd–S path lengths around 2.52 Å, indicative of Cd in tetrahedral coordination in the hawleyite structure, were found in all samples and agreed well with those determined for CdS reference compounds (R = 2.53 Å).133 For the second shell, fitted interatomic Cd–Cd distances between 4.11–4.12 Å for Mn-containing samples corresponded well with those determined in pure CdS, reference CdS (Table 1) and colloidal CdS from other studies (4.10–4.15 Å).132,134 The already mentioned reduction in magnitude of the second shell in Mn-containing samples coincided with a decrease in fitted CNs for this shell from 11.1 ± 0.8 Å in reference Sigma Aldrich bulk CdS, over 9.4 ± 0.7 Å in pure nano-CdS to 6.7 ± 0.7 Å (averaged CN value of Mn-containing samples ± σ) in suspensions spiked with Mn2+. Since our measurements were conducted at 20 K, a temperature dependency of the Cd–Cd shell peak intensity as found in a study of Rockenberger et al. (1997) can be excluded.132 The decrease in peak intensity of the second shell and consequently the decrease in fitted CNs has been shown to depend on particle size.132,134 This explains the difference in the second shell CNs between our pure nano-CdS and the bulk CdS reference, which at the same time served to set the influence level of size dependency for all other samples. Since the primary particle size in Mn-spiked CdS samples was <10 nm (Fig. S10†) and comparable to pure nano CdS, all differences in CNs between the pure nano-CdS and the Mn-containing CdS suspensions must be due to another reason. A potential Cd–Mn path contribution to the backscattering signal in the second shell would be difficult to see since Mn is a much weaker backscatterer than Cd, especially in the higher k-range.135,136 Hence, we suspect the missing intensity portion of the second shell peaks in all Mn-containing CdS samples to be caused by a reduced occupancy of Cd atoms in the crystal structure of hawleyite, which would be a strong hint for their substitution by Mn atoms.
| No. | Aging time | SRFA (mg C per L) | Mn2+ (mmol L−1) | Path | σ 2 (Å2) | CN | R (Å) | ΔE0 (eV) | R factor | Redχ2 |
|---|---|---|---|---|---|---|---|---|---|---|
| 1 | Sigma Aldrich | 0 | 0 | Cd–S | 0.003 | 4.06 ± 0.14 | 2.530 | 9.6 | 0.011 | 248 |
| Cd–Cd | 0.006 | 11.11 ± 0.76 | 4.131 | |||||||
| 2 | 1 w | 0 | 0 | Cd–S | 0.003 | 4.03 ± 0.10 | 2.523 | 9.4 | 0.010 | 563 |
| Cd–Cd | 0.006 | 9.44 ± 0.71 | 4.131 | |||||||
| 3 | 1 w | 0 | 0.5 | Cd–S | 0.003 | 3.97 ± 0.06 | 2.520 | 9.1 | 0.008 | 212 |
| Cd–Cd | 0.006 | 6.83 ± 0.65 | 4.120 | |||||||
| 4 | 1 w | 0 | 5 | Cd–S | 0.003 | 3.98 ± 0.06 | 2.520 | 8.9 | 0.007 | 167 |
| Cd–Cd | 0.007 | 6.85 ± 0.64 | 4.119 | |||||||
| 5 | 8 w | 0 | 5 | Cd–S | 0.004 | 3.96 ± 0.06 | 2.519 | 9.2 | 0.008 | 146 |
| Cd–Cd | 0.007 | 6.41 ± 0.69 | 4.118 | |||||||
| 6 | 1 w | 50 | 5 | Cd–S | 0.004 | 3.95 ± 0.06 | 2.517 | 8.6 | 0.007 | 87 |
| Cd–Cd | 0.009 | 6.68 ± 0.68 | 4.113 | |||||||
| 7 | 8 w | 50 | 5 | Cd–S | 0.004 | 3.97 ± 0.06 | 2.518 | 8.9 | 0.006 | 234 |
| Cd–Cd | 0.009 | 6.53 ± 0.66 | 4.114 |
To corroborate this statement, we analyzed selected Mn-containing CdS samples additionally at the Mn K-edge. The corresponding XANES and EXAFS spectra of these nanoparticulate CdS suspensions incubated with Mn2+ (0.5 and 5 mmol L−1) and SRFA (50 mg C per L) are shown in Fig. 6 and S11.† The XANES spectra as well as oscillation patterns in k-space clearly differed in samples containing SRFA from those without SRFA. In CdS suspensions containing Mn, but no SRFA, the first peak in the Fourier transform at R + ΔR ∼1.95 Å (not phase-shift corrected) is attributable to the first S neighbors of Mn.128 On the contrary, in samples containing SRFA, this first peak has a different shape and magnitude, and is additionally slightly shifted towards smaller R + ΔR values, suggesting a mixed contribution of Mn–O and Mn–S in this first shell.128,137 Samples without SRFA featured a second peak at R + ΔR ∼3.5 Å (uncorrected for phase-shift), potentially resulting from a mixed contribution of Mn–Mn and Mn–Cd scattering paths, especially if partial Mn substitution is assumed.128 Interestingly, this second shell was lacking when SRFA was present.
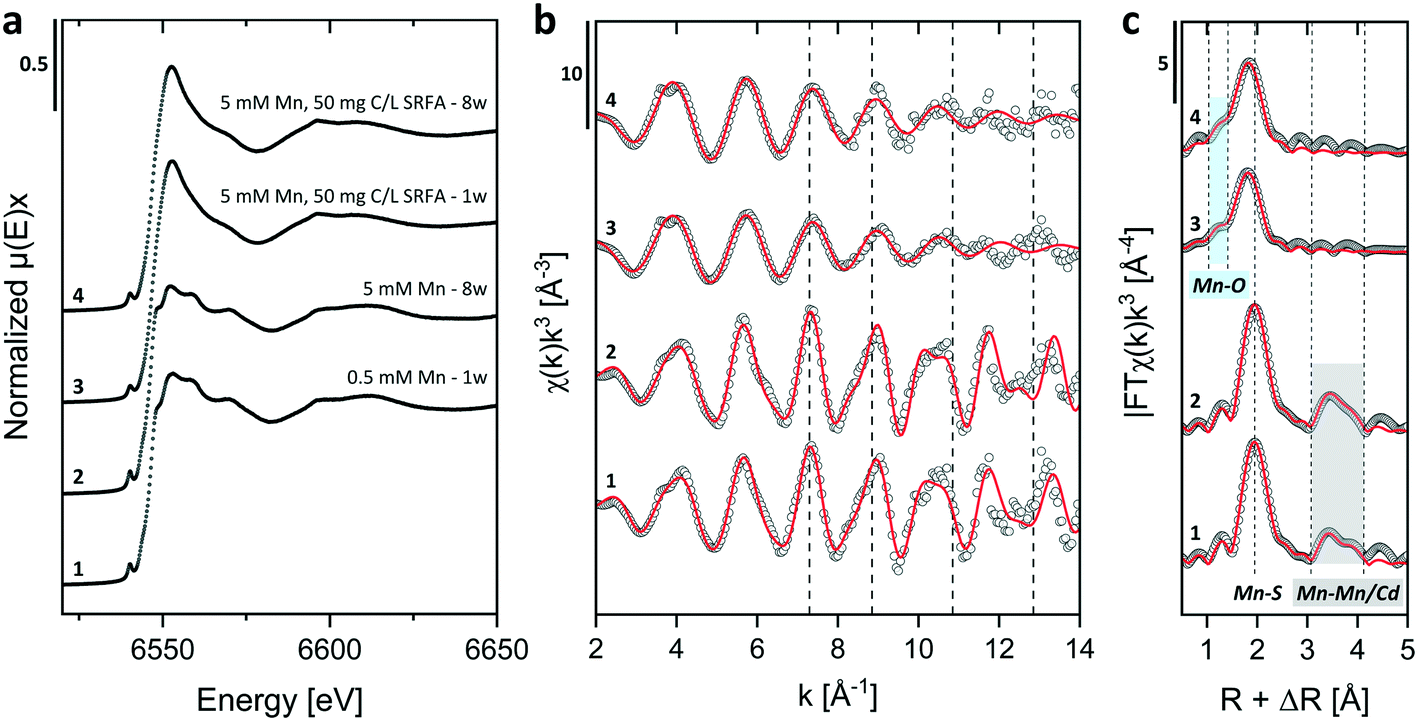 | ||
| Fig. 6 Mn K-edge XANES (a) and k3-weighted EXAFS (b) spectra and Fourier-transform magnitudes (c) of concentrated colloidal CdS suspensions (500 μmol L−1 Cd(II) and 1000 μmol L−1 S(−II)) containing Mn2+ (0.5 and 5 mmol L−1) and formed in the absence and presence of SRFA (50 mg C per L) at pH 7.5 in 10 mmol L−1 NaCl electrolyte after different aging times. In (b and c) open circles represent experimental data and red lines designate the respective model fits. Dotted lines in (b) serve as orientation for comparing oscillations among data and in (c), they mark the R + ΔR values of coordination shell peaks. | ||
To gain quantitative information on the local coordination environment of Mn in the samples, we performed shell fits with the k3-weighted Mn K-edge EXAFS spectra using a fit model for the samples without SRFA that contained three single scattering paths (Mn–S, Mn–Mn, Mn–Cd) based on a modified hawleyite structure in which Cd atoms were partially substituted by Mn atoms in the second shell scattering path (e.g., 2 out of 12 Cd replaced by Mn). An attempt to implement a Mn–O path into the shell fit models for samples without SRFA gave indifferent results to models only using the Mn–S path (not shown). For SRFA-containing samples, we used two single scattering paths (Mn–O, Mn–S) to fit the first shell (Mn–O path based on a manganosite structure, ICSD ref. code 53928).138 The fit results and corresponding fit parameters are shown in Fig. 6 and Table 2. In samples absent in SRFA, the first-shell S atoms were fitted at 2.42 Å, an interatomic distance shorter than a typical Cd–S distance in a hawleyite crystal and rather corresponding to the Mn–S distance usually found in rambergite (γ-MnS, ICSD ref. code 643455),139 thus supporting the hypothesis of a crystal lattice contraction in CdS caused by Mn incorporation. In the second shell of these samples, the Mn–Mn and Mn–Cd paths were fitted at 3.95 Å and 4.12–4.16 Å, respectively. While the Mn–Cd path distance agreed within error with those in the hawleyite crystal structure, the distinctly shorter Mn–Mn interatomic distance accords with those found in rambergite minerals. Fitted CNs close to 4.0 for the first shell in these samples confirm the substitution of Cd by Mn in the CdS at the same lattice sites in tetrahedral coordination. Coordination numbers fitted for Mn–Mn paths in the second shell of these samples (no SRFA) were smaller for 0.5 mmol L−1 Mn (CN = 1.2 ± 0.6) than for 5 mmol L−1 Mn (CN = 4.1 ± 1.8) containing suspensions, which would correspond to a calculated Mn incorporation of 10 ± 5% and 34 ± 15%, respectively (if nominal CN = 12 for hawleyite is assumed). These values agreed within error with Mninc determined via the XRD unit cell dimension approach (Fig. 4, Table S4†). Since in our experiments Cd2+ and Mn2+ were already present when CdS formation was induced by HS− injection, the incorporation of Mn (as an impurity) into the CdS crystal lattice would usually be assumed to be mainly kinetically controlled. In this case, impurity ions compete with host ions for surface binding sites on the forming nanocrystal and are internalized via so-called crystal lattice overgrowth, as opposed to internalization via diffusion of adsorbed surface ions into the crystal lattice as typical under thermodynamic control.140 Additionally, there is evidence that doping of Mn2+ into chalcogenide semiconductors is rather difficult under thermodynamically controlled conditions (at elevated temperatures) and even considered negligible for colloidal growth at room temperatures.140 However, Erwin et al. (2005) stressed that the diffusion of Mn2+ ions via (001) facets of crystals with zinc-blende structure are an exception to this rule as they exhibit far larger binding energies (by factors of 2–10), thus increasing the residence time of the adsorbed ion on the surface and consequently facilitating diffusion into the semiconductor nanocrystal.141 In this respect, our fit results suggest an increasing Mn substitution quantity with increasing Mn spike concentrations when SRFA is absent in the initial CdS suspensions and support the opposing trend of the decreasing amount of adsorbed Mn with increasing Mn spike concentrations as indicated by our calculations on solid digestion and XRD unit cell dimension data (Table S5†).
| No. | Aging time | SRFA (mg C per L) | Mn2+ (mmol L−1) | Path | σ 2 (Å2) | CN | R (Å) | ΔE0 (eV) | R factor | Redχ2 |
|---|---|---|---|---|---|---|---|---|---|---|
| 1 | 1 w | 0 | 0.5 | Mn–S | 0.003 | 4.02 ± 0.10 | 2.420 | −1.9 | 0.007 | 188 |
| Mn–Mn | 0.002 | 1.23 ± 0.62 | 3.950 | |||||||
| Mn–Cd | 0.04 | 9.32 ± 2.04 | 4.122 | |||||||
| 2 | 8 w | 0 | 5 | Mn–S | 0.003 | 4.09 ± 0.14 | 2.418 | −1.9 | 0.009 | 325 |
| Mn–Mn | 0.007 | 4.08 ± 0.51 | 3.945 | |||||||
| Mn–Cd | 0.04 | 8.63 ± 2.53 | 4.157 | |||||||
| 3 | 1 w | 50 | 5 | Mn–O | 0.045 | 6.00 | 2.103 | −8.3 | 0.004 | 287 |
| Mn–S | 0.009 | 4.00 | 2.375 | |||||||
| 4 | 8 w | 50 | 5 | Mn–O | 0.028 | 6.00 | 2.183 | −4.3 | 0.006 | 194 |
| Mn–S | 0.008 | 4.00 | 2.394 |
We first fitted the Mn K-edge EXAFS spectra of SRFA-containing samples with a model containing only one single scattering Mn–S path. However, the fit quality in these spectra was compromised as the first shoulder, visible in the first shell peak, was not adequately covered by only using the Mn–S path (Fig. S12, Table S7†). Given these results, we suspected a contribution of another scattering path in the first shell related to a complexation of Mn with functional groups of the SRFA. Therefore, we performed alternative shell fits for the SRFA-containing samples with fixed coordination numbers, which included an additional single Mn–O scattering path (Fig. 6, Table 2, Fig. S11†). Based on R-factors, this improved the fit quality by a factor of more than 2. First shell O atoms were fitted at distances of 2.10 Å (1 week sample) and 2.18 Å (8 weeks sample). Similar Mn–O distances ranging between 2.16–2.18 Å were found for Mn(II) complexed by carboxylic functional groups (such as malic and citric acids), which are commonly found in fulvic acids, as well as between 2.13–2.18 Å for organically complexed Mn(II) in foliar plant samples or around 2.05 ± 0.15 Å for Mn(II) bound to ATP or between 2.13–2.25 Å for Mn(II) in several different enzymatic complexes.142–144 Mn–O distances in higher oxidized Mn (e.g., Mn3+ or Mn4+) are usually found to be distinctively shorter (<2.00 Å) or even larger in some minerals (around 2.30 Å).145–147 Contrary to the samples without SRFA, fitted atomic distances for the first shell (Mn–S) were markedly shorter (2.38–2.39 Å) when SRFA was present in the Mn-containing CdS samples. The shortened average distances to the first S neighbor indicate that a part of the Mn could indeed be complexed to fulvic acid functional groups. Considering these fit results and that the second shell is entirely missing in the SRFA-containing samples suggests that most of the Mn in these samples is located outside of the CdS core and complexed by organic functional groups of the SRFA, either co-adsorbed to the CdS surface or present in a secondary Mn–SRFA phase. Hence, two mechanisms can be conceived by which the fulvic acid would inhibit Mn incorporation into the CdS crystal. Firstly, SRFA competes with Mn for adsorption sites on the CdS surface and secondly, the binding of Mn by the SRFA prevents further diffusion. In this way, SRFA acted as an ion doping quencher as it was already observed for several other surfactants.140,141
The calculations and extended discussion in the ESI† section 10 suggest that a large part of Mn in the SRFA-containing XAS samples (Fig. 6) was present as flocculated or precipitated Mn–SRFA and even dominated the spectra (coagulated Mn–SRFA fraction fivefold larger than Mn incorporated in the CdS structure). This would also match the observation of the disappearing second shell in the Mn K-edge Fourier transform data in all SRFA-containing samples. If adsorption of Mn in the SRFA-containing samples would have made up a mentionable portion in the XAS spectra, the coordination numbers in the shell fits would have tended towards lower values when let floated at constrained atomic distances. A model using this parameter setup (not shown) did not give any lowered CN values (relative to the nominal CN = 6 for the Mn–O scattering path and CN = 4 for the Mn–S scattering path), thus excluding substantial Mn adsorption onto the CdS surface as a process in SRFA-containing samples.
4. Environmental implications
In this study, we showed that increasing fulvic acid (representing NOM) concentrations restrict the primary particle and particularly the aggregate size of precipitating nano-sized CdS at low Cd2+ and sulfide concentrations, independent of the ratios of these reactants. Even though aggregation did also occur in the presence of fulvic acid after 24 h, stabilization against strong aggregation (ultimately leading to bulk CdS formation) was provided by the fulvic acid, most likely via surface complexation of fulvic acid functional groups, hydrophobic interactions at the particle surfaces and steric stabilization. As a consequence, the colloidal system was dominated by repulsive forces. When fulvic acid was absent or at low concentration, however, the metal-to-sulfide ratio and the presence of Mn2+ were critical for the colloidal stability of precipitating CdS nanoparticles due to a charge reversal of negatively charged sulfidic surface sites facilitated by increasing concentrations of the divalent cations. Furthermore, we found that the absolute concentration of the reactants in the suspension medium is not as important for CdS particle and aggregate size development or morphology as it is for other metal sulfides such as CuxS.93 The surface energy regime that led to the aggregation observed in this study could not be explained by classical DLVO-theory, not even for systems without fulvic acid, thus highlighting the challenge for adequate environmental fate prediction of such CdS nanoparticles. By using an asset of analytical techniques, we demonstrated that Mn(II) can substitute Cd(II) in the crystal lattice of CdS phases previously only known in non-aqueous synthetic suspensions. In this respect, we provided evidence for NOM being able to counteract the Mn incorporation process most likely by competing with Mn(II) for CdS sorption surface sites and sequestering Mn in secondary Mn(II)–SRFA phases at higher NOM concentrations. In order to transfer the knowledge gained in this study to more realistic scenarios, future investigations should include the effect of Ca2+ ions on CdS formation to consider its influence on colloidal stability and to address potential competition with NOM and Mn2+ for sorption sites on the CdS surface.Considering the wide range of organic matter concentrations found in different natural and agricultural systems, the importance of NOM for colloidal CdS has severe implications on their potential mobility in these environments. In sulfidic systems low in NOM with a high Cd background, Cd is likely to be immobilized in bulk sulfides, either in distinct CdS or mixed-metal sulfides if relevant concentrations of metals forming more insoluble phases are present (e.g., Cu(II) or Hg(II)). In contrast, environmental settings featuring high organic matter concentrations promote the mobility of small CdS aggregates and could be crucial for biogeochemical cycling of Cd in such systems. Our results suggest that during periods of prolonged waterlogging, the rising pore water concentrations of Mn(II) (as a result of the reductive dissolution of Mn(III/IV)-(oxyhydr)oxide phases) will increasingly suppress the enhanced mobility of CdS gained by the presence of NOM. In this regard, additional Mn inputs into these systems (e.g., application of Mn fertilizers in rice paddies) may further promote the immobilization of Cd. Nevertheless, respecting our previous findings on CuxS nanoparticles,93 the actual mobility of metal sulfides may also depend on the dominant chalcophile metal in the system, which will in turn determine the colloidal characteristics of the forming (mixed-)metal sulfide. Moreover, a larger Mn input would favor the incorporation of Mn into CdS, which might weaken the chemical stability of the nanoparticles (e.g., against oxidation), potentially resulting in a release of Cd into these systems.
Conflicts of interest
There are no conflicts of interest to declare.Acknowledgements
We acknowledge the Scientific Center for Optical and Electron Microscopy (Scope M) at ETH Zurich for providing access to their microscopes. We gratefully acknowledge SOLEIL (proposal no. 20180667) for providing access to their synchrotron radiation facilities and gratefully thank G. Landrot, E. Fonda and G. Alizon for their vital support during the measurements at the SAMBA beamline. We also thank N. Van Groeningen (Soil Chemistry Group, ETH Zurich) for the help and assistance during XAS measurements. Further, we are grateful to Kurt Barmettler and Brian Sinnet for their support in the laboratories at ETH Zurich and EAWAG. This research was funded by the Swiss National Science Foundation under the grant No. 200021_156392.References
- Y. Takijima and F. Katsumi, Cadmium contamination of soils and rice plants caused by zinc mining IV. Use of soil amendment materials for the control of Cd uptake by plants, Soil Sci. Plant Nutr., 1973, 19, 235–244 CrossRef CAS.
- K. A. Hudson-Edwards, M. G. Macklin, C. D. Curtis and D. J. Vaughan, Processes of formation and distribution of Pb-, Zn-, Cd-, and Cu-bearing minerals in the Tyne Basin, Northeast England: Implications for metal-contaminated river systems, Environ. Sci. Technol., 1996, 30, 72–80 CrossRef CAS.
- A. J. P. Smolders, R. A. C. Lock, G. Van der Velde, R. I. Medina Hoyos and J. G. M. Roelofs, Effects of mining activities on heavy metal concentrations in water, sediment, and macroinvertebrates in different reaches of the Pilcomayo River, South America, Arch. Environ. Contam. Toxicol., 2003, 44, 0314–0323 CrossRef CAS.
- S. Lee, Geochemistry and partitioning of trace metals in paddy soils affected by metal mine tailings in Korea, Geoderma, 2006, 135, 26–37 CrossRef CAS.
- S. Khaokaew, R. L. Chaney, G. Landrot, M. Ginder-Vogel and D. L. Sparks, Speciation and release kinetics of cadmium in an alkaline paddy soil under various flooding periods and draining conditions, Environ. Sci. Technol., 2011, 45, 4249–4255 CrossRef CAS.
- P. Byrne, P. Wood and I. Reid, The impairment of river systems by metal mine contamination: A review including remediation options, Crit. Rev. Environ. Sci. Technol., 2012, 42, 2017–2077 CrossRef CAS.
- R. W. Simmons, P. Pongsakul, D. Saiyasitpanich and S. Klinphoklap, Elevated levels of cadmium and zinc in paddy soils and elevated levels of cadmium in rice grain downstream of a zinc mineralized area in Thailand: Implications for public health, Environ. Geochem. Health, 2005, 27, 501–511 CrossRef CAS.
- L. Luo, Y. Ma, S. Zhang, D. Wei and Y.-G. Zhu, An inventory of trace element inputs to agricultural soils in China, J. Environ. Manage., 2009, 90, 2524–2530 CrossRef CAS.
- F.-J. Zhao, Y. Ma, Y.-G. Zhu, Z. Tang and S. P. McGrath, Soil contamination in China: Current status and mitigation strategies, Environ. Sci. Technol., 2015, 49, 750–759 CrossRef CAS.
- J. J. Mortvedt and G. Osborn, Studies on the chemical form of cadmium contaminants in phosphate fertilizers, Soil Sci., 1982, 134, 185–192 CrossRef CAS.
- C. Han, L. Wu, W. Tan, D. Zhong, Y. Huang, Y. Luo and P. Christie, Cadmium distribution in rice plants grown in three different soils after application of pig manure with added cadmium, Environ. Geochem. Health, 2012, 34, 481–492 CrossRef CAS.
- S. Uraguchi, S. Mori, M. Kuramata, A. Kawasaki, T. Arao and S. Ishikawa, Root-to-shoot Cd translocation via the xylem is the major process determining shoot and grain cadmium accumulation in rice, J. Exp. Bot., 2009, 60, 2677–2688 CrossRef CAS.
- A. Lux, M. Martinka, M. Vaculík and P. J. White, Root responses to cadmium in the rhizosphere: A review, J. Exp. Bot., 2010, 62, 21–37 CrossRef.
- R. L. Chaney, How does contamination of rice soils with Cd and Zn cause high incidence of human Cd disease in subsistence rice farmers, Curr. Pollut. Rep., 2015, 1, 13–22 CrossRef CAS.
- IARC, Agents classified by the IARC monographs, 2012 Search PubMed.
- N. Kōji, Y. Yuichi, H. Ryumon, I. Masao, T. Ikiko, K. Shunichi and K. Takashi, The relationship between itai-itai disease among inhabitants of the Jinzu river basin and cadmium in rice, Toxicol. Lett., 1983, 17, 263–266 CrossRef.
- C. Shiwen, Y. Lin, H. Zhineng, Z. Xianzu, Y. Zhaolu, X. Huidong, L. Yuanrong, J. Rongdi, Z. Wenhua and Z. Fangyuan, Cadmium exposure and health effects among residents in an irrigation area with ore dressing wastewater, Sci. Total Environ., 1990, 90, 67–73 CrossRef.
- Y. Qian, C. Chen, Q. Zhang, Y. Li, Z. Chen and M. Li, Concentrations of cadmium, lead, mercury and arsenic in Chinese market milled rice and associated population health risk, Food Control, 2010, 21, 1757–1763 CrossRef CAS.
- S. Clemens, M. G. M. Aarts, S. Thomine and N. Verbruggen, Plant science: The key to preventing slow cadmium poisoning, Trends Plant Sci., 2013, 18, 92–99 CrossRef CAS.
- A. A. Meharg, G. Norton, C. Deacon, P. Williams, E. E. Adomako, A. Price, Y. Zhu, G. Li, F.-J. Zhao, S. McGrath, A. Villada, A. Sommella, P. M. C. S. De Silva, H. Brammer, T. Dasgupta and M. R. Islam, Variation in rice cadmium related to human exposure, Environ. Sci. Technol., 2013, 47, 5613–5618 CrossRef CAS.
- Y. Song, Y. Wang, W. Mao, H. Sui, L. Yong, D. Yang, D. Jiang, L. Zhang and Y. Gong, Dietary cadmium exposure assessment among the Chinese population, PLoS One, 2017, 12(5), e0177978 CrossRef.
- H. Chen, W. Zhang, X. Yang, P. Wang, S. P. McGrath and F.-J. Zhao, Effective methods to reduce cadmium accumulation in rice grain, Chemosphere, 2018, 207, 699–707 CrossRef CAS.
- P. Hu, Z. Li, C. Yuan, Y. Ouyang, L. Zhou, J. Huang, Y. Huang, Y. Luo and P. Christie, and Wu, L., Effect of water management on cadmium and arsenic accumulation by rice (Oryza sativa L.) with different metal accumulation capacities, J. Soils Sediments, 2013, 13, 916–924 CrossRef CAS.
- G. Kirk, The biogeochemistry of submerged soils, John Wiley & Sons, 2004 Search PubMed.
- K. R. Reddy and R. D. DeLaune, Biogeochemistry of wetlands: Science and applications, CRC Press, 1st edn, 2008 Search PubMed.
- T. Borch, R. Kretzschmar, A. Kappler, P. Van Cappellen, M. Ginder-Vogel, A. Voegelin and K. Campbell, Biogeochemical redox processes and their impact on contaminant dynamics, Environ. Sci. Technol., 2010, 44, 15–23 CrossRef CAS.
- F.-A. Weber, A. Voegelin, R. Kaegi and R. Kretzschmar, Contaminant mobilization by metallic copper and metal sulphide colloids in flooded soil, Nat. Geosci., 2009, 2, 267–271 CrossRef CAS.
- A. F. Hofacker, A. Voegelin, R. Kaegi, F.-A. Weber and R. Kretzschmar, Temperature-dependent formation of metallic copper and metal sulfide nanoparticles during flooding of a contaminated soil, Geochim. Cosmochim. Acta, 2013, 103, 316–332 CrossRef CAS.
- A. F. Hofacker, A. Voegelin, R. Kaegi and R. Kretzschmar, Mercury mobilization in a flooded soil by incorporation into metallic copper and metal sulfide nanoparticles, Environ. Sci. Technol., 2013, 47, 7739–7746 CrossRef CAS.
- R. Chaney, J. A. Ryan, Y. Li, R. Welch, P. Reeves, S. Brown and C. Green, Phyto-availability and bio-availability in risk assessment for Cd in agricultural environments, Proceeding of OECD cadmium workshop,Stockholm, Sweden, 1995 Search PubMed.
- F. T. Bingham, A. L. Page, R. J. Mahler and T. J. Ganje, Cadmium availability to rice in sludge-amended soil under “flood” and “nonflood” culture, Soil Sci. Soc. Am. J., 1976, 40, 715–719 CrossRef CAS.
- T. Arao, A. Kawasaki, K. Baba, S. Mori and S. Matsumoto, Effects of water management on cadmium and arsenic accumulation and dimethylarsinic acid concentrations in Japanese rice, Environ. Sci. Technol., 2009, 43, 9361–9367 CrossRef CAS.
- S. E. Manahan, Environ. Chem., CRC Press LLC, 2000 Search PubMed.
- G. Du Laing, J. Rinklebe, B. Vandecasteele, E. Meers and F. M. Tack, Trace metal behaviour in estuarine and riverine floodplain soils and sediments: A review, Sci. Total Environ., 2009, 407, 3972–3985 CrossRef CAS.
- T. F. Rozan, G. Benoit and G. W. Luther III, Measuring metal sulfide complexes in oxic river waters with square wave voltammetry, Environ. Sci. Technol., 1999, 33, 3021–3026 CrossRef CAS.
- T. F. Rozan and G. Benoit, Geochemical factors controlling free Cu ion concentrations in river water, Geochim. Cosmochim. Acta, 1999, 63, 3311–3319 CrossRef CAS.
- T. F. Rozan, M. E. Lassman, D. P. Ridge and G. W. Luther III, Evidence for iron, copper and zinc complexation as multinuclear sulphide clusters in oxic rivers, Nature, 2000, 406, 879–882 CrossRef CAS.
- G. W. Luther III and D. T. Rickard, Metal sulfide cluster complexes and their biogeochemical importance in the environment, J. Nano. Res., 2005, 7, 389–407 CrossRef.
- B. Fulda, A. Voegelin and R. Kretzschmar, Redox-controlled changes in cadmium solubility and solid-phase speciation in a paddy soil as affected by reducible sulfate and copper, Environ. Sci. Technol., 2013, 47, 12775–12783 CrossRef CAS.
- R. Kretzschmar, M. Borkovec, D. Grolimund and M. Elimelech, Mobile subsurface colloids and their role in contaminant transport, Adv. Agron., 1999, 66, 121–193 CAS.
- K. M. Mullaugh and G. W. Luther III, Spectroscopic determination of the size of cadmium sulfide nanoparticles formed under environmentally relevant conditions, J. Environ. Monit., 2010, 12, 890–897 RSC.
- K. M. Mullaugh and G. W. Luther III, Growth kinetics and long-term stability of CdS nanoparticles in aqueous solution under ambient conditions, J. Nanopart. Res., 2011, 13, 393–404 CrossRef CAS.
- A. F. El-Baz, N. M. Sorour and Y. M. Shetaia, Trichosporon jirovecii–mediated synthesis of cadmium sulfide nanoparticles, J. Basic Microbiol., 2016, 56, 520–530 CrossRef CAS.
- M. Bruchez, M. Moronne, P. Gin, S. Weiss and A. P. Alivisatos, Semiconductor nanocrystals as fluorescent biological labels, Science, 1998, 281, 2013–2016 CrossRef CAS.
- R. Hardman, A toxicologic review of quantum dots: Toxicity depends on physicochemical and environmental factors, Environ. Health Perspect., 2006, 114, 165–172 CrossRef.
- A. G. Stanley, Cadmium sulfide solar cells, in Applied Solid State Science, ed. Wolfe, R., Elsevier, 1975, vol. 5, pp. 251–366 Search PubMed.
- K. W. Böer, Cadmium sulfide enhances solar cell efficiency, Energy Convers. Manage., 2011, 52, 426–430 CrossRef.
- W. Wang, I. Germanenko and M. S. El-Shall, Room-temperature synthesis and characterization of nanocrystalline CdS, ZnS, and CdxZn1−xS, Chem. Mater., 2002, 14, 3028–3033 CrossRef CAS.
- Y. Li, J. Du, S. Peng, D. Xie, G. Lu and S. Li, Enhancement of photocatalytic activity of cadmium sulfide for hydrogen evolution by photoetching, Int. J. Hydrogen Energy, 2008, 33, 2007–2013 CrossRef CAS.
- M. Liu, Y. Du, L. Ma, D. Jing and L. Guo, Manganese doped cadmium sulfide nanocrystal for hydrogen production from water under visible light, Int. J. Hydrogen Energy, 2012, 37, 730–736 CrossRef CAS.
- Y. Yang, Y. Zheng, W. Cao, A. Titov, J. Hyvonen, J. R. Manders, J. Xue, P. H. Holloway and L. Qian, High-efficiency light-emitting devices based on quantum dots with tailored nanostructures, Nat. Photonics, 2015, 9, 259–266 CrossRef CAS.
- P. Alivisatos, The use of nanocrystals in biological detection, Nat. Biotechnol., 2004, 22, 47–52 CrossRef CAS.
- W. C. W. Chan, D. J. Maxwell, X. Gao, R. E. Bailey, M. Han and S. Nie, Luminescent quantum dots for multiplexed biological detection and imaging, Curr. Opin. Biotechnol., 2002, 13, 40–46 CrossRef CAS.
- S.-H. Yu, J. Yang, Z.-H. Han, Y. Zhou, R.-Y. Yang, Y.-T. Qian and Y.-H. Zhang, Controllable synthesis of nanocrystalline CdS with different morphologies and particle sizes by a novel solvothermal process, J. Mater. Chem., 1999, 9, 1283–1287 RSC.
- X. Zhong, S. Liu, Z. Zhang, L. Li, Z. Wei and W. Knoll, Synthesis of high-quality CdS, ZnS, and ZnxCd1− xS nanocrystals using metal salts and elemental sulfur, J. Mater. Chem., 2004, 14, 2790–2794 RSC.
- U. Resch, A. Eychmueller, M. Haase and H. Weller, Absorption and fluorescence behavior of redispersible cadmium sulfide colloids in various organic solvents, Langmuir, 1992, 8, 2215–2218 CrossRef CAS.
- H. Y. Acar, R. Kas, E. Yurtsever, C. Ozen and I. Lieberwirth, Emergence of 2MPA as an effective coating for highly stable and luminescent quantum dots, J. Phys. Chem. C, 2009, 113, 10005–10012 CrossRef CAS.
- C. Barglik-Chory, C. Remenyi, H. Strohm and G. Müller, Adjustment of the band gap energies of biostabilized CdS nanoparticles by application of statistical design of experiments, J. Phys. Chem. B, 2004, 108, 7637–7640 CrossRef CAS.
- Y.-M. Mo, Y. Tang, F. Gao, J. Yang and Y.-M. Zhang, Synthesis of fluorescent CdS quantum dots of tunable light emission with a new in situ produced capping agent, Ind. Eng. Chem. Res., 2012, 51, 5995–6000 CrossRef CAS.
- L. Qi, H. Cölfen and M. Antonietti, Synthesis and characterization of CdS nanoparticles stabilized by double-hydrophilic block copolymers, Nano Lett., 2001, 1, 61–65 CrossRef CAS.
- M. Elimelech and C. R. O'Melia, Kinetics of deposition of colloidal particles in porous media, Environ. Sci. Technol., 1990, 24, 1528–1536 CrossRef CAS.
- C. L. Tiller and C. R. O'Melia, Natural organic matter and colloidal stability: Models and measurements, Colloids Surf., A, 1993, 73, 89–102 CrossRef CAS.
- M. Hassellöv and R. Kaegi, Analysis and characterization of manufactured nanoparticles in aquatic environments, in Environ. Human Health Imp. Nanotechnol., John Wiley & Sons, Ltd., 2009, pp. 211–266 Search PubMed.
- S. Wagner, A. Gondikas, E. Neubauer, T. Hofmann and F. von der Kammer, Spot the difference: Engineered and natural nanoparticles in the environment — release, behavior, and fate, Angew. Chem., Int. Ed., 2014, 53, 12398–12419 CAS.
- D. Grasso, K. Subramaniam, M. Butkus, K. Strevett and J. Bergendahl, A review of non-DLVO interactions in environmental colloidal systems, Rev. Environ. Sci. Biotechnol., 2002, 1, 17–38 CrossRef CAS.
- B. Derjaguin and L. Landau, Theory of the stability of strongly charged lyophobic sols and of the adhesion of strongly charged particles in solutions of electrolytes, Acta Physicochim. URSS, 1941, 14, 633–662 Search PubMed.
- E. Verwey and J. Overbeek, Theory of the stability of lyophobic colloids: The interaction of sol particles having an electric double layer, Elsevier, 1948 Search PubMed.
- F. Maurer, I. Christl and R. Kretzschmar, Reduction and reoxidation of humic acid: Influence on spectroscopic properties and proton binding, Environ. Sci. Technol., 2010, 44, 5787–5792 CrossRef CAS.
- J. T. K. Quik, I. Lynch, K. V. Hoecke, C. J. H. Miermans, K. A. C. D. Schamphelaere, C. R. Janssen, K. A. Dawson, M. A. C. Stuart and D. V. D. Meent, Effect of natural organic matter on cerium dioxide nanoparticles settling in model fresh water, Chemosphere, 2010, 81, 711–715 CrossRef CAS.
- H. Hyung, J. D. Fortner, J. B. Hughes and J.-H. Kim, Natural organic matter stabilizes carbon nanotubes in the aqueous phase, Environ. Sci. Technol., 2007, 41, 179–184 CrossRef CAS.
- R. F. Domingos, N. Tufenkji and K. J. Wilkinson, Aggregation of titanium dioxide nanoparticles: Role of a fulvic acid, Environ. Sci. Technol., 2009, 43, 1282–1286 CrossRef CAS.
- A. Deonarine and H. Hsu-Kim, Precipitation of mercuric sulfide nanoparticles in NOM-containing water: Implications for the natural environment, Environ. Sci. Technol., 2009, 43, 2368–2373 CrossRef CAS.
- A. J. Slowey, Rate of formation and dissolution of mercury sulfide nanoparticles: The dual role of natural organic matter, Geochim. Cosmochim. Acta, 2010, 74, 4693–4708 CrossRef CAS.
- A. Deonarine, B. L. Lau, G. R. Aiken, J. N. Ryan and H. Hsu-Kim, Effects of humic substances on precipitation and aggregation of zinc sulfide nanoparticles, Environ. Sci. Technol., 2011, 45, 3217–3223 CrossRef CAS.
- R. Kretzschmar, K. Barmettler, D. Grolimund, Y.-D. Yan, M. Borkovec and H. Sticher, Experimental determination of colloid deposition rates and collision efficiencies in natural porous media, Water Resour. Res., 1997, 33, 1129–1137 CrossRef CAS.
- R. Kretzschmar and H. Sticher, Transport of humic-coated iron oxide colloids in a sandy soil: Influence of Ca2+ and trace metals, Environ. Sci. Technol., 1997, 31, 3497–3504 CrossRef CAS.
- A. R. Petosa, D. P. Jaisi, I. R. Quevedo, M. Elimelech and N. Tufenkji, Aggregation and deposition of engineered nanomaterials in aquatic environments: Role of physicochemical interactions, Environ. Sci. Technol., 2010, 44, 6532–6549 CrossRef CAS.
- K. L. Chen, S. E. Mylon and M. Elimelech, Enhanced aggregation of alginate-coated iron oxide (hematite) nanoparticles in the presence of calcium, strontium, and barium cations, Langmuir, 2007, 23, 5920–5928 CrossRef CAS.
- M. Baalousha, Y. Nur, I. Römer, M. Tejamaya and J. R. Lead, Effect of monovalent and divalent cations, anions and fulvic acid on aggregation of citrate-coated silver nanoparticles, Sci. Total Environ., 2013, 454–455, 119–131 CrossRef CAS.
- A. V. Isarov and J. Chrysochoos, Optical and Photochemical Properties of Nonstoichiometric Cadmium Sulfide Nanoparticles: Surface Modification with Copper(II) Ions, Langmuir, 1997, 13, 3142–3149 CrossRef CAS.
- G. Counio, T. Gacoin and J. P. Boilot, Synthesis and photoluminescence of Cd1-xMnxS (x ≤ 5) nanocrystals, J. Phys. Chem. B, 1998, 102, 5257–5260 CrossRef CAS.
- K. Y. Chen and J. C. Morris, Kinetics of oxidation of aqueous sulfide by oxygen, Environ. Sci. Technol., 1972, 6, 529–537 CrossRef CAS.
- J. P. Gustafsson, Visual MINTEQ ver. 3.1, 2013 Search PubMed.
- M. Baalousha and J. R. Lead, Rationalizing nanomaterial sizes measured by atomic force microscopy, flow field-flow fractionation, and dynamic light scattering: Sample preparation, polydispersity, and particle structure, Environ. Sci. Technol., 2012, 46, 6134–6142 CrossRef CAS.
- M. Smoluchowski, Elektrische Endosmose und Strömungsströme, Pisma Mariana Smoluchowskiego, 1928, 3, 246–346 Search PubMed.
- T. Wagner, ij-particlesizer: Ver. 1.0.7, 2016, DOI:10.5281/zenodo.163568.
- F. Ulrich and W. Zachariason, Über die Kristallstruktur des alpha- und beta-CdS, sowie des Wurtzits, Z. Kristallogr., 1925, 62, 260–273 Search PubMed.
- B. Ravel and M. Newville, ATHENA, ARTEMIS, HEPHAESTUS: Data analysis for X-ray absorption spectroscopy using IFEFFIT, J. Synchrotron Radiat., 2005, 12, 537–541 CrossRef CAS.
- A. L. Ankudinov, B. Ravel, J. J. Rehr and S. D. Conradson, Real-space multiple-scattering calculation and interpretation of X-ray-absorption near-edge structure, Phys. Rev. B: Condens. Matter Mater. Phys., 1998, 58, 7565–7576 CrossRef CAS.
- G. Aminoff, Über die Kristallstruktur von Hausmannit (MnMn2O4), Z. Kristallogr., 1926, 64, 475–490 Search PubMed.
- J. M. Charnock, L. N. Moyes, R. A. Pattrick, J. F. W. Mosselmans, D. J. Vaughan and F. R. Livens, The structural evolution of mercury sulfide precipitate: An XAS and XRD study, Am. Mineral., 2004, 88, 1197–1203 CrossRef.
- J. W. Mullin, Crystallization, Elsevier, 2001 Search PubMed.
- K. Hoffmann, S. Bouchet, I. Christl, R. Kaegi and R. Kretzschmar, Effect of NOM on copper sulfide nanoparticle growth, stability, and oxidative dissolution, Environ. Sci.: Nano, 2020, 7, 1163–1178 RSC.
- J. J. De Yoreo and P. G. Vekilov, Principles of crystal nucleation and growth, Rev. Mineral. Geochem., 2003, 54, 57–93 CrossRef CAS.
- J. N. Israelachvili, Intermolecular and surface forces, Academic press, London, 3rd edn, 2011 Search PubMed.
- J. Bebie, M. A. Schoonen, M. Fuhrmann and D. R. Strongin, Surface charge development on transition metal sulfides: An electrokinetic study, Geochim. Cosmochim. Acta, 1998, 62, 633–642 CrossRef CAS.
- M. J. Dekkers and M. A. Schoonen, An electrokinetic study of synthetic greigite and pyrrhotite, Geochim. Cosmochim. Acta, 1994, 58, 4147–4153 CrossRef CAS.
- Y. Nicolau and J. Menard, An electrokinetic study of ZnS and CdS surface chemistry, J. Colloid Interface Sci., 1992, 148, 551–570 CrossRef CAS.
- J. D. G. Durán, M. C. Guindo, A. V. Delgado and F. González-Caballero, Surface chemical analysis and electrokinetic properties of synthetic spherical mixed zinc–cadmium sulfides, J. Colloid Interface Sci., 1997, 193, 223–233 CrossRef.
- J. Liu and C. Huang, Electrokinetic characteristics of some metal sulfide-water interfaces, Langmuir, 1992, 8, 1851–1856 CrossRef CAS.
- Allison Geoscience and V. Herndon, MINTEQA2/PRODEFA2, a geochemical assessment model for environmental systems: User manual supplement for version 4.0, 1998 Search PubMed.
- F.-A. Weber, A. Voegelin and R. Kretzschmar, Multi-metal contaminant dynamics in temporarily flooded soil under sulfate limitation, Geochim. Cosmochim. Acta, 2009, 73, 5513–5527 CrossRef CAS.
- D. Velegol and P. K. Thwar, Analytical model for the effect of surface charge nonuniformity on colloidal interactions, Langmuir, 2001, 17, 7687–7693 CrossRef CAS.
- I. Christl, C. J. Milne, D. G. Kinniburgh and R. Kretzschmar, Relating ion binding by fulvic and humic acids to chemical composition and molecular size. 2. Metal binding, Environ. Sci. Technol., 2001, 35, 2512–2517 CrossRef CAS.
- C. J. Milne, D. G. Kinniburgh, W. H. van Riemsdijk and E. Tipping, Generic NICA−Donnan model parameters for metal-ion binding by humic substances, Environ. Sci. Technol., 2003, 37, 958–971 CrossRef CAS.
- D. Gondar, R. López, S. Fiol, J. M. Antelo and F. Arce, Cadmium, lead, and copper binding to humic acid and fulvic acid extracted from an ombrotrophic peat bog, Geoderma, 2006, 135, 196–203 CrossRef CAS.
- M. C. Fuerstenau and B. J. Sabacky, On the natural floatability of sulfides, Int. J. Miner. Process., 1981, 8, 79–84 CrossRef CAS.
- A. V. Nguyen, Flotation, in Encycl. Separation Sci., ed. I. D. Wilson, Academic Press, Oxford, 2007, pp. 1–27 Search PubMed.
- N. K. Mendiratta, Kinetic studies of sulfide mineral oxidation and xanthate adsorption, PhD thesis, Virginia Tech, 2000 Search PubMed.
- C.-H. Zhao, J.-H. Chen, B.-Z. Wu and X.-H. Long, Density functional theory study on natural hydrophobicity of sulfide surfaces, Trans. Nonferrous Met. Soc. China, 2014, 24, 491–498 CrossRef CAS.
- S. Kumpulainen, F. von der Kammer and T. Hofmann, Humic acid adsorption and surface charge effects on schwertmannite and goethite in acid sulphate waters, Water Res., 2008, 42, 2051–2060 CrossRef CAS.
- F. Loosli and P. Le Coustumer, and Stoll, S., TiO2 nanoparticles aggregation and disaggregation in presence of alginate and Suwannee River humic acids. pH and concentration effects on nanoparticle stability, Water Res., 2013, 47, 6052–6063 CrossRef CAS.
- J. E. Evans, K. L. Jungjohann, N. D. Browning and I. Arslan, Controlled growth of nanoparticles from solution with in situ liquid transmission electron microscopy, Nano Lett., 2011, 11, 2809–2813 CrossRef CAS.
- Z. K. Heiba, M. B. Mohamed and N. G. Imam, Biphasic quantum dots of cubic and hexagonal Mn doped CdS; necessity of Rietveld analysis, J. Alloys Compd., 2015, 618, 280–286 CrossRef CAS.
- J. W. Morse and T. Arakaki, Adsorption and coprecipitation of divalent metals with mackinawite (FeS), Geochim. Cosmochim. Acta, 1993, 57, 3635–3640 CrossRef CAS.
- T. Arakaki and J. W. Morse, Coprecipitation and adsorption of Mn(II) with mackinawite (FeS) under conditions similar to those found in anoxic sediments, Geochim. Cosmochim. Acta, 1993, 57, 9–14 CrossRef CAS.
- D. J. Norris, N. Yao, F. T. Charnock and T. A. Kennedy, High-quality manganese-doped ZnSe nanocrystals, Nano Lett., 2001, 1, 3–7 CrossRef CAS.
- J. F. Suyver, S. F. Wuister, J. J. Kelly and A. Meijerink, Luminescence of nanocrystalline ZnSe:Mn2+, Phys. Chem. Chem. Phys., 2000, 2, 5445–5448 RSC.
- N. Pradhan and X. Peng, Efficient and color-tunable Mn-doped ZnSe nanocrystal emitters: Control of optical performance via greener synthetic chemistry, J. Am. Chem. Soc., 2007, 129, 3339–3347 CrossRef CAS.
- J. Cao, J. Yang, Y. Zhang, L. Yang, Y. Wang, M. Wei, Y. Liu, M. Gao, X. Liu and Z. Xie, Optimized doping concentration of manganese in zinc sulfide nanoparticles for yellow-orange light emission, J. Alloys Compd., 2009, 486, 890–894 CrossRef CAS.
- Q. Dang, G. Wen, C. M. Sorensen and K. J. Klabunde, Cadmium (zinc) manganese sulfide nanocrystalline (Cd1−xMnxS and Zn1−xMnxS) dilute magnetic semiconductors. Synthesis, annealing, and effects of surface oxidation on magnetic properties, Isr. J. Chem., 2001, 41, 63–68 CrossRef CAS.
- K. Sooklal, B. S. Cullum, S. M. Angel and C. J. Murphy, Photophysical properties of ZnS nanoclusters with spatially localized Mn2+, J. Phys. Chem., 1996, 100, 4551–4555 CrossRef CAS.
- Q. Xiao and C. Xiao, Synthesis and photoluminescence of water-soluble Mn2+−doped ZnS quantum dots, Appl. Surf. Sci., 2008, 254, 6432–6435 CrossRef CAS.
- M. A. Chamarro, V. Voliotis, R. Grousson, P. Lavallard, T. Gacoin, G. Counio, J. P. Boilot and R. Cases, Optical properties of Mn-doped CdS nanocrystals, J. Cryst. Growth, 1996, 159, 853–856 CrossRef CAS.
- N. Feltin, L. Levy, D. Ingert and M. P. Pileni, Magnetic properties of 4-nm Cd1−yMnyS nanoparticles differing by their compositions, y, J. Phys. Chem. B, 1999, 103, 4–10 CrossRef CAS.
- L. Levy, N. Feltin, D. Ingert and M. P. Pileni, Isolated Mn2+ in CdS quantum dots, Langmuir, 1999, 15, 3386–3389 CrossRef CAS.
- L. Levy, N. Feltin, D. Ingert and M. P. Pileni, Three dimensionally diluted magnetic semiconductor clusters Cd1−yMnyS with a range of sizes and compositions: Dependence of spectroscopic properties on the synthesis mode, J. Phys. Chem. B, 1997, 101, 9153–9160 CrossRef CAS.
- L. Levy, D. Ingert, N. Feltin, V. Briois and M. P. Pileni, Solid solution of Cd1−yMnyS nanocrystals, Langmuir, 2002, 18, 1490–1493 CrossRef CAS.
- L. Levy, D. Ingert, N. Feltin and M.-P. Pileni, Effect of aging on luminescence from isolated Mn2+ confined in Cd0.95Mn0.05S clusters, Adv. Mater., 1998, 10, 53–57 CrossRef CAS.
- D. Rodic, V. Spasojevic, A. Bajorek and P. Onnerud, Similarity of structure properties of Hg1−xMnxS and Cd1−xMnxS (structure properties of HgMnS and CdMnS), J. Magn. Magn. Mater., 1996, 152, 159–164 CrossRef CAS.
- P. A. Jadhav, R. P. Panmand, D. R. Patil, H. Fouad, S. W. Gosavi and B. B. Kale, Triangular CdS nanostructure: Effect of Mn doping on photoluminescence, electron spin resonance, and magneto-optical properties, J. Nano Res., 2017, 19, 218 CrossRef.
- J. Rockenberger, L. Tröger, A. Kornowski, T. Vossmeyer, A. Eychmüller, J. Feldhaus and H. Weller, EXAFS studies on the size dependence of structural and dynamic properties of CdS nanoparticles, J. Phys. Chem. B, 1997, 101, 2691–2701 CrossRef CAS.
- K. Ikeue, S. Shiiba and M. Machida, Novel visible-light-driven photocatalyst based on Mn−Cd−S for efficient H2 evolution, Chem. Mater., 2010, 22, 743–745 CrossRef CAS.
- M. A. Marcus, L. E. Brus, C. Murray, M. G. Bawendi, A. Prasad and A. P. Alivisatos, EXAFS studies of Cd chalcogenide nanocrystals, Nanostruct. Mater., 1992, 1, 323–335 CrossRef CAS.
- R. J. H. Clark and R. E. Hester, Spectroscopy for surface science, John Wiley & Sons, 1998 Search PubMed.
- M. C. Feiters and W. Meyer-Klaucke, Chapter 6 - X-ray absorption spectroscopy in biology (BioXAS), in Pract. Appr. Bio. Inorg. Chem., ed. R. R. Crichton and R. O. Louro, Elsevier, Oxford, 2013, pp. 131–160 Search PubMed.
- M. Marmiroli, G. O. Lepore, L. Pagano, F. d'Acapito, A. Gianoncelli, M. Villani, L. Lazzarini, J. C. White and N. Marmiroli, The fate of CdS quantum dots in plants as revealed by extended X-ray absorption fine structure (EXAFS) analysis, Environ. Sci.: Nano, 2020, 7, 1150–1162 RSC.
- G. R. Levi, The crystal structure of MnO, Rend. Ist. Lomb. Sci. Lett., Cl. Sci. Mat. Nat., 1924, 619–624 Search PubMed.
- F. Mehmed and H. Haraldsen, Magnetochemische Untersuchungen. XXVIII. Das magnetische Verhalten der allotropen Modifikationen des Mangan(II)-Sulfids, Z. Anorg. Allg. Chem., 1938, 235, 193–200 CrossRef CAS.
- V. A. Vlaskin, C. J. Barrows, C. S. Erickson and D. R. Gamelin, Nanocrystal diffusion doping, J. Am. Chem. Soc., 2013, 135, 14380–14389 CrossRef CAS.
- S. C. Erwin, L. Zu, M. I. Haftel, A. L. Efros, T. A. Kennedy and D. J. Norris, Doping semiconductor nanocrystals, Nature, 2005, 436, 91–94 CrossRef CAS.
- D. R. Fernando, T. Mizuno, I. E. Woodrow, A. J. M. Baker and R. N. Collins, Characterization of foliar manganese (Mn) in Mn (hyper)accumulators using X-ray absorption spectroscopy, New Phytol., 2010, 188, 1014–1027 CrossRef CAS.
- C. Carmeli, J. Y. Huang, D. Mills, A. Jagendorf and A. Lewis, Extended X-ray absorption fine structure of Mn2+ and Mn2+ X ATP complex bound to coupling factor 1 of the H+-ATPase from chloroplasts, J. Bio. Chem., 1986, 261, 16969–16975 CAS.
- A. Pingoud, Restriction endonucleases, Springer Science & Business Media, 2012 Search PubMed.
- R. G. Burns, Marine Minerals, De Gruyter, Berlin, Boston, 1979 Search PubMed.
- C. Daniel and J. O. Besenhard, Handbook of battery materials, John Wiley & Sons, 2012 Search PubMed.
- G. Pan, Y. Qin, X. Li, T. Hu, Z. Wu and Y. Xie, EXAFS studies on adsorption–desorption reversibility at manganese oxides–water interfaces: I. Irreversible adsorption of zinc onto manganite (γ-MnOOH), J. Colloid Interface Sci., 2004, 271, 28–34 CrossRef CAS.
Footnote |
| † Electronic supplementary information (ESI) available. See DOI: 10.1039/d0en00764a |
| This journal is © The Royal Society of Chemistry 2020 |