
 Open Access Article
 This Open Access Article is licensed under a
 Creative Commons Attribution 3.0 Unported Licence
Determinants of serum concentrations of perfluoroalkyl acids (PFAAs) in school children and the contribution of low-level PFAA-contaminated drinking water†
Anders
Glynn
 *a,
Natalia
Kotova
b,
Elin
Dahlgren
c,
Christian
Lindh
d,
Kristina
Jakobsson
de,
Irina
Gyllenhammar
b,
Sanna
Lignell
b and
Cecilia
Nälsén
b
*a,
Natalia
Kotova
b,
Elin
Dahlgren
c,
Christian
Lindh
d,
Kristina
Jakobsson
de,
Irina
Gyllenhammar
b,
Sanna
Lignell
b and
Cecilia
Nälsén
b
aDepartment of Biomedical Sciences and Veterinary Public Health, Swedish University of Agricultural Sciences (SLU), P. O. Box 7028, SE-750 07, Uppsala, Sweden. E-mail: anders.glynn@slu.se
bDepartment of Risk and Benefit Analysis, Swedish Food Agency, P. O. Box 622, SE-751 26 Uppsala, Sweden. E-mail: nkotova@yahoo.co.uk; irina.gyllenhammar@slv.se; sanna.lignell@slv.se; cecilia.nalsen@slv.se
cDepartment of Aquatic Resources, Swedish University of Agricultural Sciences (SLU), SE-178 93 Drottningholm, Sweden. E-mail: elin.dahlgren@slu.se
dDivision of Occupational and Environmental Medicine, Department of Laboratory Medicine, Lund University, SE-223 81 Lund, Sweden. E-mail: Christian.lindh@med.lu.se
eDepartment of Public Health and Community Medicine, University of Gothenburg, Medicinaregatan 16, SE-413 90 Göteborg, Sweden. E-mail: kristina.jakobsson@amm.gu.se
First published on 23rd January 2020
Abstract
Little is known about the demographic/life-style/physiological determinants explaining the variation of serum perfluoroalkyl acid (PFAA) concentrations in children. We identified significant determinants in children and investigated the influence of low-level PFAA-contaminated drinking water (DW) (<10 ng L−1 of single PFAAs) on serum concentrations. Four perfluorosulfonic acids (PFSAs) and 11 perfluorocarboxylic acids (PFCAs) were analyzed in serum from 5th grade children from 11 Swedish schools (N = 200; average age: 12 years) using liquid chromatography-tandem-mass-spectrometry. Data on demography and life-style/physiological factors were obtained by questionnaires. PFAA concentrations in raw and drinking water (DW) were obtained from the water works supplying DW to the schools. In multiple regression analyses school was the determinant contributing most to the variation in PFAA concentrations, with the lowest contribution for PFHpA (10%) and the highest for PFHxS (81%). Girls had lower adjusted mean concentrations of PFHxS, PFOS, PFNA and PFDA than boys, but a higher concentration of PFHxA. Girls reporting onset of menstruation had lower PFHxS and PFOA concentrations than other girls, suggesting menstrual bleeding elimination. Children born by mothers from less industrialized countries had lower mean concentrations of both PFSAs and PFCAs than children with mothers from highly industrialized countries, suggesting differences in early-life exposure. Life-style factors associated with paternal education levels appeared to influence PFAA concentrations differently than maternal education level. Already at an average DW PFHxS concentration of 2 ng L−1, children had a significantly higher adjusted mean serum PFHxS concentration than at an average DW concentration of <1.6 ng PFHxS L−1. Similar results were observed for PFOS and PFOA. The DW variable explained 16% (PFOA) to 78% (PFHxS) of the variation in serum PFAA concentrations, suggesting that low-level-contaminated DW is a significant source of exposure for children in Sweden. Although some of the associations, especially those with menstruation and maternal birth country, should be interpreted with extra caution due to the small size of the study, the results contribute to future work on identifying populations of children at risk of elevated PFAA exposures.
Environmental significancePerfluoroalkyl acids (PFAAs) are man-made environmental pollutants. Some PFAAs bioaccumulate in humans to levels suspected to be threats to human health. There is a large variation in PFAA concentrations in human blood serum, both between and within populations. Demographic, life-style and physiological characteristics of study participants may explain some of the variation. Among 5th grade children we found that menstrual bleeding (girls), child and maternal birth country, maternal and paternal education, and drinking water (DW) PFAA concentrations, were significant determinants of serum PFAA concentrations. Drinking water PFAA exposure had the largest influence on serum concentrations. The results will help in the process of identifying populations of children at risk of having elevated PFAA exposures, thus improving health risk assessment. |
Introduction
Per- and polyfluoroalkyl substances (PFASs) are surface active industrial chemicals with a world-wide use. Long-range transport of PFASs occurs in the atmosphere and oceans, as well as by distribution of PFAS-containing products within and between continents.1,2 Some of the polyfluoroalkyl substances (precursors) are degraded to very persistent perfluoroalkyl acids (PFAAs), which are detected in biota from the poles to the equator.2,3 For humans, food is an important exposure source,4–6 but in certain cases use of PFAS-containing products may significantly contribute to exposure via dust ingestion and/or inhalation.7,8 PFAA-contaminated drinking water (DW) is an additional significant exposure source in areas affected by point-source contamination, for instance fire-fighting training areas and PFAS production facilities.9–15 In these cases with medium/high PFAA contamination (>10 ng L−1 of single PFAAs), exposed populations have significantly elevated circulating concentrations of the PFAAs in question.PFAAs, such as perfluorooctane sulfonic acid (PFOS) and perfluorooctanoic acid (PFOA), are toxic in experimental animal studies, causing developmental effects in offspring, immune suppression, liver toxicity, effects on lipid dynamics, and hormonal effects.16,17 Epidemiological studies on populations with background/high PFOS and PFOA exposure have reported similar associations between circulating PFOS/PFOA concentrations and outcomes, although results vary between studies.18–20 A recent risk assessment of PFOS and PFOA by the European Food Safety Authority (EFSA) concluded that a considerable proportion of the European population exceeds the proposed tolerable weekly intakes (TWIs).21 The TWIs were based on epidemiological studies showing increasing serum cholesterol levels in adults with increasing exposure to PFOA and decreased vaccination antibody response among children with increasing exposure to PFOS. As with PFOA, PFOS effects on cholesterol levels was also identified as a critical effect in the risk assessment. Effects were observed in populations with background exposure to PFOS and PFOA.21 However, as pointed out by EFSA, there are still some uncertainties about possible confounding of the cholesterol and antibody associations in the critical epidemiological studies used in deriving the TWIs. Moreover, there are still not consensus that the epidemiological studies can be used for the development of TWIs.22 Therefore EFSA stated that the TWIs are provisional, with an ongoing review during 2019–2020.21
Although a large variation in circulating PFAA concentrations in children has been reported, few studies have investigated the reasons behind the variation. Most frequently studied determining factors for circulating PFAA concentrations in infants/children up to age 13 years are maternal transfer in utero and through breastfeeding, age, sex, body mass index (BMI), socio-economic factors, and race/ethnicity, with diverging results.23–31 The divergence of results are most probably due to differences in design of the study, the region studied, age at sampling, time period when sampling occurred, and PFAA homologues studied. The most frequently studied homologues are PFOS and PFOA.
Evidence is rapidly accumulating that PFAA contamination of DW is a problem in many places of the world.32 A study of children from Sweden (POPUP cohort), living in an area receiving contaminated drinking water before 2012, reported increasing serum concentrations of perfluorohexane sulfonic acid (PFHxS) and PFOS with increasing duration of residence in the areas receiving contaminated DW.33 PFHxS and PFOS concentrations in the drinking water was, based on only a few measurements, 25–45 ng L−1 at the time of discovery of the contamination in 2012.34 However, the study also suggested that DW may be an important source of PFAA exposure even at PFAA concentrations <10 ng L−1 (low-level contamination). Serum levels of perfluorobutane sulfonic acid (PFBS) and PFOA were associated with duration of living in the contaminated areas, although DW concentrations were below 10 ng L−1 at the time of discovery.9,33 Low-level-contaminated DW as an important source of exposure to certain PFAAs is further supported by a study from Germany, where a statistically significant positive correlation was observed between self-reported DW consumption and perfluorooctanoic acid (PFOA) concentrations in plasma among children living in an area with reported average DW PFOA concentrations of <1 ng L−1.35 Finally, in a recent study on adult women from the general population in the U.S. it was observed that tap water concentrations of PFOA (<100 ng L−1) and perfluorononanoic acid (PFNA) (median: ≤2 ng L−1 of single PFAA) were associated with plasma concentrations among individuals that reported drinking >8 cups of drinking water per day.36 No associations were found for PFOS and perfluorohexane sulfonic acid (PFHxS).
It may be possible that drinking water PFAA exposure contributes more to the variation in circulating PFAA concentrations in children than in adults, especially when looking at PFAAs with long half lives in humans. Adults have experienced larger historical exposures of especially PFHxS, PFOS and PFOA than children, due to exposures among adults before and during the peak of production/use of these PFAAs and related compounds.37,38 This may mask associations between present consumption of low-level PFAA-contaminated DW and circulating PFAA concentrations among adults. In the case of Uppsala, Sweden, young women living in the area receiving contaminated DW did not have significantly higher PFOS and PFOA serum concentrations, in contrast to the children.9,33
We used a nation-wide study of serum PFAA concentrations in 5th grade children (average 12 years of age) in Sweden to study if low-level PFAA-contaminated DW is a significant source of PFAA, by analyzing associations between serum PFAA concentrations in children and PFAA concentrations in DW/raw water from the water works supplying DW to the schools. Moreover, a number of potential determinants of serum concentrations were studied in order to improve the knowledge about the factors explaining the variation in PFAA concentrations. Finally, serum concentrations of PFOS and PFOA among the children were compared with concentrations associated with significant changes in cholesterol and vaccine antibody response in children, as determined by EFSA.21
Subjects and methods
Study group
The study focused on school children in 5th grade in Sweden that with a few exceptions were born year 2002 and were on average 12 years of age in January–May 2014 (Table 1). For logistic reasons, the sampling was performed by six out of the seven Occupational and Environmental Medicine Departments (OEM) in Sweden, from south to north situated in Lund, Linköping, Örebro, Stockholm, Uppsala and Umeå. The only OEM region missing was the south-west region of Sweden (Gothenburg). All OEM departments have a regional responsibility within the national health care system. The selection of schools was carried out by Statistics Sweden and consisted of a national representative sample of schools in the six OEM regions, from which ten schools in each region were selected. From this sample the two largest schools were asked to participate. If a school declined, the third largest school was approached, and so on until reaching the target of 2 schools per region. In the OEM Lund region five schools were asked to participate before reaching the target, in Linköping region four schools, Örebro six schools, Stockholm four schools, and Uppsala two schools. In the Umeå region only one out of a total of five schools participated. In total the participation rate of schools was 43%. The participating schools had 22 to 77 children in the 5th grade. Among these children, the participation rate was 45% (234 out of 524). The final data set included 200 participants with all parts of the study completed (questionnaire and blood sampling). The study was performed in compliance with the relevant laws and institutional guidelines, and was approved by the regional ethical committee in Uppsala. Written informed consent was given by the study participants and both of their parents/legal guardians.| Variable | Girls (N = 92) | Boys (N = 108) | p | |||
|---|---|---|---|---|---|---|
| Year of sampling | 2014 | 2014 | ||||
| Age (years) | 11–12 | 11–12 | ||||
| Height (cm) | 154 (138–173) | 152 (139–170) | 0.037 | |||
| Weight (kg) | 42 (27–71) | 41 (28–72) | 0.531 | |||
| N | % | N | % | |||
| Breastfed | Yes | 87 | 95 | 104 | 96 | 0.556 |
| No | 5 | 5 | 4 | 4 | ||
| No. of older siblings | 0 | 43 | 47 | 49 | 45 | 0.417 |
| 1 | 29 | 31 | 42 | 39 | ||
| ≥2 | 20 | 22 | 17 | 16 | ||
| Maternal education (years) | ≤11 | 6 | 6 | 8 | 7 | 0.347 |
| 12–13 | 23 | 25 | 18 | 17 | ||
| >13 | 63 | 69 | 82 | 76 | ||
| Paternal education (years) | ≤11 | 17 | 18 | 9 | 8 | 0.086 |
| 12–13 | 18 | 20 | 28 | 26 | ||
| >13 | 57 | 62 | 71 | 66 | ||
| Maternal birth country | 1 | 74 | 80 | 95 | 88 | 0.327 |
| 2 | 12 | 13 | 8 | 7 | ||
| 3 | 6 | 6 | 5 | 5 | ||
| Child birth country | 1 | 90 | 98 | 106 | 98 | — |
| 2 | 1 | 1 | 0 | 0 | ||
| 3 | 1 | 1 | 2 | 2 | ||
| Passive smoking home/school | Yes | 7 | 8 | 3 | 3 | 0.117 |
| No | 85 | 92 | 105 | 97 | ||
| Menstruation | Yes | 5 | 6 | — | ||
| No | 85 | 94 | ||||
| Median PFHxS drinking water (ng L−1) | <1.6 | 33 | 48 | 39 | 47 | 0.265 |
| 2.0 | 26 | 38 | 24 | 29 | ||
| 17 | 10 | 14 | 10 | 24 | ||
| Median PFOS drinking water (ng L−1) | <1.0 | 33 | 48 | 39 | 47 | 0.265 |
| 3.9 | 26 | 38 | 24 | 29 | ||
| 5 | 10 | 14 | 10 | 24 | ||
| Median PFOA drinking water (ng L−1) | <1.0 | 33 | 48 | 39 | 47 | 0.918 |
| 1.1–1.5 | 36 | 52 | 44 | 53 | ||
Personal characteristics and blood sampling
Personal characteristics were assessed by a web-based questionnaire (Table 1). Children that did not have access to a computer at home used a paper version of the questionnaire, and the data were entered into the web-based system by employees at the Swedish Food Agency. Questions about lifestyle and family were answered by the participants themselves. Questions about the parents were answered by the parents. Personal characteristics included school, sex, history of breastfeeding as infants, number of older siblings, parental education, child birth country, maternal birth country, smoking/passive smoking, and onset of menstruation (girls). Body weight and length were measured at the time of blood sampling by trained personnel, weight to the nearest 0.1 kg using a calibrated digital scale (seca 862/899, SECA, Germany) and length to the nearest 0.1 cm using a portable stadiometer (seca 213, SECA, Germany). A blood sample from each child was drawn from an antecubital vein. Serum was immediately separated and frozen at −20 °C and after transport to the laboratories stored at −80 °C.Drinking water PFAA concentrations
Data on PFAA concentrations in DW/raw water were obtained from the water works supplying DW to the participating schools (ESI, Table S1†). No analytical details and quality control data from the commercial laboratories performing the analyses were supplied by the water works. Some water works only reported data for raw water, which is the untreated water entering the water works from the ground/surface water source. Results from water works with both raw water and DW data showed only minor differences (ESI, Table S1†). In order to maximize the number of participants in the statistical analyses of associations between serum PFAA and DW concentrations, both raw water and DW data were therefore used. It was assumed that DW supplied to the schools also was supplied to the homes of the children. Since participating schools were situated in large municipalities/cities, no participants reported well water as main source of DW at home. Some of the water works reported that they regularly measured PFAAs in DW/raw water whereas others reported only one measurement (ESI, Table S1†).For PFHxS, DW exposure of the participants was classified with one group consisting of water works with reported median DW/raw water concentrations of <1.6 ng PFHxS L−1, another with 2 ng PFHxS L−1 and a third group with a reported median concentration of 17 ng PFHxS L−1 (ESI, Table S1†). DW PFOS exposure was classified as median concentrations <1.0 ng PFOS L−1, 3.9 ng L−1 and 5 ng L−1. PFOA exposure was classified in 2 groups, <1.0 ng L−1 and 1.1–1.5 ng L−1 (ESI, Table S1†). The cut-off PFAS DW concentrations used for the classification were chosen so that each group consisted of ≥20 participants.
Serum PFAA analyses
Serum concentrations of PFBS, PFHxS, PFOS, perfluorodecane sulfonate (PFDS), perfluorohexanoic acid (PFHxA), perfluoroheptanoic acid (PFHpA), PFOA, perfluorononanoic acid (PFNA), perfluorodecanoic acid (PFDA), perfluoroundecanoic acid (PFUnDA), perfluorododecanoic acid (PFDoDA), perfluorotridecanoic acid (PFTrDA), perfluorotetradecanoic acid (PFTeDA), perfluorohexadecanoic acid (PFHxDA) and perfluorooctadecanoic acid (PFODA) were analyzed at the division of Occupational and Environmental Medicine in Lund, Sweden, using liquid chromatography-tandem-mass-spectrometry (LC/MS/MS), using the method previously described by Lindh et al.39 with minor modifications. PFHxS and PFOS concentrations included both linear and branched isomers. In brief, aliquots of 100 μL serum were added with ammonium acetate buffer and labeled internal standards, and digested at 37 °C for 90 min. At the time of analysis our method was also used for analysis of phthalate metabolites. Thus, the enzyme glucuronidase was added before digestion. The addition did not change the levels of perfluoroalkul sulfonic acids (PFSAs) and perfluoroalkyl carboxylic acids (PFCAs). After digestion the proteins were precipitated with 200 μL acetonitrile and vigorously shaken for 30 min. The samples were centrifuged and 4 μL of the supernatant was analyzed using LC/MS/MS (QTRAP5500, Applied Biosystems, Foster City, CA, USA). In each analytical batch (in total 9 batches), calibration standards, two quality control samples (QC) of pooled human serum and chemical blank samples were included. The samples were analyzed in a randomized order, in duplicates and the mean of two replicates were further used. The limit of detection (LOD), determined as the concentrations corresponding to three times the standard deviation of the responses in chemical blanks, was 0.02 ng mL−1 for PFHpA and PFHxS, 0.04 ng mL−1 for PFDA and PFDoA, 0.05 ng mL−1 for PFHxA, PFOS and PFUnDA, 0.08 ng mL−1 for PFNA, 0.1 ng mL−1 for PFDS, PFTrDA, PFTeDA, PFHxDA and PFODA, and 0.2 ng mL−1 for PFOA.Coefficient of variation (CV) of the two QC samples (N = 15) used at the time of analysis (2014) were 10% at 0.6 ng mL−1 and 5% at 2 ng mL−1 for PFHpA. For PFHxS, the CV was 17% at 2 ng mL−1 and 11% at 4 ng mL−1, for PFOA the CV was 6% at 3 ng mL−1 and 7% at 4 ng mL−1, and for PFNA the CV was 10% at 1 ng mL−1 and 8% at 3 ng mL−1, for PFOS the CV was 8% at 6 ng mL−1 and 6% at ng mL−1, for PFDA the CV was 6% at 1 ng mL−1 and 5% at 3 ng mL−1, for PFUnDA the CV was 6% at 1 ng mL−1 and 4% at 3 ng mL−1, and for PFDoDA the CV was 11% at 1 ng mL−1 and 6% at 2 ng mL−1. The analyses of PFOS and PFOA were, at the time of analysis of samples in the present study, certified by a quality control program between analytical laboratories coordinated by Professor Hans Drexler, Institute and Outpatient Clinic for Occupational, Social and Environmental Medicine, University of Erlangen-Nuremberg, Germany (see ESI, Fig. 1†).
Determinants
Relations between PFAA concentrations and explanatory variables (determinants) ‘school’, ‘sex’, ‘length, ‘weight’, ‘number of older siblings’ (none, one, and two or more), ‘child birth country’, ‘maternal birth country’, ‘maternal education’ (≤11 years, 12–13 years, >13 years), ‘paternal education’ (≤11 years, 12–13 years, >13 years), passive smoking (yes, no), ‘breastfed during infancy’ (yes, no), and ‘onset of menstrual bleeding’ (yes/no, girls only) were investigated by multiple linear regression. “School” and “sex” were included as determinants in the models since there may be regional differences in exposure due to for instance DW contamination, as well as gender differences in PFAA exposure.40,41 A Korean study reported negative associations between child body length and several of the PFAA included in our study,29 and therefore we included ‘length’, as well as ‘weight’ as determinants. ‘Child birth country’ was included since lower serum concentrations of certain PFAAs have been reported for populations from less industrialized countries.42,43 Birth country was classified as high-income country, upper-middle-income country or lower-middle/low-income country, according to the UN classification of countries by their per capita gross national income 2014 (ESI, Table S2†).44 Due to few participants not born in a high-income country (N = 4) ‘child birth country’ was categorized as born in a high-income country or not born in a high-income country.A study on 4–12 year old children has shown that in utero/lactational PFAA exposure, as determined by maternal serum PFAA concentrations close to delivery, may influence child serum PFAA concentrations a decade after birth.33 Moreover, higher parity is associated with lower maternal PFAA concentrations in mothers during pregnancy.45 Taken together these results prompted us to include ‘number of older siblings’ as a potential determinant child PFAA concentrations, due to potentially higher early life PFAA exposure among first-born children than among children with older siblings. ‘Maternal birth country’ was included as a possible determinant because an earlier study have shown that mothers from less industrialized countries have lower serum PFOS, PFOA and PFNA concentrations than mothers from highly industrialized Nordic countries.43 ‘Maternal birth country’ was similarly as ‘child birth country’ classified as a high-income country, upper-middle-income country or lower-middle/low-income country. Among Swedish 4–12 years old children serum PFAA concentrations increased with number of months of breast-feeding.33 Therefore, ‘breast-feeding’ was included as a possible determinant.
The variables ‘maternal education’ and ‘paternal education’ were included since education level has been reported to be positively related to serum PFAA concentrations in adults in Sweden.41 This is probably due to education-related differences in life-style causing differences in PFAS exposure, which could also affect the children in a family.41 The variable ‘passive smoking’ consisted of participants reporting passive smoking at home and/or in school, and those reporting that they were not exposed to passive smoking either at home or at school. This variable was tested as a determinant since PFAA levels may be associated to smoking.46,47
The variable ‘menstrual bleeding’ was composed of girls reporting onset of menstrual bleeding (yes) and those reporting not having started menstruation (no). Regular blood loss may increase PFAA elimination thus affecting circulating PFAA concentrations.48–50
Statistical analyses
Statistical analyses included 200 participants with all parts of the study completed (questionnaire and blood sampling). MINITAB 15® was used for the analyses and the significance level was set to p ≤ 0.05. Sex differences in personal characteristics and PFAA concentrations were analyzed using the two-sample T-test (unequal variances) for continuous data and by the chi-square test for categorical data. Differences in PFAA concentrations between schools were analyzed by Welch's Anova (unequal variances). Continuous data were log-transformed when not normally distributed.Analyses of associations between PFAA concentrations and personal characteristics/DW exposure were only performed for PFAAs with more than 75% of the data above LOD, i.e. PFHxS, PFOS, PFHpA, PFOA, PFNA, PFDA and PFUnDA. Data values below LOD was set to LOD/√2. Distributions of PFAA concentrations closely followed a log-normal distribution, and analyses of associations were therefore performed on log-transformed PFAA data. Relations between PFAA concentrations and potential determinants were investigated by multiple linear regression. DW associations were analyzed by including the DW exposure variable and excluding the ‘school’ variable in the regression models.
The influence of menstrual bleeding on PFAA concentrations was investigated in girls by including the variable ‘onset of menstrual bleeding’ in the multiple linear regression models including also ‘school’. In analysis of menstrual bleeding as a possible explanation of sex-related differences in PFAA concentration the variable ‘onset of menstrual bleeding’ was also included as a covariate in the full model with both girls and boys.
In sensitivity analyses, observations with a standardized residual ≥3.0 were excluded, due to potentially large influence on the regression results. Adjusted means of PFAA concentrations for the categorical covariates in the models were calculated using the general linear model procedure (GLM). As a consequence of the logarithmic transformation, the adjusted means were geometric means (corresponding to the median of the log-normal distribution). The contribution of each statistically significant determinant to the variation in PFAA concentrations was estimated by subtraction of the coefficient of determination (R2) of the model not including the determinant in question from the R2 of the full model.
Risk assessment
Modelled serum concentrations of PFOS and PFOA used by EFSA in the derivation of health-based tolerable weekly intakes (TWIs) were compared with the serum concentrations observed among the school children. For PFOS the lower 95% confidence interval benchmark (BMDL05) serum concentration of 10.5 ng PFOS per mL was used by EFSA as a base for setting the PFOS TWI. This BMDL05 was by EFSA modelled to be associated with a 5% decrease in levels of antibodies against diphtheria vaccine in 7 years old children.21 The EFSA PFOA TWI was based on the BMDL05 concentration associated with a 5% increase in total cholesterol among adults. In our risk assessment serum PFOA concentrations in 12 years old children were compared with a serum concentration of 6 ng PFOA per mL, estimated by EFSA to be the serum PFOA concentration attained at 12 years of age during life-time intake of PFOA at the TWI.21Results and discussion
PFAA concentrations
Among the Swedish school children sampled in 2014, median concentrations of PFBS, PFDS, PFHxA, PFDoDA, PFTrDA, PFTeDA, PFHxDA and PFDoDA were below LOD (<0.04 to <0.10 ng mL−1) (Table 2). Among PFSAs, the median PFOS concentration was 3-fold higher than the median PFHxS concentration (Table 2). Among PFCAs with median concentrations above LOD, PFHpA exhibited the lowest median concentration (less than 0.1 ng mL−1) and PFOA was the only PFCA with a median concentration above 1 ng mL−1. For PFCAs with longer carbon chains than PFOA, median concentrations decreased with increasing carbon-chain length (Table 2). PFAA concentrations were within the range of those reported for background-exposed children/adolescents from other industrialized countries, although being on average slightly lower than those reported up to 2010.24,51–56 Comparisons with other studies are hampered by, for instance, differences in age of the studied group and differences in methods for PFAA analyses.| Substance | All (N = 200) (median (min–max)) | N < LOD (%) | Girls (N = 92) | Boys (N = 108) |
|---|---|---|---|---|
| PFBS | <0.10 (<0.10–0.18) | 197 (98) | ||
| PFHxS | 1.1 (0.34–18) | 0 (0) | 1.0 (0.34–16) | 1.2 (0.44–18) |
| PFOS | 3.3 (1.1–13) | 0 (0) | 3.0 (1.1–8.0) | 3.8 (1.3–13)* |
| PFDS | <0.10 (<0.10–0.10) | 200 (99) | ||
| PFHxA | <0.05 (<0.05–0.32) | 151 (75) | ||
| PFHpA | 0.040 (<0.02–0.25) | 42 (21) | 0.040 (<0.02–0.25) | 0.028 (<0.02–0.15)* |
| PFOA | 1.6 (0.60–3.3) | 0 (0) | 1.5 (0.60–3.3) | 1.7 (0.69–3.3)* |
| PFNA | 0.43 (0.17–3.6) | 0 (0) | 0.41 (0.17–2.6) | 0.47 (0.21–3.6)* |
| PFDA | 0.24 (0.10–0.68) | 0 (0) | 0.22 (0.097–0.68) | 0.25 (0.12–0.53)* |
| PFUnDA | 0.16 (<0.05–0.54) | 6 (2.8) | 0.14 (<0.05–0.54) | 0.17 (<0.05–0.49)* |
| PFDoDA | <0.04 (<0.04–0.08) | 184 (92) | ||
| PFTrDA | <0.10 (<0.10–0.10) | 200 (99) |
Girls had lower median concentrations of long-chain PFAAs (PFSAs ≥6 carbons in chain, PFCAs ≥8 carbons in chain) than boys, although for PFHxS the difference was not statistically significant (Table 2). The non-significant differences for PFHxS was probably due to a large overlap of concentrations among girls and boys, due to the much higher concentrations in both sexes in one school (Fig. 1). In contrast, the median concentration of the short-chain PFHpA was higher in girls than in boys. The PFAS production by the industry has moved from long-chain to short-chain PFAS chemistry.57–59 A speculation is that the diverging sex-related difference in serum concentrations between the long-chain PFAAs and PFHpA in the Swedish children mirrors sex-related differences in exposure sources. For instance a study of PFASs in cosmetic products on the Swedish market reported that the most frequently detected PFASs were short-chain homologues, with PFHpA being most often detected.60 Since girls are more likely to use cosmetics than boys, PFAS-containing cosmetic-products may be an additional PFHpA exposure source for girls but not to a large degree for boys.
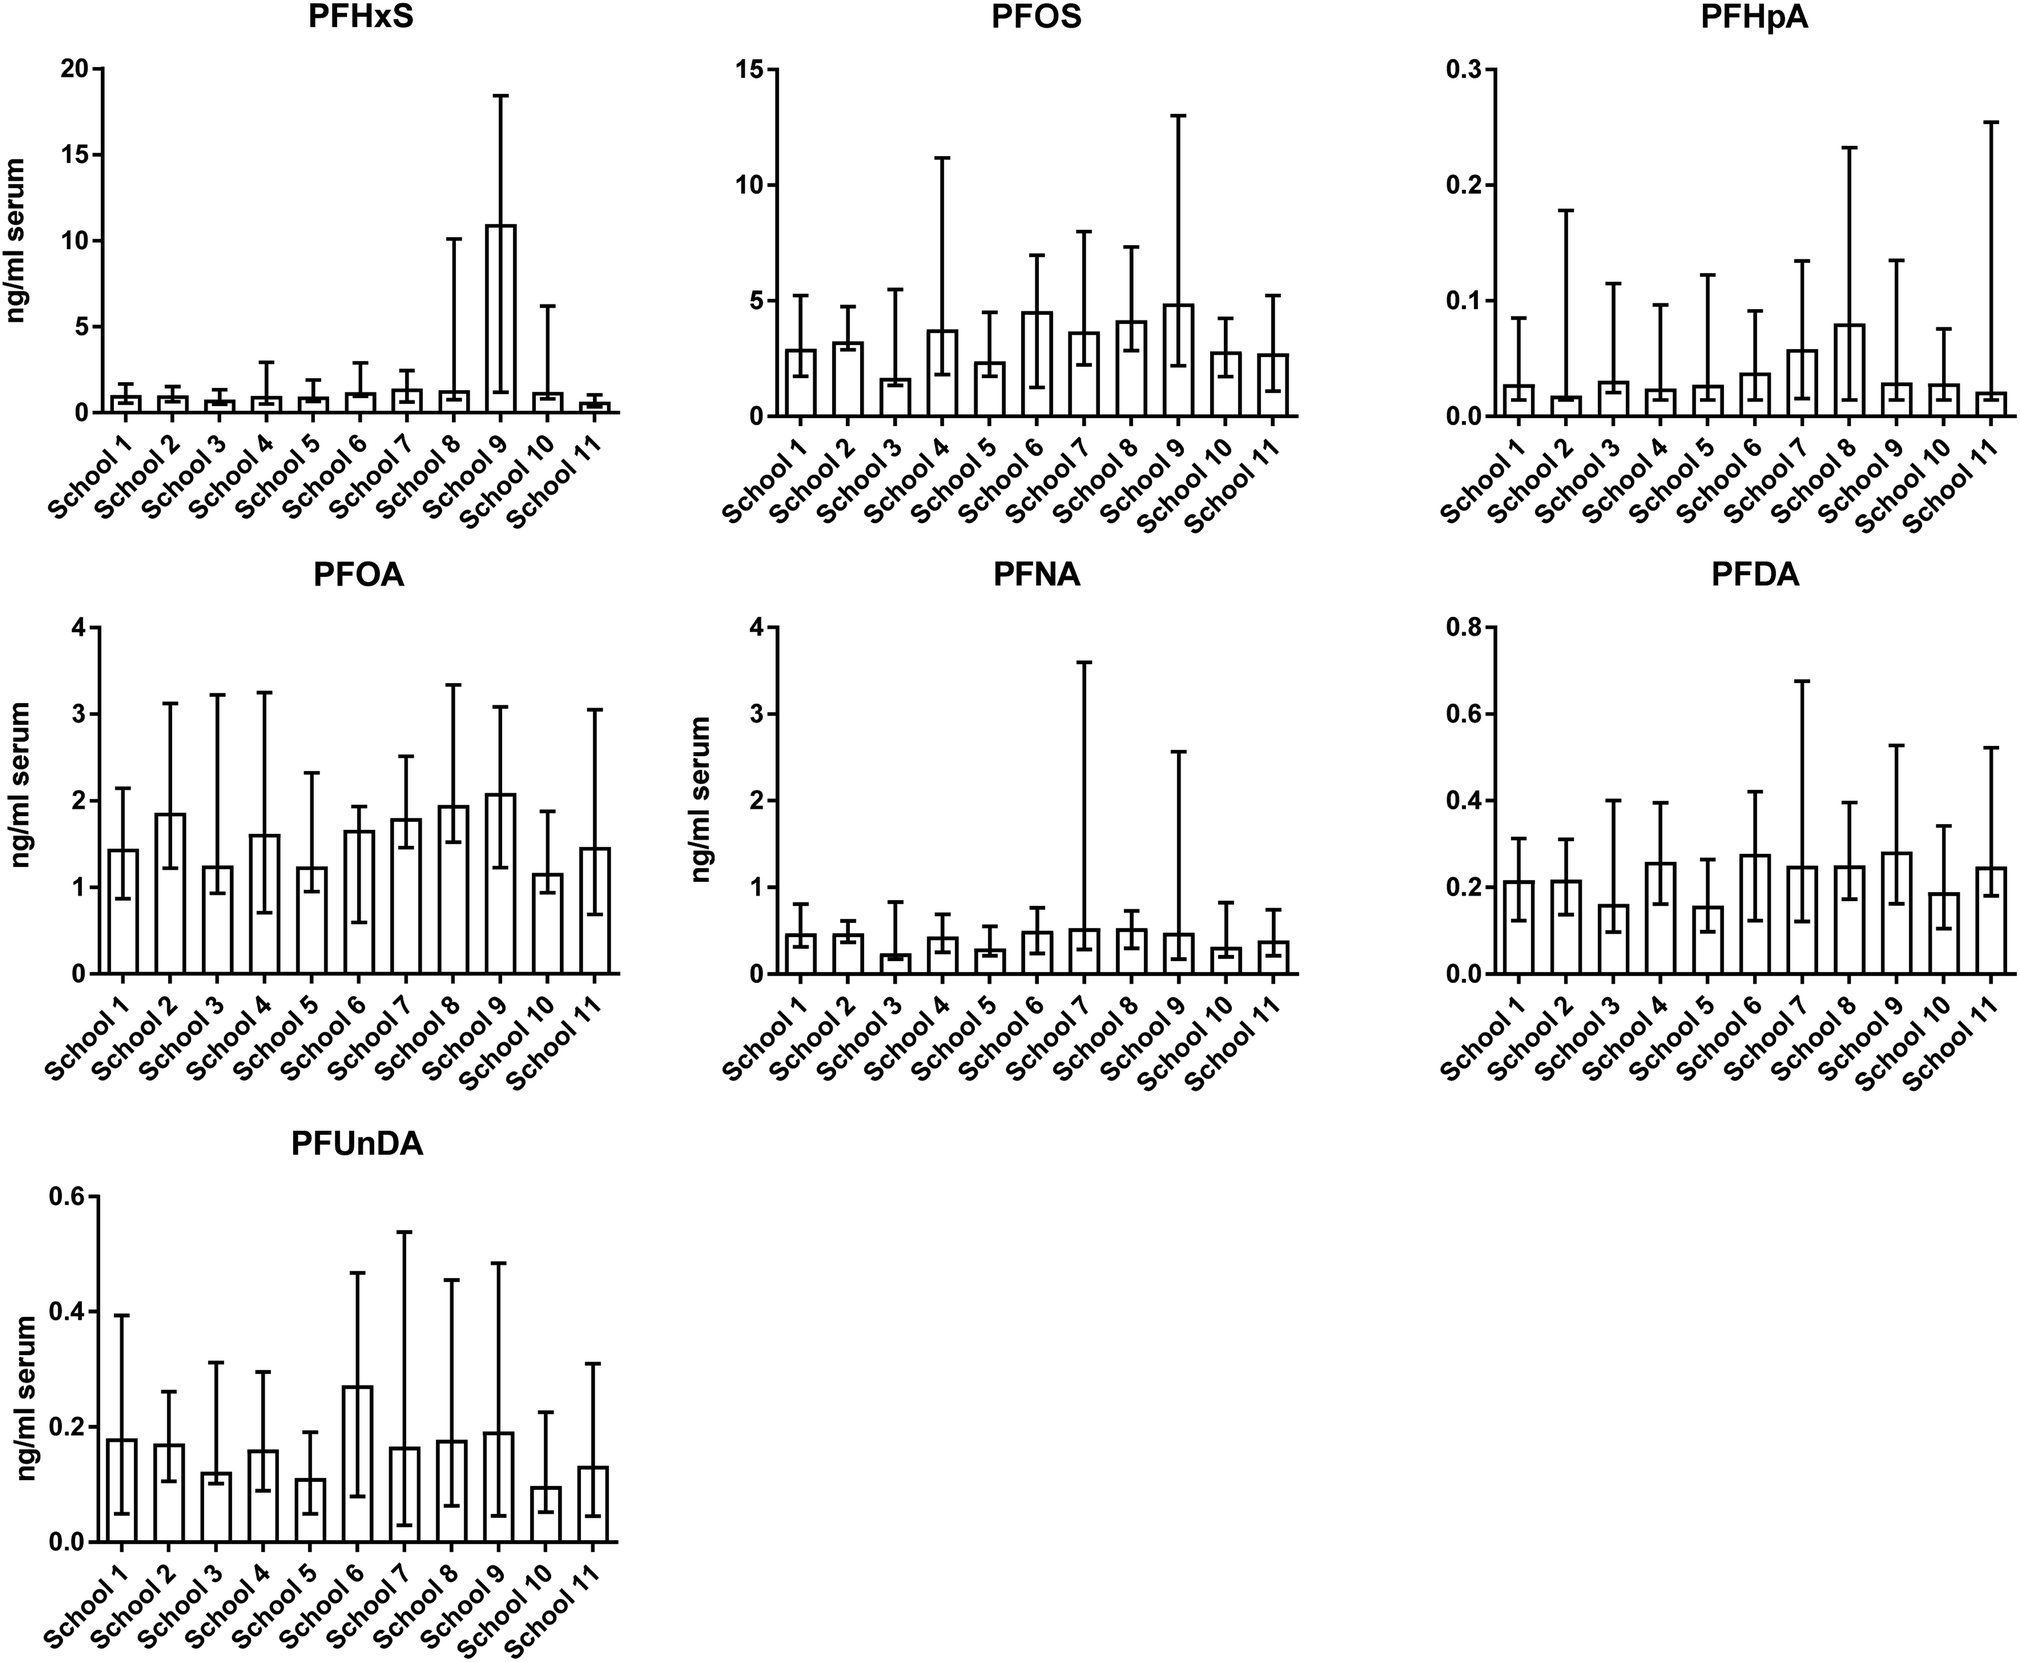 | ||
| Fig. 1 Concentrations of PFAAs in serum from 5th grade children living in Sweden (median, range). Schools were sorted according to their affiliation to an Occupational and Environmental Medicine Center (OEMC). From south to north in Sweden: Region Lund: school 1–2 (N = 9–16), Region Linköping: school 3–4 (N = 5–13), Region Örebro: school 5–6 (N = 8–12), Region Stockholm: school 7–8 (N = 24–26), Region Uppsala: school 9–10 (N = 23–30) and Region Umeå: school 11 (N = 34). Statistically significant differences between schools were observed for all PFAAs (Welch's Anova (unequal variances), p ≤ 0.05, N = 200). | ||
Previous studies of sex-related differences in PFAA concentrations report diverging results, probably depending on differences in age groups studied, population differences in sex-related exposure and timing of sampling in relation to shifts in PFAS production. No differences were reported for <13 years old children from USA, 0–18 years old “non-adults” from China, and 5 year-old children from the Faroe Islands.24,61,62 Similarly as in the present study, higher PFOS and PFOA concentrations in boys than in girls (1–18 years) were reported in a population with high PFOA exposure from DW in the USA,54 and similar results were observed for PFHxS and the linear isomer of PFOS in 3–11 years old children participating in NHANES 2013–14 in the USA.63 However, in the latter case no differences were observed for PFOA (linear isomer), PFNA and PFDA.63
A significant school-dependent difference in PFAA concentrations was observed among the Swedish children, with the largest difference for PFHxS (Fig. 1). For PFHxS one school showed a 10-fold higher median concentration than the other schools. This school is situated in the city of Uppsala where PFAA contamination of the DW was discovered in 2012.9 PFHxS concentrations in the few DW samples collected at the tap in the Uppsala area receiving contaminated DW was on average about 40 ng L−1 at the time of discovery of contamination in 2012.34 The blood samples in the present study were taken 2 years after the discovery/mitigation of the PFAA contamination. However, the historical exposure of the Uppsala children to PFHxS before 2012 most probably explains the considerably higher serum PFHxS concentrations. The half-life of PFHxS in serum has been determined to be several years with a relatively large inter-individual variation.10
Associations with personal characteristics
In multiple regression analyses, school was a significant determinant for all studied PFAAs, sex was significant for PFHxS, PFOS, PFHpA, and PFDA, onset of menstrual bleeding among girls for PFHxS and PFOA, child birth country for PFOS, PFNA, PFDA and PFUnNA, maternal birth country for PFOS, PFOA and PFDA, number of older siblings for PFOA, maternal education for PFOS, and paternal education for PFOA and PFDA (ESI, Table S2†). Sensitivity analysis, excluding outliers, did not change associations markedly, except for sex and maternal birth country becoming statistically significant determinants for PFNA. School was the determinant that contributed most to the variation in PFAA concentrations, explaining 9.6–81% of the variation in PFAA concentrations (partial R2 0.096–0.81). The highest contribution of school to the variation was observed for PFHxS and the lowest for PFHpA. Partial R2 for the other determinants never reached higher than 0.1.Although the results from our relatively small study have to be regarded as hypothesis generating, the PFAA associations with onset of menstrual bleeding (girls), child and maternal birth country, and parental education level may be important confounders to consider in future studies of child PFAA exposure and health effects. Apart from influencing serum PFAA concentrations, menarche timing among girls may influence later health development.64 Different birth countries points to potential genetic differences that may influence the risk of health effects.65 Parental education level is a socio-economic indicator that is associated with disease risks.66,67
The sex-related differences in the multiple regression analyses were similar as in the crude analyses without covariate adjustment (Fig. 2, Table 2), showing that the determinants included in the present study did not markedly influence sex differences in concentrations. Regular blood loss, for instance during menstruation among females, may increase PFAA elimination.48,49 This is supported by lower adjusted mean PFHxS and PFOA concentrations among girls reporting onset of menstrual bleeding (Fig. 2), suggesting that menstrual blood loss may influence concentrations of some PFAA already soon after menstruation onset. A closer look on Fig. 2 also suggest lower adjusted mean concentrations of PFOS and PFHpA among girls reporting onset of menstruation, although not being statistically significant most probably due to low statistical power. These observation should, however, be interpreted with caution due to the few participating girls reporting onset of menstrual bleeding (N = 5), and the likely very recent onset of menstruation among the 12 year old girls. Modelling of the impact of menstruation on elimination half-lives among US and Australian women suggested that half-life of PFOA was influenced by menstruation to a lesser degree than that of PFOS.50 However, Rush et al.68 reported similar influence of use of oral contraceptive (OC) (lower concentrations due to lower menstrual fluid loss) by females on PFOS and PFOA plasma concentrations. In the latter study concentrations of PFHxS and PFNA were also lower among OC users than among non-users, but not of PFDA and PFUnDA. However, sex-related differences in PFAA concentrations did not change markedly after inclusion of onset of menstrual bleeding in the regression models including both girls and boys (ESI, Table S2†). This could be due to the few girls reporting onset of menstrual bleeding (N = 5). Our finding is contrary to a previous modeling study suggesting that menstrual bleeding had little influence on PFOS and PFOA concentrations at menarche.69
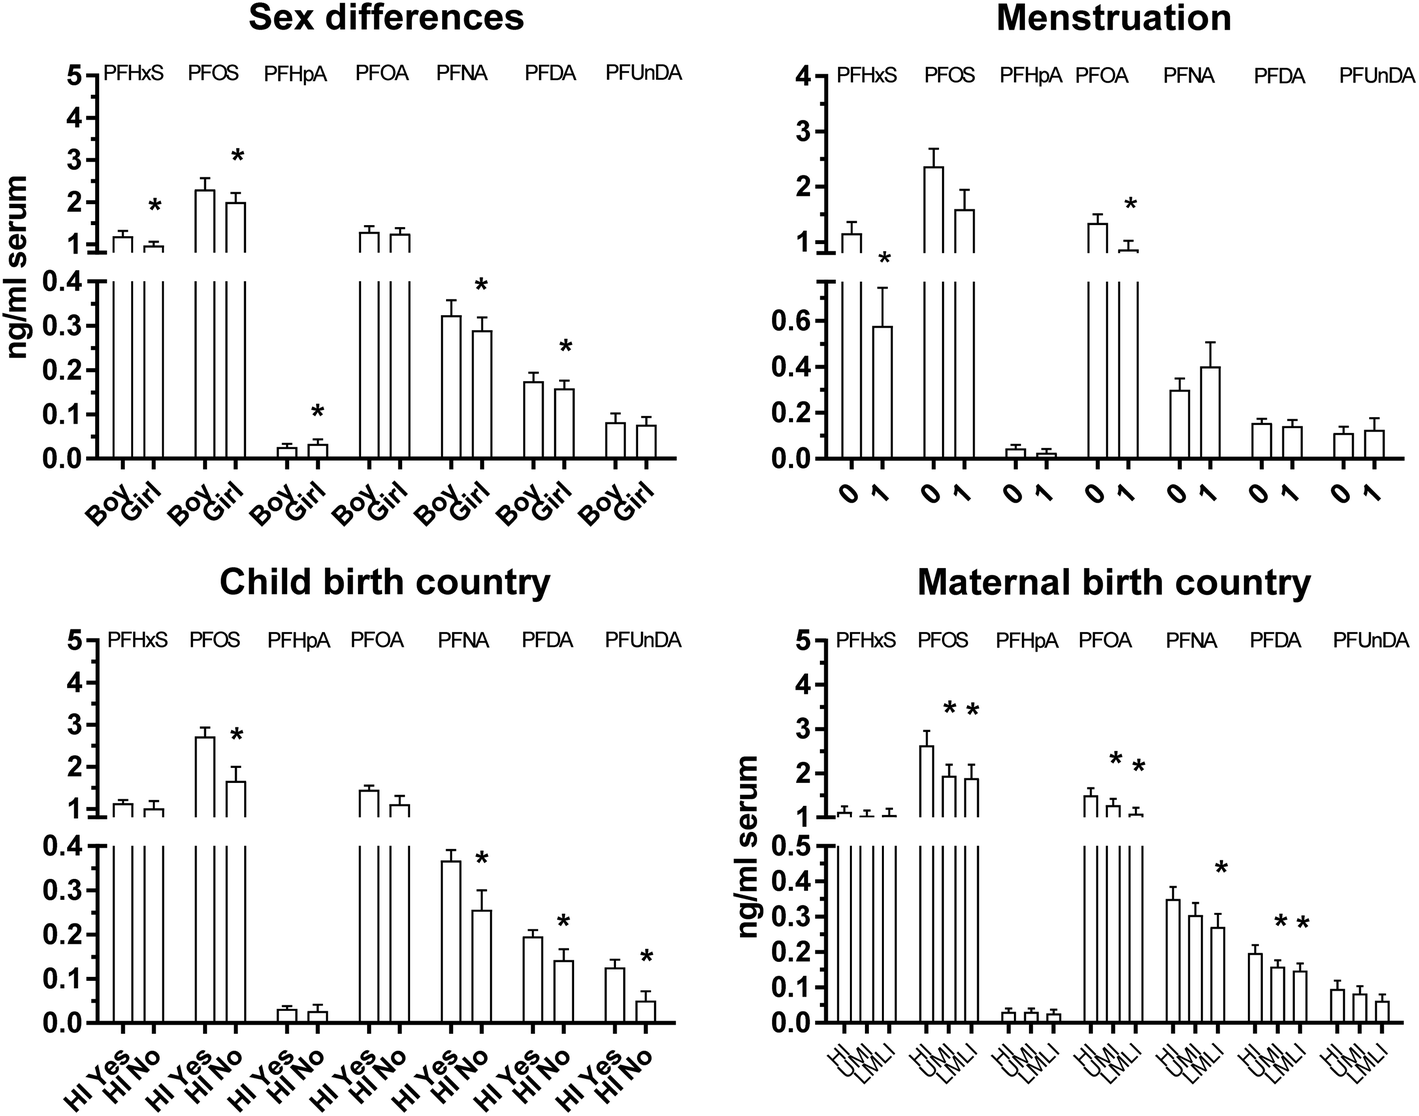 | ||
| Fig. 2 Adjusted mean (±standard error) concentrations of PFAAs in serum from 5th grade children living in Sweden, as determined by sex, onset of menstrual bleeding (girls only, 0 = no, 1 = yes), child birth country (HI yes = born in a high-income country, HI no = not born in a high-income country), and maternal birth country (HI = high-income country, UMI = upper-middle-income countries, LMLI = lower-middle/low-income countries). Regression models included covariates ‘school’, ‘sex’, ‘body length’, body weight’, ‘child birth country’, ‘maternal birth country’, ‘paternal education’, ‘maternal education’, ‘passive smoking’, ‘older siblings’ and ‘breastfeeding’ (N = 195–200). In analyses of associations with onset of menstrual bleeding (girls only, N = 87–92) the covariate ‘onset of menstrual bleeding’ was included instead of ‘sex’. For PFHxS, PFNA, PFDA, and PFUnDA results are given for analyses with outliers (standardized residual ≥3) excluded from the data set. *Significantly different from boys (sex), girls reporting no onset of menstrual bleeding (menstruation), children born in high-income countries (child birth country) and children with mothers born in a high-income country (p ≤ 0.05). | ||
All children were born in high-income countries except four participants, which had lower adjusted mean serum concentrations of PFOS, PFDA, PFNA and PFUnDA (Fig. 2). Although this finding has to be interpreted with care due to the few children born in less industrialized countries, the lower serum concentrations are in agreement with other studies of adults.42,43 A negative association between PFAA concentrations in house dust and human development index,70 and a strongly decreasing airborne PFAS concentration gradient from the European continent southward towards less industrialized regions,71 support a lower PFAA load of the human environment in less industrialized countries.
Similarly as with child birth country, children born by mothers from less industrialized countries had lower adjusted mean serum PFOS, PFOA, PFNA and PFDA concentrations (Fig. 2). All children with mothers from less industrialized countries (N = 31), but four, were born in highly industrialized countries (mainly Sweden). Exclusion of the children not born in high income countries did not markedly change the associations with maternal birth country except for PFNA (PFOS p = 0.001; PFOA p = 0.008; PFNA p = 0.140; PFDA p = 0.005). Maternal life-style and dietary preferences, affecting child PFAA exposure at home, may contribute to our observation. Other factors that may have contributed are lower pre- and post-natal PFAA exposures of children with mothers from the less industrialized countries. An earlier study from Sweden showed that maternal serum PFOS and PFOA concentrations at delivery were higher in mothers from Sweden/Europe than in mothers from Sub-Saharan Africa, the Middle East, East Asia and South America.43 Another Swedish study suggested that maternal transfer of PFOS and PFOA during pregnancy/nursing still influence child serum concentrations more than a decade after birth. The very long half-lives of PFOS and PFOA in humans, with reported average estimated half-lives varying between 3.1 to 18 years for PFOS and 2.1 to 3.8 years for PFOA, most probably contribute to this relation.10,72
Although early life PFAA exposure may influence child serum PFAA concentrations, as indicated by associations with child and maternal birth country, two other potential determinants of early life exposure, breastfeeding (yes/no) and number of older siblings (maternal parity), were not important determinants of child serum PFAA concentrations (ESI, Table S2†). The only statistically significant result observed was a 8% lower adjusted mean concentration of PFOA (p ≤ 0.05) among children with one older sibling than among first-born children. Breastfeeding is a significant source of PFAA exposure of infants,26,73,74 but the contribution of this exposure to child PFAA concentrations decreases with child age.28,30,75,76
Our results indicate differences in the influence of maternal and paternal life-style on child serum PFAA concentrations, as suggested by differences in relations between maternal and paternal education level and serum PFAA concentrations (Fig. 3). For maternal eduction level, the highest adjusted mean serum concentration of PFOS was observed among children with highly educated mothers (Fig. 3). Similar results were observed for paternal education and PFOA, PFNA and PFDA (Fig. 3). An earlier study on adults from Sweden showed that serum PFAA concentrations increased with increasing education level.41 The influence of parental education level on child serum PFAA concentrations is most probably due to socio-economic-related life-style factors that influence child PFAA exposure.
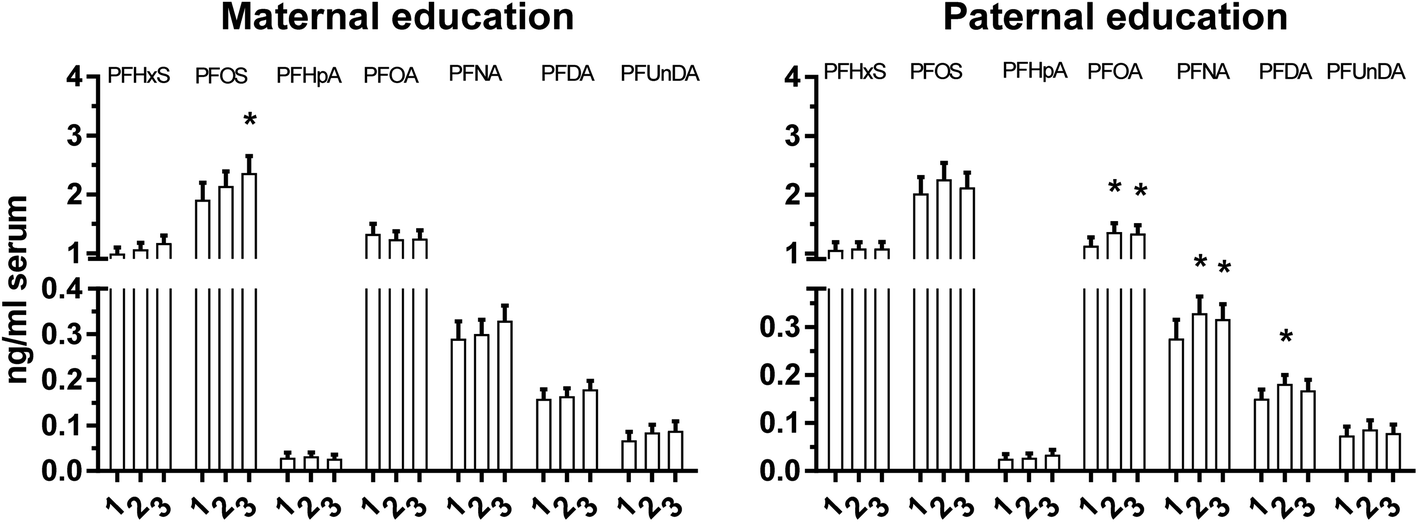 | ||
| Fig. 3 Adjusted mean (±standard error) concentrations of PFAAs in serum from 5th grade children living in Sweden, as determined by maternal and paternal education (1 = ≤11 years, 2 = 12–13 years, 3=>13 years). Regression models included covariates ‘school’, ‘sex’, ‘body length’, body weight’, ‘child birth country’, ‘maternal birth country’, ‘paternal education’, ‘maternal education’, ‘passive smoking’, ‘older siblings’ and ‘breastfeeding’. For PFHxS, PFNA, PFDA, and PFUnDA results are given for analyses with outliers (standardized residual ≥3) excluded from the data set. *Significantly different from mothers or fathers with the lowest education level (≤11 years) (p ≤ 0.05. N = 195–200). | ||
Associations with drinking water PFAA
Based on the PFAA concentrations reported by the water works supplying DW to participating schools, PFHxS, PFOS and PFOA were the only detected PFAAs in the raw water/DW (ESI, Table S1†). In some cases the DW analyses were limited to these three PFAAs. The number of analyses and LODs of analytical methods varied between water works. Most of the water works in Sweden currently do not measure PFAA regularly, since there is no legal maximum limits and no requirement for regular monitoring. The differences in LODs were due to the use of different commercial analytical laboratories and variation in reported LODs over time. Among the 5 water works supplying DW to 8 of the 11 schools, 4 water works reported PFHxS and PFOA concentrations in raw water/DW of less than 2.5 ng L−1 and 3 water works PFOS concentrations of 1 ng L−1 or lower (ESI, Table S1†). This is in line with the majority (PFHxS 96%, PFOS 88%, PFOA 89%) of the 236 water works participating in a screening study of PFAS performed by The Swedish Water and Wastewater Association (Svenskt Vatten AB) in 2014.77 EFSA reported mean concentrations of 3 ng PFOS per L and 10 ng PFOA per L in European countries when concentrations below LOD were set to the concentration at LOD (upper bound mean).21 One water works in the present study reported highly variable PFHxS, PFOS and PFOA concentrations over the 3 years of screening (2012–2015) (ESI, Table S1†). In 2012 it was discovered that some of the production wells of this water works were highly contaminated with PFAS.9 The DW samples with concentrations in the upper range reported in Table S1 (ESI†) were taken close to the discovery of the contamination. Concentrations subsequently decreased due to efforts to mitigate the contamination.The adjusted mean PFHxS serum concentrations were significantly higher among children from schools receiving DW with median PFHxS concentrations of 2 ng L−1 and 17 ng L−1 than among children from schools with DW concentrations <1.6 ng PFHxS L−1 (Fig. 4). For PFOS higher adjusted mean concentrations were observed among children from schools with median DW concentrations of 3.9 and 5 ng L−1 than among children from schools with <1.0 ng PFOS L−1. Children from schools with median DW PFOA concentrations of 1.1–1.5 ng L−1 had significantly higher adjusted mean PFOA concentrations in serum than children in the group with <1.0 ng PFOA L−1 (Fig. 3). For PFHxS removal of three outliers did not markedly change the results of the serum and DW PFHxS association (F-value: 571, p < 0.001) compared with the results including all observations (F-value: 315, p < 0.001). Variation in DW PFHxS concentration explained 78% of the variation of serum PFHxS concentration, with the corresponding contribution for PFOS being 17% and for PFOA 16%.
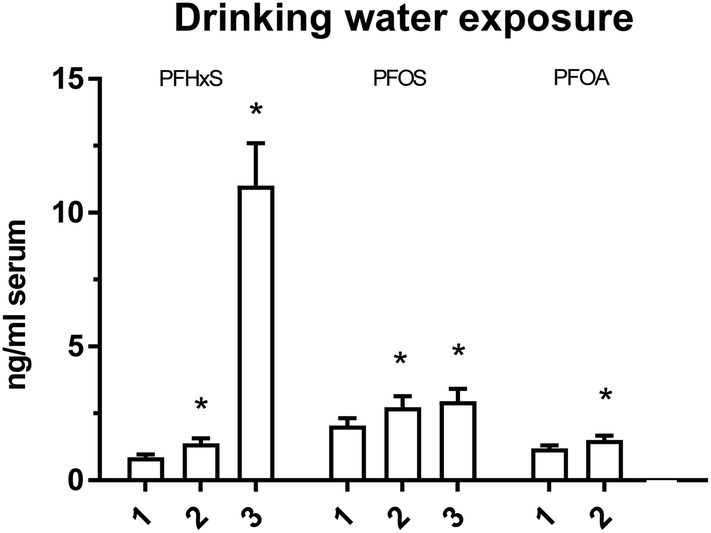 | ||
| Fig. 4 Adjusted mean (±standard error) concentrations of PFAAs in serum from 5th grade children living in Sweden, as determined by PFAA concentrations in drinking/raw water. PFAA concentrations in drinking/raw water from waterworks delivering drinking water to the schools of the children were divided into different categories based on median concentrations. PFHxS: 1 = <1.6 ng PFHxS L−1, 2 = 2 ng PFHxS L−1, 3 = 17 ng PFHxS L−1; PFOS: 1 = <1 ng PFOS L−1, 2 = 3 ng PFOS L−1, 3 = 5 ng PFOS L−1; PFOA: 1 = <1 ng PFOA L−1, 2 = 1.1–1.5 ng PFOA L−1. Regression models included covariates ‘sex’, ‘body height’, body weight’, ‘child birth country’, ‘maternal birth country’, ‘paternal education’, ‘maternal education’, ‘passive smoking’, ‘older siblings’ and ‘breastfeeding’. For PFHxS results are given for analyses with outliers (standardized residual ≥3) excluded from the data set. *Significantly different from children in schools with the lowest reported PFAA levels in the drinking water (p ≤ 0.05; PFHxS: N = 174; PFOS: N = 177; PFOA: N = 177). | ||
Theoretical intake calculations of PFAA intake from the other important PFAA exposure source, food, give support to the possibility that low-level PFAA contamination of drinking water may be a significant source of exposure for children. In a Swedish risk assessment from 2013 it was estimated that children (12 years of age) had a median food intake of PFHxS and PFOS of 0.043 and 0.35 ng kg body weight−1 day−1, respectively.78 In the present study, ingestion of 2 L of water day−1![[thin space (1/6-em)]](https://www.rsc.org/images/entities/char_2009.gif) 79 with average PFHxS concentrations of 2 and 17 ng PFHxS L−1 (ESI, Table S1†) would theoretically result in DW intakes of 0.1 and 0.9 ng PFHxS kg−1 day−1 (age 12 years, average body weight 40 kg), respectively. This is 2 and 20 times higher than the estimated average intake from food.78 The reported average PFOS concentrations in the water supply of 3.9 ng L−1 and 5 ng L−1 would result in intake of 0.2 and 0.3 ng per kg per day, being only slightly lower than the median intake from food (0.35 ng kg−1 day−1).78 PFOA drinking water intakes at the highest average PFOA concentrations in drinking water (1.1–1.5 ng L−1) would be 0.055–0.075 ng PFOA kg−1 day−1, which is 6–9% of the estimated average intake from food for 12 year-olds (0.86 ng PFOA kg body weight−1 day−1).78 There are however uncertainties in theoretical PFAA intake calculations from food, which is dependent on data both regarding consumption rates of a large variety of foods and occurrence data for PFAA in these foods. A Norwegian study estimated that a theoretical intake calculation of PFOA (20 ng per day), based on a food frequency questionnaire and occurrence pf PFOA in food, over-estimated the average PFOA intake 3 times compared with the average intake estimated from PFOA analyses of 1 day duplicate diet samples among 61 adults.80 Assuming a similar 3-fold overestimation of average intake of PFOA from food among 12 year old children in Sweden, a DW concentration of around 1 ng L−1 would represent an intake that is 20% of the average intake from food. Indoor dust has also been proposed as source of child PFAA exposure. A recent study reported modelled average PFOS and PFOA intakes from bedroom dust among Finnish children of 0.0006 and 0.0007 ng kg body weight−1 day−1, respectively, which is several orders of magnitude lower than estimated average intakes from low-level contaminated DW in the present study.81 Average PFHxS intake from dust could not be estimated due to many dust samples having too low PFHxS concentrations.81
79 with average PFHxS concentrations of 2 and 17 ng PFHxS L−1 (ESI, Table S1†) would theoretically result in DW intakes of 0.1 and 0.9 ng PFHxS kg−1 day−1 (age 12 years, average body weight 40 kg), respectively. This is 2 and 20 times higher than the estimated average intake from food.78 The reported average PFOS concentrations in the water supply of 3.9 ng L−1 and 5 ng L−1 would result in intake of 0.2 and 0.3 ng per kg per day, being only slightly lower than the median intake from food (0.35 ng kg−1 day−1).78 PFOA drinking water intakes at the highest average PFOA concentrations in drinking water (1.1–1.5 ng L−1) would be 0.055–0.075 ng PFOA kg−1 day−1, which is 6–9% of the estimated average intake from food for 12 year-olds (0.86 ng PFOA kg body weight−1 day−1).78 There are however uncertainties in theoretical PFAA intake calculations from food, which is dependent on data both regarding consumption rates of a large variety of foods and occurrence data for PFAA in these foods. A Norwegian study estimated that a theoretical intake calculation of PFOA (20 ng per day), based on a food frequency questionnaire and occurrence pf PFOA in food, over-estimated the average PFOA intake 3 times compared with the average intake estimated from PFOA analyses of 1 day duplicate diet samples among 61 adults.80 Assuming a similar 3-fold overestimation of average intake of PFOA from food among 12 year old children in Sweden, a DW concentration of around 1 ng L−1 would represent an intake that is 20% of the average intake from food. Indoor dust has also been proposed as source of child PFAA exposure. A recent study reported modelled average PFOS and PFOA intakes from bedroom dust among Finnish children of 0.0006 and 0.0007 ng kg body weight−1 day−1, respectively, which is several orders of magnitude lower than estimated average intakes from low-level contaminated DW in the present study.81 Average PFHxS intake from dust could not be estimated due to many dust samples having too low PFHxS concentrations.81
Despite the uncertainties in the present study, our results suggest that low-level contaminated drinking water (single PFAAs <10 ng L−1) is a significant source of PFHxS, PFOS and PFOA in Swedish children. The PFOA results are in agreement with the two previous studies suggesting a significant influence of low-level-contaminated DW on child PFOA exposure.35,76 Taken together, the results strongly suggest that exposure to low-level PFHxS-, PFOS- and PFOA-contaminated DW should be taken into account, together with exposure from food and other possible sources of exposure, in health risk assessment of PFAA exposure of children.
There are, however, still uncertainties regarding associations between serum and DW PFAA concentrations. Only a low number of analyses had been performed in most of the water works, only data for raw water were available in some cases, and different analytical laboratories were used. An additional uncertainty is that analytical details and quality control data for the PFAS analyses in DW by the commercial laboratories were not supplied to us from the water works. Furthermore, we had no information about inter-individual variation in DW consumption among the participating children and about DW sources outside school hours. Information was also lacking about how long the study participants had lived in the study areas. Moreover, the children from the Uppsala school were most probably exposed to higher PFAA concentrations before 2012 than indicated by the DW PFAA concentrations from 2012 and onwards when the PFAA contamination had been mitigated.9 This at least partly explains the higher adjusted mean serum PFHxS, PFOS and PFOA concentrations in DW category 3 (PFHxS and PFOS) and 2 (PFOA) (Fig. 3). However, despite these uncertainties we observed higher adjusted mean PFHxS and PFOS already among children in category 2 (Fig. 3), supporting the hypothesis that low-level PFHxS and PFOS contamination of DW is a significant source of exposure.
Risk assessment
Two of the participating children (boys, 1%) had a serum PFOS concentration marginally above the BMDL05 PFOS concentration modelled to be associated with a 5% decrease in levels of antibodies against diphtheria vaccine in 7 years old children (10.5 ng PFOS per mL).21 One participant with a serum concentration of 13 ng PFOS mL−1 was from the Uppsala OEM region and the other with 11 ng PFOS per mL was from the Linköping OEM region. None of the children had a serum PFOA concentration above 6 ng PFOA mL−1, estimated by EFSA to be the serum PFOA concentration attained at 12 years of age during life-time intake of PFOA at the TWI.21 This suggests that background PFOS and PFOA exposures from food and drinking water during the first decade of life in Sweden currently are of no health concern. However, in populations exposed to highly contaminated DW (>100 ng L−1) children may have PFOS and PFOA intakes high above the TWIs.10 Moreover, in the future risk assessment should be based on possible combination effects of the total mixture of PFAAs that children are exposed to, since several of the PFAAs studied by us act through the same toxicity pathways.17,82,83Conclusions
The phase-out of production and use of PFHxS, PFOS, PFOA and related compounds have resulted in decreasing human exposure in many parts of the world.38,84,85 Nevertheless, hot-spot PFAA pollution has contaminated ground and surface water used for DW production, resulting in very high exposures of the general population drinking the contaminated water.10,86 This contamination is currently not possible to mitigate at the primary source, and have already resulted in costly measures to decrease PFAA contamination of DW in the water works down-stream of the contamination source. However, there is also a more diffuse contamination of DW, well below PFAA levels that are currently proposed as non-regulatory health-based DW guidance levels.87–89 Our results illustrate the possibility that low-level PFAA-contaminated drinking water is an important exposure source of long-chain PFHxS, PFOS and PFOA among children in Sweden, explaining a significant portion of the variation in serum concentrations of these PFASs. Further studies are needed to determine if this also is the case for adults that have experienced larger historical exposures of these long-chain PFASs from other sources than DW than children. There is currently no requirements of regular PFAS monitoring in DW in Sweden, although many water works have included monitoring after risk analysis of potential contamination. Regular monitoring for all waterworks should be considered in the future. Our results suggest that determinants of child PFAA levels, such as child and maternal birth country, onset of menstrual bleeding (girls), and maternal/paternal education levels, are potential confounding factors to consider in future studies of PFAA and health associations.Conflicts of interest
There are no conflicting interest to declare.Acknowledgements
We are grateful to the children and personnel at the participating schools for taking time and effort to participate in sampling and data collection. Technical personnel at the OEMs are thanked for skillful technical support. The participating water works are thanked for sharing drinking water PFAS data. Financial support was given by the Swedish National Food Agency and the Swedish Civil Contingencies Agency.References
- J. S. Skaar, E. M. Raeder, J. L. Lyche, L. Ahrens and R. Kallenborn, Elucidation of contamination sources for poly- and perfluoroalkyl substances (PFASs) on Svalbard (Norwegian Arctic), Environ. Sci. Pollut. Res. Int., 2019, 26, 7356–7363 CrossRef CAS PubMed.
- L. Ahrens and M. Bundschuh, Fate and effects of poly- and perfluoroalkyl substances in the aquatic environment: a review, Environ. Toxicol. Chem., 2014, 33, 1921–1929 CrossRef CAS PubMed.
- H. Routti, B. A. Krafft, D. Herzke, R. Eisert and O. Oftedal, Perfluoroalkyl substances detected in the world's southernmost marine mammal, the Weddell seal (Leptonychotes weddellii), Environ. Pollut., 2015, 197, 62–67 CrossRef CAS PubMed.
- R. Vestergren, U. Berger, A. Glynn and I. T. Cousins, Dietary exposure to perfluoroalkyl acids for the Swedish population in 1999, 2005 and 2010, Environ. Int., 2012, 49, 120–127 CrossRef CAS PubMed.
- W. A. Gebbink, U. Berger and I. T. Cousins, Estimating human exposure to PFOS isomers and PFCA homologues: the relative importance of direct and indirect (precursor) exposure, Environ. Int., 2015, 74, 160–169 CrossRef CAS PubMed.
- P. Sjogren, R. Montse, E. Lampa, S. Salihovic, B. van Bavel, L. Lind and P. M. Lind, Circulating levels of perfluoroalkyl substances are associated with dietary patterns - a cross sectional study in elderly Swedish men and women, Environ. Res., 2016, 150, 59–65 CrossRef CAS PubMed.
- S. Beesoon, J. S. Genius, J. P. Benskin and J. W. Martin, Abnormally high serum levels of perfluorohexane sulfonates (PFHxS) in a Canadian family - a case study, Organohalogen Compd., 2010, 72, 1460–1463 Search PubMed.
- H. Nilsson, A. Karrman, A. Rotander, B. van Bavel, G. Lindstrom and H. Westberg, Professional ski waxers' exposure to PFAS and aerosol concentrations in gas phase and different particle size fractions, Environ. Sci.: Processes Impacts, 2013, 15, 814–822 RSC.
- I. Gyllenhammar, U. Berger, M. Sundstrom, P. McCleaf, K. Euren, S. Eriksson, S. Ahlgren, S. Lignell, M. Aune, N. Kotova and A. Glynn, Influence of contaminated drinking water on perfluoroalkyl acid levels in human serum--a case study from Uppsala, Sweden, Environ. Res., 2015, 140, 673–683 CrossRef CAS PubMed.
- Y. Li, T. Fletcher, D. Mucs, K. Scott, C. H. Lindh, P. Tallving and K. Jakobsson, Half-lives of PFOS, PFHxS and PFOA after end of exposure to contaminated drinking water, Occup. Environ. Med., 2018, 75, 46–51 CrossRef PubMed.
- E. A. Emmett, F. S. Shofer, H. Zhang, D. Freeman, C. Desai and L. M. Shaw, Community exposure to perfluorooctanoate: relationships between serum concentrations and exposure sources, J. Occup. Environ. Med., 2006, 48, 759–770 CrossRef CAS PubMed.
- M. Wilhelm, M. Kraft, K. Rauchfuss and J. Holzer, Assessment and management of the first German case of a contamination with perfluorinated compounds (PFC) in the Region Sauerland, North Rhine-Westphalia, J. Toxicol. Environ. Health, Part A, 2008, 71, 725–733 CrossRef CAS PubMed.
- A. M. Ingelido, A. Abballe, S. Gemma, E. Dellatte, N. Iacovella, G. De Angelis, F. Zampaglioni, V. Marra, R. Miniero, S. Valentini, F. Russo, M. Vazzoler, E. Testai and E. De Felip, Biomonitoring of perfluorinated compounds in adults exposed to contaminated drinking water in the Veneto Region, Italy, Environ. Int., 2018, 110, 149–159 CrossRef CAS PubMed.
- J. Stubleski, S. Salihovic, P. M. Lind, L. Lind, L. Dunder, P. McCleaf, K. Euren, L. Ahrens, M. Svartengren, B. van Bavel and A. Karrman, The effect of drinking water contaminated with perfluoroalkyl substances on a 10-year longitudinal trend of plasma levels in an elderly Uppsala cohort, Environ. Res., 2017, 159, 95–102 CrossRef CAS PubMed.
- M. Wilhelm, J. Holzer, L. Dobler, K. Rauchfuss, O. Midasch, M. Kraft, J. Angerer and G. Wiesmuller, Preliminary observations on perfluorinated compounds in plasma samples (1977-2004) of young German adults from an area with perfluorooctanoate-contaminated drinking water, Int. J. Hyg Environ. Health, 2009, 212, 142–145 CrossRef CAS PubMed.
- H. Lilienthal, H. H. Dieter, J. Holzer and M. Wilhelm, Recent experimental results of effects of perfluoroalkyl substances in laboratory animals - relation to current regulations and guidance values, Int. J. Hyg Environ. Health, 2017, 220, 766–775 CrossRef CAS PubMed.
- D. Borg, B. O. Lund, N. G. Lindquist and H. Hakansson, Cumulative health risk assessment of 17 perfluoroalkylated and polyfluoroalkylated substances (PFASs) in the Swedish population, Environ. Int., 2013, 59, 112–123 CrossRef CAS PubMed.
- K. Steenland, T. Fletcher and D. A. Savitz, Epidemiologic evidence on the health effects of perfluorooctanoic acid (PFOA), Environ. Health Perspect., 2010, 118, 1100–1108 CrossRef CAS PubMed.
- K. M. Rappazzo, E. Coffman and E. P. Hines, Exposure to Perfluorinated Alkyl Substances and Health Outcomes in Children: A Systematic Review of the Epidemiologic Literature, Int. J. Environ. Res. Publ. Health, 2017, 14, 691 CrossRef PubMed.
- NTP, NTP monograph on immunitoxicity associated with exposure to perfluorooctanoic acid (PFOA) or perfluorooctane sulfonate (PFOS), National Toxicology Program, Research Triangle Park, 2016 Search PubMed.
- EFSA, Risk to human health related to the presence of perfluorooctane sulfonic acid and perfluorooctanoic acid in food, EFSA J., 2018, 16, 5194, DOI:10.2903/j.efsa.2018.5194.
- EFSA, Minutes of the expert meeting on perfluorooctane sulfonic acid and perfluorooctanoic acid in food assessment, European Food Safety Authority, Unit of Biological Hazards and Contaminants, 2018, https://www.efsa.europa.eu/sites/default/files/news/efsa-contam-3503.pdf Search PubMed.
- K. Winkens, J. Koponen, J. Schuster, M. Shoeib, R. Vestergren, U. Berger, A. M. Karvonen, J. Pekkanen, H. Kiviranta and I. T. Cousins, Perfluoroalkyl acids and their precursors in indoor air sampled in children's bedrooms, Environ. Pollut., 2017, 222, 423–432 CrossRef CAS PubMed.
- A. Schecter, N. Malik-Bass, A. M. Calafat, K. Kato, J. A. Colacino, T. L. Gent, L. S. Hynan, T. R. Harris, S. Malla and L. Birnbaum, Polyfluoroalkyl compounds in Texas children from birth through 12 years of age, Environ. Health Perspect., 2012, 120, 590–594 CrossRef CAS PubMed.
- X. Ye, K. Kato, L. Y. Wong, T. Jia, A. Kalathil, J. Latremouille and A. M. Calafat, Per- and polyfluoroalkyl substances in sera from children 3 to 11 years of age participating in the National Health and Nutrition Examination Survey 2013-2014, Int. J. Hyg Environ. Health, 2018, 221, 9–16 CrossRef CAS PubMed.
- I. Gyllenhammar, J. P. Benskin, O. Sandblom, U. Berger, L. Ahrens, S. Lignell, K. Wiberg and A. Glynn, Perfluoroalkyl Acids (PFAAs) in Serum from 2-4-Month-Old Infants: Influence of Maternal Serum Concentration, Gestational Age, Breast-Feeding, and Contaminated Drinking Water, Environ. Sci. Technol., 2018, 52, 7101–7110 CrossRef CAS PubMed.
- H. Zhang, K. Yolton, G. M. Webster, X. Ye, A. M. Calafat, K. N. Dietrich, Y. Xu, C. Xie, J. M. Braun, B. P. Lanphear and A. Chen, Prenatal and childhood perfluoroalkyl substances exposures and children's reading skills at ages 5 and 8years, Environ. Int., 2018, 111, 224–231 CrossRef CAS PubMed.
- D. Mondal, R. H. Weldon, B. G. Armstrong, L. J. Gibson, M. J. Lopez-Espinosa, H. M. Shin and T. Fletcher, Breastfeeding: a potential excretion route for mothers and implications for infant exposure to perfluoroalkyl acids, Environ. Health Perspect., 2014, 122, 187–192 CrossRef PubMed.
- Y. A. Lee, J. H. Kim, H. W. Jung, Y. H. Lim, S. Bae, Y. Kho, Y. C. Hong, C. H. Shin and S. W. Yang, The serum concentrations of perfluoroalkyl compounds were inversely associated with growth parameters in 2-year old children, Sci. Total Environ., 2018, 628–629, 226–232 CrossRef CAS PubMed.
- E. Papadopoulou, A. Sabaredzovic, E. Namork, U. C. Nygaard, B. Granum and L. S. Haug, Exposure of Norwegian toddlers to perfluoroalkyl substances (PFAS): the association with breastfeeding and maternal PFAS concentrations, Environ. Int., 2016, 94, 687–694 CrossRef CAS PubMed.
- D. Mondal, M. J. Lopez-Espinosa, B. Armstrong, C. R. Stein and T. Fletcher, Relationships of perfluorooctanoate and perfluorooctane sulfonate serum concentrations between mother-child pairs in a population with perfluorooctanoate exposure from drinking water, Environ. Health Perspect., 2012, 120, 752–757 CrossRef CAS PubMed.
- I. T. Cousins, R. Vestergren, Z. Wang, M. Scheringer and M. S. McLachlan, The precautionary principle and chemicals management: The example of perfluoroalkyl acids in groundwater, Environ. Int., 2016, 94, 331–340 CrossRef CAS PubMed.
- I. Gyllenhammar, J. P. Benskin, O. Sandblom, U. Berger, L. Ahrens, S. Lignell, K. Wiberg and A. Glynn, Perfluoroalkyl Acids (PFAAs) in Children's Serum and Contribution from PFAA-Contaminated Drinking Water, Environ. Sci. Technol., 2019, 53, 11447–11457 CrossRef CAS PubMed.
- A. Glynn, Perfluorinated alkyl acids (PFAA) in Uppsala drinking water (in Swedish), 2012, https://www.slu.se/globalassets/nyhet-kalend/2017/pfasuppsalavattenklar_120830.pdf Search PubMed.
- M. Wilhelm, J. Wittsiepe, W. Volkel, H. Fromme and M. Kasper-Sonnenberg, Perfluoroalkyl acids in children and their mothers: association with drinking water and time trends of inner exposures--results of the Duisburg birth cohort and Bochum cohort studies, Int. J. Hyg Environ. Health, 2015, 218, 645–655 CrossRef CAS PubMed.
- X. C. Hu, A. K. Tokranov, J. Liddie, X. Zhang, P. Grandjean, J. E. Hart, F. Laden, Q. Sun, L. W. Y. Yeung and E. M. Sunderland, Tap Water Contributions to Plasma Concentrations of Poly- and Perfluoroalkyl Substances (PFAS) in a Nationwide Prospective Cohort of U.S. Women, Environ. Health Perspect., 2019, 127, 67006 CrossRef PubMed.
- A. Glynn, U. Berger, A. Bignert, S. Ullah, M. Aune, S. Lignell and P. O. Darnerud, Perfluorinated alkyl acids in blood serum from primiparous women in Sweden: serial sampling during pregnancy and nursing, and temporal trends 1996-2010, Environ. Sci. Technol., 2012, 46, 9071–9079 CrossRef CAS PubMed.
- E. Nyberg, R. Awad, A. Bignert, C. Ek, G. Sallsten and J. P. Benskin, Inter-individual, inter-city, and temporal trends of per- and polyfluoroalkyl substances in human milk from Swedish mothers between 1972 and 2016, Environ. Sci.: Processes Impacts, 2018, 20, 1136–1147 RSC.
- C. H. Lindh, L. Rylander, G. Toft, A. Axmon, A. Rignell-Hydbom, A. Giwercman, H. S. Pedersen, K. Goalczyk, J. K. Ludwicki, V. Zvyezday, R. Vermeulen, V. Lenters, D. Heederik, J. P. Bonde and B. A. Jonsson, Blood serum concentrations of perfluorinated compounds in men from Greenlandic Inuit and European populations, Chemosphere, 2012, 88, 1269–1275 CrossRef CAS PubMed.
- T. Zhang, H. Sun, Y. Lin, L. Wang, X. Zhang, Y. Liu, X. Geng, L. Zhao, F. Li and K. Kannan, Perfluorinated compounds in human blood, water, edible freshwater fish, and seafood in China: daily intake and regional differences in human exposures, J. Agric. Food Chem., 2011, 59, 11168–11176 CrossRef CAS PubMed.
- H. Bjermo, P. O. Darnerud, M. Pearson, H. E. Barbieri, A. K. Lindroos, C. Nalsen, C. H. Lindh, B. A. Jonsson and A. Glynn, Serum concentrations of perfluorinated alkyl acids and their associations with diet and personal characteristics among Swedish adults, Mol. Nutr. Food Res., 2013, 57, 2206–2215 CrossRef CAS PubMed.
- H. Hemat, M. Wilhelm, W. Volkel, C. Mosch, H. Fromme and J. Wittsiepe, Low serum levels of perfluorooctanoic acid (PFOA), perfluorooctane sulfonate (PFOS) and perfluorohexane sulfonate (PFHxS) in children and adults from Afghanistan, Sci. Total Environ., 2010, 408, 3493–3495 CrossRef CAS PubMed.
- A. Ode, L. Rylander, C. H. Lindh, K. Kallen, B. A. Jonsson, P. Gustafsson, P. Olofsson, S. A. Ivarsson and A. Rignell-Hydbom, Determinants of maternal and fetal exposure and temporal trends of perfluorinated compounds, Environ. Sci. Pollut. Res. Int., 2013, 20, 7970–7978 CrossRef CAS PubMed.
- UN, Country classification. Data sources, country classifications and aggregation methology, World Economic Situation and Prospects (WESP), United Nations, 2014, http://www.un.org/en/development/desa/policy/wesp/wesp_current/2014wesp_country_classification.pdf Search PubMed.
- S. K. Sagiv, S. L. Rifas-Shiman, T. F. Webster, A. M. Mora, M. H. Harris, A. M. Calafat, X. Ye, M. W. Gillman and E. Oken, Sociodemographic and Perinatal Predictors of Early Pregnancy Per- and Polyfluoroalkyl Substance (PFAS) Concentrations, Environ. Sci. Technol., 2015, 49, 11849–11858 CrossRef CAS PubMed.
- M. S. Tsai, C. Miyashita, A. Araki, S. Itoh, Y. A. Bamai, H. Goudarzi, E. Okada, I. Kashino, H. Matsuura and R. Kishi, Determinants and Temporal Trends of Perfluoroalkyl Substances in Pregnant Women: The Hokkaido Study on Environment and Children's Health, Int. J. Environ. Res. Publ. Health, 2018, 15, 989 CrossRef PubMed.
- C. Fei, J. K. McLaughlin, R. E. Tarone and J. Olsen, Perfluorinated chemicals and fetal growth: a study within the Danish National Birth Cohort, Environ. Health Perspect., 2007, 115, 1677–1682 CrossRef CAS PubMed.
- M. Lorber, G. E. Eaglesham, P. Hobson, L. M. Toms, J. F. Mueller and J. S. Thompson, The effect of ongoing blood loss on human serum concentrations of perfluorinated acids, Chemosphere, 2015, 118, 170–177 CrossRef CAS PubMed.
- F. Wong, M. MacLeod, J. F. Mueller and I. T. Cousins, Enhanced elimination of perfluorooctane sulfonic acid by menstruating women: evidence from population-based pharmacokinetic modeling, Environ. Sci. Technol., 2014, 48, 8807–8814 CrossRef CAS PubMed.
- M. I. Gomis, R. Vestergren, M. MacLeod, J. F. Mueller and I. T. Cousins, Historical human exposure to perfluoroalkyl acids in the United States and Australia reconstructed from biomonitoring data using population-based pharmacokinetic modelling, Environ. Int., 2017, 108, 92–102 CrossRef CAS PubMed.
- C. R. Stein, K. J. McGovern, A. M. Pajak, P. J. Maglione and M. S. Wolff, Perfluoroalkyl and polyfluoroalkyl substances and indicators of immune function in children aged 12-19 y: National Health and Nutrition Examination Survey, Pediatr. Res., 2016, 79, 348–357 CrossRef CAS PubMed.
- G. H. Dong, K. Y. Tung, C. H. Tsai, M. M. Liu, D. Wang, W. Liu, Y. H. Jin, W. S. Hsieh, Y. L. Lee and P. C. Chen, Serum polyfluoroalkyl concentrations, asthma outcomes, and immunological markers in a case-control study of Taiwanese children, Environ. Health Perspect., 2013, 121, 507–513 CrossRef PubMed.
- K. Ji, S. Kim, Y. Kho, D. Paek, J. Sakong, J. Ha, S. Kim and K. Choi, Serum concentrations of major perfluorinated compounds among the general population in Korea: dietary sources and potential impact on thyroid hormones, Environ. Int., 2012, 45, 78–85 CrossRef CAS PubMed.
- S. J. Frisbee, A. Shankar, S. S. Knox, K. Steenland, D. A. Savitz, T. Fletcher and A. M. Ducatman, Perfluorooctanoic acid, perfluorooctanesulfonate, and serum lipids in children and adolescents: results from the C8 Health Project, Arch. Pediatr. Adolesc. Med., 2010, 164, 860–869 CrossRef PubMed.
- P. Weihe, K. Kato, A. M. Calafat, F. Nielsen, A. A. Wanigatunga, L. L. Needham and P. Grandjean, Serum concentrations of polyfluoroalkyl compounds in Faroese whale meat consumers, Environ. Sci. Technol., 2008, 42, 6291–6295 CrossRef CAS PubMed.
- T. A. Morck, F. Nielsen, J. K. Nielsen, V. D. Siersma, P. Grandjean and L. E. Knudsen, PFAS concentrations in plasma samples from Danish school children and their mothers, Chemosphere, 2015, 129, 203–209 CrossRef PubMed.
- EPA, EPA and 3M announce phase out of PFOS, 2000, http://yosemite.epa.gov/opa/admpress.nsf/0/33aa946e6cb11f35852568e1005246b4?opendocument Search PubMed.
- EPA, 2010/2015 PFOA Stewardship Program, 2015, https://www.epa.gov/assessing-and-managing-chemicals-under-tsca/20102015-pfoa-stewardship-program Search PubMed.
- S. Brendel, E. Fetter, C. Staude, L. Vierke and A. Biegel-Engler, Short-chain perfluoroalkyl acids: environmental concerns and a regulatory strategy under REACH, Environ. Sci. Eur., 2018, 30, 9 CrossRef PubMed.
- L. Schultes, R. Vestergren, K. Volkova, E. Westberg, T. Jacobson and J. P. Benskin, Per- and polyfluoroalkyl substances and fluorine mass balance in cosmetic products from the Swedish market: implications for environmental emissions and human exposure, Environ. Sci.: Processes Impacts, 2018, 20, 1680–1690 RSC.
- T. Zhang, Q. Wu, H. W. Sun, X. Z. Zhang, S. H. Yun and K. Kannan, Perfluorinated compounds in whole blood samples from infants, children, and adults in China, Environ. Sci. Technol., 2010, 44, 4341–4347 CrossRef CAS PubMed.
- Y. Oulhote, U. Steuerwald, F. Debes, P. Weihe and P. Grandjean, Behavioral difficulties in 7-year old children in relation to developmental exposure to perfluorinated alkyl substances, Environ. Int., 2016, 97, 237–245 CrossRef CAS PubMed.
- R. B. Jain, Contribution of diet and other factors to the observed levels of selected perfluoroalkyl acids in serum among US children aged 3-11 years, Environ. Res., 2018, 161, 268–275 CrossRef CAS PubMed.
- P. Prentice and R. M. Viner, Pubertal timing and adult obesity and cardiometabolic risk in women and men: a systematic review and meta-analysis, Int. J. Obes., 2013, 37, 1036–1043 CrossRef CAS PubMed.
- N. Chatterjee, J. Shi and M. Garcia-Closas, Developing and evaluating polygenic risk prediction models for stratified disease prevention, Nat. Rev. Genet., 2016, 17, 392–406 CrossRef CAS PubMed.
- A. K. Morrison, A. Glick and H. S. Yin, Health Literacy: Implications for Child Health, Pediatr. Rev., 2019, 40, 263–277 CrossRef PubMed.
- I. Kawachi, N. E. Adler and W. H. Dow, Money, schooling, and health: mechanisms and causal evidence, Ann. N. Y. Acad. Sci., 2010, 1186, 56–68 CrossRef PubMed.
- E. L. Rush, A. B. Singer, M. P. Longnecker, L. S. Haug, A. Sabaredzovic, E. Symanski and K. W. Whitworth, Oral contraceptive use as a determinant of plasma concentrations of perfluoroalkyl substances among women in the Norwegian Mother and Child Cohort (MoBa) study, Environ. Int., 2018, 112, 156–164 CrossRef CAS PubMed.
- H. Wu, M. Yoon, M. A. Verner, J. Xue, M. Luo, M. E. Andersen, M. P. Longnecker and H. J. Clewell 3rd, Can the observed association between serum perfluoroalkyl substances and delayed menarche be explained on the basis of puberty-related changes in physiology and pharmacokinetics?, Environ. Int., 2015, 82, 61–68 CrossRef CAS PubMed.
- T. Shoeib, Y. Hassan, C. Rauert and T. Harner, Poly- and perfluoroalkyl substances (PFASs) in indoor dust and food packaging materials in Egypt: trends in developed and developing countries, Chemosphere, 2016, 144, 1573–1581 CrossRef CAS PubMed.
- A. Jahnke, U. Berger, R. Ebinghaus and C. Temme, Latitudinal gradient of airborne polyfluorinated alkyl substances in the marine atmosphere between Germany and South Africa (53 degrees N-33 degrees S), Environ. Sci. Technol., 2007, 41, 3055–3061 CrossRef CAS PubMed.
- Y. Zhang, S. Beesoon, L. Zhu and J. W. Martin, Biomonitoring of perfluoroalkyl acids in human urine and estimates of biological half-life, Environ. Sci. Technol., 2013, 47, 10619–10627 CrossRef CAS PubMed.
- I. Gyllenhammar, J. P. Benskin, O. Sandblom, U. Berger, L. Ahrens, S. Lignell, K. Wiberg and A. Glynn, Perfluoroalkyl Acids (PFAAs) in Serum from 2-4-Month-Old Infants: Influence of Maternal Serum Concentration, Gestational Age, Breast-Feeding, and Contaminated Drinking Water, Environ. Sci. Technol., 2018, 52, 7101–7110 CrossRef CAS PubMed.
- H. Fromme, C. Mosch, M. Morovitz, I. Alba-Alejandre, S. Boehmer, M. Kiranoglu, F. Faber, I. Hannibal, O. Genzel-Boroviczeny, B. Koletzko and W. Volkel, Pre- and postnatal exposure to perfluorinated compounds (PFCs), Environ. Sci. Technol., 2010, 44, 7123–7129 CrossRef CAS PubMed.
- U. B. Mogensen, P. Grandjean, F. Nielsen, P. Weihe and E. Budtz-Jorgensen, Breastfeeding as an Exposure Pathway for Perfluorinated Alkylates, Environ. Sci. Technol., 2015, 49, 10466–10473 CrossRef CAS PubMed.
- I. Gyllenhammar, J. P. Benskin, O. Sandblom, U. Berger, L. Ahrens, S. Lignell, K. Wiberg and A. Glynn, Perfluoroalkyl acids (PFAAs) in children's serum and contribution from PFAA contaminated drinking water, Environ. Sci. Technol., 2019 Search PubMed , http://vav.griffel.net/filer/SVU-rapport_2014-20.pdf.
- K. Holmström, S. Wetterstrand and G. Hedenberg, National screening of perfluorinated contaminants (PFAA) in drinking water, Report from the Swedish Water & Wastewater Association (in Swedish), 2014, pp. 2014-2020, E-mail: http://vav.griffel.net/filer/SVU-rapport_2014-2020.pdf Search PubMed.
- A. Glynn, T. Cantillana and H. Bjermo, Risk assessment of perfluorinated alkyl acids in food and drinking water, Livsmedelsverket Rapport 11-2013, 2013, https://www.livsmedelsverket.se/globalassets/rapporter/2013/riskvardering_av_perfluorerade_alkylsyror_i_livsmedel.pdf Search PubMed.
- EFSA, Scientific opinion on dietary reference values for water, EFSA J., 2010, 8, 1459 Search PubMed.
- E. Papadopoulou, S. Poothong, J. Koekkoek, L. Lucattini, J. A. Padilla-Sanchez, M. Haugen, D. Herzke, S. Valdersnes, A. Maage, I. T. Cousins, P. E. G. Leonards and L. Smastuen Haug, Estimating human exposure to perfluoroalkyl acids via solid food and drinks: Implementation and comparison of different dietary assessment methods, Environ. Res., 2017, 158, 269–276 CrossRef CAS PubMed.
- K. Winkens, G. Giovanoulis, J. Koponen, R. Vestergren, U. Berger, A. M. Karvonen, J. Pekkanen, H. Kiviranta and I. T. Cousins, Perfluoroalkyl acids and their precursors in floor dust of children's bedrooms - implications for indoor exposure, Environ. Int., 2018, 119, 493–502 CrossRef CAS PubMed.
- C. J. Wolf, C. V. Rider, C. Lau and B. D. Abbott, Evaluating the additivity of perfluoroalkyl acids in binary combinations on peroxisome proliferator-activated receptor-alpha activation, Toxicology, 2014, 316, 43–54 CrossRef CAS PubMed.
- A. K. Rosenmai, L. Ahrens, T. Le Godec, J. Lundqvist and A. Oskarsson, Relationship between PPARα activity and cellular concentration of 14 perfluoroalkyl substances in HepG2 cells, J. Appl. Toxicol., 2018, 38, 219–226 CrossRef CAS PubMed.
- S. Hurley, D. Goldberg, M. Wang, J. S. Park, M. Petreas, L. Bernstein, H. Anton-Culver, D. O. Nelson and P. Reynolds, Time Trends in Per- and Polyfluoroalkyl Substances (PFASs) in California Women: Declining Serum Levels, 2011-2015, Environ. Sci. Technol., 2018, 52, 277–287 CrossRef CAS PubMed.
- M. Land, C. A. de Wit, I. T. Cousins, D. Herzke, J. Johansson and J. W. Martin, What is the effect of phasing out long-chain per- and polyfluoroalkyl substances on the concentrations of perfluoroalkyl acids and their precursors in the environment? A systematic review protocol, Environ. Evid., 2015, 4, 3 CrossRef.
- E. A. Emmett, H. Zhang, F. S. Shofer, D. Freeman, N. V. Rodway, C. Desai and L. M. Shaw, Community exposure to perfluorooctanoate: relationships between serum levels and certain health parameters, J. Occup. Environ. Med., 2006, 48, 771–779 CrossRef CAS PubMed.
- Livsmedelsverket, Risk management of PFAS in drinking water and fish (in Swedish), 2016, http://www.livsmedelsverket.se/livsmedel-och-innehall/oonskade-amnen/miljogifter/pfas-poly-och-perfluorerade-alkylsubstanser/riskhantering-pfaa-i-dricksvatten/ Search PubMed.
- EPA, Drinking water health advisories for PFOA and PFOS, 2016, https://www.epa.gov/ground-water-and-drinking-water/drinking-water-health-advisories-pfoa-and-pfos Search PubMed.
- N. Jersey, Contaminants of emerging concern, 2017, https://www.nj.gov/dep/srp/emerging-contaminants/ Search PubMed.
Footnote |
| † Electronic supplementary information (ESI) available. See DOI: 10.1039/c9em00497a |
| This journal is © The Royal Society of Chemistry 2020 |