
 Open Access Article
 This Open Access Article is licensed under a Creative Commons Attribution-Non Commercial 3.0 Unported Licence
Framework for evaluating the performance limits of membraneless electrolyzers†
Xueqi
Pang
 a,
Jonathan T.
Davis
a,
Albert D.
Harvey
III
b and
Daniel V.
Esposito
*a
a,
Jonathan T.
Davis
a,
Albert D.
Harvey
III
b and
Daniel V.
Esposito
*a
aColumbia University in the City of New York, Department of Chemical Engineering, Columbia Electrochemical Energy Center, Lenfest Center for Sustainable Energy, New York, NY 10027, USA. E-mail: de2300@columbia.edu; Tel: +1-212-854-2648
bShell International Exploration & Production, Inc., Houston, TX 77082, USA
First published on 15th September 2020
Abstract
Emerging membraneless electrolyzers offer an attractive approach to lowering the cost of hydrogen (H2) production from water electrolysis thanks to potential advantages in durability and manufacturability that are made possible by elimination of membranes or diaphragms from the device architecture. However, a fair comparison of the performance limits of membraneless electrolyzers to conventional electrolyzers is hindered by the early stage of research and absence of established design rules for the former. This task is made all the more difficult by the need to quantitatively describe multiphase flow between the electrodes in membraneless electrolyzers, which can have a huge impact on gas product purity. Using a parallel plate membraneless electrolyzer (PPME) as a model system, this study takes a combined experimental and modeling approach to explore its performance limits and quantitatively describe the trade-offs between efficiency, current density, electrode size, and product purity. Central to this work is the use of in situ high-speed videography (HSV) to monitor the width of H2 bubble plumes produced downstream of parallel plate electrodes as a function of current density, electrode separation distance, and the Reynolds number (Re) associated with flowing 0.5 M H2SO4 electrolyte. These measurements reveal that the HSV-derived dimensionless bubble plume width serves as an excellent descriptor for correlating the aforementioned operating conditions with H2 crossover rates. These empirical relationships, combined with electrochemical engineering design principles, provide a valuable framework for exploring performance limits and guiding the design of optimized membraneless electrolyzers. Our analysis shows that the efficiencies and current densities of optimized PPMEs constrained to H2 crossover rates of 1% can exceed those of conventional alkaline electrolyzers but are lower than the efficiencies and current densities achieved by zero-gap polymer electrolyte membrane (PEM) electrolyzers.
Broader contextWater electrolysis powered by solar- or wind-derived electricity is a promising technology for the production of H2 in a renewable energy future. However, less than 5% of H2 generated in the world today comes from water electrolysis because of its high cost compared to producing H2 from steam methane reforming. Decreasing costs of electricity from solar and wind generators are helping to reduce this gap, but the lower capacity factor of electrolyzers operating primarily or exclusively using electricity from intermittent renewable sources makes it critically important to reduce the capital costs of electrolyzers. Membraneless electrolyzers developed in recent years represent a promising approach to decrease capital costs by reducing the number of cell components while presenting an opportunity to improve stack lifetime by omitting a membrane or diaphragm divider. Motivated by the need to better understand the performance limits of membraneless electrolyzers compared to conventional designs, this study describes and demonstrates a combined experimental and modelling framework to investigate the trade-offs between the efficiency, current density, product purity, and electrode size in model parallel plate membraneless electrolyzers. This framework shows that the performance limits of a model parallel plate membraneless electrolyzer can exceed the typical performance of conventional alkaline electrolyzers. |
Introduction
The continued growth in global solar photovoltaic and wind installations is expected to be one of the most important enablers for reducing anthropogenic carbon dioxide emissions,1 but the intermittency of these energy sources raises significant challenges to integrate them into today's energy system.2 Electrochemical devices called electrolyzers offer an attractive means of absorbing large amounts of excess renewable electricity by using it to convert water into a storable, carbon-free fuel in the form of H2.3–5 However, the cost of splitting water to produce H2 with conventional electrolyzers is currently much higher than steam methane reforming.6Presently, there are two types of electrolyzers that dominate the market: alkaline electrolyzers and PEM electrolyzers.7 As an alternative, membraneless electrolyzers have potential to decrease material and assembly costs thanks to simpler device designs that can be made from fewer components.8–10 The absence of a membrane or diaphragm divider also creates an opportunity for stable operation in harsh environments, while the relative simplicity of membraneless electrolyzers also makes them attractive as a platform for studying multi-scale electrochemical phenomena or carrying out fundamental electrocatalysis research. Membraneless electrolyzers can be generally grouped into two categories that are differentiated based on the type of electrodes they employ: (i) flow-through and (ii) flow-by. Flow-through electrodes allow flowing electrolyte to pass through the electrodes, while flow-by electrodes rely on electrolyte flow that is parallel to the surface of the electrodes. One of the most commonly explored membraneless electrolyzer designs is based on flow-by electrodes that are positioned in a parallel plate geometry,9,11 as illustrated in Fig. 1a. During water electrolysis, H2 and oxygen (O2) bubbles generated at the electrode surfaces are swept downstream into separate effluent channels by the flowing electrolyte. The gas bubbles travel in close proximity to the channel walls because the velocity gradients associated with laminar flow create a net inertial lift force that directs them away from the centerline of the channel, a phenomena known as the Segré–Silberberg effect.12–14 The vast majority of membraneless electrolyzer demonstrations based on flow-through electrodes similarly rely on flow-induced separation of product species,15–17 although a recent study from our lab has also demonstrated the ability to achieve relatively pure product streams using only the buoyancy of the product gas bubbles.18 Regardless of the mechanism of product separation, the absence of a physical barrier between electrodes in membraneless electrolyzers makes it especially important to quantitatively understand how bubble dynamics affect product purity for different cell geometries and operating conditions.
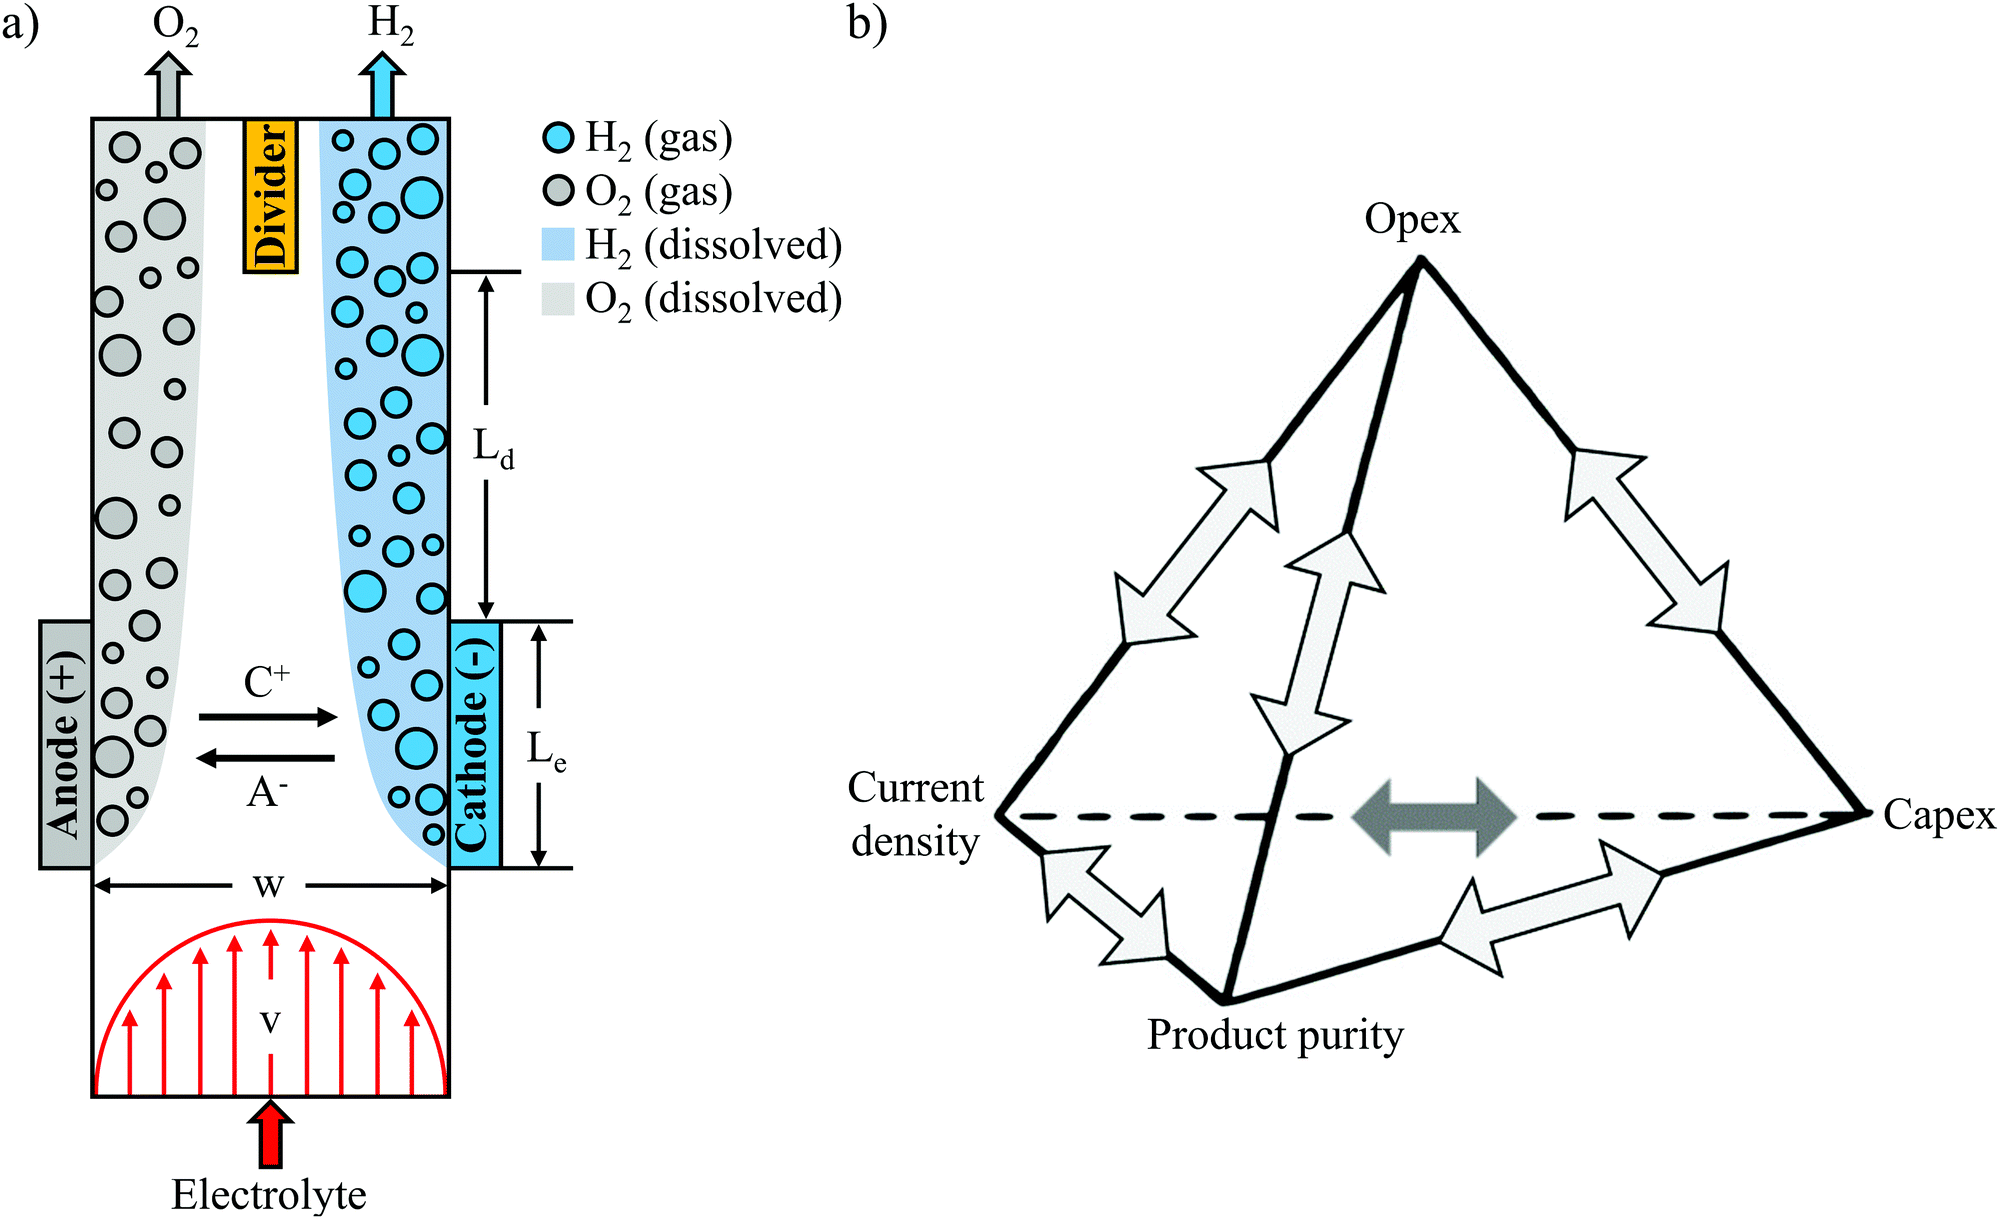 | ||
| Fig. 1 (a) Schematic top-view of the parallel plate membraneless electrolyzer (PPME). H2 and O2 are generated at the cathode and anode, respectively. A− and C+ represent the anion and cation species in the electrolyte. (b) “Unfortunate tetrahedron” of membraneless electrolyzers highlighting trade-offs between key technoeconomic performance metrics. Current density is synonymous with production rate, while product purity is a proxy for process safety. | ||
Experimental studies of membraneless electrolyzers have demonstrated current densities exceeding 3.5 A cm−2,10 efficiencies above 58% (based on ΔG° = 237 kJ mol−1 H2) at 0.2 A cm−2,11 H2 crossover rates below 0.4%,9,10 and electrode sizes up to 344 cm2,19 but never at the same time. The reason is that these performance metrics are all closely coupled, with numerous trade-offs between efficiency, current density, product purity, and electrode size. It is relatively straight-forward to modify the design of a membraneless electrolyzer to maximize any one of these parameters, but doing so will invariably have an adverse effect on one or more of the other key performance metrics. Taking as an example the parallel plate membraneless electrolyzer (PPME), the electrolysis efficiency at a given current density can be easily increased by decreasing the separation distance between the two electrodes, but doing so will lead to a concomitant decrease in product purity or maximum electrode size. The relationships and associated trade-offs between strongly-coupled technoeconomic performance metrics have been graphically illustrated in the design of batteries in what has been referred to as the “unfortunate tetrahedron”.20 The lines forming the edges of the tetrahedron represent the design rules governing the direct binary relationships between two metrics located at the tetrahedron vertices, while each face of the tetrahedron, termed a “triplet”, connects three key metrics that are strongly coupled with each other. Within the unfortunate tetrahedron for batteries, the four key performance metrics of operating expenditure (opex), capital expenditure (capex), power density, and energy density are positioned at the vertices of the tetrahedron. Extending this concept to electrolyzers, Fig. 1b presents an unfortunate tetrahedron for membraneless electrolyzers, where opex (related to efficiency), capex (related to electrode size and scalability), current density, and product purity (a proxy for safety) have been selected as four key performance metrics. The electrolyzer and battery tetrahedrons have a lot in common, sharing several performance metrics of interest that are either identical or very similar. These similarities reflect the fact that there are similar design constraints for these two electrochemical energy conversion devices, but there are differences as well. In particular, electrolyzers are open systems with reactants flowing in and energy carriers flowing out, whereas batteries tend to be closed systems which are themselves energy storage devices. Thus, we have replaced “energy density” with “product purity” in Fig. 1b, where the latter is a key performance metric for membraneless electrolyzers that is closely interconnected with the other three vertices in the tetrahedron. With an eye towards the ultimate goals of minimizing the levelized cost of hydrogen (LCOH) production and maximizing safety, it is essential that engineering design rules be developed that accurately describe the trade-offs between the key performance metrics. Although select binary relationships have been previously studied for various membraneless electrolyzer designs,9–11 a wholistic modeling framework that describes the relationships between all of the key performance metrics shown in Fig. 1b has yet to be established.
A primary objective for this study was to develop such a modeling framework for the PPME shown in Fig. 1a. This particular electrolyzer was chosen as a basis for this study because its simple design is characterized by a small number of key geometric parameters: the distance between electrodes (w), electrode length (Le), distance between the end of the electrodes and downstream divider (Ld), and the height of the electrodes (H), which extends into the page. The geometric simplicity makes this design amenable to the application of established electrochemical modeling approaches, in addition to providing a convenient platform to study the multi-phase flow behavior of the plumes of product gases evolved from the electrodes using in situ high speed videography (HSV). Accurate descriptions of bubble plume dynamics and their dependencies on key operating parameters are essential for understanding how the product purity vertex in Fig. 1b is coupled to key performance metrics related to the other three vertices. This study builds off of several other recent studies that have used HSV to study bubble dynamics in membraneless electrolyzers. Notably, Hashemi et al. used in situ HSV to observe trends in bubble dynamics at different Reynolds numbers (Re) and current densities,9,11 while Gillespie et al. used in situ imaging to observe bubble build-up between flow-through electrodes—a phenomena termed void fracture—at low electrolyte flow rates.10 More recently, our group has used in situ HSV to quantify bubble size distributions, gas evolution efficiencies, and current density distributions in a membraneless electrolyzer based on angled mesh flow-through electrodes.21
Expanding on the quantitative image analysis methods developed in prior work, the present study applies HSV to quantify the effective width of bubble plumes evolved downstream of parallel plate electrodes as a function of current density and Re. The fluid flow between the two electrodes is characterized for two different values of the channel width, w. As will be shown later in this article, the dimensionless bubble plume width, which is normalized by w, is found to be strongly correlated with H2 cross-over rates, and hence, product purity. After describing the experimental set-up and methodologies used to quantify bubble plume widths, correlations between plume widths, operating currents, and H2 crossover rates are presented. The correlations between these three parameters are then applied in conjunction with an electrolyzer model to map out the relationships between key performance metrics that are directly related to the vertices of the unfortunate tetrahedron in Fig. 1b. Finally, the modeled performance limits of the PPME based on this work are compared to the performance of conventional alkaline and PEM electrolyzers. Collectively, this work presents a combined experimental and modeling approach that can be broadly applied to establish the performance limits of membraneless electrolyzers and develop design rules for selecting a combination of geometric and operational parameters that will optimize the overall performance or cost of an electrolyzer.
Materials and methods
Chemicals
All solutions were prepared using 18.2 MΩ cm deionized water. Electrolytes were prepared using concentrated sulfuric acid (Certified ACS plus, Fisher Scientific). For every 100 mL electrolyte, one drop of Triton X-100 surfactant was added to the electrolyte in order to reduce the average bubble detachment size from the electrodes, as is well known in literature.22,23 Adding surfactant to the electrolyte is especially beneficial for smooth planar electrodes such as the Pt thin films used in this study, but can be avoided in commercial applications with higher surface area, textured electrodes that tend to make electrodes more hydrophilic and reduce the size of departing bubbles.24,25 Electrolyte solutions were purged with argon (Ar) (PurityPlus, 99.998% purity). Green food coloring dye (McCormick) was injected into the entrance port of the flow cell to monitor streamlines at varying Re.Electrode fabrication
All electrodes were fabricated by using electron-beam evaporation to sequentially deposit 2 nm of titanium (Ti) (99.99%) and 50 nm platinum (Pt) (99.99%) onto Ti foil substrates (0.127 mm thick, annealed, 99% metals basis, Alfa Aesar). Electrodes were fabricated with a length of 0.90 cm and a width of 0.34 cm, resulting in an area of 0.30 cm2.Electrolyzer fabrication
Electrolysis cells were printed from polylactic acid (PLA) using a MakerGear M3-ID 3D printer. The rectangular fluidic channel within the electrolyzer was 145 mm long, 2 or 4 mm wide and 5 mm high, with a 29 mm long by 0.4 mm thick divider placed 12 mm downstream of the end of the electrodes. Two rectangular metal foils containing electrodes were bent to an angle of 135° at a length of 0.90 cm and slid into slits on both sides of the cell before being epoxied (ClearWeld, J.B. Weld) in place. Two glass microscope slides (76.2 mm × 25.4 mm × 1 mm) were then epoxied to the front and back of the device to allow backlighting during in situ HSV measurements. A computer aided design (CAD) rendering of the assembled cell is shown in Fig. S1 (ESI†), and CAD files for the two cells are freely available for download at http://echem.io.Device characterization and operation
Flexible silicone tubing (Masterflex L/S 24, Cole Parmer) was fitted to the electrolyzer inlet. 1/8′′ polyethylene straight connectors (Cole Parmer) were epoxied to the outlets of the device and flexible silicone tubing (Masterflex L/S 16, Cole Parmer) was fitted to the outlet connectors. The electrolyzer was then mounted vertically such that the inlet and outlet ports pointed downwards and upwards, respectively. The tubing connected to the inlet port was connected to a pulse dampener (Cole Parmer), which was in turn connected to a peristaltic pump (Cole Parmer). The end of the inlet tube was submerged in the 0.5 M sulfuric acid electrolyte, which was continuously purged with Ar gas for at least 90 min before each experiment. The outlet tubes were connected to a gas collection apparatus as shown in Fig. S2 (ESI†). The electrolyte flowing out of the collection apparatus was sent to a separate reservoir. This “once-through” set-up was chosen over a recirculating system to ensure that crossover rates were not artificially increased by dissolved gases passing through the system multiple times in the absence of a phase separator. Although the percentage of H2 entering the dissolved phase will be increased with this once-through set-up, it can be lowered by decreasing Re and/or increasing current density and electrode size (Fig. S3, ESI†).All electrochemical measurements were carried out at room temperature using a Biologic SP-300 potentiostat/galvanostat. Electrochemical impedance spectroscopy (EIS) measurements were conducted at a constant applied cell voltage of 0.2 V vs. open circuit potential using an AC amplitude of 10 mV with a frequency range between 100 mHz and 200 kHz. Constant current electrolysis experiments were conducted for 30–90 minutes after purging the electrolyte feed reservoir for at least 90 minutes. HSVs of bubble dynamics within the fluidic channel were recorded using an Edgertronic SC1 high-speed camera operating at 1000 frames per second (fps) for Re up to 796 and 2000 fps for Re above 796 with a resolution of 288 × 1280 pixels. The camera was fitted with a FotodioX 52 mm reverse lens adaptor ring and a Nikon AF Nikkor 50 mm f/1.8D lens. The length of each HSV was 10 seconds.
HSV processing
Still frame images from HSVs were cropped to an analysis area spanning the half channel width (0.5w) on the cathode side of the cell. Cropped images started from the downstream edge of the electrode to the bottom of the divider separating the anode and cathode effluent streams. This analysis area located downstream of the electrodes was chosen because the total flux of bubbles entering and leaving the analyzed area remains constant, thereby simplifying the analysis for quantification of the average bubble plume width. The imfindcircles function within the MATLAB Image Processing Toolbox (R2019a) was then used to locate bubbles and estimate their radii.21 In order to determine the two-dimensional coverage of bubbles in each image, the bwareaopen function in MATLAB was used to convert the greyscale raw image into a binary black and white image, with bubble size thresholds and bubble locations used to avoid underestimation in the bubble coverage caused by local bright spots from the bubbles. The 2D coverage of bubbles was then used to determine the local void fraction of bubbles within each 100 by 40 μm pixel in the image. This algorithm was applied to 100 frames of each video (Δt = 0.1 s between consecutive frames), and the average void fraction values for each pixel were used to generate bubble void fraction maps.Finite element modeling
The potential field in the electrolyte was modeled using COMSOL 5.4 Electrodeposition Multiphysics package. The total solution resistance (Rs) was computed from Ohm's law for different channel widths and electrode lengths with solution conductivities (κ) of 0.226 S cm−1 (corresponding to 0.5 M H2SO4) and 0.621 S cm−1 (corresponding to 30 wt% KOH).Analysis of product gas composition
Gas chromatography (GC) measurements were performed using a model 8610C gas chromatograph (SRI Instruments) equipped with an 18′′ HayeSep D packed column, a 3′ Molecular Sieve 5A packed column, and a thermal conductivity detector (TCD) using Ar as a carrier gas. The gaseous electrolysis products were collected in separate vertically-oriented glass tubes that were sealed with rubber septa. Before electrolysis experiments, a syringe was used to draw fresh electrolyte upwards into each tube. 0.5–1 mL samples were taken from each tube using a gas-tight syringe (Hamilton) and manually injected into the GC. Product crossover was calculated by measuring the amount of hydrogen in the O2 collection tube and dividing by the total amount of measured H2. Relationships between the % H2 crossover and atomic % H2 in the anode and cathode effluent streams are provided in Fig. S4 (ESI†).Results
Description of the electrolyzer and experimental setup
As detailed in the methods section and illustrated in a simple flow diagram of the experimental set-up in Fig. S2 (ESI†), a peristaltic pump was used to pump 0.5 M H2SO4 electrolyte through the vertically-oriented electrolyzer. During operation, the flowing electrolyte helps to facilitate removal of the electrolytically-generated H2 and O2 gas bubbles from the electrode surfaces before sweeping the “bubble plumes” downstream into the cathode and anode effluent channels, which are separated by an insulating baffle that is part of the cell body. After passing through the effluent channels, the two-phase mixture of gas bubbles and electrolyte flows into downstream glass collection tubes where the gas bubbles phase-separate and are captured in the headspace where they can be sampled for compositional analysis by GC. Although the majority of the sampled gas can be attributed to gas bubbles evolved from the upstream electrodes, some small fraction can also be assumed to originate from dissolved H2 and O2 species that are able to exchange between the liquid and gas phases inside the collection tubes. Given that the PPME is characterized by very large Péclet numbers (104–105) over the operating conditions for this study, H2(aq) and O2(aq) can be assumed to be co-located within the bubble plumes. Under the constraints of large Pe and laminar flow conditions, HSV-derived bubble plumes can thus be a good way to monitor the product species in both the gaseous and dissolved phases.Electrolyzers with two different channel widths (w = 4 mm and w = 2 mm) and outfitted with identical 0.3 cm2 platinized Ti foil electrodes were used for this study. 2-Electrode current density–voltage (iV) curves for these cells were recorded in 0.5 M H2SO4 for identical Reynolds number (Re = 547) and are provided in Fig. S5 (ESI†). The onset voltage for both cells is around 2.0 V, which is 0.4 V higher than that reported in the same electrolyte for a similar parallel plate electrolyzer based on Ir-containing electrodes that have significantly lower overpotential for the OER.11 As the voltage increases more than ≈100 mV beyond the onset voltage, the current density increases linearly with voltage. There is a significant increase in the slope of the iV curve (di/dV) of the w = 2 mm compared to the w = 4 mm cell due to the lower solution resistance across the smaller channel gap, which was confirmed by EIS measurements (Fig. S6, ESI†). Solution resistance (Rs) was found to decrease from 3.6 Ω to 2.1 Ω when the channel width decreased from 4 mm to 2 mm, resulting in a decrease in the applied voltage of 140 mV at a current density of 200 mA cm−2.
Flow characteristics of the electrolysis cell
Because parallel plate membraneless electrolyzers rely on flow-induced separation of product gases, it is essential to understand how the hydrodynamics of the cell vary as a function of electrolyte flow rate and the associated Re. It is particularly important to know what Re corresponds to a transition from laminar-to-turbulent flow since turbulent flow leads to rapid mixing of the electrolyte and the anode/cathode products.26 In this work, the laminar-to-turbulent transition was monitored in the w = 4 mm cell by visualizing changes in streakline characteristics as a function of Re. HSV was recorded while injecting colored dye into the inlet of the cell, with representative still frame images provided in Fig. 2a at four different Re. The images taken for Re = 131 and Re = 1004 contain vertical streaklines, consistent with laminar flow and the associated parabolic velocity profile. However, increasing Re above ≈1200 significantly distorts the streaklines and leads to small convective cells associated with unsteady flow. At a Re = 1211, transitional flow was observed, as evidenced by turbulent mixing of the dye in the center of the channel while narrow regions of laminar flow (light coloring) are still visible along the channel walls. These dye-free laminar regions are absent in the Re = 1419 image, indicating that the flow is almost entirely turbulent under these conditions. This Re is significantly lower than a Re of 4000 that is typically associated with fully turbulent flow between perfectly flat parallel plates,27 which we attribute to a combination of wall roughness and entrance effects associated with fluid flow transitioning from the circular inlet tube to the rectangular cell channel containing the electrodes.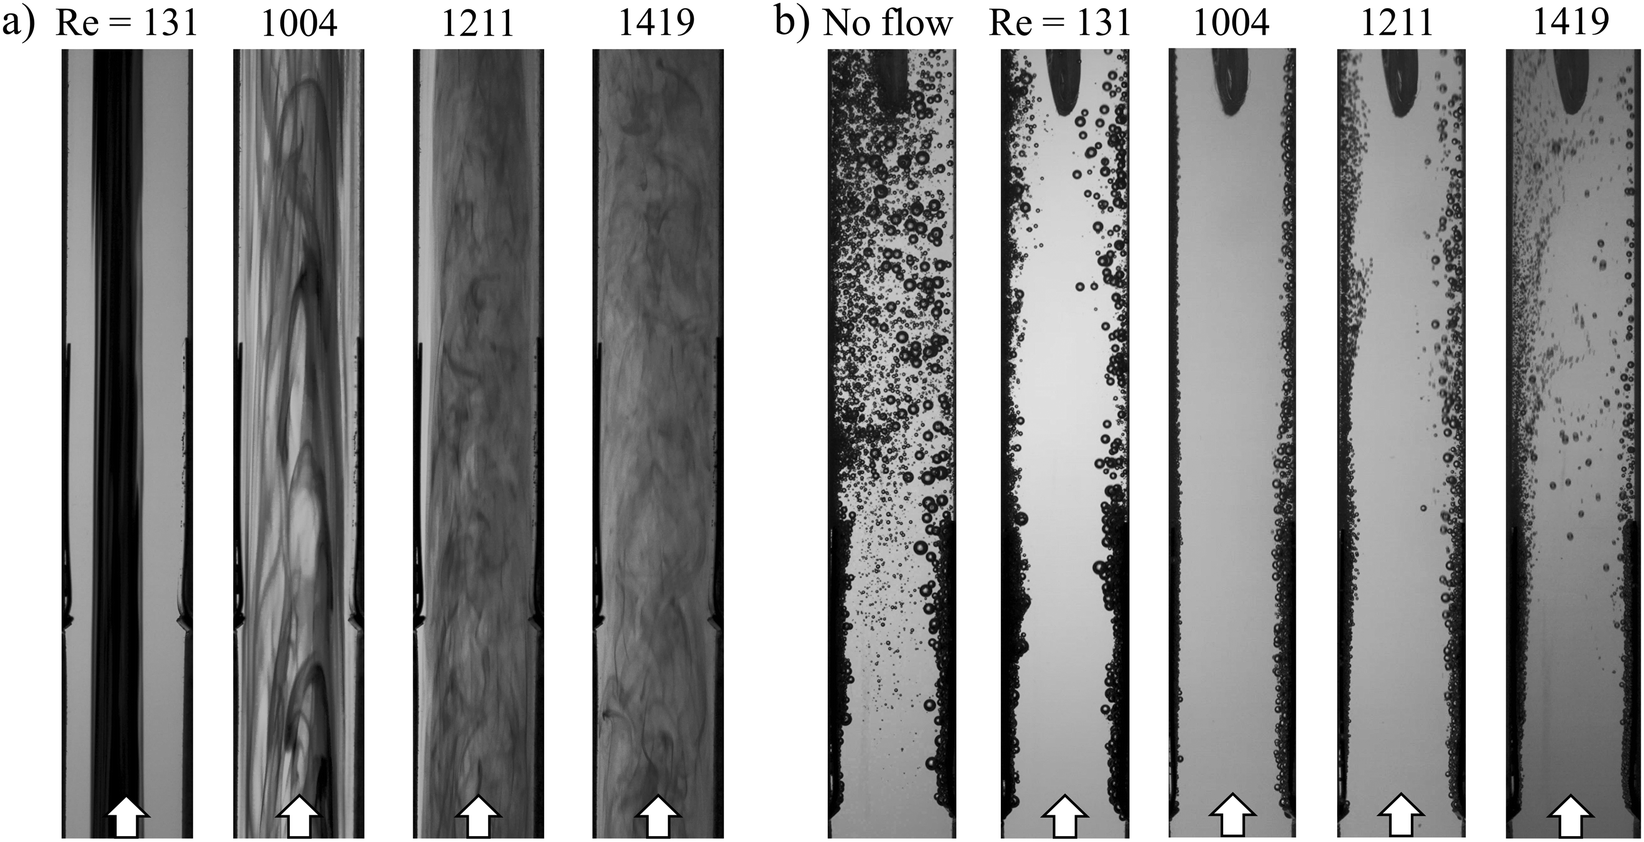 | ||
| Fig. 2 (a) Flow visualization using dye injection at different Re, showing the flow transition from laminar to turbulent. (b) Representative still frame images from HSVs captured after 5 min of electrolysis showing bubbles evolving from electrodes, operated at 200 mA cm−2 in surfactant-containing 0.5 M H2SO4 at different Re. The electrolyzer channel width is 4 mm, and the electrolyte flows from bottom to top in the image as indicated by the white arrows at the bottom of each image. | ||
In Fig. 2b, electrolyzer hydrodynamic characteristics were observed over the same range of Re, but instead of using colored dye to view streaklines, electrochemically-generated bubbles were monitored during constant current electrolysis experiments (i = 200 mA cm−2). In these experiments, the bubbles serve as tracer particles to visualize flow characteristics, similar to particle image velocimetry experiments that are regularly used in the field of fluid dynamics.28 Five representative images from HSVs are shown for different Re while running electrolysis, demonstrating how flowing electrolyte modulates the bubble plume width. H2 bubbles were generated on the right (cathode), and O2 bubbles were generated on the left (anode). In the absence of advection (Fig. 2b, “no flow”), bubble-induced convection leads to broad H2 and O2 bubble plumes that intersect before the bubbles reach the top of the electrodes, highlighting the necessity of using fluid flow to promote effective product separation in the parallel plate geometry. Even at the lowest flow rate used in this study, corresponding to Re = 131, product separation is observed to be significantly improved, although direct crossover of bubbles to the opposite effluent channel is still occasionally observed. As the flow rate increases further, the detached bubbles experience significantly larger forces from the fluid flow that push them closer to the channel wall from which they originated. At a flow rate corresponding to Re = 1004, the detached bubbles are effectively “pinned” to the channel wall, resulting in a very narrow bubble plume width and lack of any observed direct crossover events. However, increasing Re past the critical Re ≈ 1200 causes the bubble plume width to increase again, eventually leading to the reemergence of direct crossover events as the flow transitions to turbulent conditions. Increasing Re impacts not only the width of the bubble plume, but also the average bubble size, which is found to decrease monotonically with increasing Re (Fig. S7, ESI†), consistent with prior studies.9,11 This trend can be more concisely attributed to the increasing ratio of the inertial force promoting bubble detachment relative to the surface tension force that promotes adhesion, a dimensionless number known as the Weber number (We).
Quantifying bubble plume width based on in situ high speed videography
A key premise of this study is that the effective width of bubble plumes generated by parallel plate electrodes strongly correlates with crossover rates, and can therefore be a useful descriptor for relating operating conditions to product purities. More specifically, it was our expectation that GC-determined crossover rates be very low (<1%) whenever the steady-state bubble plume width (wp) is significantly less than half of the electrolyzer channel width (0.5w). Conversely, crossover should rapidly increase as wp approaches (0.5w). In this work, analysis was focused on the plume of H2 bubbles generated at the cathode, although similar analysis could also be applied to the O2 bubble plume. To quantify H2 bubble plume width, still frame images from HSVs were converted into bubble void fraction images. First, raw images (Fig. 3b) were cropped to an analysis area corresponding to the purple rectangle shown in Fig. 3a that is located immediately downstream of the cathode and extending down to the divider separating the anode and cathode effluent streams. Next, the greyscale raw image was converted into a binary black and white image, and the bubbles were converted to black (Fig. 3c). Based on the black and white areas in the image, the two-dimensional (2D) coverage of bubbles within each 100 μm by 40 μm pixel in each image was calculated. Fig. 3d shows the 2D coverage map obtained by averaging 300 images from 3 HSVs for the same operating condition.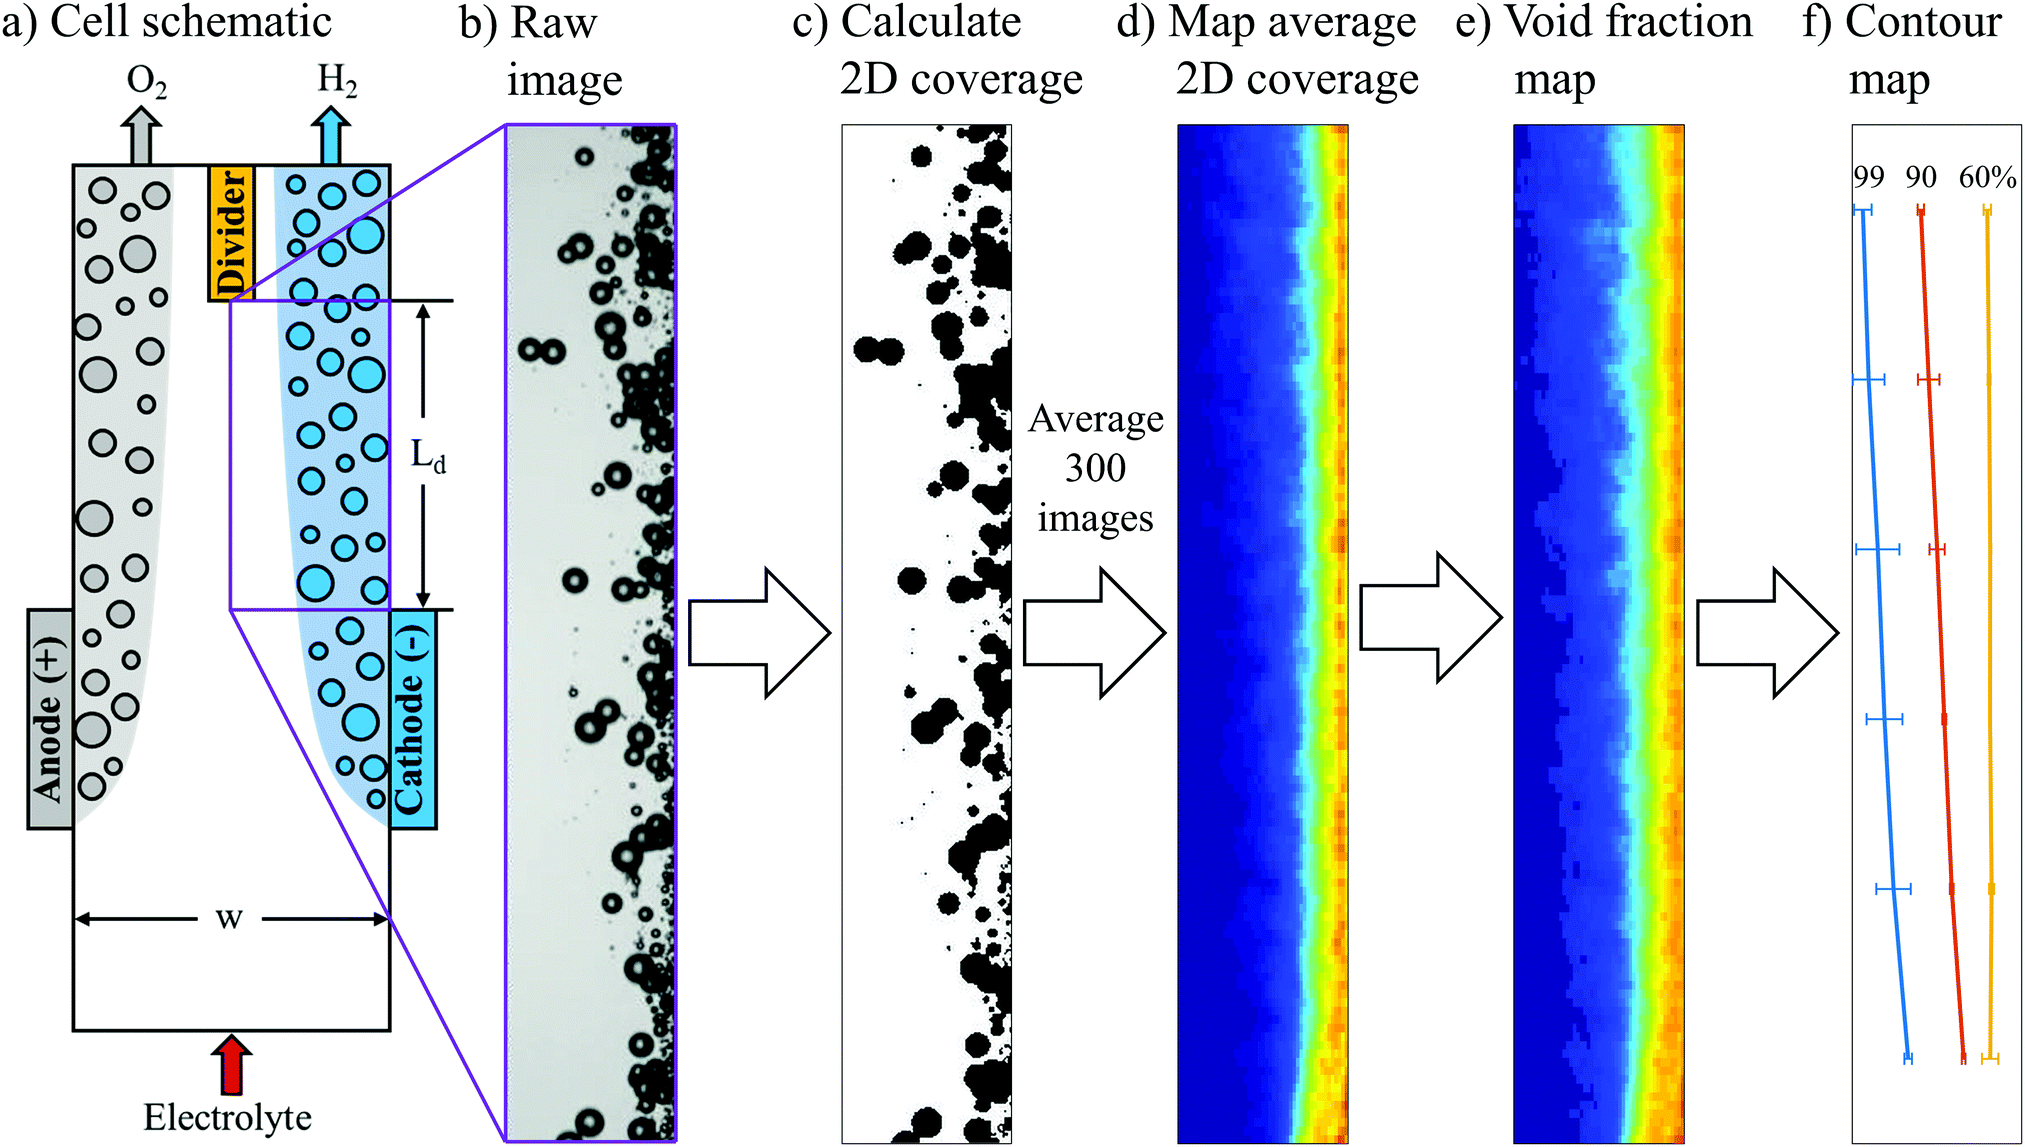 | ||
| Fig. 3 (a) Schematic of the PPME. The purple box indicates the region of the electrolyzer that was the focus of the in situ imaging work carried out in this study. (b) Representative raw still frame image of H2 bubbles flowing upwards from the cathode during electrolysis at 200 mA cm−2 and Re = 131. (c) Bubbles were converted to black after converting the greyscale raw image into a binary black and white image. (d) 2D map of bubble coverage obtained by averaging 300 still frame images from 3 HSVs for the same operating condition. (e) Time averaged void fraction map converted from the average 2D coverage map. For (d) and (e), the warmer colors indicate higher bubble coverages and void fractions, respectively. (f) Contour map with contour lines corresponding to the locations where 99%, 90% and 60% of H2 within the plume is located to the right of the line. | ||
Because H2 crossover depends on the net volume of H2 bubbles that cross over to the anode effluent stream, it was necessary to convert the 2D projected area of bubbles into three-dimensional (3D) bubble void fractions. The projected area of a bubble is easily converted into volume by multiplying the area of each bubble by (4/3) times the radius of the bubble. However, this method can result in significant error for dense bubble plumes, for which overlapping bubbles in the 2D projection leads to underestimation of the bubble void fraction. To more accurately convert local 2D bubble coverage to 3D void fraction, a correlation between these two parameters was first obtained from computer-generated 3D images of bubbles created within a control volume characterized by the same depth as the electrolysis cells. This was done by first randomly positioning bubbles within the control volume that were characterized by a bubble size distribution corresponding to that which was experimentally-observed during electrolysis at 200 mA cm−2 and Re = 796 (Fig. S8, ESI†). One of such images is shown in Fig. S9a (ESI†) for a void fraction of 0.032, which was calculated using the radii of these bubbles. 2D projections of bubbles located in 3D spaces for different bubble coverages are shown in Fig. S9b (ESI†). The 2D coverage of bubbles was computed for different bubble void fractions, with the resulting coverage-void fraction correlation provided in the blue curve in Fig. S9c (ESI†) for a cell depth of 5 mm. If the bubble overlap is neglected, a linear correlation will be obtained. With this linear relationship, void fraction is underestimated for bubble coverage higher than 0.2 (Fig. S9c, ESI†). In the following analyses, this true relationship was used to convert the HSV-measured 2D bubble coverages into local bubble void fractions. As an example, the 2D coverage map (Fig. 3d) was converted to a void fraction map (Fig. 3e) using this correlation. In order to quantify the bubble plume width, a contour map was generated to determine the distance from the wall at a given y-location that contains X% of the total detected H2 bubble volume to its right. The analysis area was separated into six bins spanning the length of the channel from the end of the electrode to the downstream divider, and values of X% (X = 99, 90, 60) were calculated for each bin. A contour map generated from the void fraction image in Fig. 3e is shown in Fig. 3f.
Fig. 4a–g show the resulting void fraction images of the downstream H2 bubble plume at different Re under steady-state electrolysis at 200 mA cm−2. Qualitatively, the H2 bubble plume width is seen to decrease as Re increases from 131 to 1004, consistent with the raw HSV images in Fig. 2b where it was noted that the increased inertial lift force at high Re pins the bubble plume closer to the channel wall. For Re > 1000, the plume width expands with increasing flow rates as the fluid flow transitions to the turbulent regime. It should also be noted that the average bubble void fraction within the plume decreases at these high Re, which can be explained by expansion of the plume width and a decreased residence time for bubbles flowing through the analysis area at higher fluid velocities.
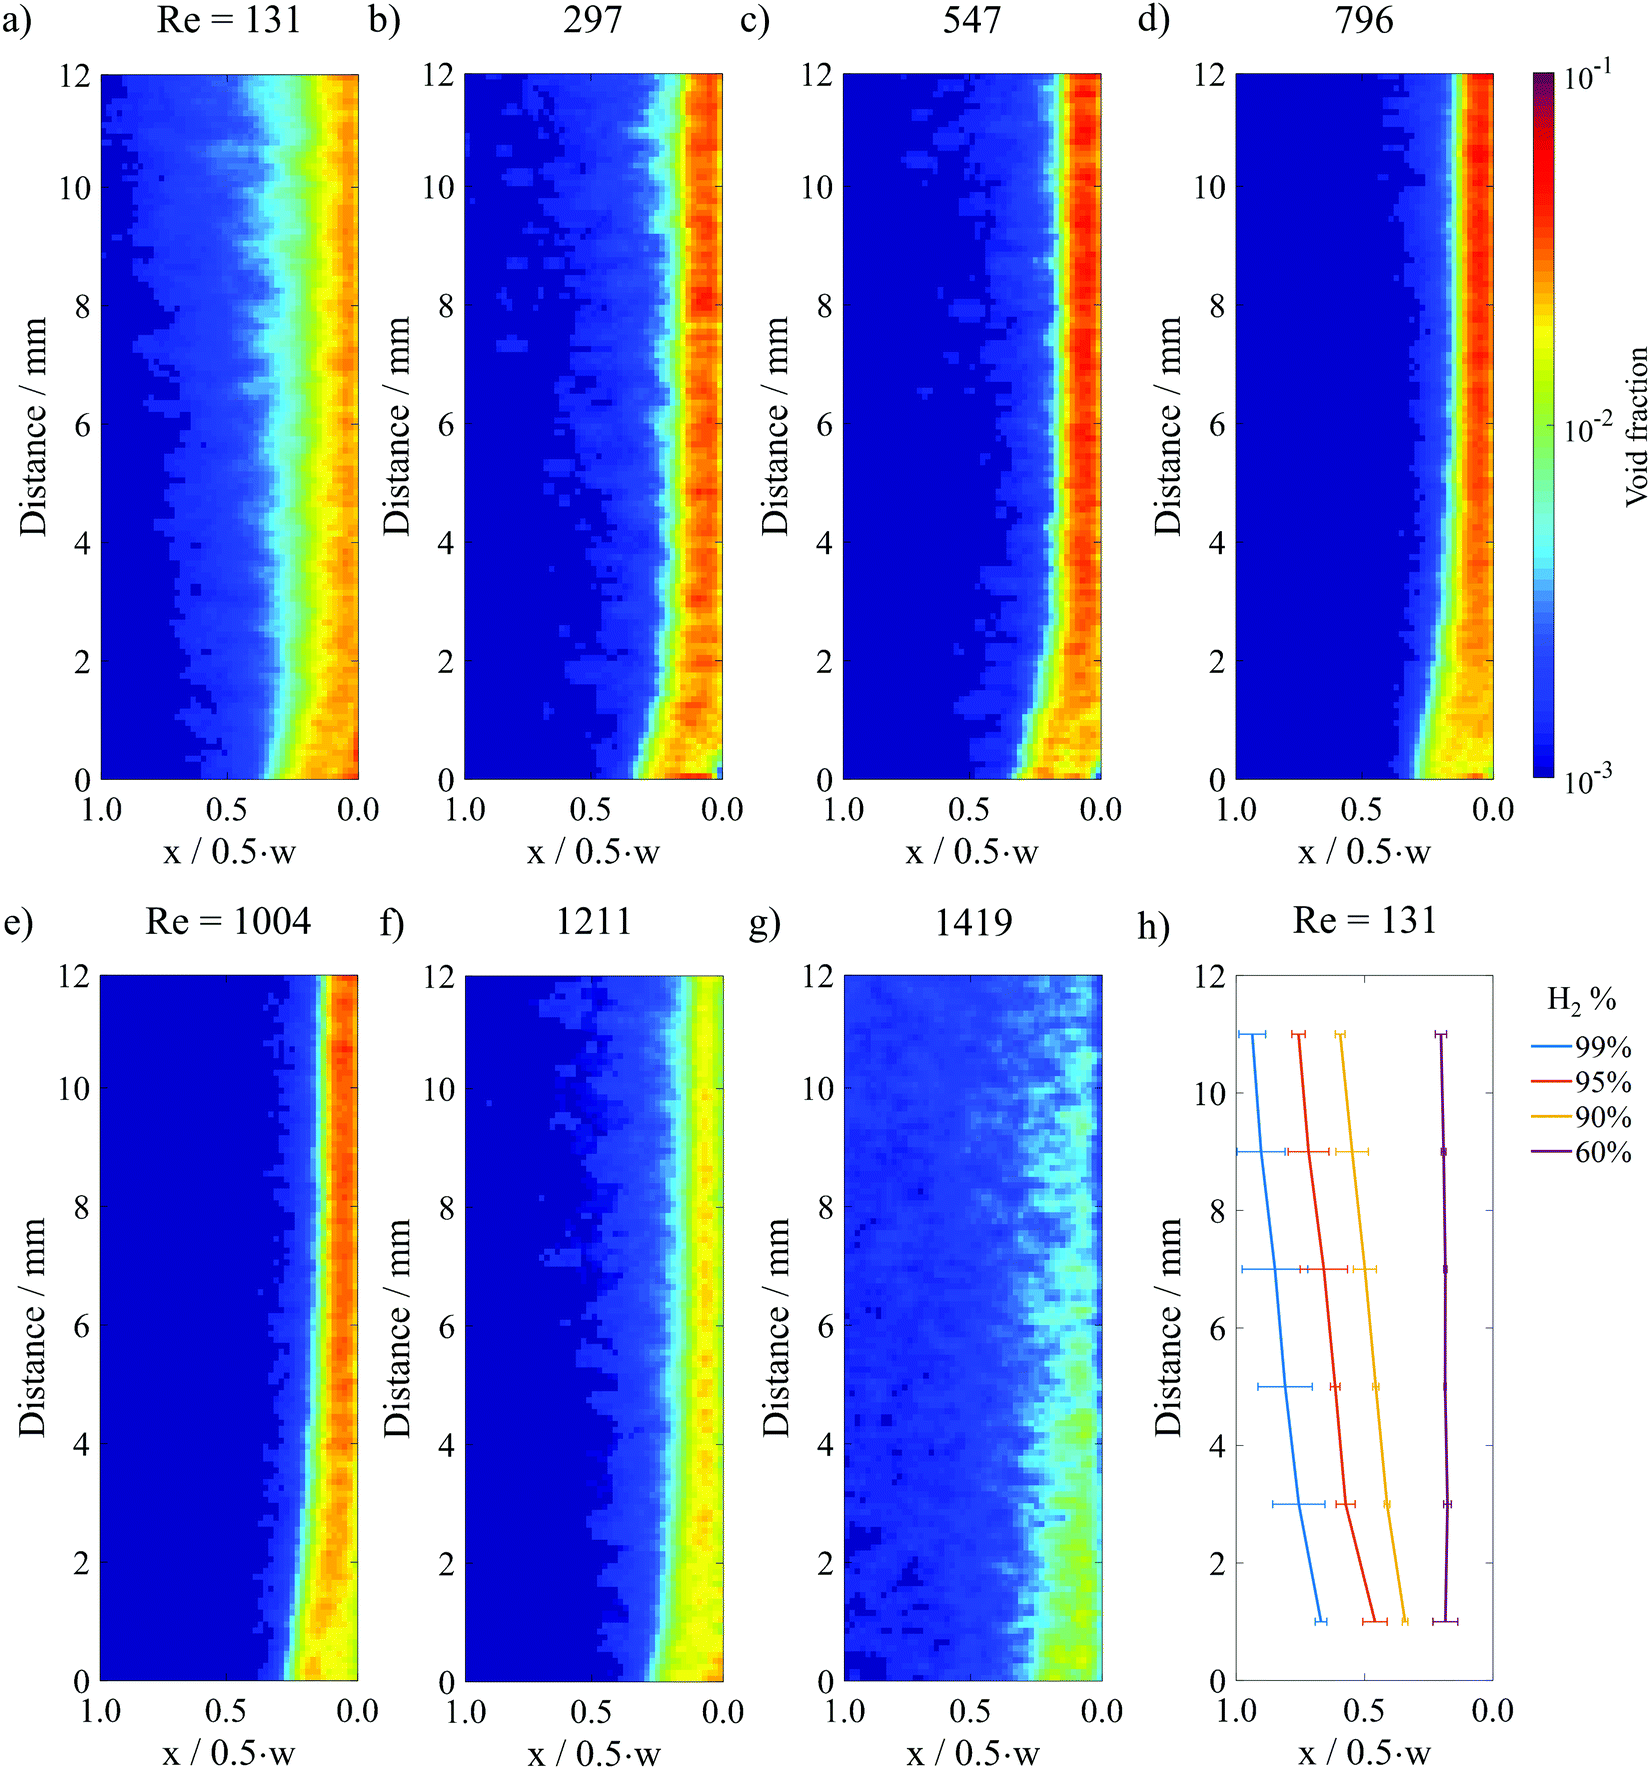 | ||
| Fig. 4 (a)–(g) Time averaged void fraction images for a constant current density of 200 mA cm−2 and different Re in surfactant-containing 0.5 M H2SO4. 300 still frame images from 3 HSVs were analyzed to generate (a), (d), (e) and (f). 100 images from 1 HSV were analyzed to generate (b), (c) and (g). The image analysis area is marked by the purple box in the electrolyzer schematic provided in Fig. 3a. (h) Contour lines from the Re = 131 image that correspond to the locations where 99%, 95%, 90% and 60% of H2 within the plume is located to the right of the line. | ||
A contour map generated from the void fraction image in Fig. 4a is shown in Fig. 4h, while the contour maps corresponding to the void fraction images in Fig. 4b–g are provided in Fig. S10 (ESI†). The X = 90% contour line value determined for the top of the image analysis area, corresponding to the bottom of the baffle divider, was taken to be representative of the H2 bubble plume width in the following analyses.
Correlating HSV-derived bubble plume width to H2 crossover and operating parameters
Fig. 5a shows the dependency of the GC-measured H2 crossover percent and HSV-determined H2 bubble plume width (90%) on Re for a constant current density of 200 mA cm−2. Both curves are u-shaped, and can be broken up into three different regimes. At low Re, the shear stress is too low to push all the bubbles closely against the wall, which gives rise to wider bubble plume and higher crossover rate. For intermediate Re between roughly 300 and 1000, bubble plume widths are relatively narrow, and H2 crossover rates are <0.57%, with a minimum crossover rate of 0.12% for Re = 1004. Both crossover and bubble plume width are low in this flow regime due to the elevated shear force that helps to push the bubble plumes against the wall. Hashemi et al. also obtained the same trend for H2 crossover in the laminar flow regime up to Re = 312,9,11 although that study didn’t explore Re above 312. When Re increases to 1211, the transition to turbulent flow characteristics shown in Fig. 2a results in significant increases in the bubble plume width, although the H2 crossover rate still remains relatively low at 0.66%. We attribute the large variation in the HSV-determined plume width at Re = 1211 to the stochastic nature of the transitional flow regime, while the crossover rate might remain low thanks to the presence of laminar flow characteristics close to the channel walls, as evidenced in Fig. 2a. At Re > 1211 both H2 crossover and bubble plume width rapidly increase as fluid flow becomes more unsteady. | ||
| Fig. 5 H2 crossover and normalized H2 bubble plume width at different Re for electrolysis at a constant current density of (a) 200 mA cm−2 and (b) 400 mA cm−2. The reported normalized bubble plume widths correspond to the 90% contour lines taken from contour plots such as Fig. 4h at the y-position corresponding to the start of the downstream divider that separates the anode and cathode effluent streams. | ||
Fig. 5b contains the same plot as Fig. 5a but generated from experiments carried out during electrolysis at a current density of 400 mA cm−2. Because of the higher rate of bubble generation at the elevated current density, notable increases in wp and H2 crossover rates are observed at all Re, but are especially pronounced for the low Re (131) and transitional flow (Re = 1211) conditions. Fig. 5b indicates that the range of Re that allows for low H2 crossover shrinks as current density increases. Similar trends can be found in Fig. S11 and S12 (ESI†) for contour line values at 99%, 95% and 60%. To achieve the lowest H2 crossover, the operating Re should be increased to a value that is as high as possible without introducing flow instabilities into the system. Although operating at higher Re will require extra pumping power, the parasitic energy loss due to pumping is generally only a small fraction of the energy content of the generated H2 for the cells studied in this work. As shown in Fig. S13 (ESI†), the ratio of required pumping power to the power associated with hydrogen generation (PH2 = (1.23 V) × (current)) is estimated to be 5% for the w = 4 mm cell being operated at 400 mA cm−2 and Re = 796 using a pump efficiency of 75%. The relative pumping power can be minimized by increasing the current density, increasing the electrode size, or decreasing Re, but could become significant for channels characterized by long lengths and narrow channel widths that facilitate larger pressure drop across the cell.
To more explicitly view the relationship between crossover and plume width, Fig. 6a presents the H2 crossover percent as a function of the dimensionless H2 bubble plume width (X = 90%) for two different channel widths (w = 2 mm and w = 4 mm) and all operating conditions in the laminar flow regime. The trendline was obtained by fitting a two-term exponential model with equation shown in the subfigure, and the grey regions surrounding the trendline represent 95% prediction bounds for the fitted coefficient. The prediction bounds were calculated using the Curve Fitting Toolbox™ in MATLAB using 95% observation intervals and non-simultaneous bounds. This correlation contains a total of 24 data points, which were recorded for various combinations of Re and i ranging between 131 < Re < 1004 and 50 mA cm−2 < i < 600 mA cm−2, with the exact combinations of w, i, and Re for every data point provided in Fig. S14 (ESI†). As shown in Fig. S15 (ESI†), data points obtained at very high Re (Re > 1004) or in the absence of advection do not agree with the same trendline; hence, the correlation provided in Fig. 6a should only apply to the laminar flow regime. For unsteady fluid flow (Re > 1211) or when fluid flow rates are so low that the Segré–Silberberg effect is no longer present, this correlation is not applicable.
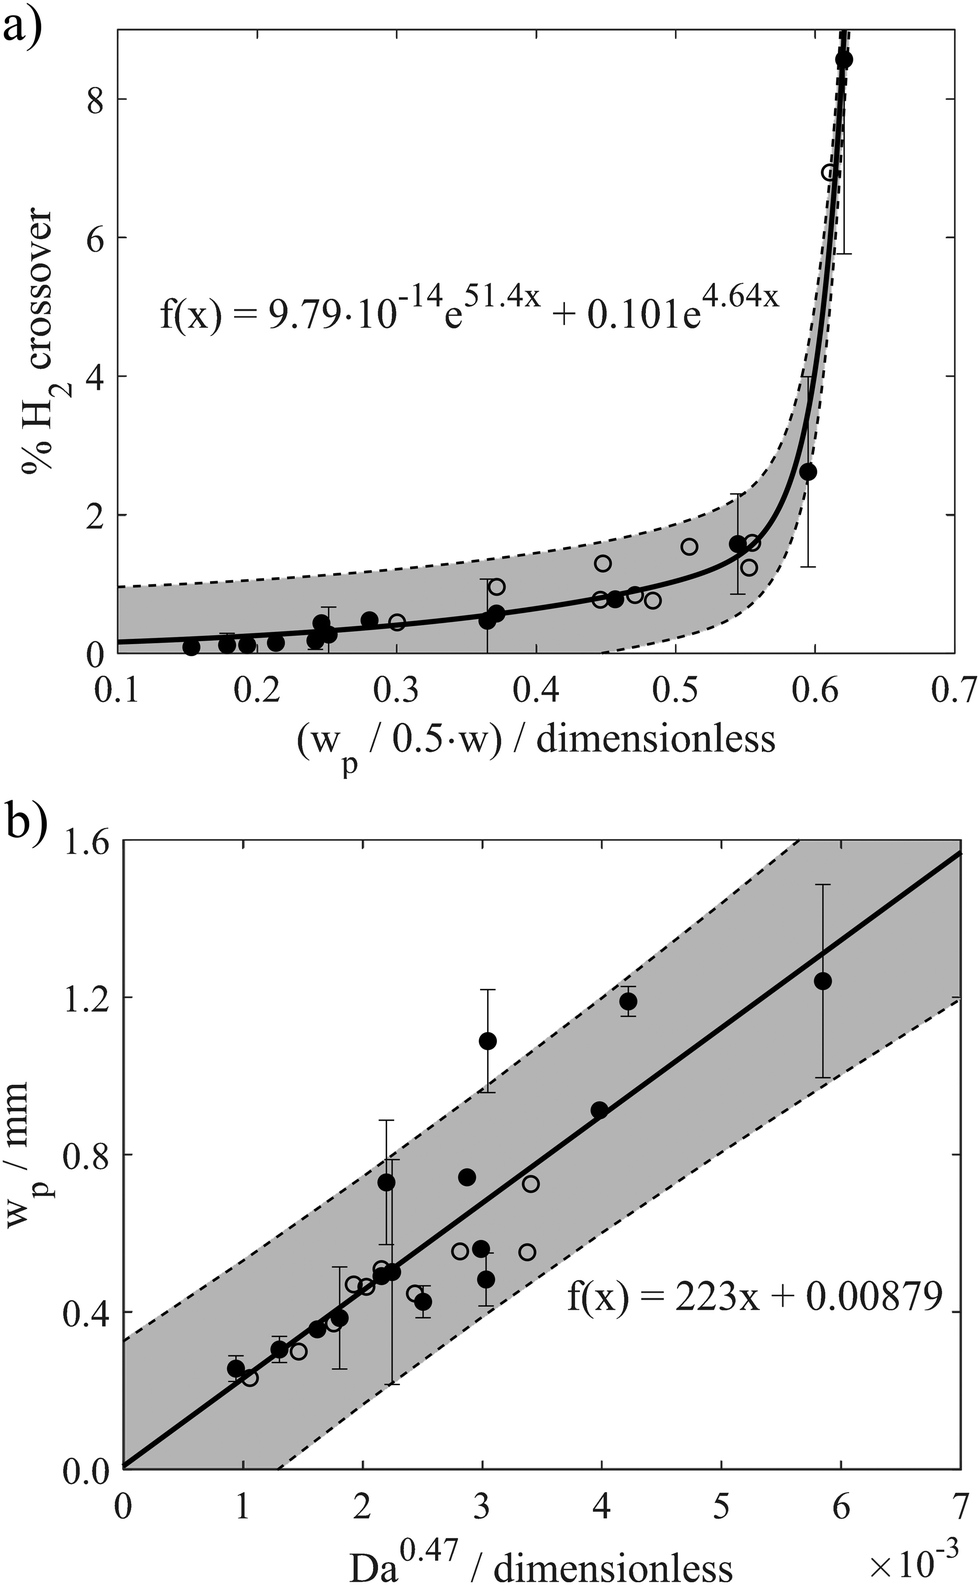 | ||
| Fig. 6 (a) H2 crossover as a function of normalized H2 bubble plume width for 2 different channel widths and all operating conditions in the laminar flow regime with an exponential fitting. (b) H2 bubble plume width as a function of Da0.47 for different operating conditions and cell geometries. The reported values of wp correspond to the 90% contour lines at the y-position corresponding to the start of the downstream divider that separates the anode and cathode effluent streams. Data points were obtained for measurements recorded with cells based on w = 4 mm (solid circles) and w = 2 mm (open circles). The solid lines are best fit trendlines obtained using the functional form shown in each sub-figure. The grey regions surrounding the trendlines represent 95% prediction bounds. Error bars were determined by calculating the 95% confidence interval based on 3 repeated experiments. | ||
For normalized bubble plume widths less than ≈0.5, Fig. 6a shows that H2 crossover rates are low and vary linearly with the normalized plume width. All of the data points obtained within this region correspond to high Re and/or low i, and good linearity is also maintained when plume widths are obtained from the X = 99%, 95% and 60% contour lines (Fig. S16, ESI†). Within this linear portion of the curve, the slope of H2 crossover versus the normalized H2 bubble plume width is very shallow because the small increases in plume width resulting from operation at higher current densities or lower Re are insufficient to induce a significant fraction of bubbles to cross the channel centerline. However, the H2 crossover percent shoots upwards when the X = 90% dimensionless plume width (wp,90%/(0.5w)) increases above ≈0.6. This portion of the curve is largely populated by data points corresponding to low Re, and small increases in the plume width lead to large increases in crossover as the outer edge of the plume begins to extend out over the centerline. Non-linear correlations between H2 crossover and dimensionless plume widths are also observed in Fig. S17 (ESI†) based on analysis of the X = 99% and X = 95% contour lines, but the sharp upticks in crossover rates occur at larger values of (wp/(0.5w)), as expected. For X = 99%, H2 crossover rises sharply when the normalized H2 bubble plume width approaches 1, since in this case the X = 99% contour corresponds more precisely to the outer edge of the plume. Importantly, all data points obtained for operation of the electrolyzers with two different channel widths in the laminar flow regime collapse onto the same curve, indicating that the dimensionless bubble plume width is a good descriptor that can be used to predict H2 crossover rates across a wide range of operating conditions for the PPME.
Having established that the bubble plume width is an appropriate descriptor for crossover, it is next necessary to describe how this descriptor depends on cell geometry and key operating conditions. Only then can one map out the performance limits describing the trade-offs between efficiency, current density, electrode size, and product purity. For this study, an additional empirical relationship was used to relate wp to key geometric parameters (w, Le) and operating conditions (i, velocity (U)) that are expected to influence wp. According to Buckingham Pi Theorem,29 this system of 5 variables containing 4 fundamental units (length, time, electric current, amount of substance) can be described with one dimensionless number, or pi grouping. In other words, there should be a universal relationship by which wp can be computed from one dimensionless number:
| wp = παI | (1) |
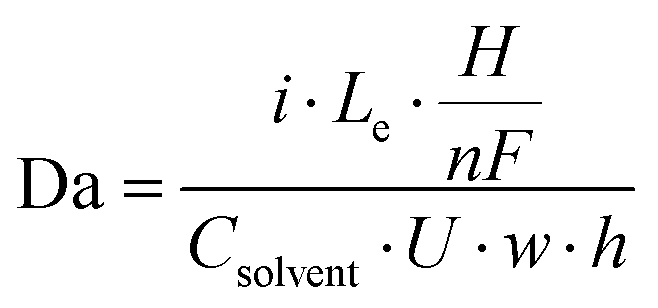 | (2) |
Using HSV-derived bubble plume widths at different Re, w, and i, a best fitting procedure was used to obtain a value of the constant in eqn (1) to be α = 0.47, with the best fit curve provided in Fig. 6b. This relationship between wp and Daα was obtained for 25 different data points recorded for two different channel widths and Re ≤ 1004. Based on eqn (2), Da increases with increasing current and/or decreasing flow rate or Re. Since the bubble plume width also increases with current and decreases with flow rate, consistent with the HSV observations of Fig. 5, wp increases with Da. In this linear relationship between wp and Da0.47, the lowest flow rate (Re = 131) data points are the ones contributing the most scatter (Fig. S18, ESI†), which we attribute to a small pulsation effect from the peristaltic pump at the lowest flow rate. Using the empirical correlation shown in Fig. 6b, wp can be predicted for any combination of electrode size (Le × H), current density (i), and Re so long as the electrolyzer is operating in the laminar flow regime. By extension, the predicted value of wp obtained from this correlation can then be used in the first correlation shown in Fig. 6a to predict the percent H2 crossover at different current densities, channel widths, and electrode sizes. Although these empirical correlations were obtained from in situ HSV monitoring of bubble plumes in this study, an opportunity for future research efforts is to use computational fluid dynamics (CFD) to generate similar correlations between plume width, cell geometry, operating current density, and electrolyte flow rates.
Predicting the performance limits of parallel plate membraneless electrolyzers
 | (3) |
| ΔV = |ΔE°| + |ηHER| + ηOER + ηΩ + ηconc | (4) |
 | (5) |
 | (6) |
| ηΩ = I·Rs | (7) |
 | (8) |
Using experimentally measured solution resistance, Tafel parameters for Pt HER electrocatalyst30 and fitted Tafel parameters for Pt OER electrocatalyst, this simple 1D model was found to give good agreement with experimental current density–voltage curves recorded for the PPME with Pt electrodes in 0.5 M H2SO4, as seen in Fig. S21 (ESI†).
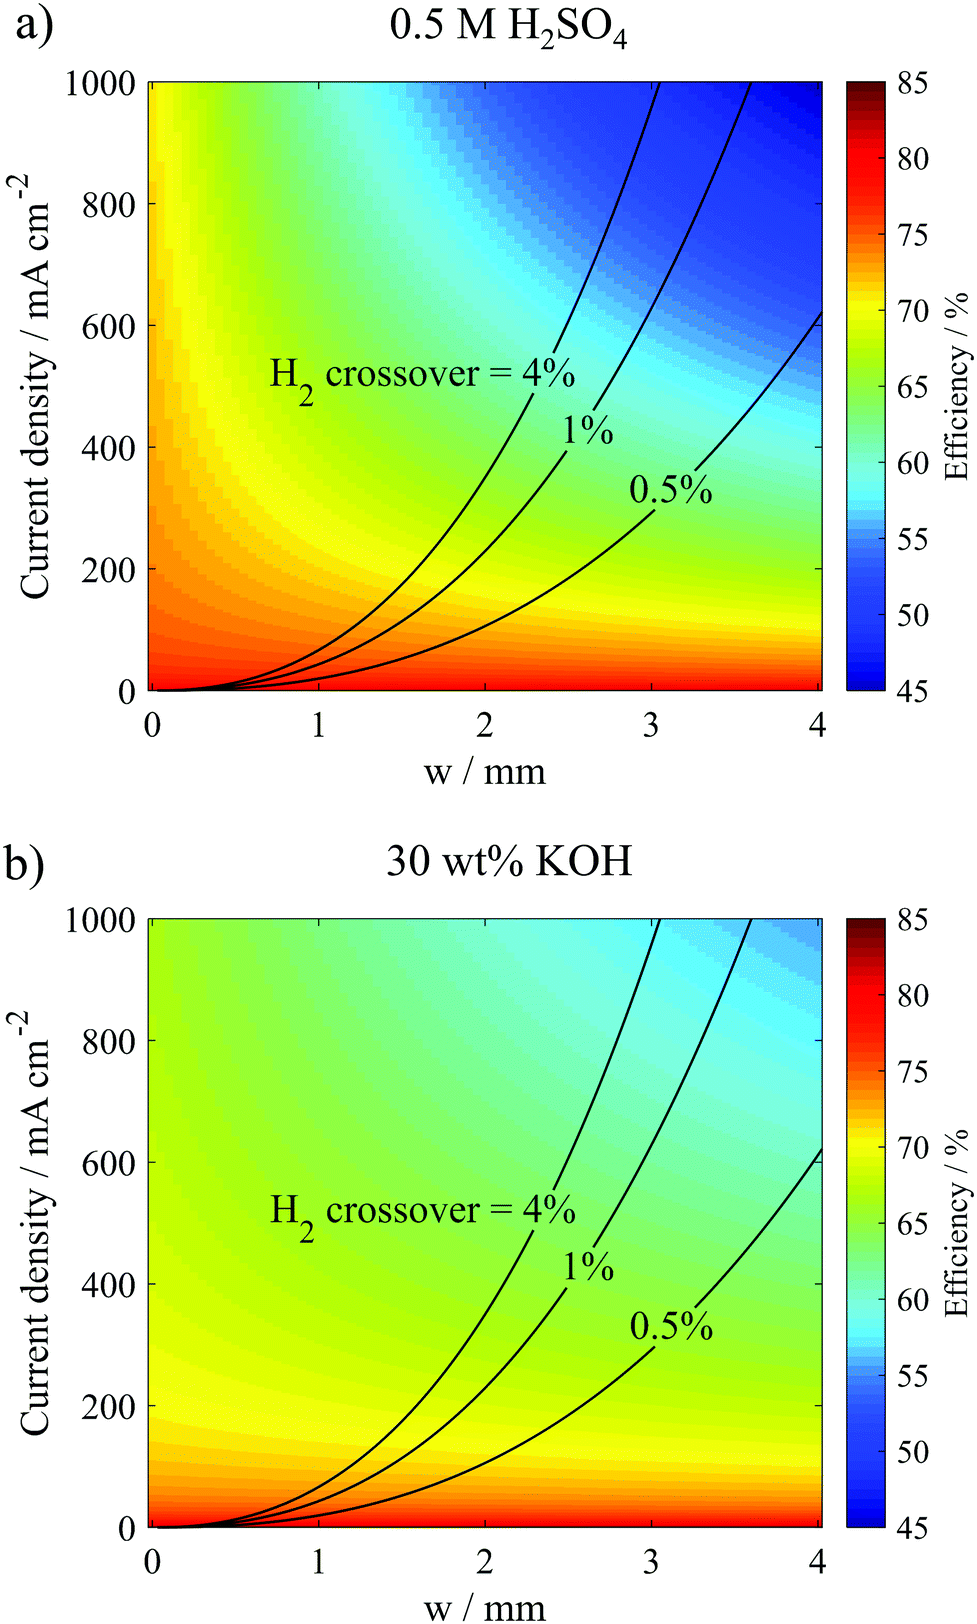 | ||
| Fig. 7 Relation between current density, channel width and electrolysis efficiency for a PPME (Le = 9 mm, H = 3.34 mm, Ld = 12 mm) operated in (a) 0.5 M H2SO4 and (b) 30 wt% KOH. The contour lines show different predicted H2 crossover rates based on the empirical correlations between bubble plume width, operating current density, and cross-over rates. Efficiencies are reported on the basis of ΔG° = 237 kJ mol−1 H2 and were modeled based on Ohm's law and Tafel equations. | ||
As expected, the highest efficiencies are predicted at low current densities and small w, which minimize kinetic and ohmic overpotential losses, respectively. Importantly, Fig. 7a shows that w needs to be less than 1.8 mm to achieve electrolyzer efficiencies >65% (wrt ΔG° = 237 kJ mol−1 H2) at current densities ≥400 mA cm−2 in the 0.5 M H2SO4 electrolyte. In 30 wt% KOH, where the electrolyte conductivity is 1.75 times higher than that in the 0.5 M H2SO4 electrolyte, w can be increased to much larger values to achieve the same efficiency and current density. For example, w only needs to be less than 2.6 mm to achieve electrolyzer efficiencies >65% at current densities ≥400 mA cm−2. Clearly, the higher conductivity electrolyte can enable operation at much higher current density and efficiency. However, these high efficiency/high current density regions in Fig. 7 also correspond to the highest crossover rates, clearly illustrating the trade-offs between current density, efficiency, and product purity. From a safety standpoint, it is imperative that the composition of the product gases does not exceed the upper (94% H2 in O2) or lower (4% H2 in O2) flammability limits.38 Thus, Fig. 7 allows one to predict the highest current density that can be safely achieved while maintaining some minimum desired electrolysis efficiency. For example, Fig. 7b predicts that the parallel plate electrolyzer with Le = 0.9 cm and H = 0.334 cm operating at a desired electrolyzer efficiency of 60% can operate at current densities up to 795 mA cm−2 in 30 wt% KOH before H2 crossover increases above 4%, and this maximum current density can be achieved at w = 2.8 mm.
Results from these calculations are summarized in Fig. 8, which reveal that the electrode length has two primary influences on the performance limits of the PPME. First, increasing Le reduces the “edge effects” associated with ion transport around the ends of the electrodes, leading to increases in the ohmic overpotential losses. Fig. 8a shows that this effect is amplified at large electrode gap distances where ohmic losses can dominate overall cell performance. Consistent with these observations, the black curves in Fig. 8b show that ηE decreases with increasing Le, and that ηE becomes most sensitive to Le at large w. The second influence of Le on electrolyzer performance is that increasing Le leads to increased crossover and reduced product purity. In Fig. 8b (red curves), the % H2 crossover was predicted for different Le and w as described in the previous section, again assuming a constant Re = 796. For all three values of Le, low H2 crossover rates are predicted for very large w, but each curve exhibits a critical value of w below which crossover increases exponentially. This critical w increases with Le, which is explained by the fact that longer electrodes generate more H2, and therefore wider bubble plumes at the downstream edge of the electrodes. In order to maintain a target crossover rate, a longer electrode length will require a wider channel width to accommodate the wider bubble plume width. As shown in Fig. 8c for a constant predicted H2 crossover rate of 1%, ηE decreases sharply with increasing Le, but the throughput/total current increases linearly with electrode length because of the increasing electrode size. As a result, the maximum efficiency associated with safe operation of the electrolyzer at a constant current density decreases with increasing Le, highlighting the efficiency/scalability/product purity trade-off that is commonly observed for membraneless electrolyzers.
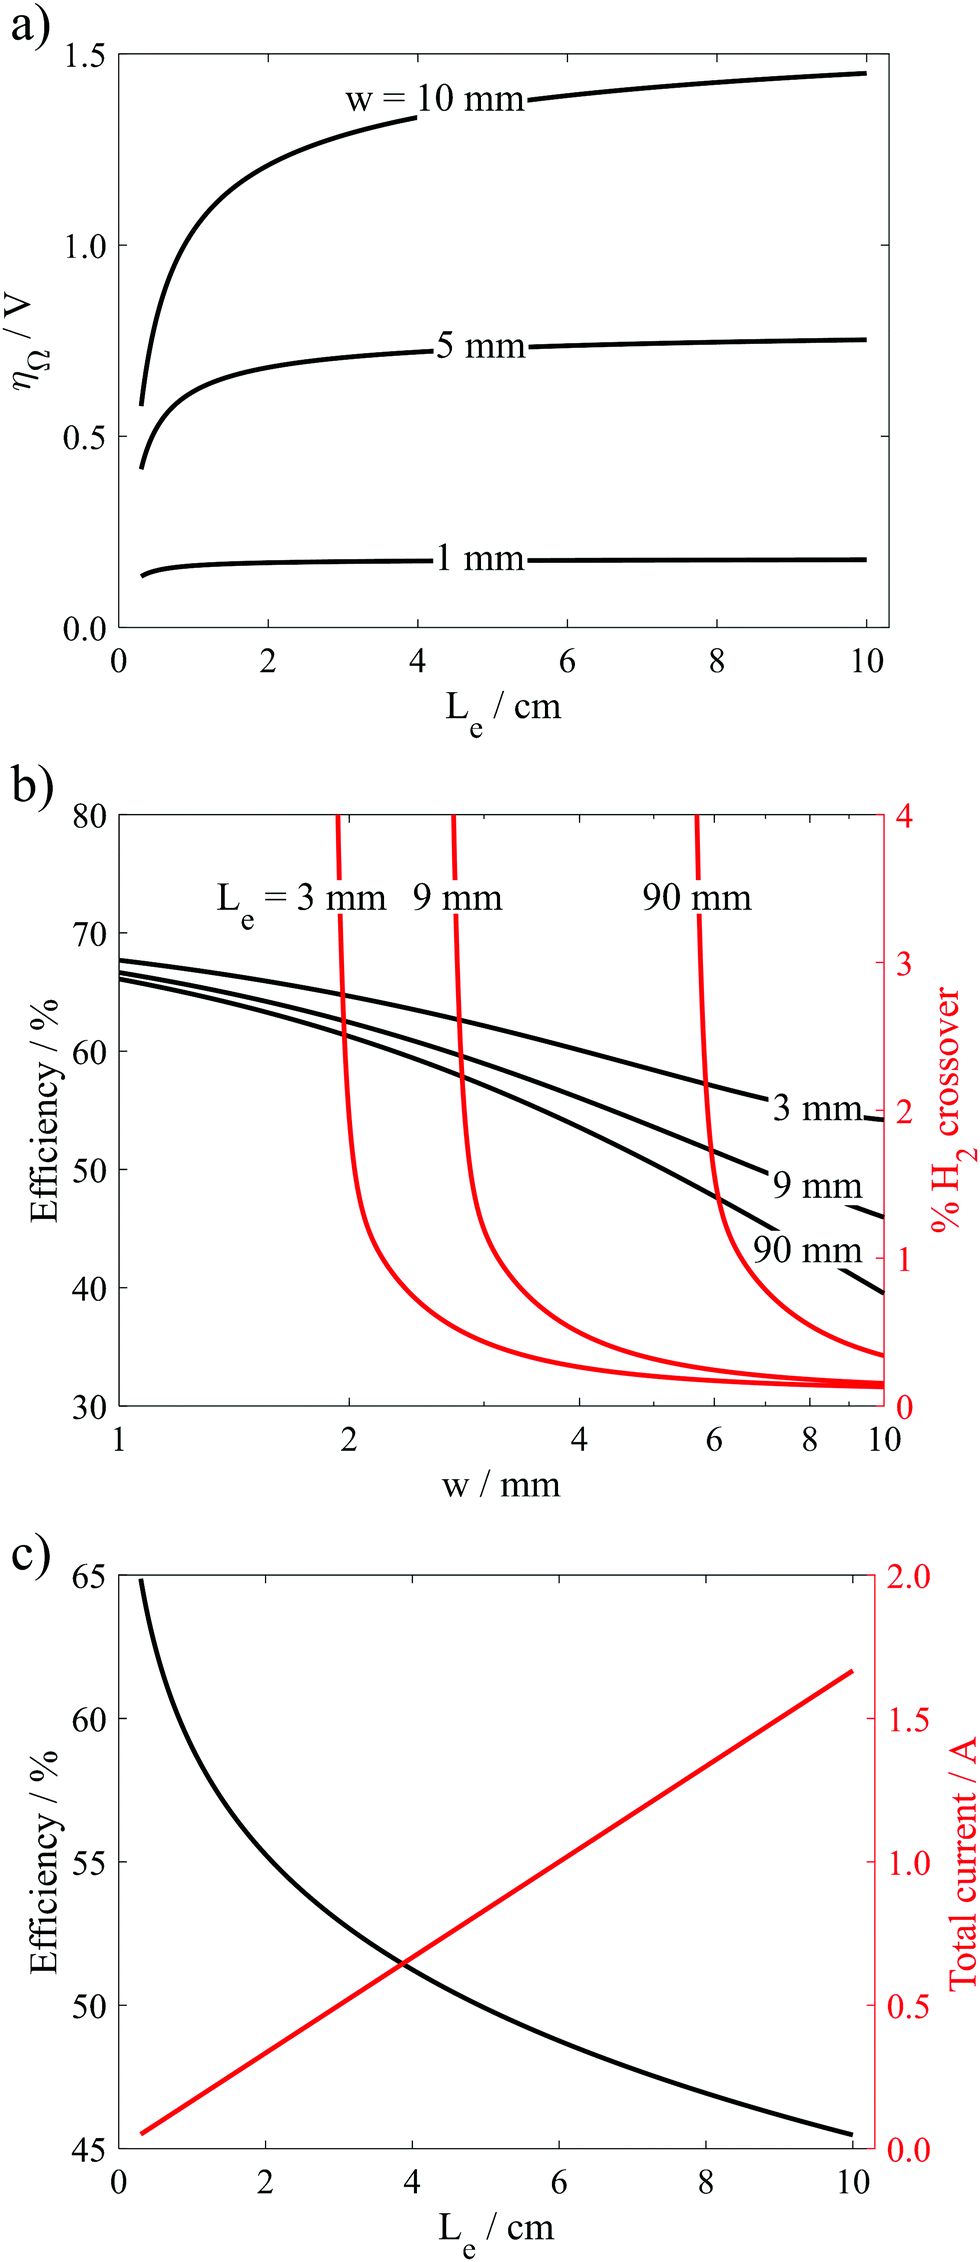 | ||
| Fig. 8 (a) Ohmic losses as a function of electrode length for different channel widths for a constant current density of 500 mA cm−2 and an electrolyte of 0.5 M H2SO4. (b) Efficiency and H2 crossover as a function of channel width for different electrode lengths for a PPME (H = 3.34 mm, Ld = 12 mm) operated in 0.5 M H2SO4 and a constant current density of 500 mA cm−2. (c) Efficiency and total current as a function of electrode length for constant product purity (1% H2 crossover) and current density (500 mA cm−2) in 0.5 M H2SO4 electrolyte. | ||
Discussion
By using a combination of in situ high speed videography and electrochemical engineering principles, this work has analyzed the trade-offs between efficiency, current density, electrode size, and product purity for a simple parallel plate membraneless electrolyzer. By establishing quantitative relationships between these key performance metrics and geometric design parameters, we have created a framework for exploring the performance limits of this electrolyzer architecture. Optimizing any one of these performance metrics is trivial, but the overall performance of the electrolyzer should be viewed in the context of balancing the trade-offs between the performance metrics illustrated in Fig. 1b, with the relative importance of each metric weighted according to the particular application for which the electrolyzer is being designed. Nonetheless, it is valuable to compare the predicted multi-metric performance limits of the parallel plate electrolyzer under favorable conditions to the typical performance metrics of commercial alkaline and PEM electrolyzers, which are presented in Table 1. As a basis for this comparison, we have considered the predicted performance limits presented in Fig. 7b for a membraneless electrolyzer with the same electrode dimensions presented in this study (Le = 9 mm, H = 3.34 mm) operating in 30 wt% KOH. If the target H2 crossover rate is set to 0.5% (corresponding to H2 purity ≥99.75%), the PPME is predicted to be capable of current densities between 0.20–0.61 A cm−2 with corresponding efficiencies of 68.4–60.4% (based on ΔG° = 237 kJ mol−1 H2), respectively. If the H2 cross-over constraint is relaxed to 1% cross-over (corresponding to H2 purity ≥99.5%), the current density of the electrolyzer can approach 0.73 A cm−2 while maintaining a 60% efficiency, where this current density is 1.8 times as high as the upper limit for conventional alkaline electrolyzers at comparable efficiency. Meanwhile, a comparison of achievable current density and efficiency ranges for the membraneless electrolyzer at safe cross-over levels are always expected to be inferior to the PEM electrolyzer.| Electrolyzer type | Current density (A cm−2) | Efficiency (%, wrt ΔG°) | H2 purity (%) |
|---|---|---|---|
| Conventional alkaline | 0.2–0.4 | 51.5–68.1 | >99.5 |
| PEM | 0.6–2.0 | 55.6–68.1 | >99.9999 |
The prediction that the H2 purity/efficiency/current density performance limits of the PPME can exceed those of conventional alkaline electrolyzers is explained primarily by the fact that the former can achieve lower solution resistance thanks to the absence of a diaphragm divider and ability to place the electrodes closer together. Even when the electrodes in the PPME are increased to Le = 9 cm, the PPME still maintains a slight advantage, being predicted to achieve efficiencies of 61.6% and 58.5% with 1% H2 crossover while operating at 200 and 400 mA cm−2, respectively. It should be noted that the optimal space between electrodes for an alkaline electrolyzer operating at a given current density is determined to be that which maximizes cell efficiency,41 while the optimal electrode spacing for a PPME is the smallest spacing that still enables the required product purity to be achieved. Although it was not considered explicitly in this study, the forced advection used in the PPME is also expected to reduce bubble-induced losses that are known to be especially problematic for conventional alkaline electrolyzers at high current densities.42,43 Meanwhile, the unfavorable current density/efficiency performance limits of the PPME compared to a PEM electrolyzer can be attributed to the intrinsically lower total electrolyte resistance associated with the “zero-gap” nature of the latter. However, this analysis does not take into consideration the capital costs associated with the electrolyzer materials and costs of construction. In general, the relative simplicity of membraneless electrolyzer architectures based on a limited number of component types and manufacturing steps creates an opportunity to reduce manufacturing costs compared to a PEM electrolyzer, although this advantage may be less significant when compared to alkaline electrolyzers. The size of electrodes is another important consideration for manufacturing, keeping in mind that cell areas for commercial alkaline and PEM electrolyzers have been reported to be up to 4 m2 and 3 m2, respectively.40 Ultimately, engineering analysis of electrolyzers, such as that presented in this work, needs to be combined with manufacturing cost models and technoeconomic models of entire electrolyzer systems to predict the levelized cost of hydrogen production under specific electricity pricing schemes. On average, 40–50% of the total capital cost of a commercial electrolyzer system is associated with the cost of balance of system (BOS) components.8 Thus, it is important to consider not only the cost and performance of the electrolyzer stack itself, but also how the electrolyzer performance impacts the cost, sizing, and performance of BOS components within the larger system.
It should be emphasized that the analysis provided in this article is specific to a parallel plate electrolyzer with electrode morphology and bubble dynamics consistent with those used in this study. Thus, the performance limits identified in this analysis are not true upper limits to performance. Several additional modifications are anticipated to push the performance bounds even further. For example, using more textured electrodes are anticipated to help (i) reduce kinetic overpotential losses thanks to the higher catalytic surface area and (ii) facilitate smaller bubble departure diameters and the associated bubble size distribution associated with the bubble plumes evolved from the downstream electrodes.25 Reducing the average bubble size is also expected to help decrease kinetic overpotential losses by decreasing the average bubble coverage on the electrode surface, and may also alter the plume width by enabling tighter packing of the smaller bubbles within the bubble plume. Anecdotally, we have observed that the occasional build-up and detachment of “big bubbles” with radii that are substantially larger than the average bubble radius can preferentially lead to cross-over events by promoting flow disturbances that lead to crossover of other smaller bubbles. A sequence of still frames capturing one such “big bubble” departure event is provided in Fig. S22 (ESI†), with the associated video provided as Video S1 (ESI†). It should also be noted that the product purity is underestimated in this study because the baffle separating the anode and cathode effluent streams was not located immediately at the end of the electrodes, which would correspond to Ld = 0. An optimized PPME design would have Ld = 0 in order to minimize crossover. Collectively, changes in electrode morphology, entrance effects, divider position, or gas/electrolyte surface tension that affect bubble size distribution or dynamics can all be expected to lead to slightly different correlations than those provided in Fig. 6. This study has shown that in situ HSV offers an attractive means of generating these correlations. However, multi-phase computational fluid dynamics (CFD) represents a huge opportunity to generate these correlations without ever constructing a cell and for cell geometries that may not be amenable to in situ HSV.
In future research efforts, the use of in situ HSV and CFD, combined with electrochemical engineering design principles, represents a well-rounded toolbox for further exploring the performance limits of membraneless electrolyzers characterized by a far broader design space than that explored in this study. For example, membraneless electrolyzers based on flow-through electrodes offer an even richer design space that is characterized by more geometric parameters. As the number of design parameters increase and advances in additive manufacturing enable rapid prototyping of electrochemical reactors,44,45 the automated discovery and exploration of new membraneless electrolyzer architectures with the help of artificial intelligence tools like machine learning46,47 and genetic algorithms48 also present new opportunities for advancing the performance limits of membraneless electrolyzers. Given the urgency of developing high performance, low-cost electrolysis technologies for a wide range of clean energy applications, the coordinated use of these emerging computational and experimental tools may play a critical role in accelerating the development of membraneless electrolyzer technologies to the point where they can make a meaningful impact in the near future.
Conclusions
This study has demonstrated a method of using in situ HSV analysis to quantify H2 bubble plume width at different Re, current densities, and channel widths in parallel plate membraneless electrolyzers. The HSV-derived dimensionless bubble plume width is found to strongly correlate with H2 crossover, and hence can be a useful descriptor for relating operating conditions and cell geometries to crossover rates and product purities. Combined with electrochemical engineering design principles, the trade-offs between efficiency, current density, electrode size, and product purity were investigated for membraneless electrolyzers. Furthermore, the performance limits were analyzed and compared with the typical operating performance of commercial water electrolyzers. This analysis shows that it is possible for membraneless electrolyzers based on the parallel plate design to exceed the performance of alkaline electrolyzers, but that they are unlikely to be able to match all of the performance metrics of PEM electrolyzers. Importantly, this work has presented a combined experimental and modeling framework that can be extended to guide the design of many other membraneless electrolyzer architectures and analyze their performance limits.Conflicts of interest
DVE is a co-founder of sHYp B.V.Acknowledgements
The authors acknowledge funding from Shell International Exploration & Production New Energies Research & Technology Dense Energy Carriers Program. The authors also acknowledge Ziyang Mao for his contributions to HSV analysis.References
- D. Gielen, F. Boshell, D. Saygin, M. D. Bazilian, N. Wagner and R. Gorini, Energy Strateg. Rev., 2019, 24, 38–50 CrossRef.
- M. Liserre, T. Sauter and J. Y. Hung, IEEE Ind. Electron. Mag., 2010, 4, 18–37 Search PubMed.
- K. Ayers, N. Danilovic, R. Ouimet, M. Carmo, B. Pivovar and M. Bornstein, Annu. Rev. Chem. Biomol. Eng., 2019, 10, 219–239 CrossRef CAS.
- M. Carmo and D. L. Fritz, Int. J. Hydrogen Energy, 2013, 8, 4901–4934 CrossRef.
- K. Zeng and D. Zhang, Prog. Energy Combust. Sci., 2010, 36, 307–326 CrossRef CAS.
- G. Maggio, A. Nicita and G. Squadrito, Int. J. Hydrogen Energy, 2019, 44, 11371–11384 CrossRef CAS.
- C. Xiang, M. Papadantonakis and N. S. Lewis, Mater. Horiz., 2016, 3, 169–173 RSC.
- D. V. Esposito, Joule, 2017, 1, 651–658 CrossRef CAS.
- S. M. H. Hashemi, M. A. Modestino and D. Psaltis, Energy Environ. Sci., 2015, 8, 2003–2009 RSC.
- M. I. Gillespie, F. Van Der Merwe and R. J. Kriek, J. Power Sources, 2015, 293, 228–235 CrossRef CAS.
- S. M. H. Hashemi, P. Karnakov, P. Hadikhani, E. Chinello, S. Litvinov, C. Moser, P. Koumoutsakos and D. Psaltis, Energy Environ. Sci., 2019, 12, 1592–1604 RSC.
- G. Segre and A. Silberg, Nature, 1961, 189, 209–210 CrossRef.
- H. Amini, W. Lee and D. Di Carlo, Lab Chip, 2014, 14, 2739–2761 RSC.
- P. Hadikhani, S. M. H. Hashemi, G. Balestra, L. Zhu, M. A. Modestino, F. Gallaire and D. Psaltis, Lab Chip, 2018, 18, 1035–1046 RSC.
- G. D. O’Neil, C. D. Christian, D. E. Brown and D. V. Esposito, J. Electrochem. Soc., 2016, 163, F3012–F3019 CrossRef.
- M. M. Monroe, P. Lobaccaro, Y. Lum and J. W. Ager, J. Phys. D: Appl. Phys., 2017, 50, 154006 CrossRef.
- I. Holmes-Gentle, F. Hoffmann, C. A. Mesa and K. Hellgardt, Sustainable Energy Fuels, 2017, 1, 1184–1198 RSC.
- J. T. Davis, J. Qi, X. Fan, J. C. Bui and D. V. Esposito, Int. J. Hydrogen Energy, 2018, 43, 1224–1238 CrossRef CAS.
- M. I. Gillespie and R. J. Kriek, J. Power Sources, 2017, 372, 252–259 CrossRef CAS.
- D. Steingart, The Unfortunate Tetrahedron, https://medium.com/the-unfortunate-tetrahedron/the-unfortunate-tetrahedron-ce1e44d0b961.
- J. T. Davis, D. E. Brown, X. Pang and D. V. Esposito, J. Electrochem. Soc., 2019, 166, F312–F321 CrossRef CAS.
- H. Y. Lee, C. Barber and A. R. Minerick, Electrophoresis, 2014, 35, 1782–1789 CrossRef CAS.
- D. Fernández, P. Maurer, M. Martine, J. M. D. Coey and M. E. Möbius, Langmuir, 2014, 30, 13065–13074 CrossRef.
- D. V. Esposito, Y. Lee, H. Yoon, P. M. Haney, N. Y. Labrador, T. P. Moffat, A. A. Talin and V. A. Szalai, Sustainable Energy Fuels, 2017, 1, 154–173 RSC.
- A. Angulo, P. van der Linde, H. Gardeniers, M. Modestino and D. Fernández Rivas, Joule, 2020, 4, 555–579 CrossRef CAS.
- E. R. Choban, L. J. Markoski, A. Wieckowski and P. J. A. Kenis, J. Power Sources, 2004, 128, 54–60 CrossRef CAS.
- N. de Nevers, Fluid mechanics for chemical engineers, McGraw-Hill, 3rd edn, 1999 Search PubMed.
- A. Taqieddin, R. Nazari, L. Rajic and A. Alshawabkeh, J. Electrochem. Soc., 2017, 164, E448–E459 CrossRef.
- E. Buckingham, Phys. Rev., 1914, 4, 345 CrossRef.
- H. Kita, S. Ye and Y. Gao, J. Electroanal. Chem., 1992, 334, 351–357 CrossRef.
- Y. Zhao, N. M. Vargas-Barbosa, E. A. Hernandez-Pagan and T. E. Mallouk, Small, 2011, 7, 2087–2093 CrossRef.
- C. González-Buch, I. Herraiz-Cardona, E. Ortega, J. García-Antón and V. Pérez-Herranz, J. Appl. Electrochem., 2016, 46, 791–803 CrossRef.
- H. Zhou, F. Yu, Q. Zhu, J. Sun, F. Qin, L. Yu, J. Bao, Y. Yu, S. Chen and Z. Ren, Energy Environ. Sci., 2018, 11, 2858–2864 RSC.
- T. Shinagawa, A. T. Garcia-Esparza and K. Takanabe, Sci. Rep., 2015, 5, 1–21 Search PubMed.
- M. Philippe, H. Jérôme, B. Sebastien and P. Gérard, Electrochim. Acta, 2005, 51, 1140–1156 CrossRef CAS.
- L. M. Gandía, R. Oroz, A. Ursúa, P. Sanchis and P. M. Diéguez, Energy Fuels, 2007, 21, 1699–1706 CrossRef.
- M. Paidar, V. Fateev and K. Bouzek, Electrochim. Acta, 2016, 209, 737–756 CrossRef.
- M. T. Janicke, H. Kestenbaum, U. Hagendorf, F. Schüth, M. Fichtner and K. Schubert, J. Catal., 2000, 191, 282–293 CrossRef.
- E. A. K. Ayers and C. Capuano, ECS Trans., 2012, 41, 15–22 CrossRef.
- H. A. Miller, K. Bouzek, J. Hnat, S. Loos, C. I. Bernäcker, T. Weißgärber, L. Röntzsch and J. Meier-Haack, Sustainable Energy Fuels, 2020, 4, 2114–2133 RSC.
- N. Nagai, M. Takeuchi, T. Kimura and T. Oka, Int. J. Hydrogen Energy, 2003, 28, 35–41 CrossRef CAS.
- B. E. Bongenaar-Schlenter, L. J. J. Janssen, S. J. D. Van Stralen and E. Barendrecht, J. Appl. Electrochem., 1985, 15, 537–548 CrossRef CAS.
- F. Hine, J. Electrochem. Soc., 1980, 127, 292 CrossRef CAS.
- J. C. Ruiz-Morales, A. Tarancón, J. Canales-Vázquez, J. Méndez-Ramos, L. Hernández-Afonso, P. Acosta-Mora, J. R. Marín Rueda and R. Fernández-González, Energy Environ. Sci., 2017, 10, 846–859 RSC.
- S. M. H. Hashemi, U. Babic, P. Hadikhani and D. Psaltis, Curr. Opin. Electrochem., 2020, 20, 54–59 CrossRef CAS.
- D. E. Blanco, B. Lee and M. A. Modestino, Proc. Natl. Acad. Sci. U. S. A., 2019, 116, 17683–17689 CrossRef CAS.
- L. Mao and L. Jackson, Proceedings of the International MultiConference of Engineers and Computer Scientists, 2016, vol. 1, p. 825.
- K. Chen, S. Laghrouche and A. Djerdir, Appl. Energy, 2019, 252, 113439 CrossRef CAS.
Footnote |
| † Electronic supplementary information (ESI) available. See DOI: 10.1039/d0ee02268c |
| This journal is © The Royal Society of Chemistry 2020 |