
 Open Access Article
 This Open Access Article is licensed under a
 Creative Commons Attribution 3.0 Unported Licence
Predictable and targeted activation of biomass to carbons with high surface area density and enhanced methane storage capacity†
Afnan
Altwala
and
Robert
Mokaya
 *
*
School of Chemistry, University of Nottingham, University Park, Nottingham NG7 2RD, UK. E-mail: r.mokaya@nottingham.ac.uk
First published on 21st July 2020
Abstract
A challenge in the synthesis of activated carbons is that currently there is no way to prepare materials with predictable and targeted properties. In particular, there are no material parameters or characteristics of the starting carbonaceous matter that can be used to predict the porosity and packing density of the activated carbon. Here we report on the synthesis of biomass-derived activated carbons with targeted porosity and packing density that is suitable for methane storage. We show that the ratio of elemental oxygen to elemental carbon (i.e., O/C atomic ratio) of the precursor can be used as a universal predictor of the nature of porosity generated in an activated carbon. We use date seeds (Phoenix dactylifera) as an example of how biomass starting material with a very low O/C ratio, along with choice of mode of carbonisation, can be used to synthesise activated carbons with optimised porosity, as defined by the surface area density, and high packing density that is suitable for methane storage. The carbons store up to 222 cm3 (STP) cm−3 methane at 25 °C and 35 bar, which is much higher than any value reported to date for porous carbons, and is comparable to the best metal–organic-framework (MOF). However, the activated carbons are much cheaper (≤1$ per kg) compared to at best 10–20$ per kg for MOFs. Our findings present important insights on directed synthesis of optimised activated carbons and represent a significant step in the development of cheap porous carbons for high volumetric methane (or natural gas) storage. The findings are also applicable to informing the optimised preparation of activated carbons with targeted properties for other applications in energy storage and environmental remediation.
Broader contextThe manuscript addresses a major obstacle in the synthesis of activated carbons as currently there is no way to prepare materials with predictable and targeted properties. This is despite the fact that activated carbons are one of the most widely used solids for sustainable energy applications and environmental remediation. Current synthesis approaches rely on trial and error. In a departure from this current norm, the work in this manuscript shows that the properties of activated carbons can be predictably tailored by choice of the biomass precursor and mode of carbonisation to generate carbons with desired properties. More specifically, we show that the ratio of elemental oxygen to elemental carbon (i.e., O/C atomic ratio) of the precursor can be used as a universal predictor of the nature of porosity generated in an activated carbon. We use date seeds (Phoenix dactylifera) as an example of how biomass with a very low O/C ratio, along with choice of mode of carbonisation, can be used to synthesise activated carbons with optimised porosity, as defined by the surface area density, and high packing density suitable for methane storage. The carbons store up to 222 cm3 (STP) cm−3 methane at 25 °C and 35 bar, which is much higher than any value reported to date for porous carbons, and is comparable to monolithic metal–organic-framework (MOF) that is the current record holder for volumetric methane storage and is claimed to be 50% better than any other MOF. Activated carbons have the advantage of being cheaper (≤1$ per kg) compared to at best 10–20$ per kg for MOFs. The findings offer important insights on directed synthesis of optimised activated carbons and are a major step in the development of cheap porous carbons for high volumetric methane (or natural gas) storage, and are also applicable to generalised preparation of activated carbons with targeted properties for other applications in energy storage and environmental remediation. |
1. Introduction
The continuing worldwide growth in the use of gasoline and diesel has led to increasing concerns over the sustainability of oil reserves. In addition, the mounting level of the greenhouse gas carbon dioxide (CO2) in the atmosphere, much of it produced from burning of fossil fuels, has raised awareness of environmental impacts on global ecosystems and climate. A number of potential solutions are currently the focus of on-going research efforts that are aimed at mitigating the global effects arising from high levels of atmospheric CO2.1–3 Biogas, produced from the breakdown of organic matter, and which largely consists of methane, has become one of the more interesting renewable fuels and is widely used in an increasing number of countries.4 Technologies relating to biogas are also relevant to the use of natural gas. Natural gas (NG), which mainly (>70%) consists of methane, CH4, is readily available, and when used as a fuel poses a lower environmental risk compared to oil as although it still produces CO2, NG burns more cleanly than oil-based fuels. For these reasons, natural gas has attracted attention as an alternative fuel,5 and recently the U.S. Department of Energy (DOE) set a methane storage target, aimed at enabling widespread use, of 263 cm3 (STP) cm−3 at pressure of 35 to 100 bar. Natural gas may be stored as compressed natural gas (CNG) or liquefied natural gas (LNG). The former (CNG) requires high pressure vessels, which are heavy and pose safety concerns due to the high storage pressure (250 bar) required, while the latter (LNG) is limited by the high cost of cryogenic and compression processes. To circumvent the challenges of CNG and LNG, methane may be stored as adsorbed natural gas (ANG) via adsorption, at relatively low pressure, onto a suitable adsorbent material such as porous carbon.6–17Recent research has developed new ways of preparing porous carbons with properties that are useful for good performance in energy-related applications but much of the work still relies on trial and error approaches.18–35 Careful activation of carbonaceous matter can dramatically improve properties for specific applications but there is need for a more predictable synthesis approach. Chemical activation of carbonaceous matter, which uses activating agents such as potassium hydroxide (KOH), is widely used to generate carbons with a range of porosity characteristics.18–35 The elemental composition and porosity of such carbons depends on the nature of the carbonaceous matter (hereinafter referred to as precursor) used and activation conditions. In this regard, biomass is a preferred choice of precursor for activated carbons due to being readily available (usually as waste matter), renewable, and essentially offering a ‘carbon neutral’ route to porous carbons.21,22,25–28 The conventional methods of carbonising biomass prior to activation are hydrothermal carbonisation (HTC)36–38 or pyrolysis.39,40 More recently, we have shown that for biomass-derived carbons, the mode of carbonisation prior to activation, or having no prior carbonisation, has a significant influence on the properties of both the activateable carbonaceous matter and the final activated carbons.41–44 More specifically, the mode of carbonisation can exert an influence on the elemental composition of biomass-derived carbonaceous matter.41–44 In this way, the atomic ratio between elemental oxygen and elemental carbon (i.e., O/C atomic ratio) can vary significantly depending on the nature of the biomass source and the mode of carbonisation.42–44 We have recently postulated that knowledge of the O/C ratio of carbonaceous matter may allow prediction of activation behaviour (i.e., susceptibility or resistance to activation) and the nature of porosity (micropore/mesopore mix) that can be achieved from any biomass.44 These recent findings hint at the possibility of intentionally selecting or generating biomass-derived carbonaceous precursors that on activation will offer activated carbons with targeted properties for specific applications. Such an approach, which would offer directed or predictable carbon activation, is a complete departure from the current state-of-the-art that depends on trial and error activation with no way of determining in any directed way the properties of the final activated carbon.
As shown recently in a study on metal–organic frameworks (MOFs), the key to achieving high methane storage in porous materials is not necessarily related to greater porosity (surface area and pore volume) but also to high packing density.46 Thus for carbons, and in particular activated carbons, to achieve high methane storage, there is a need for synthesis routes that can predictably generate porous carbons that not only exhibit suitable porosity but also a good balance between the porosity and packing density. In this study, we have used our growing knowledge of how the carbonisation step and the O/C ratio of the activateable carbonaceous matter affect the activation process in an attempt to predictably generate activated carbons with high packing density and porosity that is suitable for methane storage. Through a selection process we settled on date seeds (Phoenix dactylifera) as a suitable starting biomass, and also used an alternative carbonisation process, termed flash air-carbonisation, which uses much shorter periods of time (5–10 minutes) and lower temperature (400 °C) in the presence of air to convert biomass into carbonaceous matter.41–43 Date seeds (Phoenix dactylifera) are inexpensive, and widely available as waste, the majority of which is disposed of via combustion at landfill sites. The valorisation of date seeds would therefore also reduce disposal costs, and the greenhouse gas emissions associated with their uncontrolled combustion. We show that it is possible to use a rational approach to prepare activated carbons with suitable porosity, high packing density and record levels of methane storage capacity.
2. Experimental section
2.1 Material preparation
2.2 Material characterisation
Thermogravimetric analysis (TGA) was performed using a TA Instruments Discovery analyser or TA Instruments SDT Q600 analyser under flowing air conditions (100 mL min−1). A PANalytical X’Pert PRO diffractometer was used to perform powder XRD analysis using Cu-Kα light source (40 kV, 40 mA) with step size of 0.02° and 50 s time step. Elemental, CHN, analysis was performed on an Exeter Analytical CE-440 Elemental Analyser. Nitrogen sorption (at −196 °C) with a Micromeritics 3FLEX sorptometer was used for porosity analysis and to determination textural properties. Prior to analysis the carbon samples were degassed under vacuum at 200 °C for 12 h. Surface area was calculated using the Brunauer–Emmett–Teller (BET) method applied to adsorption data in the relative pressure (P/P0) range of 0.02–0.22, and pore volume was estimated from the total nitrogen uptake at close to saturation pressure (P/P0 ≈ 0.99). The micropore surface area and micropore volume were determined via t-plot analysis. The pore size distribution was determined using non-local density functional theory (NL-DFT) applied to nitrogen adsorption data. Scanning electron microscopy (SEM) images were recorded using an FEI Quanta200 microscope, operating at a 5 kV accelerating voltage. Transmission electron microscopy (TEM) images were obtained using a JEOL 2100F instrument operating at 200 kV equipped with a Gatan Orius CCD for imaging. Prior to analysis, the carbon samples were suspended in distilled water and dispersed onto lacey carbon support films.2.3 Methane uptake measurements
Methane uptake was determined using a Hiden Isochema XEMIS Analyser. Before the uptake measurements, the carbons were degassed at 240 °C under vacuum for several hours. Adsorption–desorption isotherms were obtained at 25 °C over methane (CH4) pressure range of 0–35 bar.3. Results and discussion
3.1 Nature of carbons
The selection of date seed (Phoenix dactylifera) as starting material, which involved extensive assessment of a wide range of biomass sources, was based on date seeds having relatively low elemental oxygen content compared to the elemental carbon content (Table S1, ESI†). The elemental composition of date seed means that they have a relatively low O/C atomic ratio of 0.649 (Table S1, ESI†) compared to a range of other biomass sources that were considered. The O/C ratio of 0.649 is the lowest we observed from a very wide range of biomass sources, which typically have O/C ratio of between 0.75 and 1.0 (Table S1, ESI†). The next consideration was the choice of hydrothermal carbonisation (HTC), pyroysis or flash air-carbonisation for carbonising the raw date seeds into carbonaceous matter that would then be activated. The aim was to achieve carbonaceous matter with the lowest O/C ratio. Based on previous work, we already know that both HTC and air-carbonisation reduce the O/C ratio but that the former causes greater decrease.21,41–43 For example, when eucalyptus sawdust is subjected to HTC, the O/C ratio decreases from 0.773 to 0.484 (∼40% decrease), while for air carbonisation the decrease is to 0.251 (ca. 70% decrease).43 We therefore performed flash air-carbonisation on the date seeds.We then explored the effect of flash air-carbonisation on the date seed, and also how the resulting carbonaceous matter (i.e., ACDS carbon) responded to activation. As shown in Table 1, the elemental C content increased following the flash air-carbonisation step, from 49 wt% for the raw date seeds to 78.5 wt% for the ACDS carbon, while the H content reduced from 7 wt% to 4 wt%. This was accompanied by a large reduction in the apparent O content from 42.4 wt% (raw date seed) to 16.3 wt% for the ACDS carbon. These changes in elemental composition had the effect of reducing the atomic O/C ratio from 0.649 for the raw date seed to 0.156 for the ACDS carbon, a decrease of 76%. This decrease of 76% in O/C ratio is comparable to that (∼70%) observed when raw sawdust is air carbonised.43 However, the final O/C ratio for the ACDS carbon is lower due to the already lower O/C ratio of the date seeds. The O/C ratio of 0.156 for the ACDS carbon is the lowest we have observed for carbonaceous matter derived from biomass (Table S2, ESI†) and other sources, and vindicates our choice of starting material (date seeds) and carbonisation process (flash air-carbonisation). More generally, we note that the elemental composition of the ACDS carbon is comparable to that of flash air-carbonised sawdust,43 and CNL1 carbon obtained by burning of wood in air under fierce fire conditions.41 This confirms that flash air-carbonisation of biomass, as described herein, yields carbon-rich carbonaceous matter with relatively low amounts of O and little or no N.
| Sample | Yield [wt%] | C [%] | H [%] | N [%] | O [%] |
|---|---|---|---|---|---|
| Date seeds | 49.0 | 7.0 | 1.6 | 42.4 | |
| ACDS carbon | 78.5 | 4.0 | 1.2 | 16.3 | |
| ACDS2600 | 64 | 67.0 | 2.0 | 0.6 | 30.4 |
| ACDS2700 | 60 | 82.0 | 0.9 | 0.5 | 16.6 |
| ACDS2800 | 56 | 90.0 | 0.1 | 0.2 | 9.7 |
| ACDS4600 | 54 | 73.0 | 0.5 | 0.3 | 26.2 |
| ACDS4700 | 54 | 83.9 | 0.2 | 0.3 | 15.6 |
| ACDS4800 | 50 | 84.3 | 0.1 | 0.1 | 15.5 |
The yield of activated carbon with respect to the starting biomass matter is an important consideration. The yield of carbonaceous matter (i.e., ACDS carbon) from flash air-carbonisation of raw date seeds was typically between 50 and 60%. On the other hand, the activated carbon yields (i.e., ACDS carbon to activated carbon), as shown in Table 1 are between 50 and 65%. This yield is much higher than the yields (i.e., 4 to 20%) obtained when carbonaceous matter that is generated via conventional pyrolysis and hydrothermal carbonisation (HTC) routes is used as the starting material.6–17 We ascribe the higher yield to the fact that flash carbonisation, such as demonstrated here for date seeds and ACDS carbon, generates carbonaceous matter that is relatively resistant to activation with KOH due to having a low O/C ratio.41–44 However, the critical mass balance parameter is the overall biomass (date seeds) to activated carbon yield, which is between 25 and 40%. Such a yield is unprecedented with respect to the proportion of the original raw biomass that is converted to activated carbon, and is consistent with the effects of flash carbonisation. The nature of the raw date seeds (i.e., a low O/C ratio) also has a role to play in the high yield given that, when put through the same process, raw sawdust achieves lower yields.43 For activation of the ACDS carbon, as expected, increasing the KOH/ACDS ratio decreases the overall yield of activated carbon from 56–64% at KOH/ACDS ratio 2, and to 50–54% at ratio 4. The combined effects of the amount of KOH used and activation temperature mean that the highest yield (64%) is for sample ACDS2600, while the lowest (50%) is for ACDS4800.
We note that hydrothermal carbonisation (HTC) of date seeds (at 250 °C) resulted in hydrochar with elemental composition (wt%) of C (68.7), H (6.0), N (1.5) and O (23.8) giving a O/C ratio of 0.25. Thus the carbon content (78.5 wt%) of the air carbonised ACDS carbon (with O/C ratio of 0.156) is significantly higher than that of the hydrochar. It is, however, also noteworthy that the C content of the date seed hydrochar (68.7 wt%) is higher than that of sawdust hydrochar (57.4 wt%).42,43 On activation of the ACDS carbon, the content of elemental C varies between 67 and 90 wt% for activation at KOH/ACDS carbon ratio of 2, and between 73 and 85 wt% at ratio of 4. At both ratios, the C content increases for higher activation temperature. The H and N content reduce significantly on activation, with both reducing more at higher KOH/ACDS ratio and activation temperature, to the extent that they are close to nil after activation at 800 °C. Thermogravimetric analysis (TGA) was performed to assess the purity and thermal stability of the carbons. The TGA curves in Fig. 1 indicate that the ACDS carbon is stable up to 300 °C, whereas the activated carbons (ACDSxT) are stable up to 400 °C. All samples show a small initial mass loss below 100 °C due to evaporation of residual moisture from the drying process. This is followed by a further single step mass-loss event due to the combustion of carbon. For all activated samples, the carbon burn off temperature is between 400 and 660 °C, with samples activated at 800 °C have greater thermal stability than those activated at 600 °C or 700 °C. All the carbons display residual mass typically less than 2 wt%, suggesting that they are essentially fully carbonaceous with only trace amounts of mineral matter.
 | ||
| Fig. 1 TGA curves of air-carbonised date seed-derived carbon (ACDS) and activated carbons derived from the ACDS carbon. | ||
Powder X-ray diffraction was performed to confirm the nature and purity of the date seed-derived porous carbons. The XRD patterns of representative samples are shown in Fig. 2. The broad peak at 2-theta of 22° and 44° in the XRD pattern of the ACDS carbon and some of the activated carbons correspond to the positions at which the (002) and (100) diffractions arising from graphene stacks are expected. This indicates that the ACDS carbon has some graphene-like stacking that is greatly reduced or lost for the activated carbons, which is consistent with the disruptive nature of the activation process. The activation temperature does not appear to have any significant or consistent effect of the level of graphene stacking. The overall picture that emerges from the XRD patterns is that the date seed derived carbons are essentially amorphous as is typical of KOH activated carbons. The morphology (Fig. S1, ESI†) of the carbons is dominated by honeycomb structure, and is similar to that previously observed in activated carbon.18–35 TEM images (Fig. S2, ESI†) reveal wormhole-type pore channels, and show no evidence of the presence of graphitic domains, which is in agreement with the XRD patterns (Fig. 2), and previous studies on biomass derived activated carbons.25–28,41–44
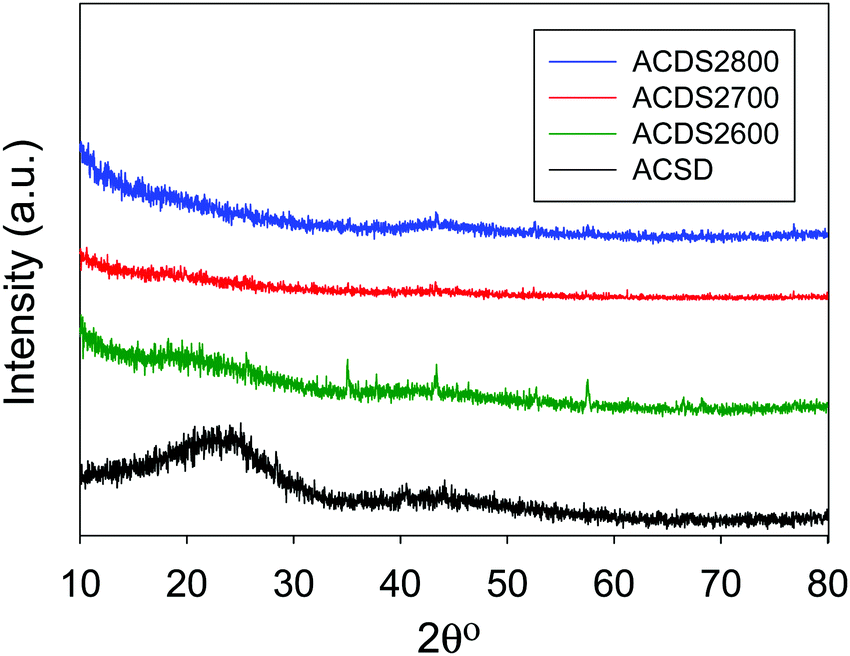 | ||
| Fig. 2 Powder XRD pattern of air-carbonised date seed-derived carbon (ACDS) and representative activated carbons derived from the ACDS carbon. | ||
3.2 Porosity of carbons
The ACDS carbon was found to be virtually non-porous with a very low surface area of 2.5 m2 g−1 and pore volume of 0.004 cm3 g−1. The nitrogen sorption isotherms and corresponding pore size distribution (PSD) curves of activated carbons prepared at KOH/ACDS ratio of 2 are displayed in Fig. 3. All the isotherms, regardless of the activation temperature between 600 and 800 °C, are of type I, indicating that the ACDS2T carbons are microporous. The amount of nitrogen adsorbed, which is an indication of the level of porosity (i.e., surface area and pore volume) generated in the activated carbons, increases at higher activation temperature. It is interesting to note that despite the increase in amount of nitrogen adsorbed as activation temperature rises from 600 to 800 °C, there is little change in the shape of the isotherms as all three carbons exhibit isotherms with a sharp adsorption knee. Sharp adsorption knees are associated with the absence of pores of size larger than the micropore range (up to 2 nm). As shown in Fig. 3B, the porosity of the ACDS2T carbons is dominated by 0.6–1.5 nm pore channels, with most pores being <1 nm.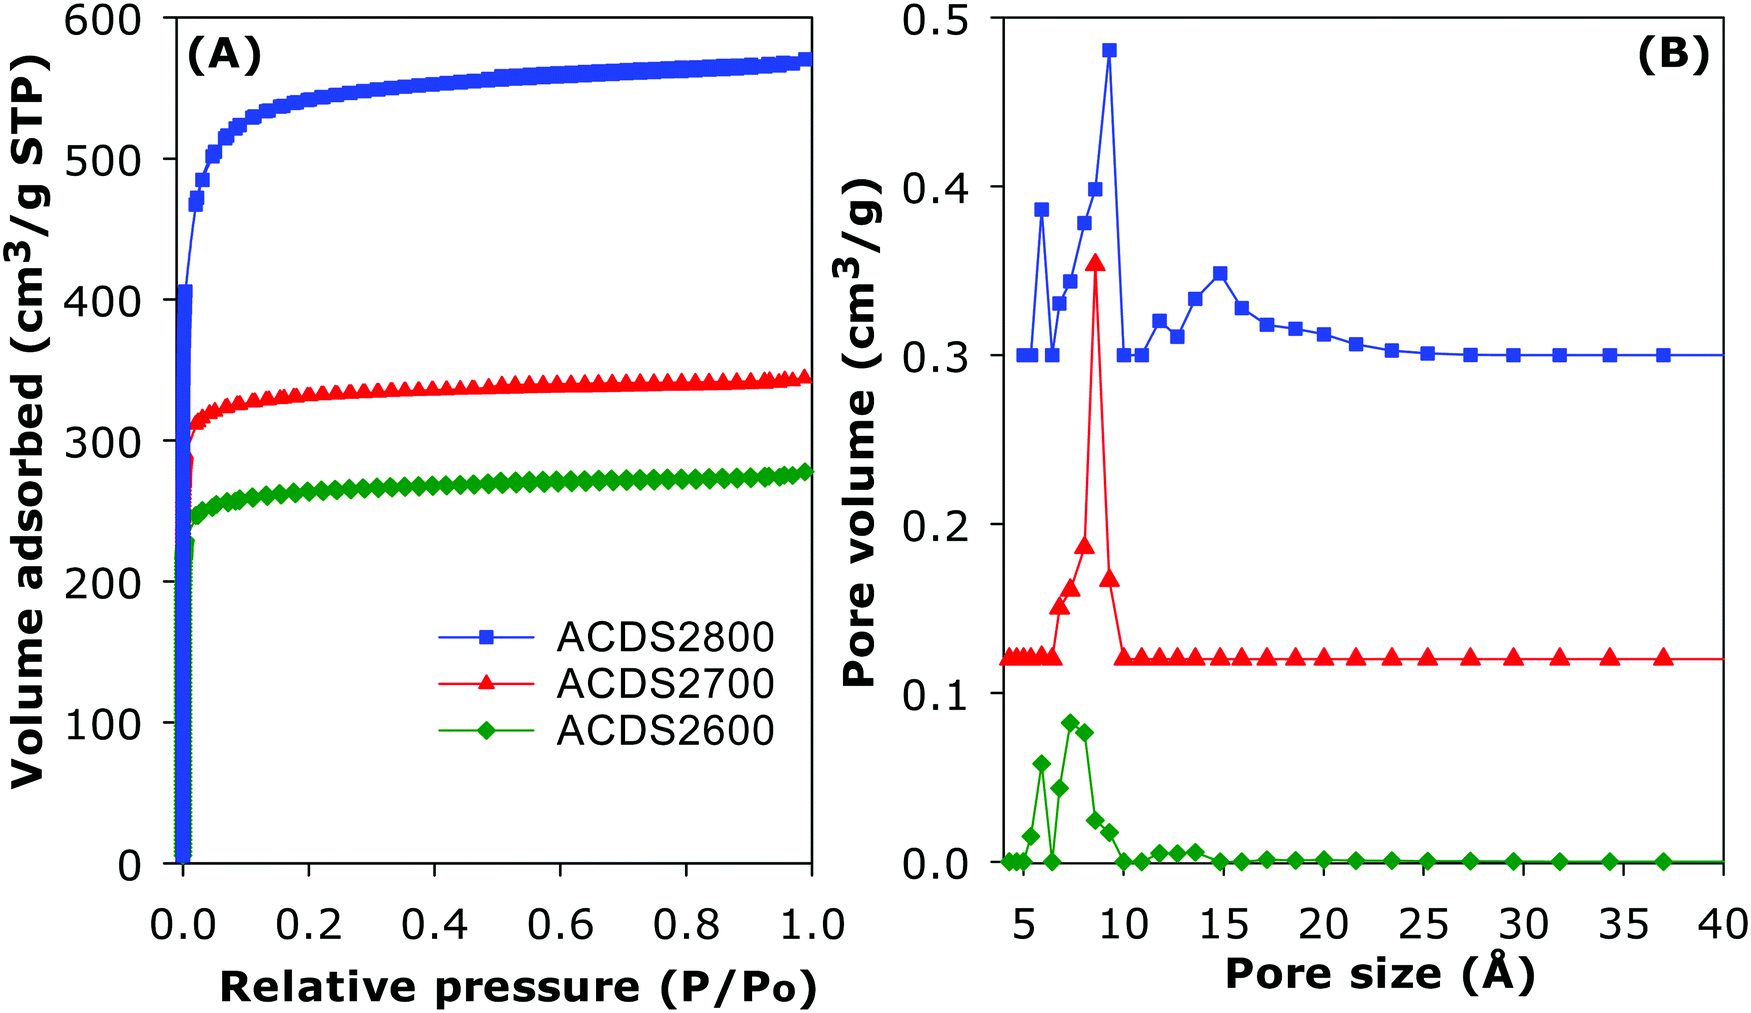 | ||
| Fig. 3 (A) Nitrogen sorption isotherms and (B) pore size distribution (PSD) curves of activated carbons prepared from ACDS carbon at KOH/ACDS ratio of 2. The PSD curves of ACDS2700 and ACDS2800 are offset (y-axis) by 0.12 and 0.3, respectively. | ||
Fig. 4 shows the nitrogen sorption isotherms and corresponding PSD curves of activated carbons prepared at KOH/ACDS ratio of 4. The shape of isotherms for samples ACDS4600 and ACDS4700 suggest that they are predominantly microporous but with a significant proportion of supermicropores (i.e., pore channels of size 0.7–2.0 nm) and some small mesopores. The isotherm of sample ACDS4800, while consistent with the sample being mainly microporous, exhibits a gentle adsorption knee, which is an indication of the presence of a significant proportion of supermicropores and small mesopores.21,33,45 Activation at KOH/ACDS ratio of 4 generates a greater proportion of larger pores compared to activation at ratio of 2. However, even at the most severe level of activation, (sample ACDS4800), the porosity is still dominated by micropores, which is unlike the behaviour of other biomass sources.18–35 The PSD curves in Fig. 4B confirm that ACDS4T samples possess a relatively wide size range of pores but still mainly within the micropore/supermicropore to small mesopore range, with most pores being of size below 1.5 nm and hardly any pores wider than 2.5 nm.
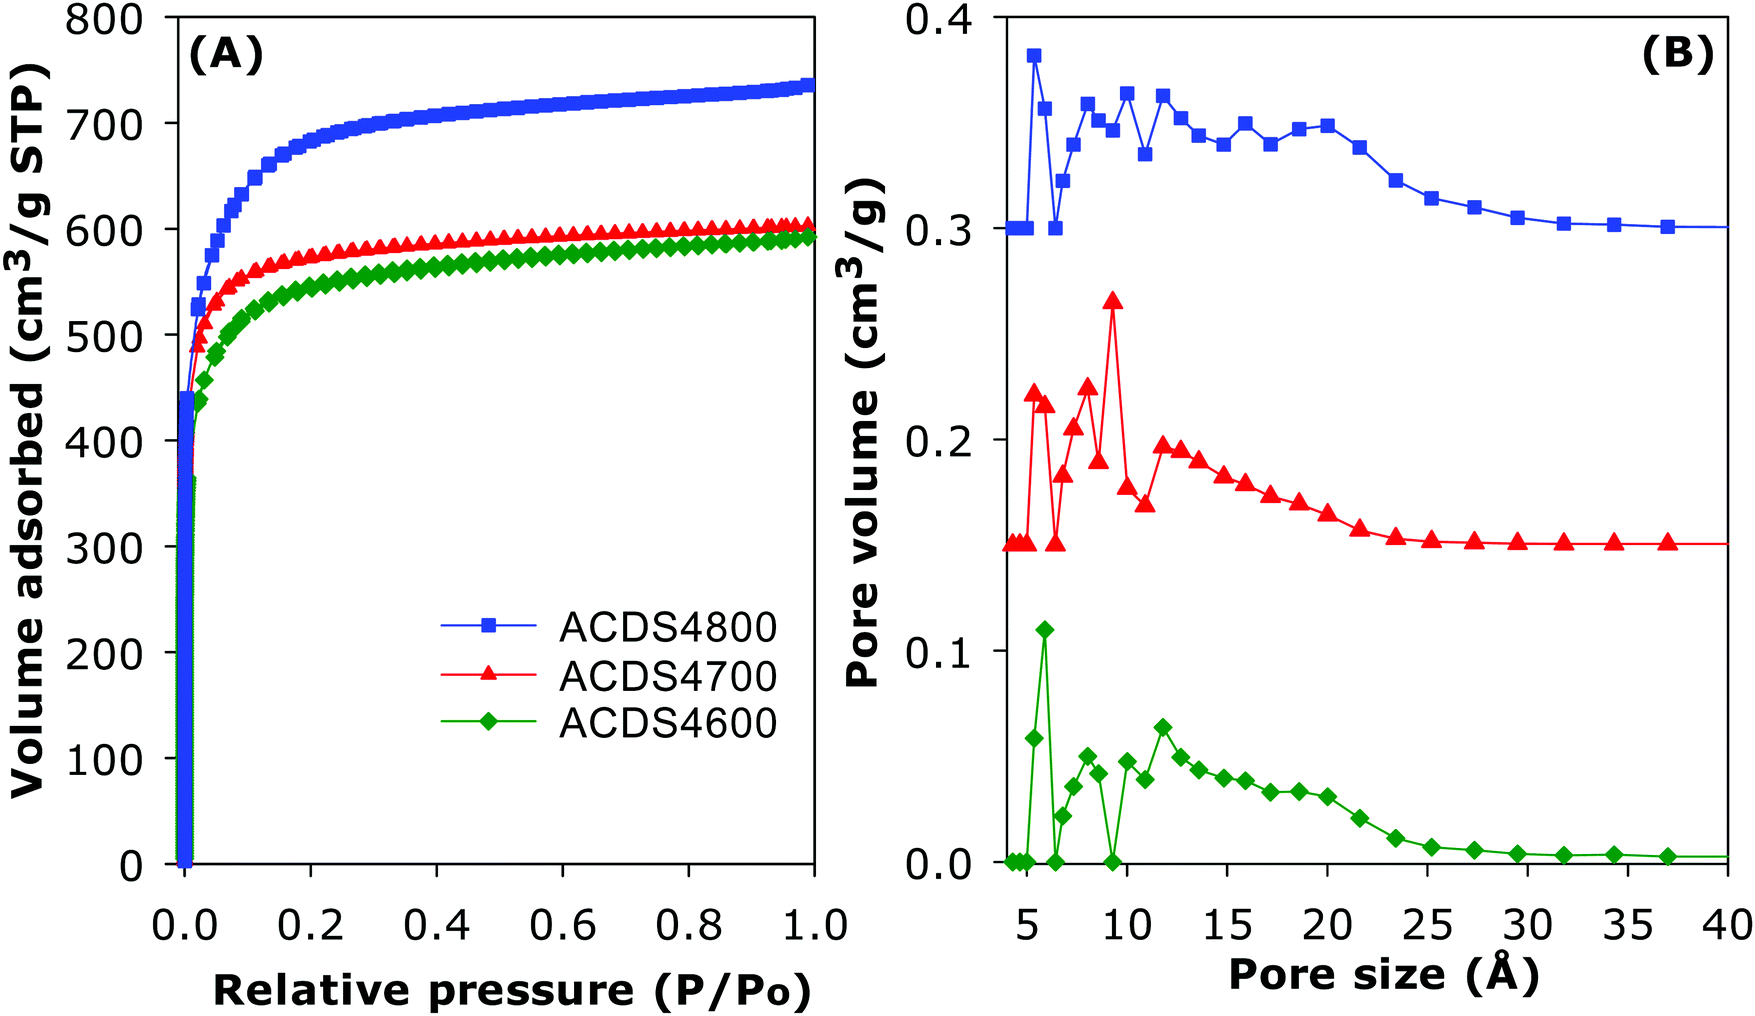 | ||
| Fig. 4 (A) Nitrogen sorption isotherms and (B) pore size distribution curves of activated carbons derived from ACDS carbon at KOH/ACDS carbon ratio of 4. The PSD curves of ACDS4700 and ACDS4800 are offset (y-axis) by 0.15 and 0.3, respectively. | ||
The textural properties of the activated carbons are given in Table 2. Depending on the severity of activation, the surface area (995–2610 m2 g−1) and pore volume (0.43–1.10 cm3 g−1) are moderate to high compared to other forms of porous carbons. As expected, the lowest surface area is for the least activated sample (ACDS2600) and the highest surface is for the most severely activated carbon (ACDS4800). Nevertheless, the highest surface area and pore volume achieved is lower than for other types of biomass or staring materials.18–44 We attribute this observation to the ACDS carbon being resistant to activation with KOH.41,43 The microporous nature of the carbons is more clearly illustrated by the extent and proportion of surface area and pore volume arising from micropores. As shown in Table 2, the proportion of microporosity for ACDS2T samples is typically ca. 90% of surface area and 80–90% of pore volume, while for ACDS4T carbons the proportion is 70–90% (surface area) and 60–80% (pore volume).
| Sample | Surface area (m2 g−1) | Micropore surface areaa (m2 g−1) | Pore volume (cm3 g−1) | Micropore volumeb (cm3 g−1) | Surface area densityc (m2 cm−3) | Packing density (g cm−3) | Volumetric surface aread (m2 cm−3) |
|---|---|---|---|---|---|---|---|
| a The values in the parenthesis refer to % micropore surface area. b The values in the parenthesis refer to % micropore volume. c Surface area density is obtained as ratio of total surface area to total pore volume. d Volumetric surface area determined as surface area x packing density. | |||||||
| ACDS2600 | 995 | 900 (90) | 0.43 | 0.36 (83) | 2314 | 1.12 | 1114 |
| ACDS2700 | 1264 | 1170 (92) | 0.53 | 0.47 (88) | 2385 | 1.01 | 1277 |
| ACDS2800 | 2068 | 1780 (86) | 0.88 | 0.71 (80) | 2350 | 0.82 | 1696 |
| ACDS4600 | 1913 | 1736 (90) | 0.80 | 0.62 (78) | 2391 | 0.86 | 1645 |
| ACDS4700 | 2192 | 1871 (85) | 0.93 | 0.74 (79) | 2357 | 0.81 | 1776 |
| ACDS4800 | 2609 | 1825 (70) | 1.10 | 0.70 (63) | 2372 | 0.69 | 1774 |
In Table 2, we have also included calculated values of the surface area density defined as the ratio between total surface area and total pore volume. High surface area in porous materials is generally generated from a preponderance of small pores while, in contrast, large pore volume is associated with fewer but wider pores. Thus, any collapse of micropores (in a high surface area/low pore volume solid) into larger pores can generate a material with lower surface area/high pore volume. Given that low levels of activation tend to generate micropores (i.e., high surface area/pore volume ratio), while greater activation yields larger pores (supermicropores and mesopores, and therefore lower surface area/pore volume ratio), it follows that the surface area density is a parameter that may be used as a measure of the susceptibility (or resistance) of carbonaceous matter to activation. It is interesting to note that, as shown in Table 2, the surface area density of the present carbons is within the narrow range of 2310 to 2390 m2 cm−3 regardless of the severity of activation. This suggest that surface area density can, in the present case, be considered to be an inherent property of the starting carbonaceous material, and which may be used as an indicator of resistance to activation. In order to test this hypothesis in the context of a wide range of activateable carbonaceous matter, we compared the ACDS carbon with other starting materials that have been used for the preparation of activated carbons (Table S2, ESI†), including flash air-carbonised sawdust,43 air-carbonised CNL1 carbon,41 raw sawdust,42 hydrothermally carbonised hydrochar from biomass (sawdust,21,44 lignin,47 jujun grass,48Camellia japonica48), cellulose hydrochar,21,23 cellulose acetate hydrochar,23 starch hydrochar,21 fresh cigarette filter hydrochar,30 smoked cigarette filter hydrochar,30 and also carbon nanotube composites,49 and polypyrrole.33 The extensive comparative data (Table S2, ESI†), firstly, indicates that ACDS carbon has the lowest O/C ratio amongst the wide range of carbonaceous matter. We then compared the surface area density of the ACDS-derived carbons with similarly activated carbons from the wide range of carbonaceous matter (Tables S3–S5, ESI†). The data suggest that under any given activation conditions (similar temperature and KOH/precursor ratio), the date seed-derived ACDSxT carbons have the highest surface area density consistent with their greater resistance to activation. The surface area density of the ACDS derived samples is comparable to that of carbons derived from air-carbonized sawdust or wood (i.e., CNL1 carbon),41,43 which is consistent with the three ‘raw’ (i.e., starting material) carbons being generated via flash air-carbonization of biomass.
We have previously shown that a high surface area density (i.e., the tendency to generate micropores rather than larger pores) arises because air carbonization of biomass enriches the proportion of lignin products, which are less susceptible to activation.41–44,50–56 Our comparative data (Tables S3–S5, ESI†) clearly shows that activated carbons derived from the other sources have much lower surface area density indicating a greater susceptibility to activation with KOH. Furthermore, lower surface area density and susceptibility to activation is related to the ratio of elemental oxygen to that of elemental carbon (i.e., O/C atomic ratio) in the precursor materials (Tables S2–S5, ESI†). We have previously postulated that the elemental composition of activateable carbonaceous matter, and in particular the atomic ratio of oxygen to carbon (i.e., O/C atomic ratio) plays a role in the activation process with a high O/C ratio favouring ease of activation and generation of greater mesoporosity.44 Indeed, the surface area density of activated carbons increases when carbonaceous matter with low O/C ratio is used as starting material (Fig. 5 and Fig. S3, ESI†). A close linear correlation is observed between the surface area density and O/C ratio of the precursor for activation at KOH/precursor ratio of 4 and 800 °C (Fig. 5) or 700 °C (Fig. S3, ESI†). Quantitative evaluation of the correlation yields R value of 0.87 and 0.85 for KOH/precursor ratio of 4 and activation temperature of 700 and 800 °C, respectively (Fig. S4, ESI†). The R values, being greater than 0.7, are of a range that is a clear indication of a strong linear correlation between the O/C ratio and surface area density. A similar linear relationship is observed between the surface area density and O/C ratio of the precursor for activation at KOH/precursor ratio of 2 and 800 °C (Fig. S5, ESI†); the R value is 0.8, and the relationship is stronger (R value of 0.92) for O/C ratio of up to 0.5 (Fig. S6, ESI†). These findings demonstrate that selection of a starting carbonaceous precursor with a low O/C ratio can enable prediction of activation behaviour with the expectation, as confirmed herein, that the resulting activated carbons will be predominantly microporous and have high surface area density. A consequence of high surface area density is that the present activated carbons exhibit high packing density (Table 2), a key aim of this work. As described above, careful choice of precursor and understanding of the link between O/C ratio of a precursor and surface area density can enable synthesis of carbons with a targeted property (i.e., high packing density).
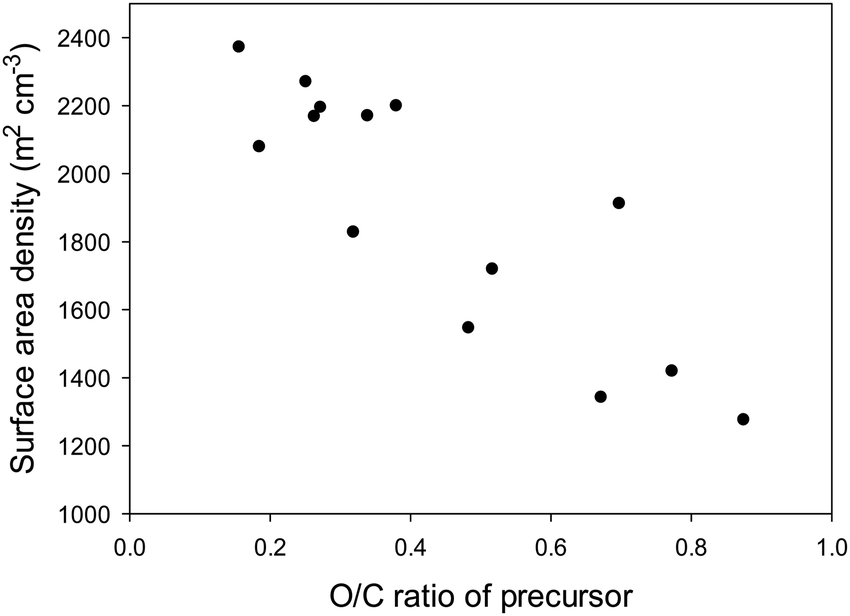 | ||
| Fig. 5 Surface area density of activated carbons as a function of the O/C ratio of precursor carbonaceous matter. All activations were at 800 °C at the KOH/precursor ratio of 4. | ||
3.3 Methane storage
For efficient methane storage at moderate to high pressure (35–100 bar), a porous material should be predominantly microporous with high surface area along with low mesoporosity.6–14 A high microporous volume is essential to ensure strong adsorption of methane molecules, while some mesoporosity is required for efficient sorption kinetics. Furthermore, pore channels of size 0.8 to 1.5 nm are best suited for the most favourable adsorption of 2 or 3 methane molecules in a manner that optimises the packing of the adsorbed phase within the pores.6–14 It has also been previously suggested that pore channels of size 1.1 nm are the most suited for methane storage.13 The present carbons, with their mix of microporosity/mesoporosity (Table 2), are therefore expected to be excellent candidates to achieve a high methane storage capacity at moderate pressures. The methane uptake capacity of the activated carbons was determined at room temperature (25 °C) and pressure of up to 35 bar. The focus was on uptake at 35 bar, a value that has been extensively used in previous studies and which therefore enables easy comparison with current state-of-the-art materials.6–14 The total gravimetric methane uptake isotherms of the ACDSxT carbons are shown in Fig. 6. Our methane uptake measurements enabled direct determination of the excess uptake (Fig. S7, ESI†). The total methane storage capacity can be calculated from the excess values by taking into account the density of the methane (under any given temperature and pressure conditions) and the total pore volume of the activated carbon (Fig. 6, Fig. S8 and S9, ESI†). This was done by applying the equation; θT = θExc + dCH4 × VT, where; θT is total methane uptake, θExc is excess methane uptake, dCH4 is density (g cm−3) of methane gas under the prevailing temperature and pressure, and VT is total pore volume (cm3 g−1) of the activated carbon. The methane density was obtained from the National Institute of Standards and Technology (NIST) website (http://www.nist.gov/). For all samples, the methane uptake at pressure of up to 35 bar was fully reversible with no hysteresis. The isotherms in Fig. 6 indicate that saturation was not attained in the 0–35 bar pressure range, meaning that the present carbons, and in particular the ACDS4T and ACDS2800 samples, can potentially store greater amounts of methane at higher pressure. The present carbons have high to very high gravimetric methane storage capacity with the uptake being better for samples that have higher surface area and pore volume. It is also apparent that at low pressure (<5 bar) the more microporous ACDS2T samples have higher methane uptake compared to their ACDS4T equivalents. However, above 6 bar, the methane uptake of ACDS4T samples gradually overtakes that of the ACDS2T group. The fact that the ACDS4T samples have high methane uptake at high pressure and relative lower uptake at low pressures is a preferred combination for achieving better performance with respect to working capacity.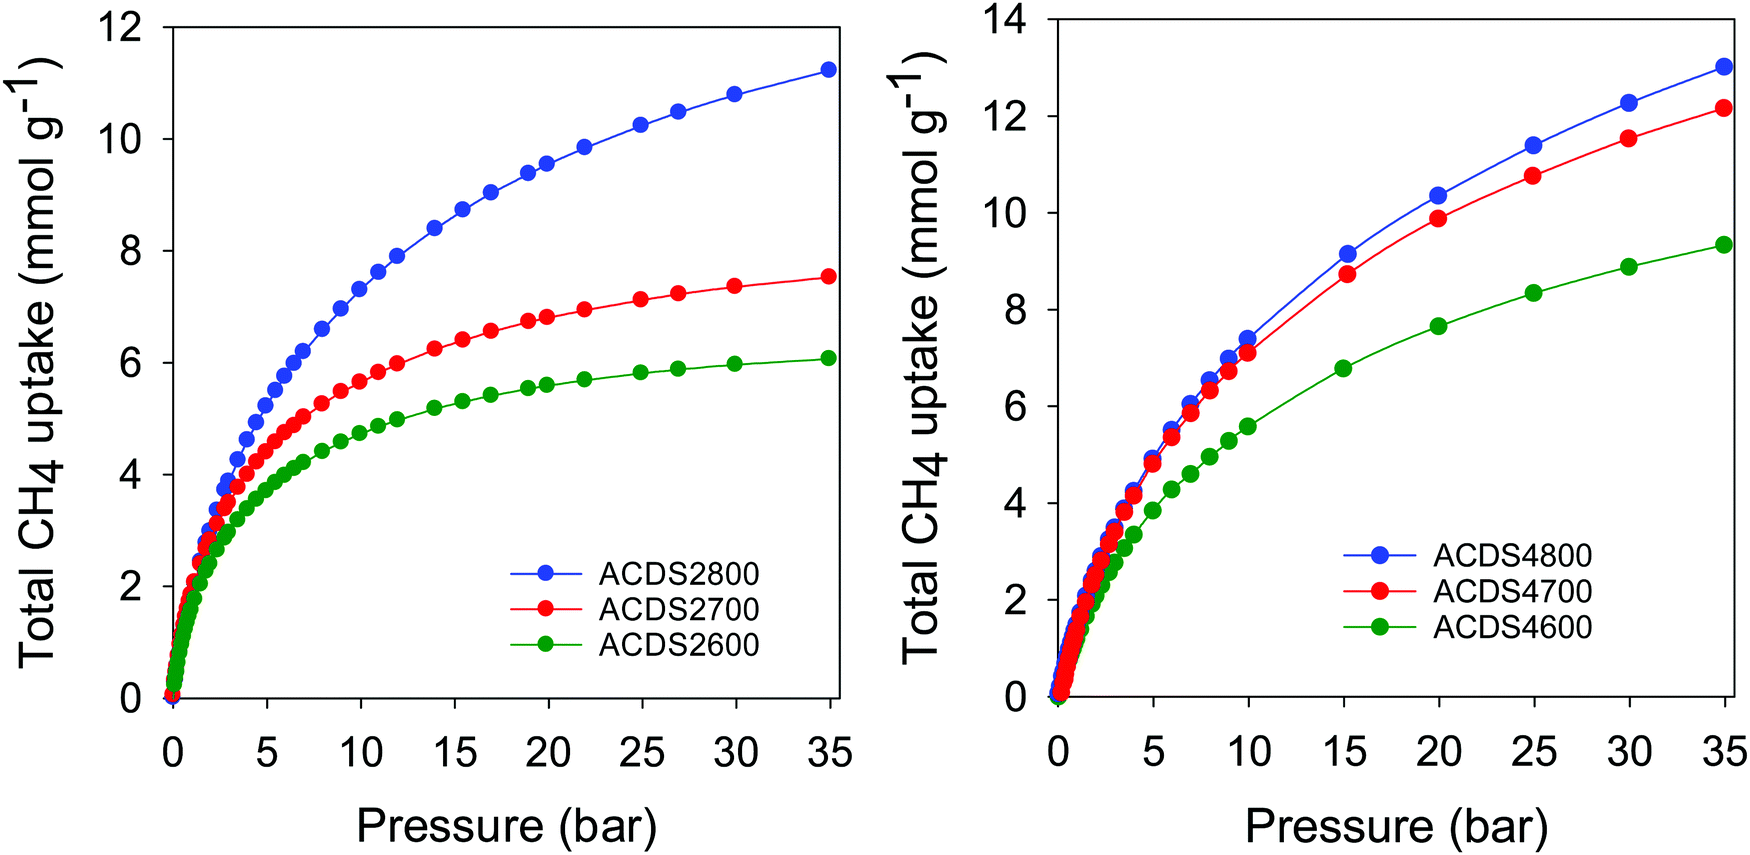 | ||
| Fig. 6 Total gravimetric methane uptake at 25 °C of ACDS-derived activated carbons (ACDSxT), where x is KOH/ACDS ratio and T is activation temperature. | ||
Table 3 summarizes the amount of methane adsorbed at 35 bar, expressed as gravimetric (mmol g−1 and g g−1) or volumetric (cm3 (STP) cm−3) uptake. The excess gravimetric methane uptake is in the range 5.4–11.4 mmol g−1, (equivalent to 0.09–0.18 g g−1). Sample ACDS2800, ACDS4700 and ACDS4800 have higher gravimetric methane update, which is consistent with their greater surface area and pore volume. On the other hand, sample ACDS2600 has both the lowest porosity and methane uptake. We note that excess methane uptake of 11.4 mmol g−1 (0.18 g g−1), at 25 °C and 35 bar, is amongst the best ever reported for any porous material.6–14 The total methane uptake is in the range 6.1–13.0 mmol g−1, (0.10–0.21 g g−1). In this regard, the uptake of sample ACDS4700 and ACDS4800, which is above 12.0 mmol g−1 (>0.20 g g−1) is very impressive and compares with the best benchmark materials reported to date.6–14 It is clear that the targeted porosity development in the present carbons achieves impressive gravimetric methane storage capacity at 25 °C and 35 bar. However, the more important measure of a solids performance in methane storage is the volumetric uptake, which takes into account the packing density of the adsorbent. The key targets for methane storage in porous materials are set with respect to volumetric uptake capacity expressed as cm3 (STP) cm−3 (i.e., cm3 of methane per unit tank volume occupied by the adsorbent). An often-quoted target is that set by the US Department of Energy (DOE) of 263 cm3 (STP) cm−3 at ambient temperature (25 °C) and moderate pressure (35–100 bar). Fig. 7 shows the excess and total volumetric uptake of the ACDSxT carbons. In general, the ACDS4T samples perform better than their equivalents in the ACDS2T group. All the carbons, except sample ACDS2600, do not reach saturation at 35 bar, with the ACDS4T samples appearing to be much further away from saturation, which suggests that they are potentially capable of achieving much greater volumetric uptake at higher pressure (36–100 bar). The highest gravimetric uptake was observed for sample ACDS4800, which also has the highest surface area and pore volume, but the best volumetric uptake is for sample ACDS4700. The better volumetric uptake performance of sample ACDS4700 is ascribed to a more optimized combination of porosity and packing density (Table 2).
| Sample | Excess uptake (35 bar) | Total uptake (35 bar) | Working capacitya (cm3 cm−3) | ||||
|---|---|---|---|---|---|---|---|
| mmol g−1 | g g−1 | cm3 cm−3 | mmol g−1 | g g−1 | cm3 cm−3 | ||
| a Working capacity is the difference in uptake between 35 bar and 5 bar. | |||||||
| ACDS2600 | 5.4 | 0.09 | 135 | 6.1 | 0.10 | 153 | 60 |
| ACDS2700 | 6.8 | 0.11 | 154 | 7.5 | 0.12 | 170 | 71 |
| ACDS2800 | 10.0 | 0.16 | 184 | 11.3 | 0.18 | 208 | 112 |
| ACDS4600 | 8.0 | 0.13 | 154 | 9.3 | 0.15 | 180 | 106 |
| ACDS4700 | 10.8 | 0.17 | 196 | 12.2 | 0.20 | 222 | 135 |
| ACDS4800 | 11.4 | 0.18 | 176 | 13.0 | 0.21 | 201 | 126 |
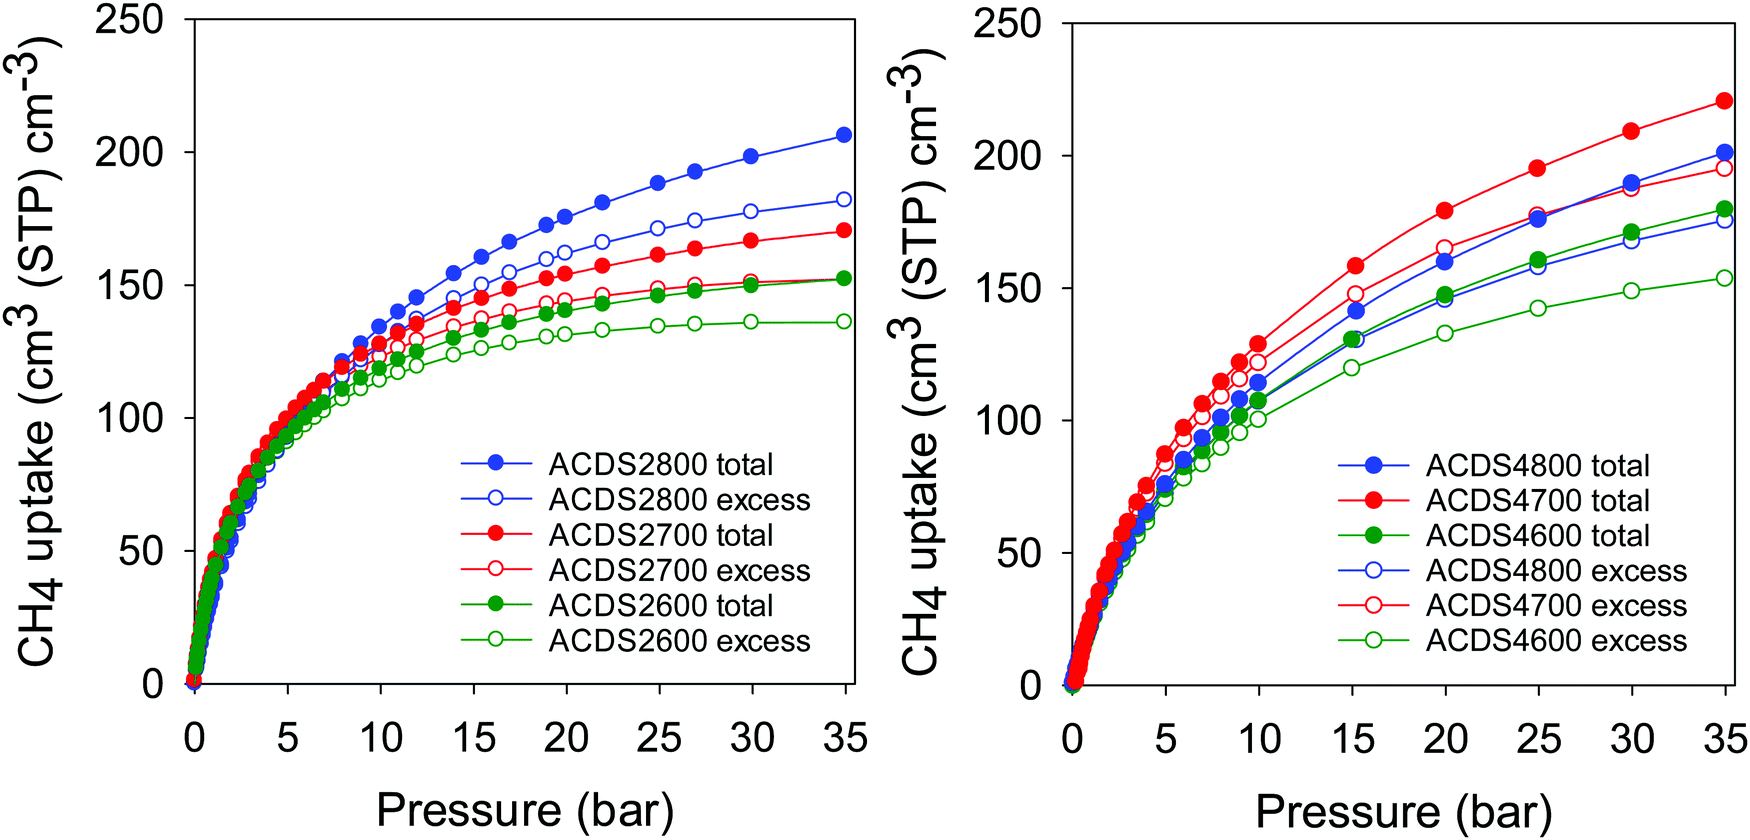 | ||
| Fig. 7 Excess and total volumetric methane uptake at 25 °C for ACDS-derived activated carbons (ACDSxT), where x is KOH/ACDS ratio and T is activation temperature. | ||
The carbons have excess volumetric methane uptake (at 25 °C and 35 bar) of 135 to 184 cm3 cm−3 for ACDS2T samples, and 154 to 196 cm3 cm−3 for the ACDS4T group. This excess volumetric uptake is much higher than for previously reported porous carbons (Table S6, ESI†).6,57–60 To date, the best performing porous carbons for volumetric methane storage at 25 °C and 35 bar are mesophase pitch derived activated carbons, LMA738 and DO00-3:1_700 that store 142 and 160 cm3 cm−3 methane, respectively,57,58 and zeolite templated carbons, ZTC, (BEA-ZTC)59 and thermally treated BEA-ZTC (BEA-ZTC-873)59 that store 125 and 145 cm3 cm−3 methane, respectively (Table S6, ESI†). In comparison, the best performing ACDS4700 sample achieves much higher excess methane uptake of 196 cm3 cm−3 (Table 3 and Table S6, ESI†). The total methane uptake of the present carbons is between 153 and 208 cm3 cm−3 for ACDS2T samples, and 180 to 222 cm3 cm−3 for the ACDS4T group. Such total storage capacity, of up to 222 cm3 cm−3, is significantly better than for all previously reported porous carbons (Table S6, ESI†).57–60 We note that the current benchmark carbon materials are the aforementioned mesophase pitch derived activated carbons, LMA738 and DO00-3:1_700 with storage of 185 and 184 cm3 cm−3, respectively,57,58 and the ZTCs with 148 cm3 cm−3 for BEA-ZTC and 165 cm3 cm−3 for BEA-ZTC-873.59 A commercially available high surface area carbon, AX21, has uptake of 148 cm3 cm−3. A comparison between the best performing ACDS-derived samples (ACDS2800, ACDS4700 and ACDS4800) and benchmark carbons57–60 (Table S6, ESI†) indicates that it is important to optimise, as we have herein attempted, several factors, namely, total porosity (surface area and pore volume), level of microporosity, pore size distribution and packing density.
For a proper and broader context of the methane storage performance of the present ACDSxT carbons, we compared them to benchmark MOF materials. MOFs have been touted as the most promising methane storage materials, and a great deal of work is reported in the open literature.6–9 It is, however, important to note that most reported volumetric methane uptake values of MOFs are computed using crystallographic density (rather than packing density).6–9 The use of crystallographic density can result in overestimated values and unrealistic scenarios requiring that MOFs be packed into constrained space such as a cylinders as single crystals. The Advanced Research Projects Agency-Energy (ARPA-E) of the US DOE has recently offered a new volumetric methane storage target of 350 cm3 (STP) cm−3, that incorporates use of the crystallographic density of MOFs.8,9 Given that the actual packing density of MOFs is typically much lower (up to 50% less) than their crystallographic density, this new target allows for a 25% reduction in volumetric capacity (to ca. 263 cm3 cm−3) as a result of packing MOFs into a storage tank. To date, the highest reported values for methane storage at 25 °C and 35 bar, for powder forms of MOFs are; 225 cm3 cm−3 for HKUST-1 (crystal density of 0.881 g cm−3),8 230 cm3 cm−3 for Ni-MOF-74 (crystal density of 1.195 g cm−3),8 221 cm3 cm−3 for Co-MOF-74 (crystal density of 1.173 g cm−3),8 235 cm3 cm−3 for PCN-14 (crystal density of 0.829 g cm−3),61 and 227 cm3 cm−3 for HKUST-1 (with crystal density of 0.883 g cm−3).62 The storage capacity of the best performing ACDS4700 sample (222 cm3 cm−3) is comparable to that of these benchmark MOFs.8,61–64 Crucially, the MOF values can be expected to reduce by between 25 and 50% when used in real applications,6–9 which means that the present ACDS4700 sample has higher practical capacity compared to the MOFs. Indeed, a recent study has shown that the uptake of HKUST-1 at 65 bar reduces by >50% from 267 cm3 cm−3 when crystal density (0.883 g cm−3) is used to 130 cm3 cm−3 for hand packing density (0.43 g cm−3).46
Recently Tian and co-workers reported on a sol–gel monolithic MOF that exhibits high packing density and enhanced volumetric methane uptake.46 The so-called monoHKUST-1, which has a packing density of 1.06 g cm−3, is currently the record holder for volumetric methane storage in porous materials.9,46 We compared the performance of the best ACDSxT carbons with that of monoHKUST-1 (Fig. 8, Fig. S10 and Table S7, ESI†). The ACDSxT carbons have higher gravimetric uptake (Fig. S10, ESI†) than monoHKUST-1 at pressure of 35 bar due to their higher surface area and pore volume.46 However, the situation is reversed for the volumetric uptake (Fig. 8 and Table S7, ESI†) where the uptake of monoHKUST-1 is higher than that of ACDS2800 and ACDS4800 and comparable to that of ACDS4700. At 35 bar the excess uptake of ACDS4700 is 196 cm3 cm−3 compared to 205 cm3 cm−3 for monoHKUST-1. The total uptake is closely matched at 222 and 224 cm3 cm−3 for ACDS4700 and monoHKUST-1, respectively. The shape of the uptake isotherm of the ACDS4700 sample (Fig. 8) suggest that it is potentially likely to be at par or higher than that of monoHKUST-1 at pressures higher than 35 bar.
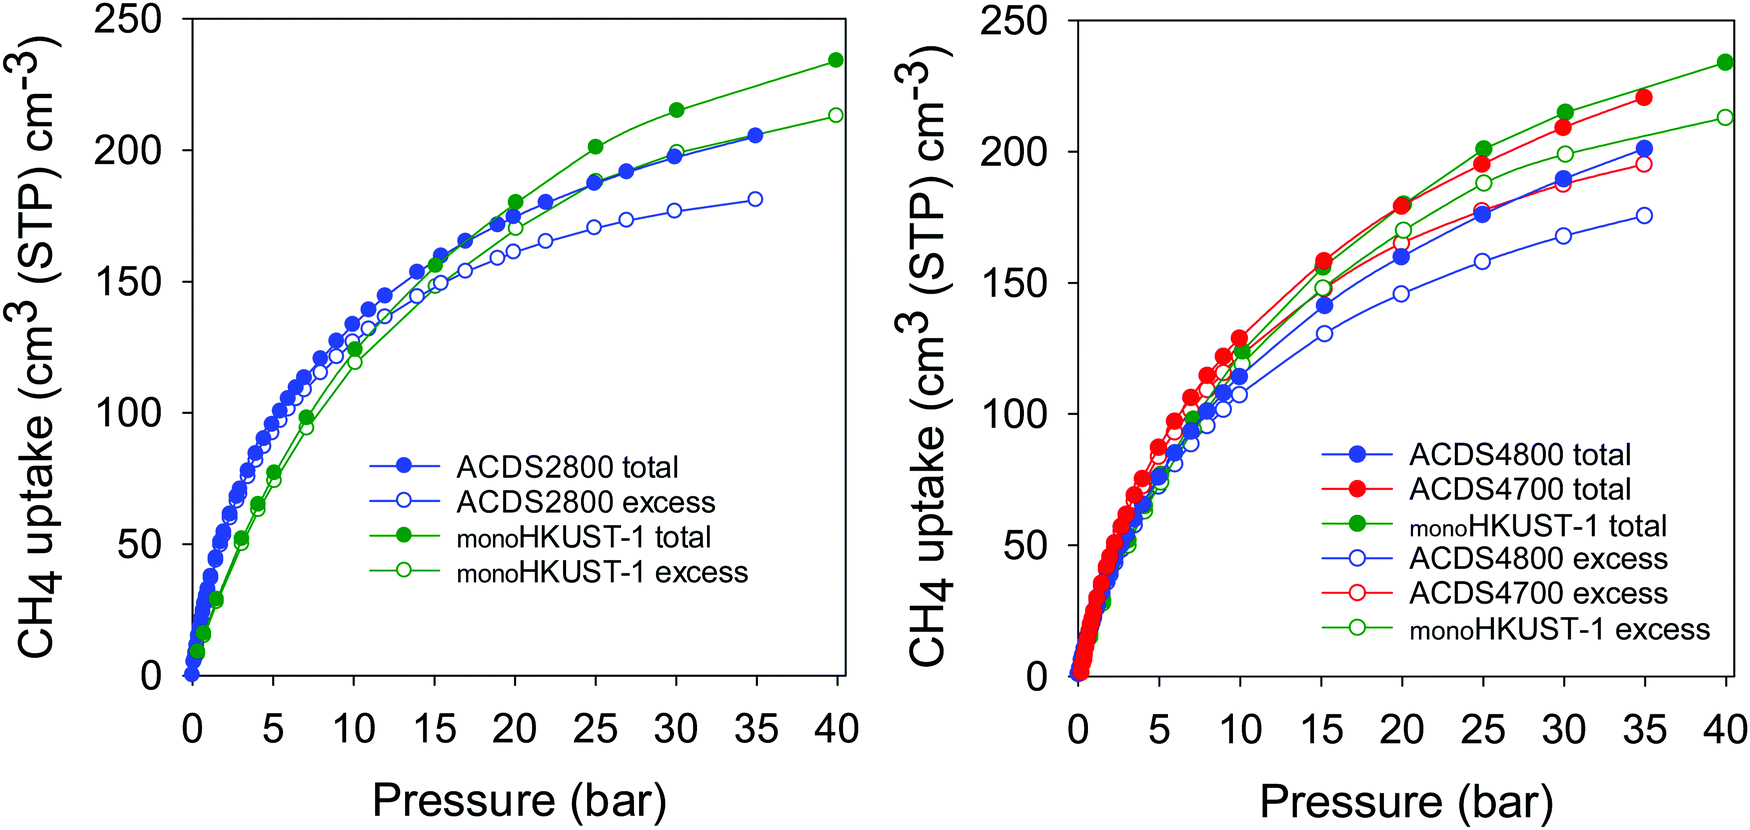 | ||
| Fig. 8 Total and excess volumetric methane uptake at 25 °C of ACDS-derived activated carbons (ACDSxT) compared to the benchmark MOF, monoHKUST-1. Data for monoHKUST-1 obtained from ref. 46. | ||
A key measure of the performance of a porous material for methane storage is the working capacity, which is the difference in uptake between the adsorption and desorption (regeneration) pressure. For methane storage, a desorption pressure of 5.8 bar is suggested, and we applied an adsorption pressure of 35 bar (Table S7, ESI†).6–9,46 The working capacity of the ACDS4700 sample is comparable to that of monoHKUST-1 (Table S7, ESI†). This is a noteworthy finding given that monoHKUST-1 is 50% better than any other MOF and is the current record holder for methane storage in porous materials. The monoHKUST-1 sample has a volumetric surface area (i.e., surface area x packing density) of 1288 m2 cm−3, compared to ca. 800 m2 cm−3 for powder form of HKUST-1.46 Interestingly, the volumetric methane uptake shows a similar trend to the volumetric surface area. The present ACDSxT carbons have volumetric surface area of between 1114 and 1776 m2 cm−3 (Table 2), and the methane volumetric uptake (Table 3) is best for samples with the highest volumetric surface area, which is consistent with the work of Tian and co-workers.46 We note that MOFs with higher volumetric surface area have been reported, such as 2060 m2 cm−3 for NU-1501-Al, but the high values are based on crystallographic density and therefore likely to be an overestimation.66 That such volumetric surface area values computed from crystallographic density are overestimated is consistent with NU-1501-Al having a total methane uptake of 148 cm3 cm−3 at 25 °C and 35 bar,66 compared to >220 cm3 cm−3 for monoHKUST-1 and sample ACDS4700. The present carbons, therefore, match the best MOF in terms of volumetric methane storage,46 but offer the advantage of being potentially much cheaper and more robust, and also offer good thermal and hydrolytic stability, which are both important for heat management systems of methane adsorption and overall parasitic energy considerations. Affordability of an adsorbent is an important consideration, and the high cost of MOFs is a likely obstacle to their commercial take up.6–9 Indeed, a recent techno-economic analysis for MOFs as candidates for light-duty vehicle on-board natural gas storage found baseline MOF costs to range from $35 per kg to $71 per kg, with the possibility of reduction of costs to $13 per kg to $36 per kg, and perhaps to $10 per kg in best case scenarios.65 On the other hand, the typical cost of activated carbons is ca. $1 per kg, which is significantly lower than the best scenario (i.e., lowest cost) for MOFs.
4. Conclusion
Activated carbons may be prepared from a wide range of carbonaceous precursors. To date, it is accepted that the properties (e.g., porosity, packing density) generated in the activated carbons are optimised via trial and error. In a departure from this current norm, we have shown that the properties of activated carbons can be predictably tailored by choice of the biomass precursor and mode of carbonisation to generate carbons that are highly microporous with high surface area density, high volumetric surface area and high packing density that is optimised for enhanced methane storage at medium pressure (35 bar). We show that the elemental composition of the biomass precursor, and more specifically a low ratio of elemental oxygen to elemental carbon (i.e., low O/C atomic ratio), can be used as a universal predictor of the nature of porosity to be generated for activated carbon prepared via KOH activation. Using date seed (Phoenix dactylifera) as starting biomass material, along with flash air-carbonisation, which to requires much shorter time (5–10 min.) and lower temperature (400 °C), we have synthesised activated carbons with an optimised mix of microporosity/mesoporosity, high surface area density, high volumetric surface area and high packing density than translates to record levels of volumetric methane storage. By examining a wide range of materials, we show that the surface area density is inversely related to the O/C ratio of the precursor carbonaceous matter. The carbonaceous matter obtained from flash air carbonisation of date seeds is resistant to activation and thus generates highly microporous activated carbons (with surface area of 995–2609 m2 g−1 and pore volume of 0.43–1.10 cm3 g−1) with high packing density even at high levels of activation. The porosity of the resulting carbons is dominated by 0.8–1.2 nm pores, which are suitable for methane uptake. The carbons have excess methane uptake, at 25 °C and 35 bar, up to 196 cm3 cm−3 and total uptake of up to 222 cm3 cm−3, which is better than any previously reported carbon, and comparable to the best metal–organic framework but at a much lower cost. Our findings provide new insights on the targeted, predictable and controlled activation of carbonaceous matter, and also offer a new pathway for addressing the challenge of developing porous materials with optimised balance between gravimetric and volumetric surface areas suitable for the on-board storage of methane gas.Conflicts of interest
There are no conflicts to declare.Acknowledgements
We thank the government of the Kingdom of Saudi Arabia for funding a PhD studentship for Afnan Altwala. RM thanks the Royal Society for a Research Grant, and for a Royal Society Wolfson Research Merit Award.References
- M. S. Dresselhaus and I. L. Thomas, Nature, 2001, 414, 332 CrossRef CAS PubMed.
- S. Choi, J. H. Drese and C. W. Jones, ChemSusChem, 2009, 2, 796 CrossRef CAS PubMed.
- U. Eberle, B. Müller and R. von Helmot, Energy Environ. Sci., 2012, 5, 8780 RSC.
- I. Angelidaki, L. Treu, P. Tsapekos, G. Luo, S. Campanaro, H. Wenzel and P. Kougias, Biotechnol. Adv., 2018, 36, 452 CrossRef CAS PubMed.
- K. V. Kumar, K. Preuss, M. M. Titirici and F. Rodriguez-Reinoso, Chem. Rev., 2017, 117, 1796 CrossRef CAS PubMed.
- T. A. Makal, J. R. Li, W. Lu and H. C. Zhou, Chem. Soc. Rev., 2012, 41, 7761 RSC.
- Y. He, W. Zhou, G. Qian and B. Chen, Chem. Soc. Rev., 2014, 43, 5657 RSC.
- J. A. Mason, M. Veenstra and J. R. Long, Chem. Sci., 2014, 5, 32 RSC.
- B. Li, H.-M. Wen, W. Zhou, J. Q. Xu and B. Chen, Chem, 2016, 1, 557 CAS.
- D. Lozano-Castello, J. Alcaniz-Monge, M. A. de la Casa-Lillo, D. Cazorla-Amoros and A. Linares-Solano, Fuel, 2002, 81, 1777 CrossRef CAS.
- J. Romanos, S. Sweany, T. Rash, L. Firlej, B. Kuchta, J. C. Idrobo and P. Pfeifer, Adsorpt. Sci. Technol., 2014, 32, 681–691 CrossRef CAS.
- P. Pfeifer, L. Aston, M. Banks, S. Barker, J. Burress, S. Carter, J. Coleman, S. Crockett, C. Faulhaber, J. Flavin, M. Gordon, L. Hardcastle, Z. Kallenborn, M. Kemiki, C. Lapilli, J. Pobst, R. Schott, P. Shah, S. Spellerberg, G. Suppes, D. Taylor, A. Tekeei, C. Wexler, M. Wood, P. Buckley, T. Breier, J. Downing, S. Eastman, P. Freeze, S. Graham, S. Grinter, A. Howard, J. Martinez, D. Radke, T. Vassalli and J. Ilavsky, Chaos, 2007, 17, 041108 CrossRef CAS PubMed.
- C. M. Simon, J. Kim, D. A. Gomez-Gualdron, J. S. Camp, Y. G. Chung, R. L. Martin, R. Mercado, M. W. Deem, D. Gunter, M. Haranczyk, D. S. Sholl, R. Q. Snurr and B. Smit, Energy Environ. Sci., 2015, 8, 1190 RSC.
- D. A. Gómez-Gualdrón, C. E. Wilmer, O. K. Farha, J. T. Hupp and R. Q. Snurr, J. Phys. Chem. C, 2014, 118, 6941 CrossRef.
- R. E. Morris and P. S. Wheatley, Angew. Chem., Int. Ed., 2008, 47, 4966 CrossRef CAS PubMed.
- M. Namvar-Asl, M. Soltanieh and A. Rashidi, Energy Convers. Manage., 2008, 49, 2478 CrossRef CAS.
- M. Feroldi, A. C. Neves, C. E. Borba and H. J. Alves, J. Cleaner Prod., 2018, 172, 921 CrossRef CAS.
- J. C. Wang and S. Kaskel, J. Mater. Chem., 2012, 22, 23710 RSC.
- M. Sevilla and R. Mokaya, Energy Environ. Sci., 2014, 7, 1250 RSC.
- Y. D. Xia, Z. X. Yang and Y. Q. Zhu, J. Mater. Chem. A, 2013, 1, 936 Search PubMed.
- M. Sevilla, A. B. Fuertes and R. Mokaya, Energy Environ. Sci., 2011, 3, 1400 RSC.
- L. Wei and G. Yushin, Nano Energy, 2012, 1, 552 CrossRef CAS.
- T. S. Blankenship, N. Balahmar and R. Mokaya, Nat. Commun., 2017, 8, 1545, DOI:10.1038/s41467-017-01633-x.
- J. P. Marco-Lozar, M. Kunowsky, F. Suarez-Garcia, J. D. Carruthers and A. Linares-Solano, Energy Environ. Sci., 2012, 5, 9833 RSC.
- B. Adeniran and R. Mokaya, Nano Energy, 2015, 16, 173 CrossRef CAS.
- M. Sevilla and A. B. Fuertes, Energy Environ. Sci., 2011, 4, 1765 RSC.
- N. Balahmar, A. C. Mitchell and R. Mokaya, Adv. Energy Mater., 2015, 5, 1500867 CrossRef.
- M. Sevilla, W. Sangchoom, N. Balahmar, A. B. Fuertes and R. Mokaya, ACS Sustainable Chem. Eng., 2016, 4, 4710 CrossRef CAS.
- J.-S. M. Lee, M. E. Briggs, T. Hasell and A. I. Cooper, Adv. Mater., 2016, 28, 9804 CrossRef CAS PubMed.
- T. S. Blankenship and R. Mokaya, Energy Environ. Sci., 2017, 10, 2552 RSC.
- M. Cox and R. Mokaya, Sustainable Energy Fuels, 2017, 1, 1414 RSC.
- Y. W. Zhu, S. Murali, M. D. Stoller, K. J. Ganesh, W. W. Cai, P. J. Ferreira, A. Pirkle, R. M. Wallace, K. A. Cychosz, M. Thommes, D. Su, E. A. Stach and R. S. Ruoff, Science, 2011, 332, 1537 CrossRef CAS PubMed.
- M. Sevilla, R. Mokaya and A. B. Fuertes, Energy Environ. Sci., 2011, 4, 2930 RSC.
- M. Sevilla, P. Valle-Vigon and A. B. Fuertes, Adv. Funct. Mater., 2011, 21, 2781 CrossRef CAS.
- B. Adeniran and R. Mokaya, Chem. Mater., 2016, 28, 994 CrossRef CAS.
- M. M. Titirici and M. Antonietti, Chem. Soc. Rev., 2010, 39, 103 RSC.
- M. Paneque, J. M. De la Rosa, J. Kern, M. T. Reza and H. Knicker, J. Anal. Appl. Pyrolysis, 2017, 128, 314 CrossRef CAS.
- M. M. Titirici, R. J. White, C. Falco and M. Sevilla, Energy Environ. Sci., 2012, 5, 6796 RSC.
- S. Hameed, A. Sharma, V. Pareek, H. Wu and Y. Yu, Biomass Bioenergy, 2019, 123, 104 CrossRef CAS.
- C. R. Lohri, H. M. Rajabu, D. J. Sweeney and C. Zurbrügg, Renewable Sustainable Energy Rev., 2016, 59, 1514 CrossRef CAS.
- E. Haffner-Staton, N. Balahmar and R. Mokaya, J. Mater. Chem. A, 2016, 4, 13324 RSC.
- N. Balahmar, A. S. Al-Jumialy and R. Mokaya, J. Mater. Chem. A, 2017, 5, 12330 RSC.
- E. A. Hirst, A. Taylor and R. Mokaya, J. Mater. Chem. A, 2018, 6, 12393 RSC.
- N. Balahmar and R. Mokaya, J. Mater. Chem. A, 2019, 7, 17466 RSC.
- K. S. W. Sing, D. H. Everett, R. A. W. Haul, L. Moscou, R. A. Pierotti, J. Rouquerol and T. Siemieniewska, Pure Appl. Chem., 1985, 57, 603 CAS.
- T. Tian, Z. Zeng, D. Vulpe1, M. E. Casco, G. Divitini, P. A. Midgley, J. Silvestre-Albero, J.-C. Tan, P. Z. Moghadam and D. Fairen-Jimenez, Nat. Mater., 2018, 17, 174 CrossRef CAS PubMed.
- W. Sangchoom and R. Mokaya, ACS Sustainable Chem. Eng., 2015, 3, 1658 CrossRef CAS.
- H. M. Coromina, D. A. Walsh and R. Mokaya, J. Mater. Chem. A, 2016, 4, 280 RSC.
- B. Adeniran and R. Mokaya, J. Mater. Chem. A, 2015, 3, 5148 RSC.
- H. Yang, R. Yan, H. Chen, C. Zheng, D. H. Lee and D. T. Liang, Energy Fuels, 2006, 20, 388 CrossRef CAS.
- M. J. Antal, S. G. Allen, X. Dai, B. Shimizu, M. S. Tam and M. Gronli, Ind. Eng. Chem. Res., 2000, 39, 4024 CrossRef CAS.
- M. Bbebu and C. Vasile, Cellul. Chem. Technol., 2010, 44, 353 Search PubMed.
- R. K. Sharma, J. B. Wooten, V. L. Baliga, X. Lin, W. G. Chan and M. R. Hajaligol, Fuel, 2004, 83, 1469 CrossRef CAS.
- M. J. Antal, E. Croiset, X. Dai, C. DeAlmeida, W. S.-L. Mok, N. Norberg, J.-R. Richard and M. Al Majthoub, Energy Fuels, 1996, 10, 652 CrossRef CAS.
- W. M. A. W. Daud and W. S. W. Ali, Bioresour. Technol., 2004, 93, 63 CrossRef CAS PubMed.
- Z. Fang, T. Sato, R. L. Smith Jr, H. Inomata, K. Arai and J. A. Kozinski, Bioresour. Technol., 2008, 99, 3424 CrossRef CAS PubMed.
- M. E. Casco, M. Martínez-Escandell, E. Gadea-Ramos, K. Kaneko, J. Silvestre-Albero and F. Rodríguez-Reinoso, Chem. Mater., 2015, 27, 959 CrossRef CAS.
- M. E. Casco, M. Martínez-Escandell, K. Kaneko, J. Silvestre-Albero and F. Rodríguez-Reinoso, Carbon, 2015, 93, 11 CrossRef CAS.
- S. Choi, M. A. Alkhabbaz, Y. Wang, R. M. Othman and M. Choi, Carbon, 2019, 141, 143 CrossRef CAS.
- P. N. Quirant, C. Cuadrado-Collados, A. J. Romero-Anaya, J. S. Albero and M. M. Escandell, Ind. Eng. Chem. Res., 2020, 59, 5775 CrossRef.
- S. Ma, D. Sun, J. M. Simmons, C. D. Collier, D. Yuan and H.-C. Zhou, J. Am. Chem. Soc., 2008, 130, 1012 CrossRef CAS PubMed.
- Y. Peng, V. Krungleviciute, I. Eryazici, J. T. Hupp, O. K. Farha and T. Yildirim, J. Am. Chem. Soc., 2013, 135, 11887 CrossRef CAS PubMed.
- P. Chowdhury, S. Mekala, F. Dreisbach and S. Gumma, Microporous Mesoporous Mater., 2012, 152, 246 CrossRef CAS.
- A. D. Wiersum, J.-S. Chang, C. Serre and P. L. Llewellyn, Langmuir, 2013, 29, 3301 CrossRef CAS PubMed.
- D. DeSantis, J. A. Mason, B. D. James, Ca. Houchins, J. R. Long and M. Veenstra, Energy Fuels, 2017, 31, 2024 CrossRef CAS.
- Z. Chen, P. Li, R. Anderson, X. Wang, X. Zhang, L. Robison, L. R. Redfern, S. Moribe, T. Islamoglu, D. A. Gómez-Gualdrón, T. Yildirim, J. F. Stoddart and O. K. Farha, Science, 2020, 368, 297 CrossRef CAS PubMed.
Footnote |
| † Electronic supplementary information (ESI) available: Seven tables and ten figures. See DOI: 10.1039/d0ee01340d |
| This journal is © The Royal Society of Chemistry 2020 |