
 Open Access Article
 This Open Access Article is licensed under a Creative Commons Attribution-Non Commercial 3.0 Unported Licence
Techno-economic viability of islanded green ammonia as a carbon-free energy vector and as a substitute for conventional production†
Richard Michael
Nayak-Luke
 and
René
Bañares-Alcántara
*
and
René
Bañares-Alcántara
*
University of Oxford, Department of Engineering Science, Parks Road, Oxford, OX1 3PJ, UK. E-mail: rene.banares@eng.ox.ac.uk
First published on 13th July 2020
Abstract
Decarbonising ammonia production is an environmental imperative given that it independently accounts for 1.8% of global carbon dioxide emissions and supports the feeding of over 48% of the global population. The recent decline of production costs and its potential as an energy vector warrant investigation of whether green ammonia production is commercially competitive. Considering 534 locations in 70 countries and designing and operating the islanded production process to minimise the levelised cost of ammonia (LCOA) at each, we show the range of achievable LCOA, the cost of process flexibility, the components of LCOA, and therein the scope of LCOA reduction achievable at present and in 2030. These results are benchmarked against ammonia spot prices, cost per GJ of refined fuels and the LCOE of alternative energy storage methods. Currently a LCOA of $473 t−1 is achievable, at the best locations the required process flexibility increases the achievable LCOA by 56%; the electrolyser CAPEX and operation are the most significant costs. By 2030, $310 t−1 is predicted to be achievable with multiple locations below $350 t−1. At $25.4 GJ−1 currently and $16.6 GJ−1 by 2030 prior combustion, this compares favourably against other refined fuels such as kerosene ($8.7–18.3 GJ−1) that do not have the benefit of being carbon-free.
Broader context‘Green’ ammonia is produced from a carbon-free route using hydrogen from water electrolysis powered by renewable sources (wind and solar), however, its production process has not been able to compete economically with fossil fuel-based technology until recently. The work identifies the range of achievable LCOA (levelized cost of green ammonia), the cost of process flexibility, the components of LCOA, and how they are likely to change by 2030. The analysis considered 534 locations in 70 countries and optimised the mix of renewable power sources (wind and solar), the green ammonia production plant design and its operation to minimise the LCOA. It also considered country-specific financing risks for those locations with significant renewable energy potential but financial barriers to implementation. Currently a LCOA of 473 USD t−1 is achievable and multiple locations are predicted to achieve LCOAs below 350 USD t−1 by 2030, with the electrolyser CAPEX and OPEX as its most significant cost components. In conclusion, this manuscript shows that green ammonia has the potential to become economically competitive with that produced using conventional methods in several locations by 2030. |
Introduction
Ammonia currently supports, as the primary component of the nitrogen-based fertiliser industry, the feeding of over 48% of the world's population.2,3 Its current dependence on fossil fuels for hydrogen feedstock means that it accounts for 1.8% of global fossil fuel consumption.4 The carbon-intensity of the 180Mt p.a. production combined with our current reliance and predicted growth (1.9% annual growth in demand from 2006 to 20185) means that decarbonising this process is an environmental imperative. In addition to this ammonia is also a promising energy carrier,6 due to its favourable chemical7 and technical characteristics, for use in large scale renewable energy (RE) storage8–11 and “zero-emission” shipping.12Substitution of the current hydrogen feedstock, predominantly from steam reforming (SMR) of natural gas or coal gasification, with electrolysis of water, electrochemical reduction or photocatalytic reduction using renewable energy, would eliminate GHG emissions. Each of these alternative methods however, has its own difficulties. Incorporating electrolysis of water using renewable energy with conventional Haber–Bosch synthesis (HB) requires additional flexibility incorporated in plant design (ramping of the HB13 and a “hydrogen buffer”13,14) and optimising power allocation. Electrocatalytic and photocatalytic production, while theoretically having a greater potential, currently have production rates orders of magnitude smaller than required for scale up.15,16 Biomass was not considered as a feedstock due to the scale of production considered and the dependability of supply. Therefore, due to its technology readiness level and potential implementation in the short-term, this paper only has considered the electrolysis of water pathway.
Previous investigations (compared in detail in ESI,† Note 10) while all commonly considering the electrolytic production of hydrogen and synthesis by the HB method, used varying assumptions and their comparison should therefore be made with caution. As shown, the studies vary considerably in the location that they considered, the RE sources used and the availability to grid connection. As for the results, the achievable LCOA and electrolyser size vary considerably, while the relative sizing of the HB and air separation unit (ASU) components are widely not considered, and plant flexibility is commonly managed by grid connection or an alternative power source.
In this research we further develop the techno-economic model, initially outlined in ref. 13, to enable identification of the optimal plant design, operation and renewable power combination to minimise the achievable LCOA for the islanded production of ammonia using water and air as feedstock. This functionality is then used to calculate and compare the achievable LCOA, optimal plant design and operation for 534 locations in 70 countries for both domestic and multi-national corporations in a present-day and 2030 scenario. Thereby showing the achievable range of LCOA and how this will develop to 2030, it is possible to identify locations of significant potential but domestic financing barriers (i.e. discount rates), the cost of process flexibility required (due to RE) relative to an idealised power source, the components of LCOA, the scope for LCOA reduction and the achievable LCOE. This analysis is therefore a conceptual design investigation to identify the cost of production and therefore enable the compilation of a short-list of locations that warrant further investigation. These results show that the combination of renewable sources, plant design and operation are highly specific to location. In the 2019 scenario, production at the best location considered by a multinational corporation (Cape Grim, Australia, with an LCOA of $473 t−1), despite being within the 2010–2019 range of spot prices, is not competitive, and the majority of locations result in greater than (USD) $600 t−1. However, by 2030 the LCOA achievable at the best location is predicted to fall to $310 t−1, with a large number of locations below $350 t−1. These LCOA will likely be highly competitive against conventional production, particularly if a carbon tax was implemented: setting a tax of $50 t−1 CO2, production using SMR, Coal and Fuel Oil would have to achieve LCOA of $230 t−1, $160 t−1 and $120 t−1 respectively by 2030 to still be cost competitive against the best decarbonised islanded production estimate. The intermittency of the renewable power relative to an ideal constant power profile at the most favourable locations currently increases the achievable LCOA by 56% and in 2030 by 76%, mainly due to the two methods of process flexibility: a hydrogen buffer, and additional power curtailment. The combination of this cost of flexibility analysis and attribution of the LCOA to its constituent components has enabled us to identify the significant components of cost and therefore to comment on the potential scope of cost reduction.
Methodology
The research considers an islanded production plant, only using renewable power sources (wind and solar photovoltaic), that synthesises ammonia using the Haber–Bosch process fed by hydrogen from water electrolysis and nitrogen from cryogenic air separation (eqn (1)). Unlike conventional production, this ‘green’ production process must manage the intermittency of renewable power. This is achieved by incorporating a hydrogen buffer (i.e. oversizing the electrolyser and storing the excess hydrogen produced), allowing for curtailment of excess power and decreasing the amount of ammonia synthesised through flexible allocation of the available power. The economic cost and the energy required for the compression of the hydrogen feedstock from the outlet of the electrolyser to that required in the reactor, as well as the compression of the recycle loop are considered within the HB. Excess hydrogen production is stored at high pressure in bullet vessels to provide a feedstock buffer as well as hydrogen that can be cannibalised for electrical power (using the fuel cell) when required. | (1) |
To determine the lowest achievable LCOA for a specified location the model, building on the brute-force approach described in ref. 13, when provided with the required inputs (including RE power profile, ESI,† Notes 1–3) uses a genetic algorithm to optimise three independent system design variables: the rated power of the electrolyser, the combined rated power of the HB and ASU, and the fraction of energy supplied by wind (the rest comes from solar PV).
For each chromosome considered, the model, assuming that the renewable power and the production plant is in steady state operation and has perfect foresight, allocates the available power for each segment of time (dictated by the resolution of the RE data provided) to either the electrolyser (PElec), hydrogen storage (PH2), the HB and ASU (PHB/ASU, lumped for the purpose of allocation) or to curtailment (PCurtail). Assuming that the electrolyser, the HB and ASU are able to ramp instantaneously, the production process has four modes of operation:
(1) Curtailment of excess power and storage of excess hydrogen
(2) Storage of excess hydrogen
(3) Withdrawing hydrogen from storage for feedstock only
(4) Withdrawing hydrogen from storage for feedstock and energy to run the HB and ASU processes
To determine the optimal operation schedule for the plant, first the period with the lowest 20 day power within a calendar year is identified and the plant and renewable power sources are defined as off and scheduled for maintenance. This enables the model to then check whether there are viable operation schedules for the process components (i.e. electrolyser, HB and ASU) for the chromosome under consideration. If this is successful the model allocates the available excess power, using a brute force approach, to determine the operation schedule that minimises the hydrogen storage requirement while maximising the total mass of ammonia produced (see ESI,† Note 4).
Having checked energy and mass continuity and scheduling, the production process and its operation are costed and the total mass of ammonia produced calculated. Using a discounted cash flow and the ammonia mass produced, the LCOA is then calculated. The model subsequently considers another 99 chromosomes, every generation converging on an optimal solution.
While building on prior work presented in ref. 13 and retaining the specified average supply of 100 MW from renewable sources and not taking economies of scale into account when costing, this paper incorporates notable developments to the method, technical constraints and economic considerations/assumptions. The method for finding the optimal design of the ammonia plant and the mix of renewable power sources has changed from a brute-force approach to use of a genetic algorithm (outlined in ESI,† Note 1). The allocation of power has also changed from a prescriptive function, whereby any specified amount of energy was always allocated in the same proportions to the components, to a brute force approach that re-allocates power in order to minimise the hydrogen storage size while maximising ammonia production.
Having selected a chromosome to consider, therein defining the mix of renewable power and rated power of the plant components, the start of the power allocation process is to set the HB's power to its minimum for every segment of time (as defined in ESI,† Note 4), the ASU's power to operate stoichiometrically, the electrolyser any remaining power without exceeding its rated power, and curtailing any remaining. At this point if there is not enough hydrogen to meet demand (for ammonia production and cannibalised for energy) then the chromosome considered is not viable. Otherwise, there is an unnecessary excess of hydrogen produced. The range of time over which power needs to be re-allocated is determined by first finding the t when the minimum cumulative net hydrogen production is, and after that t when the maximum is; power is re-allocated over this rage of segments. The five power re-allocation methods below are used to re-allocate power over the time range, until there is no power left to allocate:
(1) PCurtail and PH2 → PHB/ASU
(2) (PElec − PElec Stoic) and PH2 → PHB/ASU
(3) PElec → PHB/ASU
(4) (PElec − PElec Stoic) → PCurtail
(5) PElec → PCurtail
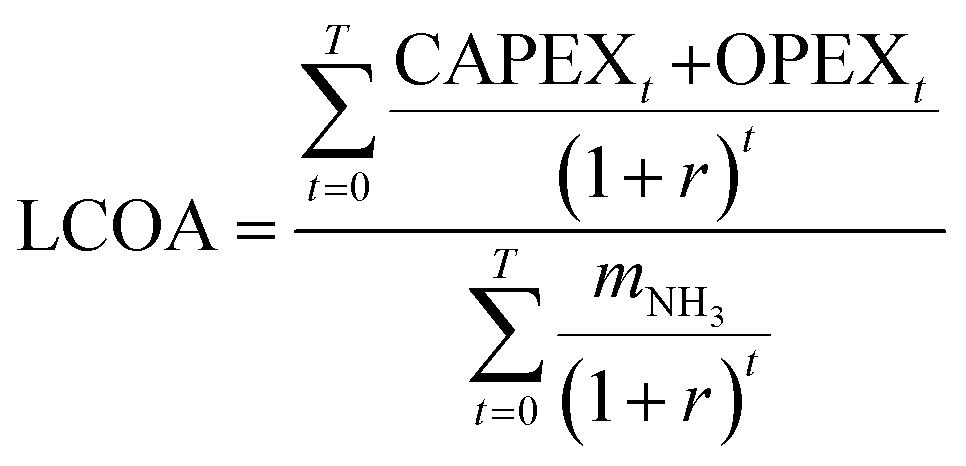
Using constant specific energy consumption (see ESI,† Note 3), these power vectors are translated to mass flow vectors. Having calculated the size of the hydrogen storage and the rated power of the hydrogen fuel cell the entire process is costed. First, to enable costing of the electricity curtailed and consumed by the production processes, the LCOE is calculated from location specific installed capital cost per unit power,17 the energy produced18 (ESI,† Note 2) and the relevant, depending on the corporation involved, discount factor (ESI,† Note 12).19 Combined with linear cost functions for capital expenditure (CAPEX) and the other costing assumptions (ESI,† Note 3), the capital and operating costs of every component are calculated for every year of operation. To calculate the LCOA, the time value of money is taken into account with respect to both the costs and the ammonia produced (eqn (2) where t is the year and r is the discount rate).
With the objective function of the genetic algorithm to minimise the achievable LCOA the model calculates the LCOA for each chromosome in that generation prior to populating the next generation of chromosomes to consider in order to converge on the optimal solution of process design for that location. In concluding this optimisation, the model also outputs dependent variables such as the levelised cost of electricity (LCOE), fraction of energy curtailed, the load factor of each process, hydrogen storage size (e.g. ESI,† Note 14), energy and mass flow profiles for each process.
 | (2) |
Calculations
To identify the impact of geographical location on the system design of islanded green ammonia production and the achievable LCOA, the model was used to consider 534 locations in 70 countries (Fig. 1) for two scenarios: present production and in 2030. With the majority of the production components being extremely mature, their costs have been held constant. However, this is not the case for the renewable power nor the electrolyser. Extrapolating from the exponential trend during the 2009–18 period, the equivalent of a −4.5% and −8.9% CAGR in the global LCOE minimum for wind and solar PV respectively, the achievable LCOE for each has been calculated for the 2030 scenario. Whereas, the electrolyser CAPEX is predicted to fall from $700 kW−1![[thin space (1/6-em)]](https://www.rsc.org/images/entities/char_2009.gif) 20–22 to $344 kW−1.22 The LCOE for the wind and solar resource has been calculated for each location considered using the installed CAPEX, calculated OPEX (ESI,† Note 3, Table 2) and the amount of energy produced over the installation's lifetime.
20–22 to $344 kW−1.22 The LCOE for the wind and solar resource has been calculated for each location considered using the installed CAPEX, calculated OPEX (ESI,† Note 3, Table 2) and the amount of energy produced over the installation's lifetime.
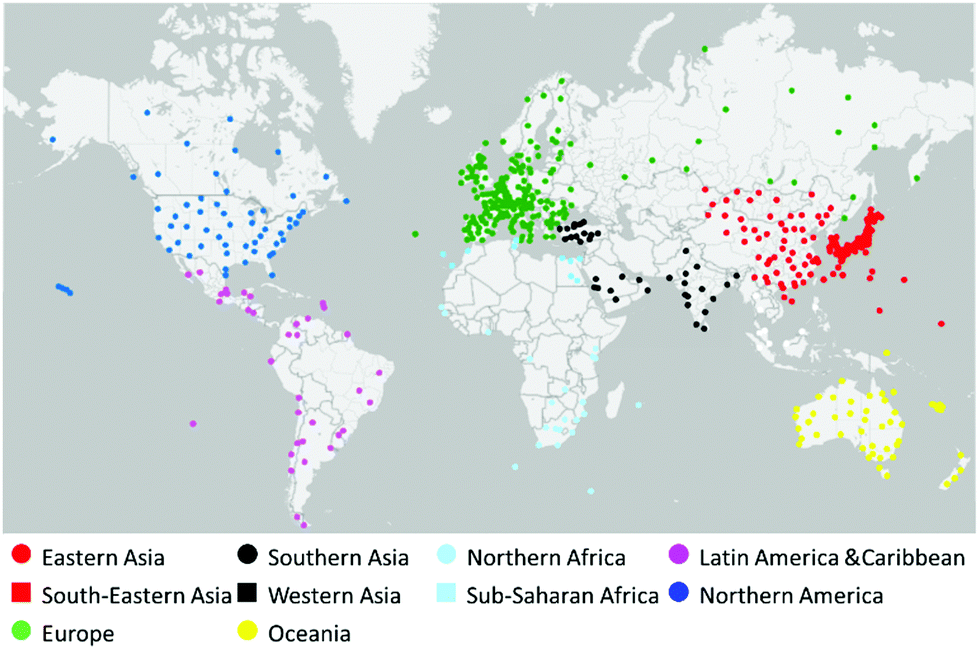 | ||
| Fig. 1 The 534 locations considered grouped by geographic region. | ||
In both scenarios, the cost of production is considered for both a domestic and a multinational company. For the domestic company, the discount factors used are country specific: the renewable electricity production using a discount factor for utilities and the components of the ammonia plant19 (ESI,† Note 12). To ensure that the discount factors were reliable the LCOE achieved for each location was cross-referenced against LCOE tender bids and industry estimates by country. For the multinational corporation the discount factors were set to the lowest currently obtainable from the national dataset: 3.33% for renewable electricity components and 7.14% for the ammonia plant.
In addition to the 2019 location dependent and independent cost estimates (ESI,† Notes 3 and 12) the model was provided with wind and solar power profiles for each location, calculated from a representative year of wind speed and global irradiance data with hourly resolution for each location18 (ESI,† Note 2).
Results
Current (2019 estimate) viability of islanded-production of ammonia from renewable power
As shown in Fig. 2a, the achievable LCOA for multi-national companies has a range from $473 t−1 to $2464 t−1 with a median of $962 t−1 and 12 locations below $600 t−1. The best location of each geographic region, while having notably different LCOA are all, barring South-Eastern and Western Asia, below the $720 t−1 maximum spot price. Whereas, for a domestic corporation (Fig. 2b) this increases to $487 t−1–$2984 t−1 with a median of $1057 t−1 and 5 locations below $600 t−1. Prediction of the optimal decision variables to minimise LCOA is highly location specific, but the optimal LCOA for the multi-national companies has a strong (2nd-order exponential) relationship with the supply capacity factor (with an R2 of 0.7132). When discount factor is set constant across all of the locations (i.e. multi-national corporation Fig. 2a), the most favourable locations are those that have excellent wind resource that results in a high electrolyser and HB capacity factor, and manage the required plant flexibility predominantly through a hydrogen buffer and not through curtailment. Of the other locations, only those with excellent solar resource and low installation cost (e.g. New Delhi, India with 1957 supply FLH and $661 kW−1 facilitating an LCOA of $638 t−1 or Dakar, Senegal with 2000 supply FLH and $805 kW−1 with an LCOA of $661 t−1) are able to compete with the inherently lower FLH achievable in a more solar dependent process. More specifically, these solar dependent locations are able to achieve these LCOA estimates, despite having a lower supply, electrolyser and HB load factors, by having to manage less seasonal power variation and using the low LCOE to be more dependent on curtailment (rather than on a hydrogen buffer) to provide the required process flexibility. Therefore, despite increasing the cost of curtailment and electrolyser CAPEX (due to the required oversizing), the electrolyser OPEX and hydrogen storage costs are reduced.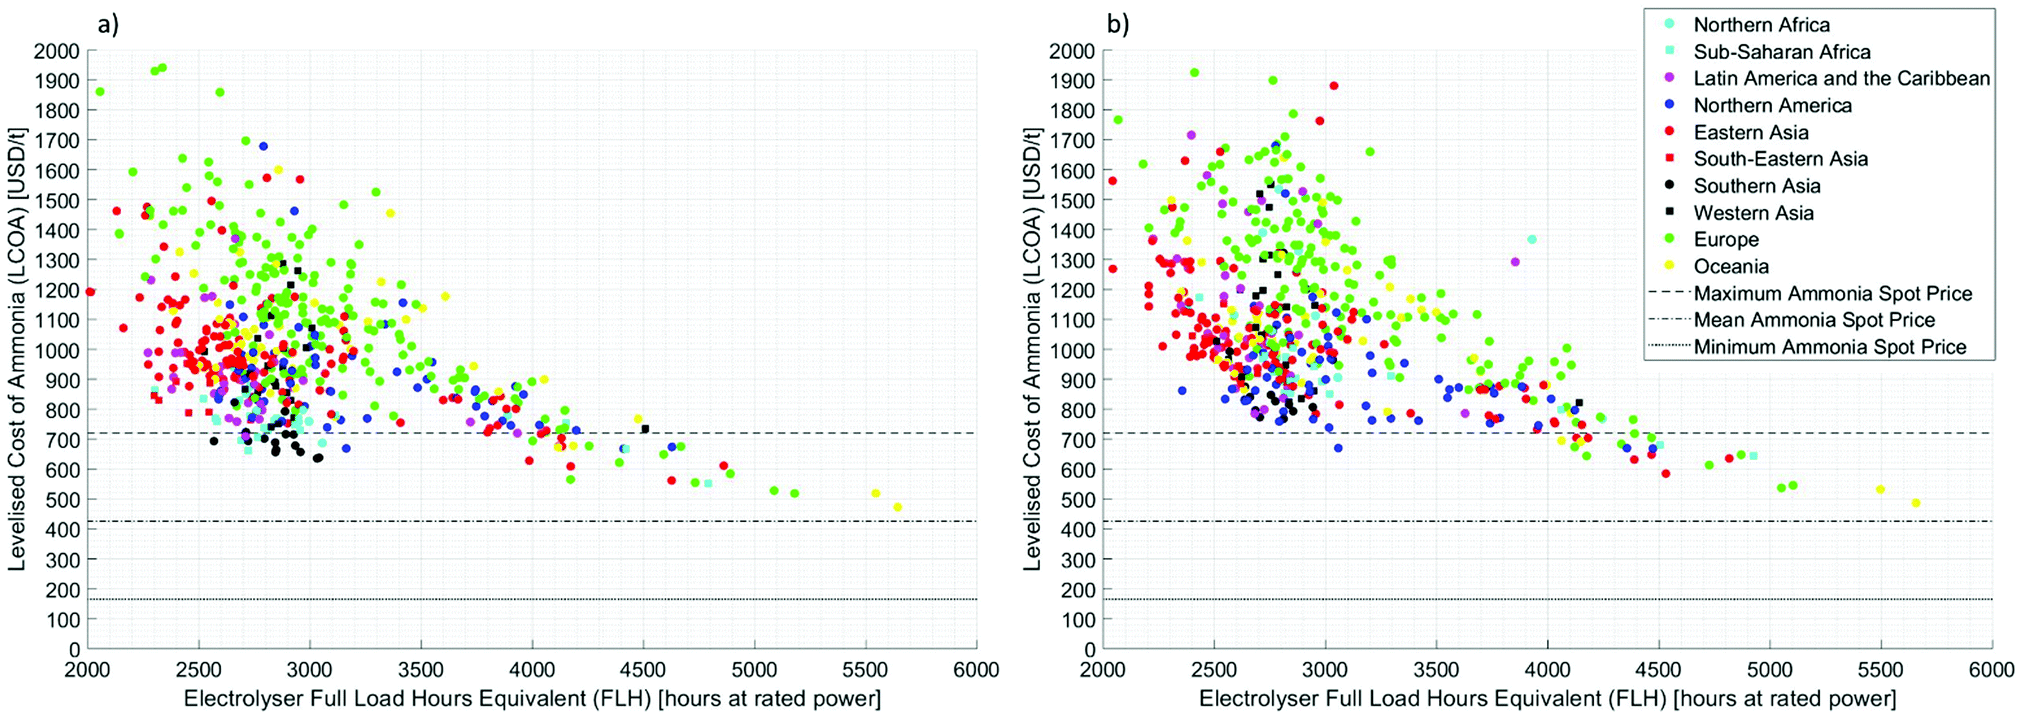 | ||
| Fig. 2 2019 Scenario – Range of the optimal achievable LCOA and the respective electrolyser full load hours equivalent (FLH) grouped by geographic region for a (a) multi-national and (b) domestic corporation. Benchmarked against the maximum, mean and minimum of 2000–2019 NOLA, Black Sea, Middle East, Western Europe and US Tampa ammonia spot prices (720, 426 and $165 t−1 respectively).1 Estimates above $2000 t−1 are not presented due to prioritisation of lower estimates. | ||
As expected due to its energy consumption per unit mass, significant CAPEX per kW rated power and an important method of process flexibility as part of the hydrogen buffer, the cost of hydrogen production, as shown in Fig. 3a, is the dominant cost in this process in 2019. Electrolyser CAPEX and OPEX accounting for between 58.2–71.4% of the total cost in the best 10 locations by region. Those locations are predominantly solar dependent and (as explained above) are responsible for the upper range of the proportion of total cost due to curtailment (0.1–13.0%) and the electrolyser rated power oversizing above the stoichiometric requirement (3–102%). While the selection of the RE employed, the design of the plant and its operation are highly specific to the location considered, some general conclusions can be drawn from the 2019 simulations. Locations with favourable wind resource commonly choose to, at least in part, use it (aside from the competitive LCOE) predominantly because it minimises the process flexibility requirements that, at extra cost, need to be designed for and operationally managed. The optimal plant design for solar dependent locations often has much larger electrolyser, HB and ASU rated power relative to the rated power of the supply.
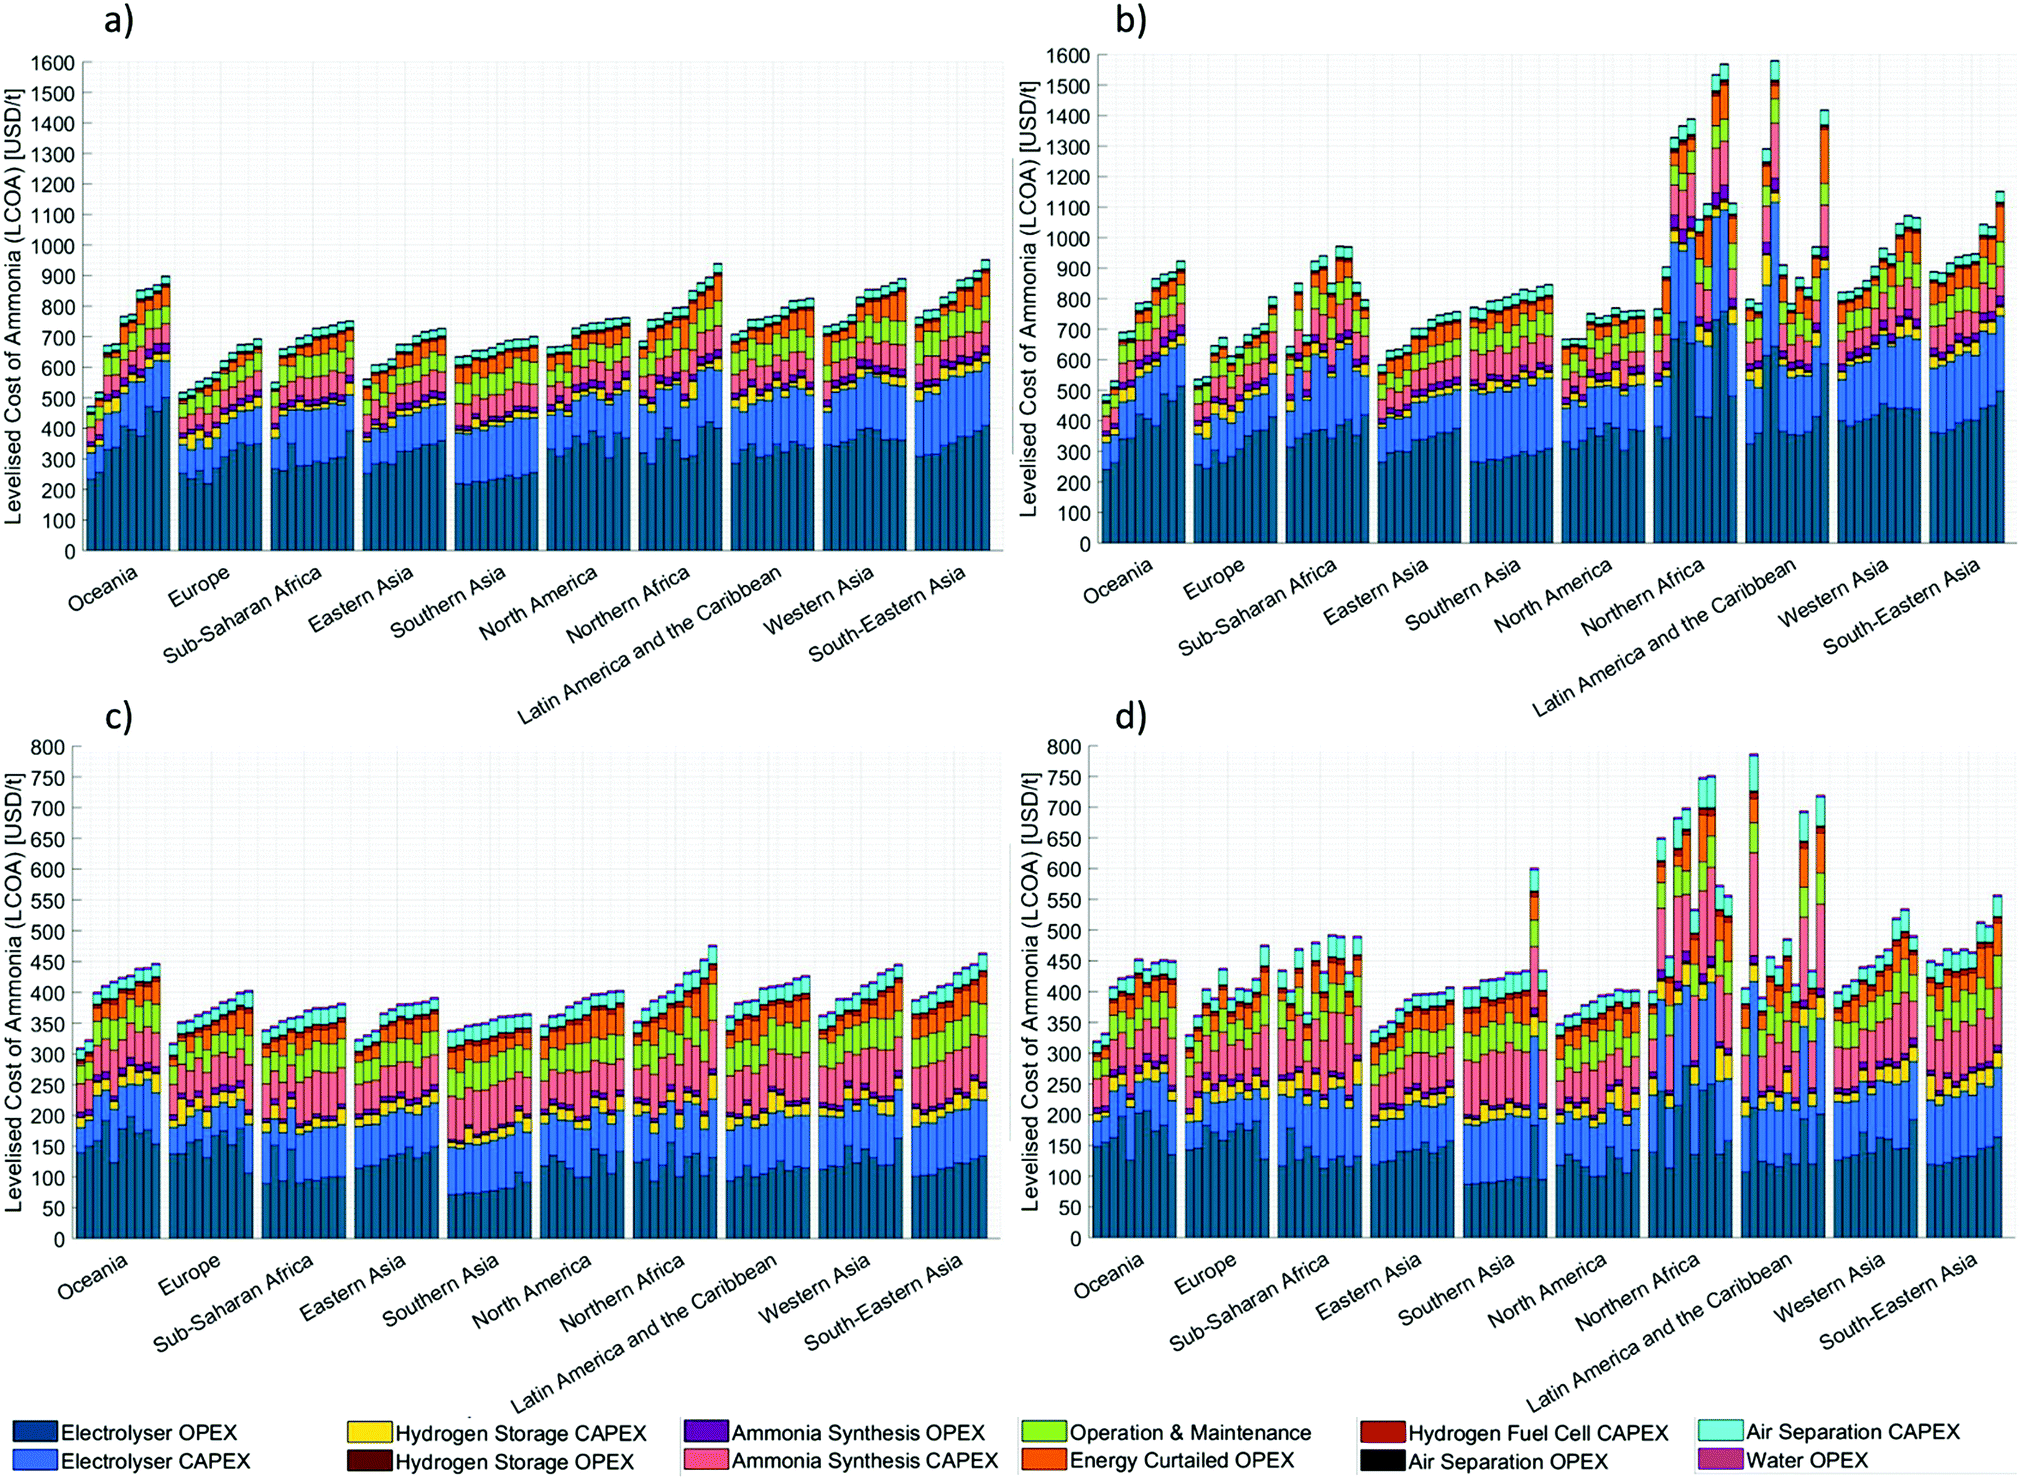 | ||
| Fig. 3 The components of the LCOA for the 10 locations with the lowest LCOA estimates by region: (a) 2019 scenario for multi-national corporation and (b) for domestic corporation; (c) 2030 scenario for multi-national corporation and (d) for domestic corporation. | ||
Currently the achievable LCOA, in agreement with the lowest estimates from literature,10 even at the best locations considered are greater than the mean 2000–2019 spot price. Even with the implementation of a $50 t−1 CO2 carbon tax, conventional production by SMR would only need to achieve an LCOA of $393 t−1 to be cheaper than the best location considered. This is readily achievable at many locations particularly given the impact that shale gas has had on LNG prices.
The change in the achievable LCOA shown in Fig. 2a and b due to the corporation involved on the project shows that financing is an additional barrier to implementation even for the most favourable locations, i.e. those dependent on excellent solar resources with 2500–3000 electrolyser FLH. Fig. 3a and b clearly identify other locations with the 10 lowest LCOA estimates by region facing a financing barrier despite their excellent RE resources. Furthermore, when not dominated by a single country (e.g. Japan in Eastern Asia, and India in South Asia) these Figures also show how the change in financing affects each location's relative viability.
While there is the expected strong correlation of the LCOA with the process’ achievable levelised cost of hydrogen (LCOH) and the HB load factor, there is variation due to the requirement of the process, in both design and operation, to be flexible in order to manage the intermittency of the RE profile. The quantification of this for both the average of the 10 lowest LCOA estimates by region and all 534 locations can be seen Fig. 4a and b. The comparison of the actual results for each location against the LCOA achievable with an ideal power profile (ESI,† Note 6) showed that even for the best locations the LCOA is 56% greater than the ideal (63% greater for all locations considered). The dominant components of this increase are largely expected: those required for a hydrogen buffer (i.e. electrolyser CAPEX due to oversizing) or curtailment of power. However, the electrolyser OPEX being greater (in spite of the smaller rated power, due to the electrolyser having an 100% load factor) and, particularly, a larger amount of ammonia produced in the ideal scenario are also significant.
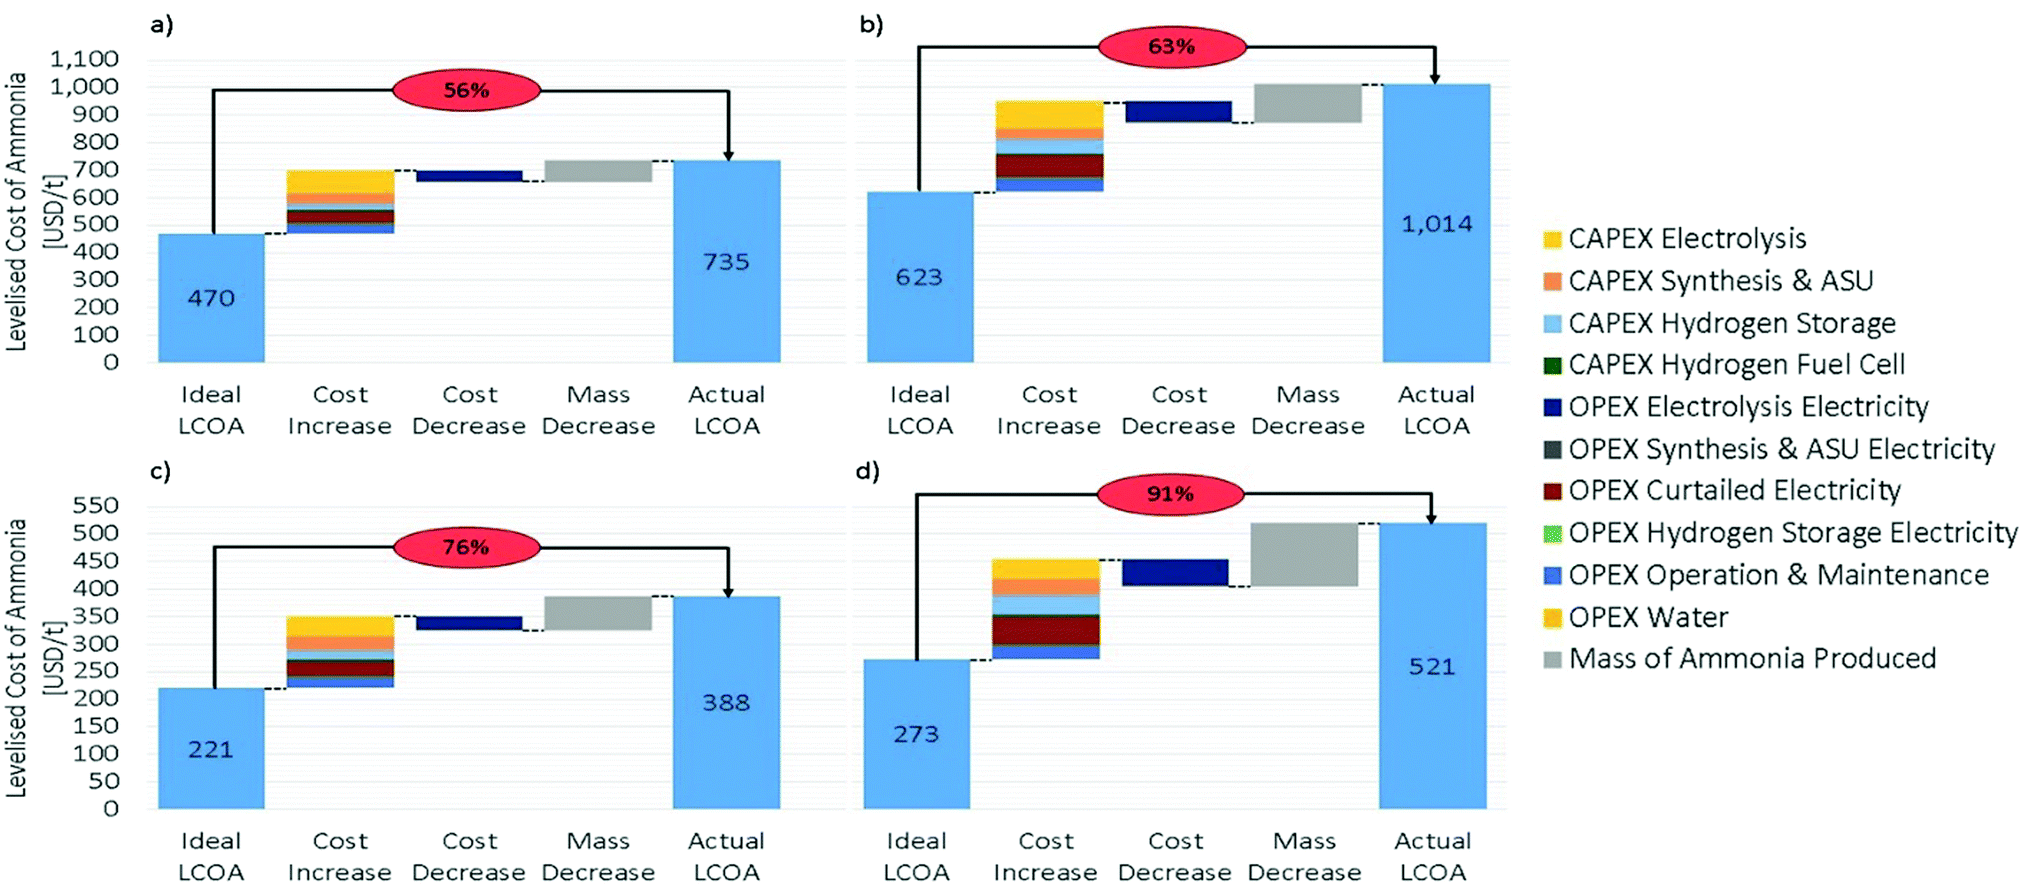 | ||
| Fig. 4 Cost of the required system flexibility for a Multi-national corporation: (a) mean of the lowest 10 LCOA estimates in the 2019 scenario, (b) mean of all the 534 locations in the 2019 scenario, (c) mean of the lowest 10 LCOA estimates in the 2030 scenario, (d) mean of all the 534 locations in the 2030 scenario. | ||
Using renewable power in its production and having very favourable technical and chemical characteristics, the green ammonia produced could be used for renewable energy storage. However, in the 2019 scenario even when using the LCOA at the best location the LCOE for this process would be $374 MW h−1. Even with its potential to store large amounts of energy seasonally, this is currently uncompetitive against gas peaker plants at $152–206 MW h−1.23
2030 viability of islanded-production of ammonia from renewable power
By 2030 the predicted decrease in the achievable LCOE for both solar PV and wind, combined with the reduction in electrolyser CAPEX per kW rated power can be seen to dramatically reduce the achievable LCOA of all locations. The LCOA for multi-national companies, as shown in Fig. 5a has a range from $310 t−1 to $1736 t−1 with a median of $457 t−1 and 36 locations below $350 t−1. The LCOA for the best location of each geographic region are below $364 t−1 significant when benchmarked against the $420 t−1 mean spot price for 2000–2019. For a domestic corporation (Fig. 5b) this increases to $298 t−1 to $1983 t−1 with a median of $502 t−1 and 11 locations below $350 t−1.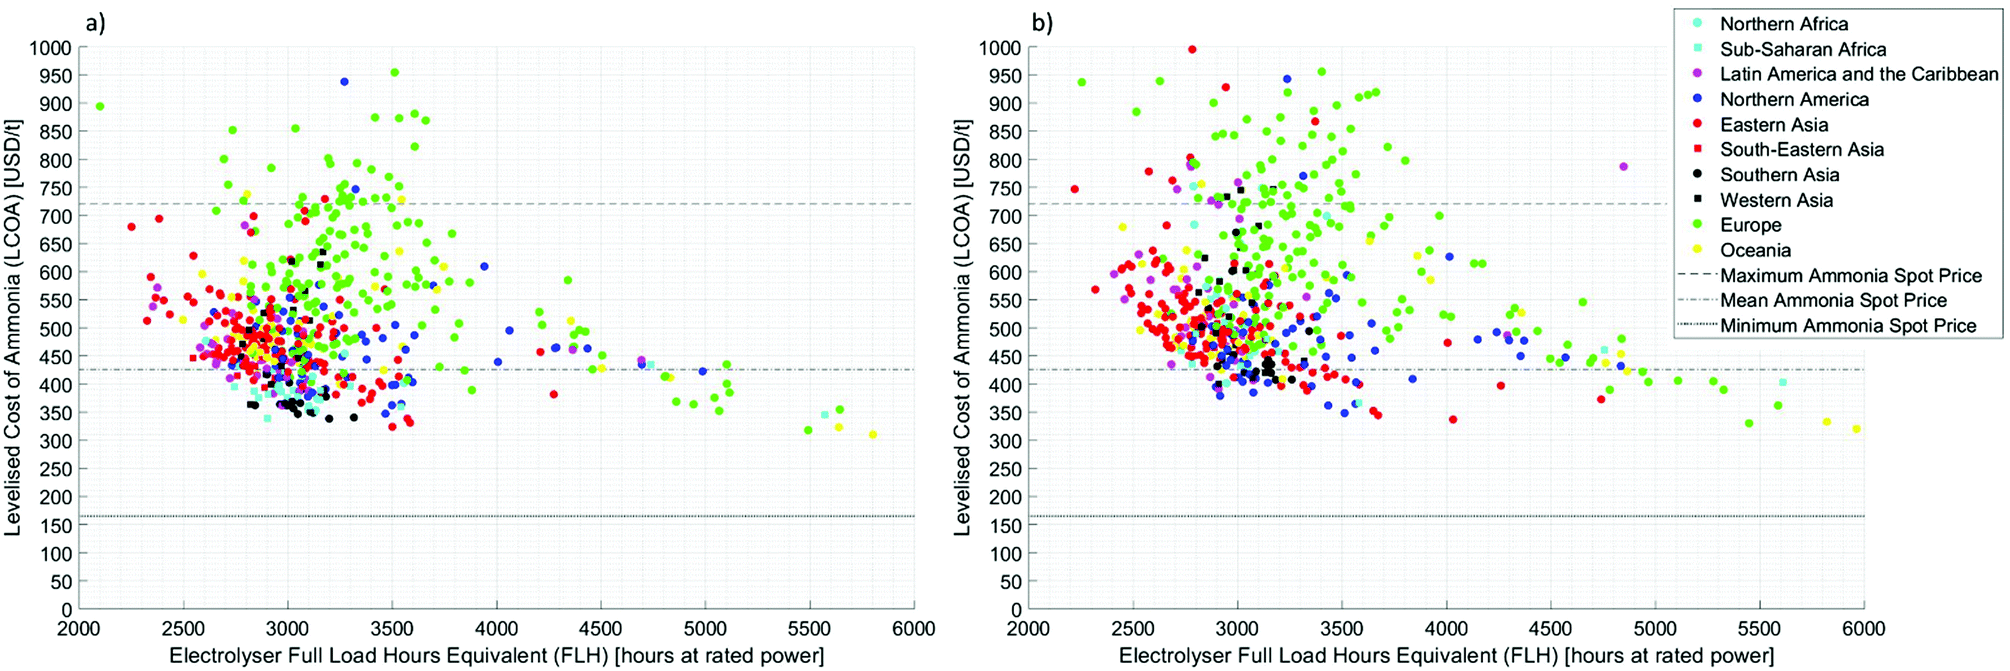 | ||
| Fig. 5 2030 Scenario – Range of the optimal achievable LCOA and the respective electrolyser full load hours equivalent (FLH) grouped by geographic region for a (a) multi-national and (b) domestic corporation. Estimates above 1000 $/t are not presented due to prioritisation of lower estimates. | ||
Comparison of Fig. 2a and b against Fig. 5a and b highlight that while all locations have an improved LCOA, solar dependent locations have largely “caught-up” with the wind dependent locations that were dominant in the 2019 scenario. Moreover those locations with good solar and wind resource have overwhelmingly increased their proportion of renewable power met by solar PV. This combined with both of the significant costs of plant flexibility (LCOE and electrolyser CAPEX) also decreasing has led to a compounding impact on the reduction of LCOA: the cost to both mitigate and manage the plant's flexibility requirements has reduced. This combination of factors has led to a considerable change in the optimal plant design for the majority of the best locations and the average percentage of energy curtailed for the best locations by region increasing from 11% to 17%.
While a small number of locations have changed in the lowest 10 LCOA estimates by region, the majority have remained, if not always in their original regional ranking. Comparing Fig. 3a and c, while the electrolyser CAPEX and OPEX are still a significant proportion of the overall cost, their importance has now decreased and accounts for between 44.3% and 64.7% of the total cost in the best 10 locations by region. The HB synthesis CAPEX, despite a reduction in its average rated power, is a greater proportion of the total cost because cost per unit rated power has not changed. Curtailment, despite being cheaper ($14 MW h−1 on average for the best locations in 2030 compared with $38 MW h−1 in 2019), is also a greater proportion of total cost due to its increased use for flexibility.
Benchmarking the achievable LCOA predicted by 2030 for islanded green ammonia against the 2000–2019 spot prices (or against the ISPT's LCOA estimate of $331 t−1–$386 t−1 for conventional production24) shows that this process has significant potential to compete with conventional production methods. The implementation of the previously considered $50 t−1 CO2 carbon tax in this scenario would mean that conventional production methods would have to achieve an LCOA of $220 t−1, $160 t−1 and $130 t−1 for SMR, coal and fuel oil (assuming 1.6, 3.0 and 3.6 t CO2 (t NH3)−1) respectively. This CO2 carbon tax analysis has been duplicated for the best location in each country with a $25 t−1, $50 t−1, and $75 t−1 in 2019 and 2030 (ESI,† Notes 24 and 25 respectively).
While not as clear in Fig. 5a and b, Fig. 3c and d show that even with the reduced costs, there is still a barrier to implementation due to financing at some of the most favourable locations. While the magnitude of the impact on the achievable LCOA due to different financing costs is smaller than in the 2019 scenario, its proportional impact has remained relatively constant.
Comparison with Fig. 4c and d show that even with lower LCOE and electrolyser CAPEX, estimation of the LCOA using an ideal power source when considering islanded production is erroneous. For the best locations the LCOA is 77% greater than the ideal (91% greater for all locations considered), an increase comparable with the 2019 analysis. While the dominant components of this increase are the same as those identified previously (those required for a hydrogen buffer and curtailment of power), their magnitude is different due to the changes in plant design and the favouring of power curtailment for flexibility.
The use of ammonia for energy storage produced in 2030 is much more promising. At the best location, the LCOE for this process will be $268 MW h−1. Still $62 MW h−1 greater than the most expensive gas peaker plants at the moment.23 To be cost competitive a carbon tax of at least $80.81 t−1 or increasing its use from once to over six times a month is required.25
Discussion
This analysis, its results and conclusions are relevant to all stakeholders, particularly academia, industry and policymakers, as they provide a better understanding of the economic viability of green ammonia production thereby informing future decisions.This analysis has shown that the green production of ammonia, even using an islanded production process, will be highly competitive with conventional production by 2030 in every geographical region considered. This, combined with our dependence on synthetic nitrogen fertiliser, predicted population growth and the current amount of CO2 emissions attributable to production makes electrolytic ammonia production an excellent commercial and environmental opportunity. What remains to be seen is if private and public stakeholders take actions to accelerate the timeline and seize the economic and societal benefits sooner rather than later. However, how can the competitiveness, scale-up and implementation of this process to replace conventional production be accelerated? For many locations, the reduction of LCOE and electrolyser CAPEX (as shown in the 2030 scenario) will be strong enough drivers by themselves and therefore any incentives to accelerate these reductions in cost are the priority. At other locations (even with comparable RE resources) there are financing barriers that need to be overcome, either by multi-national corporation involvement or by government incentives to reduce the cost of capital.
In some countries, limited affordable supply will also be a key driver. Of the ten largest ammonia importing countries in 2016,5 nine were considered (Taiwan being the exception). Of these, five are predicted to have a location able to produce ammonia with a LCOA at less than the mean 2000–2019 spot price ($426 t−1) by 2030, with South Korea (Mokpo) and Turkey (Silifke) only narrowly missing ($433 t−1 and $432 t−1 respectively). A good example of a country with significant demand and considerable potential for green production is India. Previously identified as a country with many favourable locations for green ammonia production (with a minimum of $338 t−1 at New Delhi and nine locations considered below $365 t−1 by 2030 facilitated by excellent solar resources) and one of the second largest market for nitrogen based fertiliser consumption.5 This demand (currently 17.4 Mt p.a., 81% of which is urea5) is met by: importing 16% and 23% of India's total ammonia and urea stock;5 importing natural gas feedstock to support indigenous production; and setting the maximum retail price of urea (currently at INR 5360 t−1/$74.49 t−1 resulting in INR 349.9 B/$4.87 B and INR 133.6 B/$1.86 B budgeted in 2018–2019 for indigenous production and imports respectively26). The improvement of security of supply by capitalising on the excellent solar resources using a green ammonia production process rather than focusing on coal gasification27,28 will not only be significantly more sustainable but also more economical (depending on date of implementation and coal subsidies).
Sub-Saharan countries predominantly have micronutrient deficiencies.29 In the case of nitrogen this is largely due to the price of synthetic fertilisers being prohibitively high. The average price of urea for example in December 2019 (whose cost in USD can be simplistically estimated as (LCOA × 0.58) + 9 + 2230), ranged from $359 t−1 in Nigeria to $575 t−1 in Malawi with the majority of countries (barring Nigeria and Ghana) being towards the upper end of this range. Kenya, Senegal and Zambia are good examples, with urea prices in December 2019 of $480 t−1, $516 t−1 and $543 t−1 respectively.31 While the 2019 and 2030 LCOA estimates for ammonia production ($480 t−1, $516 t−1 and $543 t−1 in 2019 and $480 t−1, $516 t−1 and $543 t−1 in 2030 respectively) compare favourably against these prices using the simplistic urea estimation, it should be noted that despite being lower than current prices this does not account for the fact that it is unclear what price is required before it is widely affordable.
Despite assuming perfect forecasting of the available power and constant specific energy consumption of all processes, the estimates of the achievable LCOA provided here are still likely to be conservative. There are four main reasons for this: the locations selected were chosen because of their reliable data and geographical spread rather than because those locations had the best renewable energy resources (e.g. only considering one location, Casablanca, in Morocco); this analysis does not take into account transmission of power (thereby enabling the utilisation of renewable resources nearby that have a more favourable power profile, such as geothermal generation); the secondary revenue streams from the sale of oxygen, argon (byproduct from the ASU), and excess hydrogen that could be produced were not considered; and the possibility of semi-islanded production that would not only mitigate the costs of flexibility (specifically electrolyser oversizing, hydrogen storage and curtailment) but also enable a greater HB load factor and thereby production of more ammonia. The combination of these factors, in spite of any additional cost for the grid power, would see the LCOA tend towards the “ideal” shown in Fig. 4. However, particular caution should be given to whether it is prudent and practical to consider semi-islanded production. For some locations connection to the regional/national grid is not a viable option and in others the grid is not dependable enough. If the supporting power network is highly fossil-fuel dependent, then this has the potential of eliminating the emissions benefits by becoming an inefficient method of ammonia production, i.e. if the process is highly dependent on the grid, and the grid in turn is dependent on CCGTs, the overall process would be an electrified but greater CO2 emitting version of SMR based production. Alternatively, if the power network has significant RE penetration with a similar capacity mix (i.e. wind/solar PV) installed in close proximity to the ammonia production process, then the power fluctuations may be very similar thereby limiting the benefits of a grid connection. When the ammonia process has excess power this will have to be curtailed rather than exported to the grid, and at low input power it would worth considering importing from the grid when electricity spot prices are at their lowest.
For islanded production alone, and excluding the previously mentioned methods of LCOA reduction such as transmission of power, Fig. 3 and 4 show that there will be a significant reduction of LCOA and can be used to indicate at least how far further LCOA reductions are viable depending on individual assumptions. While the key costs of electrolyser CAPEX and LCOE have the potential to drop even further than the values used in the 2030 scenario (due to even greater improvements technological efficiency and reductions in cost), others such as the HB CAPEX are unlikely to get much smaller due to the technology's maturity.
Conclusions
In calculating the optimal plant design, renewable power sources employed and the operation schedule to minimise the achievable LCOA for 534 locations in 70 countries for the islanded production of ammonia, we have six important results. The range of LCOA achievable currently and predicted for 2030 by country and geographic region; the components of LCOA; the impact of intermittency on the LCOA and plant design; locations where financing is a barrier to implementation; the scope for future cost reductions; and therein the cost of power-to-ammonia-to-power energy storage.Our findings show that while current islanded production of ammonia is not competitive with conventional (fossil fuel dependent) methods, by 2030 numerous locations, both solar and wind dependent, will be achieving a LCOA below $350 t−1. The best location considered will fall from $473 t−1 to $310 t−1, and compared against locations with favourable wind resources, solar dependent locations will be significantly more competitive in 2030 than currently.
As expected, the production of hydrogen (electrolyser CAPEX and OPEX), due to its high specific energy consumption and capital cost per unit power, is currently a significant component of the overall cost. However, previous analyses have not considered the compromise between the two methods of flexibility: a hydrogen buffer (on which the electrolyser CAPEX and OPEX are dependent) and curtailment of energy. The importance of electrolyser CAPEX and OPEX has thus been shown to be dependent both on the renewable mix employed, the best combination to achieve the process flexibility required and the scenario considered (present day or 2030).
Despite its importance, simplistic use of the electrolyser CAPEX and the achievable load factor (i.e. therein OPEX) to estimate the achievable LCOA for a given location while providing a rough solution, will be overly optimistic as it does not account for the cost of plant flexibility required. As shown by this research, if an LCOA is estimated by these methods an LCOA scaling factor (ESI,† Note 11) of at least 1.56 needs to be taken into account due to the cost of process flexibility required. This disparity between a simple estimation and an actually achievable LCOA has been shown to widen in future estimations.
Specific countries, particularly in Northern Africa, have been identified, despite their excellent potential to achieve low LCOA, to currently and in the future have financial barriers to implementation without the intervention of a multi-national or government assistance to reduce the financing costs.
As for the scope of future cost reductions, the key cost variables that have potential to continue to fall, the electrolyser CAPEX and LCOE, have been identified and their impact can be calculated.
Finally, with the currently achievable LCOA, ammonia's potential as an economically viable energy storage method is presently unfavourable even in the best locations ($374 MW h−1). However, by 2030 it is a much more favourable prospect at $268 MW h−1. Greater utilization, a carbon-tax or semi-islanded production would improves its competitiveness even further.
To improve on the accuracy of the model future work should relax the assumptions of perfect weather forecasting of available power and constant specific energy consumption of all processes. To enable additional accurate valuable insights to be gleaned, the technical and economic assumptions (ESI,† Note 3) should be updated regularly and more detailed weather data be secured (providing a more representative and more intermittent dataset than a representative year), both location and resolution of input data could be improved. Specific to the investigation, and importantly the viability at the location being considered, and the impact of semi-islanded production, sale of oxygen and excess hydrogen and power transmission on the optimal process design and LCOA will also provide valuable insights.
Despite these key findings there are still limitations to this analysis that can be pursued as further work. The work presented here does not consider the uncertainty of the RE sources. This would increase the plant's required flexibility and be highly specific to location and the RE sources employed. The operation & maintenance is considered here as a fraction of CAPEX per annum instead of being specific to location. When constructing a short-list of locations to investigate further, considerations such as water scarcity (while costed for in this analysis) could be significant (e.g. Jodhpur in India, despite having a predicted 2030 LCOA of $340 t−1 has significant water scarcity).
Data availability
The hourly wind and solar data used in this study, and summarised by country in ESI,† are from Meteonorm 7.3 under licence from Meteotest AG. All other data used in the study and the ESI,† have been referenced. Additional data is available from the corresponding author upon reasonable request.Author contributions
The authors jointly developed the research question, methodology, conducted the analysis and wrote the paper.Conflicts of interest
There are no conflicts to declare.Acknowledgements
The work presented here was supported financially by the Siemens-EPSRC iCASE Award, project 1658940. The use of MATLAB and its toolboxes was under an academic licence.Notes and references
- Bloomberg, Commodities, accessed 1st May, 2019, https://www.bloomberg.com/markets/commodities.
- J. W. Erisman, M. A. Sutton, J. Galloway, Z. Klimont and W. Winiwarter, Nat. Geosci., 2008, 1, 636–639 CrossRef CAS.
- H. Ritchie, How many people does synthetic fertilizer feed? 2017, accessed 9th May 2019, https://ourworldindata.org/how-many-people-does-synthetic-fertilizer-feed Search PubMed.
- C. Philibert, Renewables crossing boundaries: ammonia et al. in NH3 Event, Rotterdam, 2017 Search PubMed.
- Yara, Yara Fertilizer Industry Handbook, 2018 Search PubMed.
- W. Gao, J. Guo, P. Wang, Q. Wang, F. Chang, Q. Pei, W. Zhang, L. Liu and P. Chen, Nat. Energy, 2018, 3, 1067–1075, DOI:10.1038/s41560-018-0268-z.
- A. Klerke, C. H. Christensen, J. K. Norskov and T. Vegge, J. Mater. Chem., 2008, 18, 2304 RSC.
- J. Ikäheimo, J. Kiviluoma, R. Weiss and H. Holttinen, Int. J. Hydrogen Energy, 2018, 43, 17295–17308 CrossRef.
- S. Ould Amrouche, D. Rekioua, T. Rekioua and S. Bacha, Int. J. Hydrogen Energy, 2016, 41, 20914–20927 CrossRef CAS.
- M. Arriaga, C. A. Canizares and M. Kazerani, IEEE Transactions on Sustainable Energy, 2016, 7, 221–231 Search PubMed.
- R. Lan, J. T. S. Irvine and S. Tao, Int. J. Hydrogen Energy, 2012, 37, 1482–1494 CrossRef CAS.
- Lloyd's Register and UMAS, Fuel Production Cost Estimates and Assumptions, 71 Fenchurch Street, London, EC3M 4BS, 2019.
- R. Nayak-Luke, R. Bañares-Alcántara and I. Wilkinson, Ind. Eng. Chem. Res., 2018, 57, 14607–14616 CrossRef CAS.
- S. Beerbühl, B. Kolbe, C. Roosen and F. Schultmann, Chem. Ing. Tech., 2014, 86, 649–657 CrossRef.
- D. R. MacFarlane, P. V. Cherepanov, J. Choi, B. H. R. Suryanto, R. Y. Hodgetts, J. M. Bakker, F. M. Ferrero Vallana and A. N. Simonov, Joule, 2020, 4(6), 1186–1205, DOI:10.1016/j.joule.2020.04.004.
- C. Smith, A. K. Hill and L. Torrente-Murciano, Energy Environ. Sci., 2020, 13, 331–344 RSC.
- IRENA, Renewable Power Generation Costs in 2017, International Renewable Energy Agency, Abu Dhabi, 2017.
- Meteotest, Meteonorm, 2018, accessed 4th October 2019, http://www.meteonorm.com/en/.
- Finance3.1, WACC Expert, 2018, accessed 4th November 2018, http://www.waccexpert.com/.
- O. Schmidt, A. Gambhir, I. Staffell, A. Hawkes, J. Nelson and S. Few, Int. J. Hydrogen Energy, 2017, 42, 30470–30492 CrossRef CAS.
- A. Buttler and H. Spliethoff, Renewable Sustainable Energy Rev., 2018, 82, 2440–2454 CrossRef CAS.
- J. A. Løkke, Nel Group, accessed 4th December, 2018 https://www.fch.europa.eu/sites/default/files/S2.3-J.A.L%C3%B6kke,Nel.pdf.
- Lazard, Lazard's Levelised Cost of Energy Analysis – Version 12.0, 2018.
- ISPT, Power to Ammonia: Feasibility study for the value chains and business cases to produce CO2-free ammonia suitable for various market applications, Report TESI115001, Institute for Sustainable Process Technology (ISPT), 2017.
- US-DOE, Gas Turbines, accessed 20th October, 2019 http://www.energy.gov/sites/prod/files/2016/09/f33/CHP-Gas%20Turbine.pdf.
- A. Adsul, Demands for Grants (2018-19), Ministry of Chemicals and Fertilizers, Government of India, Lok Sabha Secretariat, New Delhi, 2018 Search PubMed.
- Government of India, Annual Report 2017-18, Ministry of Chemicals and Fertilizers, Government of India, 2017.
- Y. Sharma, Government keen to source coal gasification technology from US, The Economic Times, 2019 Search PubMed.
- J. H. van der Waals and M. C. Laker, in Micronutrient Deficiencies in Global Crop Production, ed. B. J. Alloway, Springer, Dordrecht, 2008, DOI:10.1007/978-1-4020-6860-7_8, pp. 201–224.
- Yara, Ammonia and Urea Cash Cost, accessed 26th May, 2020 https://www.yara.com/investor-relations/analyst-information/calculators/ammonia-and-urea-cash-cost/.
- AfricaFertilizer.org, National Fertilizer Prices, accessed 26th May, 2020 https://africafertilizer.org/national.
Footnote |
| † Electronic supplementary information (ESI) available: Additional details about the methodology, calculation and results. See DOI: 10.1039/d0ee01707h |
| This journal is © The Royal Society of Chemistry 2020 |