 Open Access Article
Copper-bottomed: electrochemically active bacteria exploit conductive sulphide networks for enhanced electrogeneity†
Laura
Beuth‡
,
Catharina Philine
Pfeiffer‡
and
Uwe
Schröder
 *
*
Institute of Environmental and Sustainable Chemistry, Technische Universität Braunschweig, Hagenring 30, 38106, Braunschweig, Germany. E-mail: uwe.schroeder@tu-bs.de; Tel: +49 5313918425
First published on 13th August 2020
Abstract
In this study, we demonstrate that anodic electroactive bacteria like Geobacter sulfurreducens generate copper(I) and copper(II) sulphides when grown on copper electrodes. The insoluble copper sulphides form a conductive network within the biofilms, strongly enhancing the biofilm electrogeneity – i.e., the ability of the biofilm to produce electric currents. Compared to biofilms grown on graphite, the average relative current density of copper-based biofilms was 237%, with a maximum geometric current density of 1.59 ± 0.23 mA cm−2. An additional electrochemical CuS deposition prior to biofilm cultivation further increased the bioelectrocatalytic current generation to 2 mA cm−2. The chemical deposition of CuS onto graphite allowed cultivating biofilms with current densities 134% higher than at unmodified graphite. This approach – the chemical CuS deposition onto inexpensive electrode materials – thus represents a promising pathway for the development of scalable, high-performance electrode materials for microbial electrochemical technologies.
Broader contextAn increase in the performance of biofilm electrodes is decisive for a future success of microbial fuel cells and related microbial electrochemical technologies. Although the development of 3D-electrode designs has already substantially increased the current production of biofilm electrodes, it is essential to understand and to overcome intrinsic limitations in electroactive biofilms to enhance their bioelectrochemical turnover rates. Here we demonstrate that, when grown on metallic copper, Geobacter dominated electroactive biofilms can form a matrix of highly conductive copper sulphides and exploit it for substantially enhanced current generation. The findings underline that the ohmic resistance represents a major bottleneck in electroactive biofilms that can be overcome by simple chemical electrode modifications. |
1. Introduction
Biocompatible and biocidal – in technical or biotechnological applications these antipodal material attributes are decisive for either allowing microbial life on a given surface or preventing it. Some metals like copper and its alloys have gained a distinct, general perception as efficient antimicrobial materials, a perception that goes back to antiquity.1 In naval history, the cladding of wooden ship hulls with copper sheets was the first efficient measure against biofouling in the marine environment,2 creating the basis of the idiomatic phrase “to be copper-bottomed”. Today, the metal's antimicrobial properties, which are based on the antimicrobial action of traces of copper ions on the metal surface,3 are being exploited in a wide range of applications in healthcare, food processing, biotechnology and many other areas.4,5The general perception of copper's antimicrobial properties has prevented its consideration for applications that require – instead of forbid – its colonization by bacteria, for example as electrode material for microbial fuel cells (MFCs) and related microbial electrochemical technologies (METs). In these systems, for their great biocompatibility, carbonaceous materials like graphite have been considered as the materials of choice – although their low specific conductivity may cause substantial electrical (ohmic) energy losses, thus reducing their applicability.
In a recent publication we reported the surprising finding that electrogenic (anodic electrochemically active) bacteria not only colonize copper electrodes readily, but also deliver current densities higher than biofilms grown on graphite or gold surfaces.6 Whereas the biocompatibility of copper for the growth of electrogenic bacteria could be explained by the low redox potential in the anaerobic environment, which prevents the liberation of free, antimicrobial copper ions, the reasons for the enhanced electrogeneity remained unsolved. By performing a comparative electrochemical and spectroscopic analysis of electroactive biofilms grown on copper and graphite electrodes, we are now able to explain the mechanisms of the enhanced electrogeneity (i.e., the ability of electrogenic bacteria to deliver electrons to an electrode) of copper-based, Geobacter dominated mixed culture biofilms. The study underlines major physical limitations in electroactive biofilms and derives strategies to develop low-cost materials for an improved microbial current generation.
2. Methods
2.1 Electrochemical setup and general experimental conditions
All chemicals used in this study were purchased from Roth or Sigma-Aldrich and were of analytical grade. The bioelectrochemical measurements were performed under strictly anaerobic conditions at a temperature of 35 °C. The measurements were carried out in half-cell setups under potentiostatic control (MPG 2, BioLogic, France) using round-bottom flasks (250 mL) as electrochemical cells. Stainless steel mesh (Ludwig Ohlendorf KG, Germany) and Ag/AgCl electrodes (sat. KCl, 0.197 V vs. SHE; Sensortechnik Meinsberg GmbH, Germany) served as counter and reference electrodes, respectively. All electrode potentials in this article refer to the above Ag/AgCl electrode.For a comparative evaluation of the biofilm growth and electrochemical biofilm performance at graphite and copper electrodes under identical environmental and electrochemical conditions, each electrochemical cell contained at least one graphite and one copper working electrode, addressed individually.
Copper electrodes were prepared from copper foil (0.2 mm thickness; >99.9% purity, Chempur, Germany), which was cut to a geometric surface area of 2.25 cm2. A copper wire (ϕ 1 mm) was soldered to the back side as electrical connection. For the preparation of graphite electrodes, graphite rods (ϕ 1.5 cm, polycrystalline graphite, CP Graphite GmbH) were cut into slices with a thickness of 5 mm. A hole (ϕ 1 mm) was drilled 5 mm into the graphite disk from the lateral area. It was filled with conductive silver paint (Busch silver paint, Busch 27 GmbH & Co. KG, Germany), and a copper wire (ϕ 1 mm) was pushed into the hole. For all prepared electrodes, the back sides (and in case of the graphite electrodes also the cylindrical surface) of the electrodes were isolated using two component epoxy glue (R&G Faserverbundwerkstoffe GmbH, Germany). All connecting wires were isolated using heat shrinking tubes. Prior to the electrochemical measurements the electrodes were rinsed with isopropanol and ethanol to remove organic residues and were sonicated (Emmi 12HC, EMAG AG, Germany) in deionised water for 30 minutes.
For electrochemical CuS deposition on the surfaces of the copper electrodes, the respective electrodes were immersed into 250 mL of a 0.1 M NaNO3 solution and a potential of −0.2 V was applied until stationary currents were achieved. 1 g of sodium sulphide hydrate (purity 60%) was added to the solution and the potential was held overnight (approximately 16 h) to finish the reaction.7 To precipitate CuS onto graphite, the polycrystalline graphite electrodes were placed into a 0.1 M CuSO4 solution and vacuum was applied in order to allow the copper sulphate to penetrate into the porous graphite structure. Afterwards, the electrodes were dipped into diluted Na2S solution for 20 minutes for CuS precipitation. The electrodes were subsequently stored in an evacuated desiccator to allow the electrodes to dry. To confirm the presence of CuS, Raman mappings of the electrodes were recorded prior to their use (see Fig. SI-1A and B in the ESI†).
2.2 Biofilm cultivation
The electrochemically active biofilms in this study were cultivated in a standard growth medium using 10 mM of sodium acetate as the sole carbon source.8 The growth medium contained phosphate buffer at pH 7 (Na2HPO4 (4.33 g L−1), NaH2PO4·H2O (2.69 g L−1), NH4Cl (0.31 g L−1), KCl (0.13 g L−1)), trace metal (12.5 mL L−1) and vitamin (12.5 mL L−1) solutions. The trace metal solution for the standard experiments (presence of sulphate) contained the following metal salts: MgSO4·7H2O (3.0 g L−1), MnSO4·H2O (0.45 g L−1), FeSO4·7H2O (0.1 g L−1), ZnSO4 (0.1 g L−1), CuSO4 (6.4 mg L−1), AlK(SO4)2 (10 mg L−1). For preparing a sulphate-free growth medium, all metal sulphates were replaced by the respective chloride or nitrates. To achieve anaerobic conditions, the solution was purged with nitrogen for at least 20 min prior to use.Acetate fed, Geobacter dominated electrochemically active biofilms,9 enriched at graphite rod electrodes using primary wastewater of the wastewater treatment plant Steinhof, Braunschweig (Germany), served as the microbial inoculum for all mixed culture experiments. The biofilms were scratched off from their electrodes into a falcon tube filled with 3 mL buffer solution using a sterile spatula and were dispersed with a vortex mixer (Vortex Genie 2, Scientific Industries, USA) until no clump fractions were left. Afterwards, the suspension was used as inoculum to cultivate biofilms on the studied electrodes.
For biofilm cultivation, a constant potential of −0.2 V was applied. The cultivation experiments were conducted under semi-batch conditions for an average of 6 batch cycles, corresponding to a duration of about 50 days. The currents were recorded for each electrode, with the maximum electrode current of the individual batch cycles serving as a key parameter, reflecting the catalytic biofilm performance without substrate limitation. These maximum currents can be considered as values that would be achieved in continuous mode experiments with a short hydraulic retention time of the substrate solution.
All geometric current densities in this manuscript refer to the geometric surface area of the individual biofilm electrodes. The calculation of relative current densities is based on the simultaneous use of at least two working electrodes in every cultivation experiment, where one graphite electrode always served as the benchmark electrode. The relative current density was calculated as the ratio of the geometric current density of the target biofilm electrode (jtarget) and the geometric current density of the graphite based biofilm electrode (jgraphite):
 | (1) |
Based on this calculation, the relative current density of biofilm electrodes based on unmodified graphite is 1.
All biofilm cultivation experiments were performed at least in triplicates.
2.3 Chemical and spectroscopic analysis
Elementary biofilm analysis was performed by inductively coupled plasma optical emission spectrometry (ICP-OES, Varian, Germany). For this purpose, mature biofilms were carefully removed from the respective electrode surface and were rinsed into quartz beakers with pure water. After drying overnight at 100 °C and weighing, they were digested in 40 mL of 65% nitric acid (Fischer Scientific UK, Loughborough, UK), evaporated to near dryness, followed by reuptake in 20 mL 65% nitric acid, re-evaporation to near-dryness, and the uptake in 15 mL of a 10% nitric acid overnight. The ICP-OES analysis was carried out using the acidic sample solution.For speciation analysis of electrode surfaces and biofilm components we used Raman spectroscopy (InVia REFLEX, Renishaw®, UK) in combination with a laser wavelength of 532 nm (Nd:Yag laser). Microscopic surface images and 3D surface mapping were measured using an adapted Leica-Microscope DM 2700 with a depth resolution of 20 μm at 50 fold magnification.
3. Results and discussion
3.1 Biofilms grown on copper show a superior bioelectrochemical performance
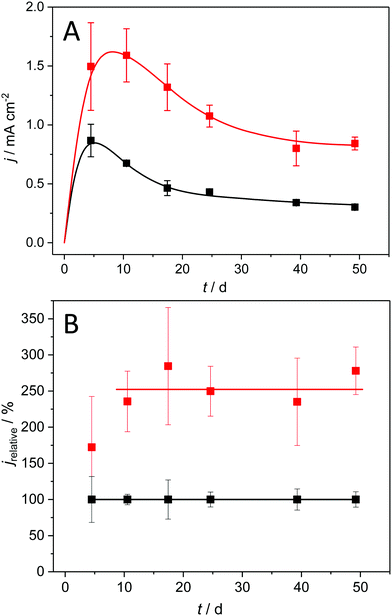
Acetate fed, mixed culture anodic biofilms, usually dominated by Geobacter sulfurreducens or anodireducens, can be considered as the model electrogenic biofilms for a majority of MFC/MET studies.10–12Fig. 1A shows the bioelectrocatalytic current generation of such biofilms, grown under semi-batch conditions on copper and on graphite, over a cultivation period of 50 days.The depicted current density pattern is typical for the applied experimental conditions: Thus, the use of preselected bacteria13,14 leads to a short incubation time, with stationary conditions reached within ten days after inoculation. A subsequent decrease in current density is observed, which is likely due to an increasing mass transfer limitation by the steadily growing biofilm.15,16 The biofilms grown on graphite electrodes (black symbols) reach a maximum geometric current density of 0.87 ± 0.14 mA cm−2, which is in good agreement with literature values for flat, 2D electrodes.17,18 Previous studies suggested that a further increase of the bioelectrochemical substrate turnover of these biofilms is restricted by increasing proton and substrate gradients within the biofilms.19 Yet, as shown in Fig. 1A (red symbols) for biofilm grown on copper, geometric current density values of 1.59 ± 0.23 mA cm−2 can be reached, representing an increase in current density by 82% as compared to graphite electrodes.
To compare the performance of graphite and copper-based biofilm electrodes at different stages of biofilm growth and maturation, we normalized the geometric current densities presented in Fig. 1A against the values of graphite biofilm electrodes. The resulting relative currents, which are depicted in Fig. 1B, clearly show that the copper electrodes retain their superior bioelectrocatalytic performance over the entire experimental duration, with an average relative current of 256%.
3.2 Biofilms grown on copper contain copper sulphides
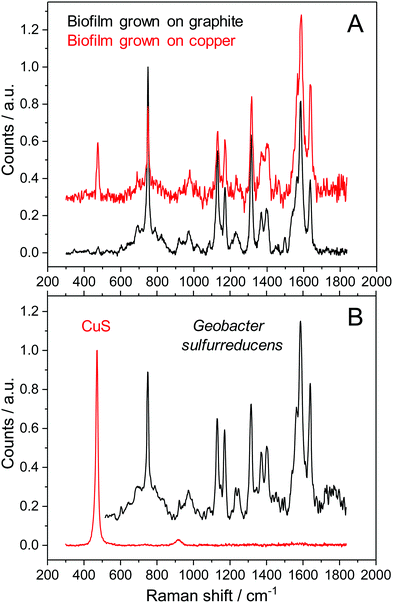
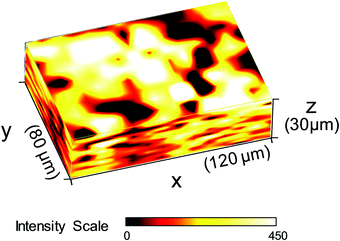
In order to understand the reasons for performance difference between graphite and copper-based biofilms, we analysed the respective biofilms using Raman spectroscopy. As shown in Fig. 2A, at Raman shifts above 500 cm−1 the spectroscopic features of copper and graphite based biofilms are virtually identical. Based on the specific composition of the cellular components, bacterial species can be identified by means of their distinct Raman spectra.20,21 Since previous studies in our lab showed a dominance of Geobacter species under the chosen environmental conditions,22 we compared the Raman spectra depicted in Fig. 2A with the Raman spectrum of a pure culture of Geobacter sulfurreducens (Fig. 2B, black spectrum). All spectra show an almost 100% agreement – including their fine structures. This accordance indicates a strong dominance of G. sulfurreducens or of a closely related Geobacter species in the studied biofilms.There is, however, a clear difference at Raman shifts below 500 cm−1: copper-grown biofilms show an additional signal at a Raman shift of 473 cm−1. A comparative analysis of different sparingly soluble copper salts that may have been formed by precipitation of copper ions by components in the microbial growth medium (see Fig. SI-02, ESI,† for further information) reveals a strong consistency with copper(II) sulphide, CuS (Fig. 2B, red spectrum). A Raman mapping of CuS thereby revealed the distribution of this species throughout the entire biofilm (Fig. 3).
In order to confirm this finding, we performed comparative ICP-OES based elementary analyses of biofilms grown on copper and on graphite electrodes. The results, presented in Table 1, reveal the occurrence of significant amounts of copper and sulphur in the copper-grown biofilms, constituting about 56% of the total biofilm mass. The relative amount of both species leads to a stoichiometry of the copper sulphide species of Cu2S – corresponding to copper(I) sulphide.
| Biofilms@graphite | Biofilms@copper | |
|---|---|---|
| Total dry weight | 5994 ± 597 | 13196 ± 2108 |
| Ca | 3.1 ± 1.9 | 1.4 ± 0.02 |
| Cu | 5.3 ± 4.0 | 5904 ± 1325 |
| Fe | 6.3 ± 0.05 | 19.0 ± 1.6 |
| K | 16.2 ± 0.73 | 17.0 ± 1.5 |
| Mg | 12.6 ± 1.5 | 13.3 ± 1.4 |
| Mn | 1.6 ± 0.05 | 2.3 ± 0.05 |
| Na | 113.9 ± 6.9 | 80.0 ± 2.0 |
| P | 131.2 ± 8.1 | 109.8 ± 2.5 |
| S | 29.7 ± 1.8 | 1491 ± 327 |
| Zn | 1.1 ± 0.2 | 6.7 ± 1.9 |
The above findings provoke a series of questions: Where do the sulphide ions originate, when they were not contained in the original growth medium? In order to form copper sulphides, metallic copper needs to become oxidized. What is the thermodynamic basis for the oxidation of this metal? And why do we see two different copper sulphide species – CuS and Cu2S?
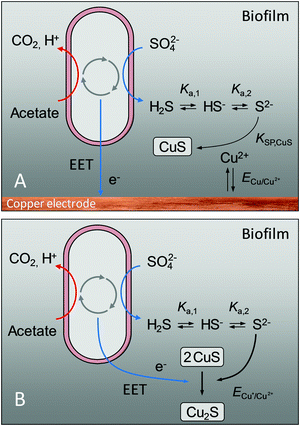
Answers to these questions are provided in Fig. 4: The presence of sulphide ions in the biofilms can be explained by the microbial reduction of sulphate ions, contained in the growth medium (see composition in the experimental part), by sulphate reducing bacteria such as Geobacter sulfurreducens.23 In a bioelectrochemical system, this reaction is a generally unwanted side reaction that reduces the number of electrons transferrable from an electrogenic bacterium to the anode via extracellular electron transfer, EET.
Using the solubility equilibria for copper(I) sulphide (KSP,Cu2S = aCu+2aS2−) and copper(II) sulphide (KSP,CuS = aCu2+aS2−), the Nernst equations for the redox transitions of copper in the presence of sulphide ions can be derived (eqn (2)–(4)):
 | (2) |
 | (3) |
 | (4) |
The growth medium used in our experiments contained about 2 × 10⁻⁴ mol L−1 of sulphate ions (see experimental part). Assuming that in the presence of 10 mM electron donor (acetate) the entire sulphate pool in the biofilm may become reduced, a total sulphide level of 2 × 10⁻⁴ mol L−1 can be estimated. It is important to point out that the total sulphide concentration is not equal to the concentration of deprotonated sulphide ions (S2−). Here, the protonation equilibria of the H2S/HS−/S2− system with the acid dissociation constants pKa1 = 6.99 and pKa2 = 12.35 have to be taken into account. For the determination of aS2−, we used a graphical tool – the Bjerrum plot (see Fig. SI-03, ESI†). Assuming an average biofilm pH of 6.5,24 the activity of deprotonated sulphide ions was determined as aS2− = 1.8 × 10⁻¹¹ mol L−1. Using this value in combination with the solubility products of Cu2S and CuS (see Table 2) and the above Nernst equations (eqn (2)–(4)), the redox potentials of copper in the presence of sulphide can be calculated. Table 2 clearly shows that, based on the extremely low solubility of the copper sulphides, the presence of sulphide ions leads to a strong shift of the oxidation potential of all copper redox transitions towards negative values, transforming copper into a reactive metal species.
| Standard potentials/V (vs. SHE) | Solubility products25 | Redox potentials in the presence of sulphide/V vs. SHE (vs. Ag/AgCl)a | |
|---|---|---|---|
| a Calculated for a total concentration of sulphide species of 2 × 10⁻⁴ mol L−1, pH 6.5, aS2− = 1.8 × 10⁻¹¹ mol L−1 and a temperature of 35 °C. | |||
| Cu/Cu(I) |

|
K SP,Cu2S = 2.5 × 10−48 | E Cu/Cu+ = −0.605 (−0.802) |
| Cu/Cu(II) |

|
K SP,Cu = 6 × 10−37 | E Cu/Cu2+ = −0.437 (−0.634) |
| Cu(I)/Cu(II) |

|
E Cu+/Cu2+ = −0.278 (−0.475) | |
Based on the calculated redox potentials provided in the right column of Table 2, an applied electrode potential of −0.2 V (vs. Ag/AgCl) during turnover conditions favours the formation of CuS at the biofilm–electrode interface. During cell proliferation, which in Geobacter biofilms takes place close to the electrode–biofilm interface,26 older cell layers including incorporated insoluble compounds like CuS, are moved outwards. This process explains the occurrence of copper sulphide in the entire biofilm. With increasing distance from the electrode surface, the redox potential in electroactive biofilms shifts to negative values. Thus, as shown by Babauta et al.24 for bioelectrochemical turnover conditions, the redox potential inside Geobacter biofilms dropped from +0.45 V – the applied electrode potential – to −0.5 V within 10 μm distance from the electrode surface, further decreasing with increasing distance to the electrode surface. At such potentials, copper(I) sulphide, Cu2S, becomes the thermodynamically favoured species. The bulk stoichiometry of Cu2S, as found by ICP-OES analysis, can thus be explained by a microbially induced reduction of Cu(II) to Cu(I), as illustrated in Fig. 4B. The reduction may not be thorough, so that CuS remains spectroscopically detectable throughout the biofilm (Fig. 3).
3.3 Copper sulphides promote electron transfer
The ICP-OES based elementary analysis, depicted in Table 1, yields an interesting detail: when subtracting the masses of copper and sulphur from the total surface related dry mass, copper and graphite-based biofilms possess a virtually identical dry mass of 5801 and 5994 μg cm−2, respectively. We can thus assume that the total biomass is unaffected by the choice of the electrode material.Physical insights into the enhanced bioelectrochemical activity of the copper-based biofilms are provided by the steady state voltammograms, depicted in Fig. 5. The fundamental shape of the turnover voltammograms of copper and graphite-based biofilms (Fig. 5A) is highly similar, with identical inflection points, as illustrated by the maxima of the first derivatives of the voltammetric curves (Fig. 5B). Thus, the fundamental EET mechanisms remain unaffected by the nature of the underlying electrode material.
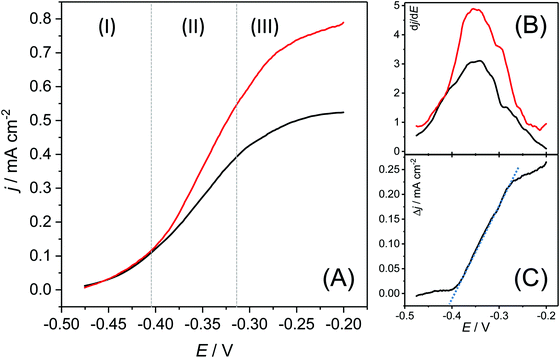 | ||
| Fig. 5 (A) Biofilm turnover steady state voltammograms of a copper-based biofilm electrode (red curve) and a graphite-based electrode (black curve) calculated from the respective cyclic voltammograms via averaging of forward and backward currents (see also Fig. SI-04, ESI†). The scan rate was 1 mV s−1. (B) First derivatives of both voltammograms. (C) Difference of the current densities of the voltammetric curves, calculated as Δj = jcopper electrode − jgraphite electrode. | ||
The voltammograms show three distinct sections: The onset of the voltammetric curve (Section (1)) is dominated by the kinetics of the interfacial electron transfer (Butler–Volmer–Kinetics).27 Here both biofilm electrodes show a very similar behaviour. The similarity can be expected, since the voltammetry of Geobacter biofilms grown on graphite is already electrochemically highly reversible.28 A major difference appears in Section (2): here, the copper-based electrode shows a considerably steeper slope than the graphite electrode. In order to analyse the difference in both curves, we subtracted both steady state voltammograms from each other (Fig. 5C). The slope in the resulting residual voltammogram shows an almost perfect linearity indicating that the difference in both voltammograms lies predominantly in the conductivity of the biofilms. From the slope in the potential window between −380 and −280 mV it can be estimated that the ohmic resistance of the copper-grown biofilm is about 535 Ω cm2 lower than that of the graphite-based biofilm. The increased conductivity of the copper-based biofilm can be attributed to the incorporated copper sulphides. Thus, with a maximum specific conductivity of σCu2S = 102 S cm−1,29 copper(I) sulphide is a semiconductor, whereas, with a conductivity of up to σCuS = 105 S cm−1,29 copper(II) sulphide possesses metallic conductivity.
In Section (3) in the voltammetric curve, the biofilm reaches the stationary current density. In alignment with the data from the constant potential measurement (see Fig. 1), the copper-based biofilm clearly outperforms the graphite-based biofilm electrodes. This finding can be explained by means of the metabolic stratification within the biofilms. Thus, Chadwick et al. recently showed that the metabolic activity of G. sulfurreducens biofilms is restricted to the cells within a 10 μm biofilm layer most adjacent to the electrode surface.26 A steep drop of the redox potential to values of about −0.5 V beyond this biofilm layer24 leads to redox conditions unfavourable for bioelectrochemical substrate oxidation. Hence, all cells more distant to the electrode surface remain metabolically inactive. The reduced ohmic resistance of copper-based biofilms may now lead to a less steep potential drop in the biofilm, allowing the active cell layer thickness to grow. The resulting increase in the number of active cells leads to a proportional increase in bioelectrochemical current generation.
In order to evaluate to which extent the copper oxidation itself may contribute to the increased bioelectrochemical current densities, we calculated the copper oxidation current based on the amount of copper accumulated in the biofilm in the course of the biofilm cultivation (see Table 1). Assuming that copper oxidation takes place in the turnover phases of the semi-batch cultivation, a current density of about 8 μA cm−2 was calculated. This current density is insignificant compared to the overall increase in current density of the copper-based biofilms.
One may argue that an increased microscopic surface area of the electrode material due to the microbially induced copper corrosion or due to the copper sulphide deposition can be made responsible for the enhanced biofilm electrogeneity. However, as we have recently demonstrated, electrode structures that are smaller in dimension than the thickness of electroactive biofilm do not lead to a significant or lasting current enhancement.15,30
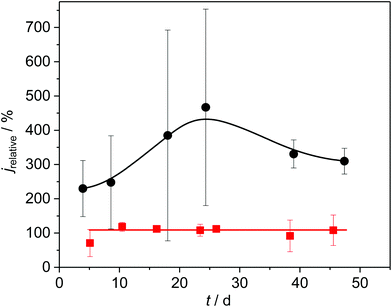
To confirm the role of copper sulphides in the promotion of the bioelectrochemical turnover, we performed two different experiments. In experiment 1, we removed all sulphates from the growth medium by replacing the respective salts by nitrate and chloride components and used the growth medium for cultivation. Under these conditions, sulphide formation, as depicted in Fig. 4, would not be possible. As shown in Fig. 6, red curve, the relative current of the resulting copper-based biofilm electrode was now exactly as high as that of the corresponding graphite electrodes. This proves that the presence of copper sulphides is responsible and essential for the current increase.
In experiment 2 we deposited copper(II) sulphides onto copper electrodes prior to biofilm cultivation. As the black curve in Fig. 6 illustrate, this measure had an additional positive effect on the current generation. Thus, the relative current increased to a value of 460% (corresponding to a geometric current density of up to 2 mA cm−2) at day 25 after inoculation (see Fig. SI-05, ESI†).
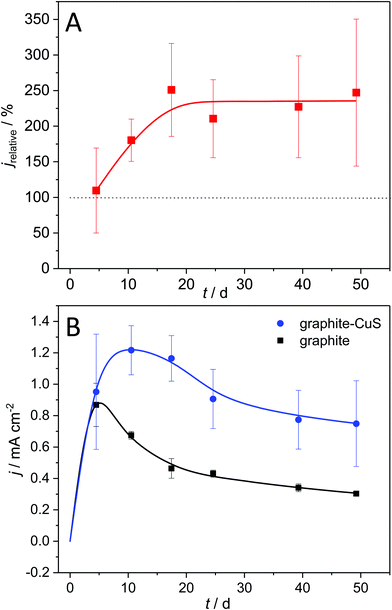
Is the use of metallic copper thus essential for a current density enhancement? To answer this question, we deposited copper sulphide onto graphite electrodes and used these modified electrodes for biofilm cultivation. The development of the resulting bioelectrocatalytic current generation is depicted in Fig. 7.
Fig. 7A shows that biofilm electrodes based on CuS-modified graphite reach current densities of 234% relative to unmodified graphite. Hereby, as shown in Fig. 7B, the current enhancement is not an immediate effect but increases over the first 10 days of operation, whereas the biofilm grown on unmodified graphite already loses activity during that period. This supports the hypothesis that the penetration of the conductive copper sulphide(s) into the biofilm during the biofilm growth increases the thickness of the metabolically active cell layer, an effect that requires the biofilm to reach a certain total thickness. These results clearly highlight that a copper sulphide deposition on graphite can substitute the use of metallic copper as electrode base material, thus creating a high-performance but low-cost electrode material.
The large standard deviation in Fig. 6 and 7 (as well as Fig. SI-05, ESI†) can be attributed to variations in the quality of the cupper sulphide deposition. The inhomogeneity becomes visible in the Raman mappings (Fig. SI-01A and B, ESI†). Here we see a considerable potential for a further improvement via more sophisticated deposition procedures. This clearly needs to be addressed in a follow-up study.
When using copper sulphide as an electrode modifier, a possible oxidative decomposition (via oxidation of the sulphide ion) has to be taken into account. The redox potential for this process depends on environmental variables such as the surrounding pH and can be derived from a respective Pourbaiux diagram see, e.g., ref. 31. We have determined the threshold for the oxidation process using cyclic voltammetry. Thus, as depicted in Fig. SI-06 (ESI†) the onset potential is about 0.1 V (vs. Ag/AgCl). For a microbial fuel cell, this onset potential would have to be seen in relation to the operating potential of an oxygen cathode. In Fig. SI-06 (ESI†), the oxygen reduction reaction at a platinum electrode is shown to have an onset potential of 0.1 V, which coincides with the copper sulphide oxidation (as well as with the oxidation of metallic copper oxidation, as shown in ref. 6). In an operating fuel cell, when avoiding extended short circuit conditions, the anode potential usually remains well below the cathode potential. It can thus be assumed that copper sulphide can be safely used well below its oxidation potential.
4. Conclusions
In this study, we have shown that using copper electrodes systematically and substantially enhances the current generation of G. sulfurreducens biofilm electrodes. The current enhancement is based on the bioelectrochemical formation of copper(I) and copper(II) sulphides, which are incorporated into the biofilms – serving as conductive network, supporting extracellular electron transfer. Thereby, the extremely low solubility of the copper sulphides prevents antimicrobial effects of the copper compounds. As compared to graphite-based biofilm electrodes, the current density increased to an average of 237%. An additional electrochemical copper sulphide deposition prior to the biofilm cultivation further increased the current densities to a maximum relative current of 460% after 25 days of operation.The use of metallic copper can be completely avoided when CuS-modified graphite is used for biofilm cultivation. With this strategy, relative currents of about 234% are achieved, rendering this composite electrode material a promising material for bioelectrochemical applications.
Conflicts of interest
There are no conflicts to declare.Acknowledgements
The authors gratefully acknowledge financial support by the Deutsche Forschungsgemeinschaft for the DFG grants SCHR 753/10-2 and INST 188/420-1 FUGG.References
- G. Borkow and J. Gabbay, Curr. Chem. Biol., 2009, 3, 272–278 CAS.
- J. R. Harris, Econ. Hist. Rev., 1966, 19, 550–568 CrossRef.
- G. Grass, C. Rensing and M. Solioz, Appl. Environ. Microbiol., 2011, 77, 1541–1547 CrossRef CAS PubMed.
- K. Page, M. Wilson and I. P. Parkin, J. Mater. Chem., 2009, 19, 3818–3831 RSC.
- G. Borkow, Curr. Chem. Biol., 2012, 6, 93–103 CrossRef CAS.
- A. Baudler, I. Schmidt, M. Langner, A. Greiner and U. Schröder, Energy Environ. Sci., 2015, 8, 2048–2055 RSC.
- L. Fotouhi and M. Rezaei, Microchim. Acta, 2009, 167, 247–251 CrossRef CAS.
- W. E. Balch, G. E. Fox, L. J. Magrum, C. R. Woese and R. S. Wolfe, Microbiol. Rev., 1979, 43, 260–296 CrossRef CAS PubMed.
- A. Baudler, S. Riedl and U. Schröder, Front. Energy Res., 2014, 2, 1–6 Search PubMed.
- F. Harnisch, C. Koch, S. A. Patil, T. Huebschmann, S. Mueller and U. Schroeder, Energy Environ. Sci., 2011, 4, 1265–1267 RSC.
- C. Koch and F. Harnisch, ChemElectroChem, 2016, 3, 1282–1295 CrossRef CAS.
- X. Zhu, M. D. Yates, M. C. Hatzell, H. Ananda Rao, P. E. Saikaly and B. E. Logan, Environ. Sci. Technol., 2014, 48, 1352–1358 CrossRef CAS PubMed.
- Y. Liu, F. Harnisch, K. Fricke, R. Sietmann and U. Schröder, Biosens. Bioelectron., 2008, 24, 1012–1017 CrossRef PubMed.
- S. Riedl, R. K. Brown, S. Klöckner, K. J. Huber, B. Bunk, J. Overmann and U. Schröder, ChemElectroChem, 2017, 4, 3081–3090 CrossRef CAS.
- C. Moß, A. Behrens and U. Schröder, ChemSusChem, 2020, 13, 582–589 CrossRef PubMed.
- D. Sun, S. Cheng, A. Wang, F. Li, B. E. Logan and K. Cen, Environ. Sci. Technol., 2015, 49, 5227–5235 CrossRef CAS.
- C. I. Torres, R. Krajmalnik-Brown, P. Parameswaran, A. K. Marcus, G. Wanger, Y. A. Gorby and B. E. Rittmann, Environ. Sci. Technol., 2009, 43, 9519–9524 CrossRef CAS.
- D. Pocaznoi, A. Calmet, L. Etcheverry, B. Erable and A. Bergel, Energy Environ. Sci., 2012, 5, 9645–9652 RSC.
- C. I. Torres, A. K. Marcus and B. E. Rittmann, Biotechnol. Bioeng., 2008, 100, 872–881 CrossRef CAS PubMed.
- R. M. Jarvis and R. Goodacre, Anal. Chem., 2004, 76, 40–47 CrossRef CAS PubMed.
- L. Ashton, K. Lau, C. L. Winder and R. Goodacre, Future Microbiol., 2011, 6, 991–997 CrossRef CAS PubMed.
- I. Schmidt, A. Pieper, H. Wichmann, B. Bunk, K. Huber, J. Overmann, P. J. Walla and U. Schröder, ChemElectroChem, 2017, 4, 2515–2519 CrossRef CAS.
- Z. Qian, H. Tianwei, H. R. Mackey, M. C. M. van Loosdrecht and C. Guanghao, Water Res., 2019, 150, 162–181 CrossRef CAS PubMed.
- J. T. Babauta, H. D. Nguyen, T. D. Harrington, R. Renslow and H. Beyenal, Biotechnol. Bioeng., 2012, 109, 2651–2662 CrossRef CAS.
- K. Rauscher, J. Voigt, I. Wilke, K. T. Wilke and R. Friebe, Chemische Tabellen und Rechentafeln für die analytische Praxis, Verlag Europa-Lehrmittel, Haan-Gruiten, 2000 Search PubMed.
- G. L. Chadwick, F. J. Otero, J. A. Gralnick, D. R. Bond and V. J. Orphan, Proc. Natl. Acad. Sci. U. S. A., 2019, 116, 20716–20724 CrossRef CAS PubMed.
- A. J. Bard and L. R. Faulkner, Electrochemical Methods – Fundamentals and Applications, John Wiley & Sons, Inc., 2001 Search PubMed.
- K. Fricke, F. Harnisch and U. Schröder, Energy Environ. Sci., 2008, 1, 144–147 RSC.
- D. R. Lide, CRC handbook of chemistry and physics, CRC Press, Boca Raton, FL, 84th edn, 2003 Search PubMed.
- C. Moß, S. A. Patil and U. Schröder, Front. Energy Res., 2019, 7, 1–10 CrossRef.
- I. Puigdomenech and C. Taxén, Thermodynamic Data for Copper, Implications for the Corrosion of Copper Under Repository Conditions, 2000 Search PubMed.
Footnotes |
| † Electronic supplementary information (ESI) available. See DOI: 10.1039/d0ee01281e |
| ‡ Contributed equally. |
| This journal is © The Royal Society of Chemistry 2020 |

