 Open Access Article
Creative Commons Attribution 3.0 Unported Licence
High-performance fuel cell designed for coking-resistance and efficient conversion of waste methane to electrical energy†
Tao
Li
a,
Xuekun
Lu
b,
Mohamad F.
Rabuni
ac,
Bo
Wang
a,
Nicholas M.
Farandos
d,
Geoff H.
Kelsall
d,
Dan J. L.
Brett
 b,
Paul R.
Shearing
 b,
Mengzheng
Ouyang
e,
Nigel P.
Brandon
e and
Kang
Li
 *a
*a
aBarrer Center, Department of Chemical Engineering, Imperial College London, London, SW7 2AZ, UK. E-mail: kang.li@imperial.ac.uk
bElectrochemical Innovation Lab, Department of Chemical Engineering, University College London, London WC1E 7JE, UK
cDepartment of Chemical Engineering, University of Malaya, 50603 Kuala Lumpur, Malaysia
dDepartment of Chemical Engineering, Imperial College London, London SW7 2AZ, UK
eDepartment of Earth Science and Engineering, Imperial College London, London SW7 2AZ, UK
First published on 19th May 2020
Abstract
Utilization or emission of low calorific value gases (LCVGs) containing <20% CH4 constitute economic and environmental challenges. Ceramic fuel cells offer a possible solution, but their performance is hindered by carbon formation (‘coking’). Herein, we report a novel fuel cell designed to mitigate coking, yielding superior performances but using conventional commercially-available materials. The new micro-monolithic design has an extraordinary geometrical asymmetry that separates the mechanical support and anode current collector from the electrochemically active region and results in significantly facilitated mass transport, yielding power densities of 1.77–2.22 W cm−2 using LCVGs. In addition, the effluent containing only H2, CO and CO2 is of great industrial interest for methanol synthesis, if their ratios are adjusted appropriately. The new fuel cell developed was almost free from coke deactivation and was stable for over 500 h, indicating great promise for both efficient and environmentally benign use of LCVGs.
Broader contextDespite the greater role of methane in the global energy blueprint, many methane sources, both natural and artificial, have been untapped due to their low methane concentrations (typically <20%) and correspondingly low heating values. Generally known as low calorific value gases (LCVGs), they are not useful unless the CH4 concentration can be increased, which requires a significant cost even with state-of-the-art technologies. Therefore, efficient utilization of LCVGs constitute significant economic and environmental challenges. In this study, we demonstrated that a ceramic fuel cell with commercially available materials could yield promising performances (>2 W cm−2) even with 10–20% methane in the fuel. The new ‘micro-monolithic’ conceptual design has displayed not only the advantages in minimizing concentration polarization, but also a unique mechanics in suppressing coking with >500 h stability test conducted. Therefore, with the depletion of existing fossil fuels and the urgency to mitigate climate change, this work demonstrates a promising technology for both efficient and environmentally benign use of LCVGs. |
Introduction
Ceramic fuel cells offer the potential of environmentally sustainable and high-efficiency (typically >60%) power generation compared to natural gas combustion-based electrical power plants, as they are not subject to constraints of the Carnot cycle. Moreover, they provide the critical advantage of fuel versatility over other types of fuel cells and enable fuelling by hydrocarbons via internal reforming, due to their high operating temperatures (700–1000 °C). Among the various types of hydrocarbons, natural gas, consisting primarily of methane, presently meets ca. 27% of global energy demand,1,2 and is preferred to coal due to its significantly lower carbon footprint.Despite the great importance of methane in the global energy blueprint, many methane sources have been untapped due to their comparatively low methane concentrations, and correspondingly low heating values, so are known as low calorific value gases (LCVGs). There is no rigid LCVG definition as it was associated initially with the products of coal gasification, with heating values below 7 MJ m−3.3,4 There are other sources of LCVGs, e.g. a significant number of natural gas reservoirs with CO2 contents up to 87% across the world that remain unexplored, despite trillions of cubic metres of recoverable reserves, due to economic concerns.5–8 Such gas is not useful unless the CH4 concentration can be increased, which typically requires a significant cost, even with state-of-the-art technologies. Another important source of LCVGs is from the upgrading procedures necessary to obtain marketable bio-methane from biogas, produced from domestic and agriculture wastes. Though an important source of renewable energy, they could cause tremendous amount of off-gas emissions of 10–15% methane, the balance being CO2.9,10 Methane in these LCVGs is uneconomic to use, and would contribute to climate change, since methane is one of the main greenhouse gases with a global warming potential (GWP) 25–34 times higher than that of CO2.11,12 Presently, these LCVGs commonly are treated by flaring and in some cases, it is necessary to have further addition of fuel to sustain the combustion, which has economic and environmental implications, i.e. greater CO2 emissions. Therefore, with the depletion of existing fossil fuels and the urgency to mitigate climate change, a technology that can achieve clean and efficient use of these low utility LCVGs is in great need.
As examples of a well-studied technology, ceramic fuel cells are promising candidates to utilize LCVGs via internal dry reforming of methane (DRM) reaction (1),12–14 as the high operating temperatures favour high equilibrium conversion (endothermic reaction, ΔH298K = 247 kJ mol−1). DRM reaction converts the two greenhouse gases into a mixture of H2 and CO (syngas), which is the fundamental feedstock for valuable chemicals via processes such as the Fischer–Tropsch synthesis,15–18 making the whole concept promising for CO2 sequestration to mitigate global warming.
| CH4(g) + CO2(g) → 2CO(g) + 2H2(g) | (1) |
One major challenge for hydrocarbon-fuelled ceramic fuel cell is carbon formation or coking, the mechanism of which depends on both thermodynamic and kinetic considerations. The carbon formed mainly via reactions (2)–(4), not only result in the de-activation of the anode by occupying active sites, but also lead to physical blockage of percolated pore structures, impeding gas transport:
| Gas phase pyrolysis: CH4(g) + C(s) → 2H2(g) | (2) |
| Boudouard reaction: 2CO(g) → + CO2(g) + C(s) | (3) |
| Carbon gasification: CO(g) + H2(g) → H2O(g) + C(s) | (4) |
Despite the system complexity due to the multiple reactions involved, the thermochemistry of the gas phase equilibria, depicted by a C–H–O ternary diagram, is well established and accepted as a useful indication of the thermodynamic driving force for coking.12,19 As for coking mitigation, one major strategy is to replace conventional Ni-cermet with alternative materials that do not catalyze carbon formation, e.g. Cu-based electrode and some perovskites.20 The other main approach involves operating Ni-based electrode under well-controlled conditions by addition of reforming agents or even oxygen into hydrocarbon fuels to adjust the C![[thin space (1/6-em)]](https://www.rsc.org/images/entities/char_2009.gif) :
:![[thin space (1/6-em)]](https://www.rsc.org/images/entities/char_2009.gif) H
H![[thin space (1/6-em)]](https://www.rsc.org/images/entities/char_2009.gif) :
:![[thin space (1/6-em)]](https://www.rsc.org/images/entities/char_2009.gif) O ratio and so suppress coking.21 Despite much research focused on methane conversion using solid oxide fuel cells,12 state-of-the-art ceramic fuel cells cannot be used for efficient LCVG recovery, because of their cell designs, operating costs, lack of coking resistance and electrochemical performance.
O ratio and so suppress coking.21 Despite much research focused on methane conversion using solid oxide fuel cells,12 state-of-the-art ceramic fuel cells cannot be used for efficient LCVG recovery, because of their cell designs, operating costs, lack of coking resistance and electrochemical performance.
Hence, a new strategy was developed to achieve high utilization efficiency of LCVG methane, with improved coking resistance and long-term stability. Fabricated from commercially available materials, the ceramic fuel cell had an evolved ‘micro-monolithic’ geometry with droplet-shaped channels. These exhibited a new gas transport configuration than conventional designs by offering a unique feature of geometrical ‘asymmetry’, i.e. the electrochemically active region (EAR) was deliberately separated spatially from the electronically conducting mechanical support, dramatically shortening the diffusional length for gaseous fuels to reach the EAR and enabling enhanced control over location where carbon deposition is favourable. This design helps to deliver high electrochemical performance operating with methane concentrations as low as 10%, by minimizing concentration polarization and creating an area-specific atmosphere that suppressed coking in the EAR.
X-ray computed tomography (X-ray CT) was used to reconstruct the three-dimensional structure, the results of which were used for CFD modelling to confirm the atmosphere variation across the cell. It was established that coking occurs only on the inert current collector/mechanical support at the fuel inlet (upstream) region, which had negligible influence on the structural integrity and electrochemical performances. Even with a 1![[thin space (1/6-em)]](https://www.rsc.org/images/entities/char_2009.gif) :
:![[thin space (1/6-em)]](https://www.rsc.org/images/entities/char_2009.gif) 1 CH4–CO2 feed ratio, predicted thermodynamically to favour coking at <800 °C, the fuel cell operated with negligible performance degradation for >500 h.
1 CH4–CO2 feed ratio, predicted thermodynamically to favour coking at <800 °C, the fuel cell operated with negligible performance degradation for >500 h.
Results and discussion
Morphology
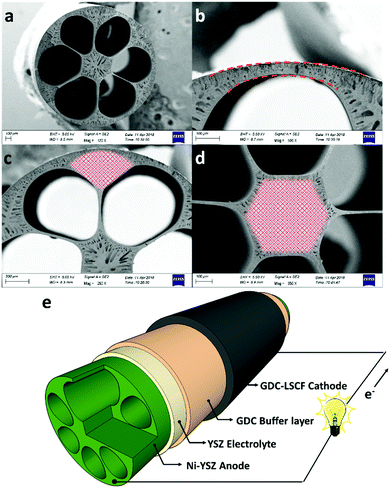
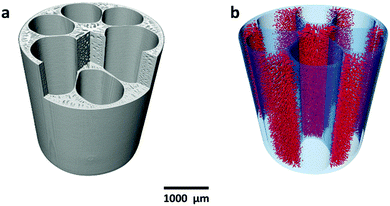
Fig. 1a shows the cross-section of the micro-monolithic anode support incorporating 6 sub-channels with droplet shapes. As described in the ‘Method’ section, the fabrication was based on the phase inversion process, which involves the precipitation of a polymer binder phase as a result of solvent/coagulant exchange. By controlling the rate of precipitation and utilizing the hydraulic pressure of the internal coagulant, the shape of the sub-channel was tailored, and converted from the circular shape of conventional designs, to a droplet shape predicted to achieve increased electrochemical performance. The micro-monolithic anode had an outer diameter of 2.2 ± 0.1 mm, so can be considered as a micro-tube. Such successful miniaturization is essential for high surface areas per volume and consequently improved volumetric power densities. As illustrated in Fig. 1b, the thickness of the exterior electrochemical active region (EAR) in the anode was decreased to <50 μm, which is close to the well-accepted thickness of EARs of 20–40 μm.22,23 Moreover, the design of the droplet shape ensured a similar degree of curvature in between the interior and exterior surfaces of the region, as highlighted in Fig. 1b. Therefore, compared to micro-monolithic designs reported elsewhere, the electrochemically active region of the cell in Fig. 1 had a higher ratio to the overall circumference, so achieving more efficient utilization of the geometric surface area. As for the mechanical support, it was deliberately distributed in between neighbouring EARs (Fig. 1c), as well as the hexagonal region in the middle (Fig. 1d). In most conventional ceramic fuel cell designs, the electrochemically active region in the anode typically was sandwiched between the support and the electrolyte. Hence, gaseous fuels had to be transported through the support prior to participating in the electrochemical reactions occurring in the active zone, introducing additional mass transport resistance, whereas such additional resistance was eliminated in this new micro-monolithic anode design. In addition, a plurality of micro-channels was introduced during the fabrication by the phase inversion process and well-preserved after sintering, as depicted in Fig. S1 (ESI†). Fig. 2 illustrates the macroscopic morphology of the micro-monolithic anode imaged and reconstructed using micro-CT. The micro-channels were segmented using grayscale-based thresholding method and are visualised in Fig. 2b (red phase), with the anode body rendered semi-transparent. The presence of such micro-channels further facilitates gas transport, which has been proved previously to lead to significantly decreased concentration polarization.24,25After the preparation of the anode substrate, both yttria-stabilized zirconia (YSZ) electrolyte and gadolinium-doped ceria (GDC) were deposited by dip-coating (Fig. 1e), each having a thickness of 4.5 (±0.5) μm; the YSZ electrolyte was highly dense after the co-sintering at 1400 °C (Fig. S3, ESI†). The porous GDC-LSCF cathode was dip-coated to complete a single cell and had a thickness of 25–30 μm after sintering at 1000 °C for 2 hours. Both electrodes were wrapped with silver wires (0.2 mm diameter) as current collector.
Electrochemical performance with hydrogen
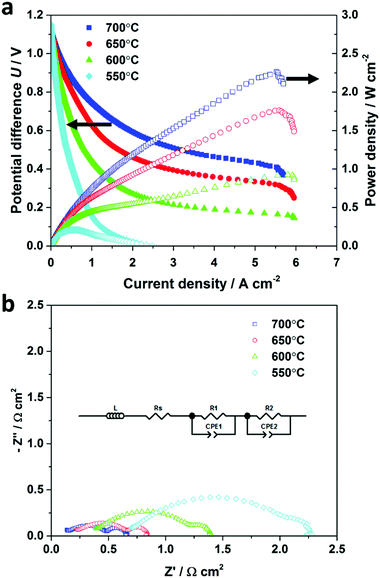
Firstly, the micro-monolithic ceramic fuel cell was characterized using hydrogen fuel as a base case, with 50 cm3 min−1 of dry hydrogen fed to the anode, while atmospheric oxygen was reduced at the cathode. The cell's active area of 0.69 cm2 was calculated based on the outer diameter. Fig. 3a shows the cell potential difference (U)–current density (j)–power density data for operating temperatures from 550 °C to 700 °C, which is the generally accepted intermediate-temperature range. At those temperatures, the measured open-circuit potential difference (OCPD) in pure hydrogen was 1.13–1.15 V, comparing well with values calculated from Nernst's equation, so indicating the YSZ-GDC dual-layer electrolyte was gas-tight after sintering.Maximum power densities of 0.93, 1.75 and 2.27 W cm−2 were measured at 600, 650 and 700 °C, respectively. To the best of our knowledge, 2.27 W cm−2 at 700 °C using hydrogen fuel is the highest power density reported in the literature for any SOFC design, as shown in Table 1. In addition, the anode's geometrical asymmetry and deliberate separation of mechanical support from the EAR demonstrated effectiveness in facilitating gas transport, as illustrated by electrochemical impedance spectroscopy (EIS) in Fig. 3b. The Nyquist curves were fitted using a classical equivalent circuit LRs(R1||CPE1)(R2||CPE2), where L stands for an inductor, R for a resistor and CPE for constant phase element. The fitted impedance spectra are shown in Fig. S4 (ESI†) and the fitting results are summarized in Table S2 (ESI†). The low-frequency (1–100 Hz) arc of the impedance spectrum, implied an area-specific diffusion resistance of approximately 0.16 Ω cm2, which is ca. 1/3 the values for other micro-monolithic counterparts reported previously,26 suggesting the diffusional resistance inside the porous anode had been decreased significantly by this design's tailored morphology.
| Type of fuel | Temperature/°C | Max. power density/W cm−2 | Ref. |
|---|---|---|---|
| Hydrogen | 700 | 2.27 | This work |
| 850 | 1.70 | 29 | |
| 800 | 0.98 | 25 | |
| 900 | 1.32 | 30 | |
| 600 | 0.93 | This work | |
| 600 | 0.62 | 31 | |
| 600 | 0.39 | 32 | |
| 600 | 0.431 | 33 | |
| 600 | 0.65 | 21 | |
| 600 | 0.8 | 34 | |
| LCVG | 750 | 2.2 | This work |
| LCVG | 750 | 0.14 | 28 |
| Biogas | 800 | 0.19 | 35 |
| Biogas | 875 | 0.07 | 36 |
| Biogas | 800 | 0.2 | 37 |
| Propane | 850 | 1.3 | 29 |
Due to the extraordinary geometrical asymmetry involved in the complex micro-monolithic electrode design, integrated computed fluid dynamics (I-CFD) modelling was undertaken on the cell's real 3D structure to further illustrate the influence of the design on facilitating gas transport. As shown in Fig. 2, the 3D reconstruction of the electrode obtained from a custom-developed multi-length scale X-ray CT technique, which includes the micro-CT for the extraction of macro-structural features, as well as the nano-CT for determining micro-structural parameters.25,27 Integrated computed fluid dynamics (I-CFD), which was developed based on such multi-length scale X-CT technique, has been demonstrated to be capable of quantifying effective mass transport parameters on the hierarchically-structured porous anode, with the pore size spanning over two orders of magnitude. This is often challenging due to the balance between imaging resolution and field of view.25,27 This is the first time that such an I-CFD technique was employed to investigate the new micro-monolithic electrode, providing a more vivid and straightforward insight into gas transport in such a complex, hierarchical micro-structure. As shown in Fig. S5a–c (ESI†), when the gas feed was pure hydrogen, the hydrogen molar fraction in the EAR (Fig. 1b) was very close to the bulk concentration under typical operating current densities of 1 and 2 A cm−2. Even at 4 A cm−2, the hydrogen molar fraction decreased from 100% to only ca. 80%, due to hydrogen depletion by its electrochemical oxidation producing steam, suggesting well-optimized fuel transport. Such observations agree well with the U–j curves shown in Fig. 3a, in which the concentration polarization started to dominate at current densities up to 5.5–6 A cm−2.
Electrochemical performance of cells fuelled by simulated LCVGs
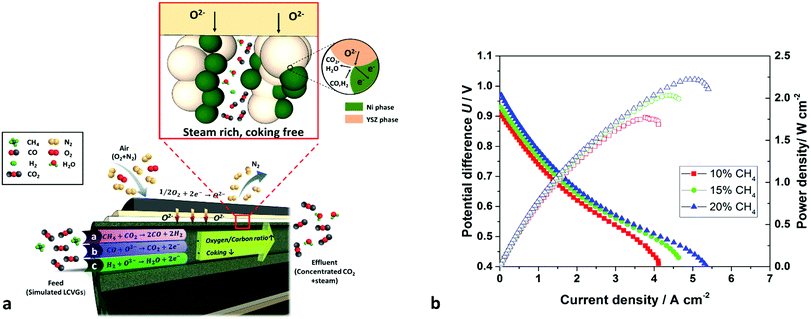
Fig. 4 shows the electrochemical performances of the cells fuelled by simulated LCVGs with methane concentrations of 10%, 15% and 20%. Despite the high CO2 content as an inert diluent in the feed, maximum power densities of 1.77, 2.03 and 2.22 W cm−2 still were achieved at 750 °C. These values compare quite well with those reported in the literature for pure hydrogen and demonstrated direct and highly efficient conversion from ‘valueless’ LCVGs to electrical power over the intermediate temperature range. The power density of 2.22 W cm−2 obtained with 20% CH4 in CO2 is several times higher than values reported previously with similar materials,28 as shown in Table 1.The superior power densities can be attributed to the well-designed cell structure that optimizes fuel transport inside the EAR, eliminated the additional transport resistance from the support. It is understood that generally fuel conversion/utilization for typical SOFCs should be limited to 70% to minimize concentration polarization losses and avoid Ni oxidation at low H2![[thin space (1/6-em)]](https://www.rsc.org/images/entities/char_2009.gif) :
:![[thin space (1/6-em)]](https://www.rsc.org/images/entities/char_2009.gif) H2O ratios, though such conversions may vary depending on specific geometries and operating conditions.
H2O ratios, though such conversions may vary depending on specific geometries and operating conditions.
For simulated LCVGs with low fuel contents, concentration polarization becomes a dominant factor limiting cell performance. Therefore, reducing the diffusive path length from several hundred micrometres to <50 μm, together with the micro-structure tailoring during fabrication, proved essential to achieving efficient conversion of simulated LCVGs. Such explanations could be confirmed further by the I-CFD modelling, results for which are shown in Fig. S5d and e (ESI†). When the inlet gas contains high percentages of inert diluent (set at 80%), the driving force for fuel diffusion decreased accordingly. It is noteworthy that although CO is also a gaseous fuel, H2 had a slightly lower equilibrium potential difference (0.9839 V) than that of CO (0.9907 V) relative to oxygen reduction at 1027 K,38 and a much greater self-diffusion coefficient (11.3 vs. 1.7 cm2 s−1 at 1027 K).39 Under the operating conditions used, hydrogen was expected to be oxidized preferentially, so CO was assumed to be ‘sluggish or inert’ during CFD modelling. Hydrogen concentrations decreased radially from 20% to approximately 15% and 8% under operating current densities of 1 and 2 A cm−2, respectively; fuel starvation was predicted at 4 A cm−2. The permeation flux density (J, mol m−2 s−1) driven by a concentration gradient, can be derived by a modified Fick's first law shown in eqn (S1) (ESI†). As the hydrogen concentration in the initial feed was decreased, micro-structure tailoring, as discussed in the Morphology section, becomes critical to facilitate gas transport, such as by decreasing electrode thickness, increasing the porosity or decreasing the tortuosity. As we reported previously, introducing micro-channels could decrease the tortuosity effectively by several times.25 The structural tailoring, together with the thickness control in the EAR, significantly decreased concentration polarization and contributed to achieving increased electrochemical performances when simulated LCVGs were used as fuel.
As discussed in the Introduction, an important benefit of utilizing LCVGs as fuels in SOFCs is their relatively high operating temperatures (>600 °C) that favour the DRM reaction, according to thermodynamic predictions (Fig. S6 ESI,† endothermic reaction, ΔH298K = 247 kJ mol−1). Based on results of our calculations of thermodynamic equilibria, shown in Fig. S8 (ESI†), complete conversion (conversion rate > 99.9%) of methane could be achieved theoretically at temperatures of 660, 720 and 950 °C with 10%, 20% and 50% initial methane contents, respectively. However, due to the miniaturization of the dimensions of the single cell, the residence time for the DRM reaction was constrained to approximately 0.1 s. Thus, the actual methane conversion can be quite far from thermodynamic equilibrium conditions if the cell performs solely as a catalytic reactor without any current loads, as shown in Fig. S9 (ESI†). On the other hand, once the DRM reaction was coupled with electrochemical reactions, during which both hydrogen and carbon monoxide were formed by reaction (1) then consumed continuously by electrochemical oxidation, the methane conversion could be increased dramatically.
As mentioned previously, gas flaring, which is the conventional route to dispose of natural gas via controlled combustion, is the most common approach for LCVG abatement in order to prevent direct emission of methane as a major greenhouse gas. However, presently it is also one of the most detrimental for energy wastage and climate change. For LCVG flaring, the high CO2 concentration frequently necessitates addition of extra fuel to reach the ignition limit and maintain the flame stability.3,4 Therefore, the disposal of LCVGs via flaring is not only a waste of primary energy, but also a significant contributor to global climate change, as shown in Fig. S10 (ESI†). By comparison, operating ceramic fuel cells with LCVGs could result in highly efficient recovery of their calorific values by conversion to electrical energy, with greatly decreased environmental consequences. As predicted by the techno-economic analysis (Fig. S10, ESI†), a minimum electricity price of 6.5 ¢ kW−1 h−1 could generate revenue to off-set capital expenditure, maintenance and operation cost by selling generated electricity. As provide by U.S. Energy Information Administration (EIA), the latest average national electricity price is approximately 13 ¢ kW−1 h−1.40 Therefore, the utilization of LCVGs using ceramic fuel cells could well be profitable.
The effluent gas mixtures were characterized using gas chromatography (GC) to quantify mole fractions of the components, as exemplified in Fig. 5 for 650 °C under open-circuit conditions. Due to the relatively low methane content, the conversion of methane at 650–750 °C for all three LCVG mixtures was close to their thermodynamic equilibrium composition (Fig. S7, ESI†), confirmed by the negligible methane content measured downstream of the reactor. The effluents contained approximately 45 to 61% syngas (CO + H2), the balance being CO2. The H2/CO ratio was slightly less than 1 (stoichiometric ratio in DRM reaction (1)) due to the reverse water–gas shift reaction. With applied current, the effluent compositions changed according to the additional oxygen content. In addition to efficient electricity generation, the effluents of LCVG utilization are still of considerable industrial interest, e.g. for methanol production via catalytic CO2 hydrogenation.41,42 As demonstrated in several industrial plants, methanol manufactured from these H2–CO–CO2 mixtures potentially can be used as a fuel or adopted as feedstock to produce further value-added chemicals. The highly efficient energy conversion resulting from the well-designed cell structure, together with the significant industrial importance of the downstream effluents, provides a new route to utilize LCVGs and to decrease their carbon footprints effectively.
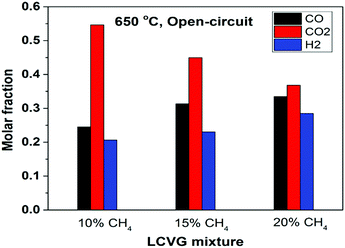 | ||
| Fig. 5 Concentrations of different compositions in the effluents of LCVG mixtures (10–20% CH4) at 650 °C under open-circuit condition (residual CH4 mole fractions not shown as values were <0.1%). | ||
Longer-term coking resistance test using LCVGs
Coking is a critical concern for operating ceramic fuel cells with hydrocarbon fuels, particularly at intermediate temperatures (500–800 °C). According to the well-established ternary diagram of thermodynamic equilibrium of C–H–O system,12 in which the boundary contours of the coking region have been defined as a function of temperature, it has been reported that the coking region expands as the temperature decreases from 800 to 600 °C; all three feed compositions used were at the risk of coking if the cells were operated in the intermediate temperature range. Fig. S6 (ESI†) shows the Gibbs energy changes and equilibrium constants of the three side reactions (2)–(4) that lead to coking. As shown in the figure, both the Boudouard reaction and methane cracking have equilibrium constants (KT) larger than 1 within the intermediate temperature range used (650–750 °C); the formation of carbon is more likely when operating at even lower temperatures. To investigate the longer-term coking resistance of the cell, a CH4![[thin space (1/6-em)]](https://www.rsc.org/images/entities/char_2009.gif) :
:![[thin space (1/6-em)]](https://www.rsc.org/images/entities/char_2009.gif) CO2 ratio of 1
CO2 ratio of 1![[thin space (1/6-em)]](https://www.rsc.org/images/entities/char_2009.gif) :
:![[thin space (1/6-em)]](https://www.rsc.org/images/entities/char_2009.gif) 1 was selected as the feed. As evident in the C–H–O ternary diagram, the mixture containing 50
1 was selected as the feed. As evident in the C–H–O ternary diagram, the mixture containing 50![[thin space (1/6-em)]](https://www.rsc.org/images/entities/char_2009.gif) :
:![[thin space (1/6-em)]](https://www.rsc.org/images/entities/char_2009.gif) 50 of CH4–CO2 is predicted thermodynamically to favour coking at all temperatures used in this study, as has been confirmed experimentally.28
50 of CH4–CO2 is predicted thermodynamically to favour coking at all temperatures used in this study, as has been confirmed experimentally.28
Fig. 6 shows the time dependence of current densities of the novel micro-monolithic ceramic fuel cell operating at 0.7 V and 700 °C with 50 cm3 min−1 of CH4–CO2 mixture as the fuel (1![[thin space (1/6-em)]](https://www.rsc.org/images/entities/char_2009.gif) :
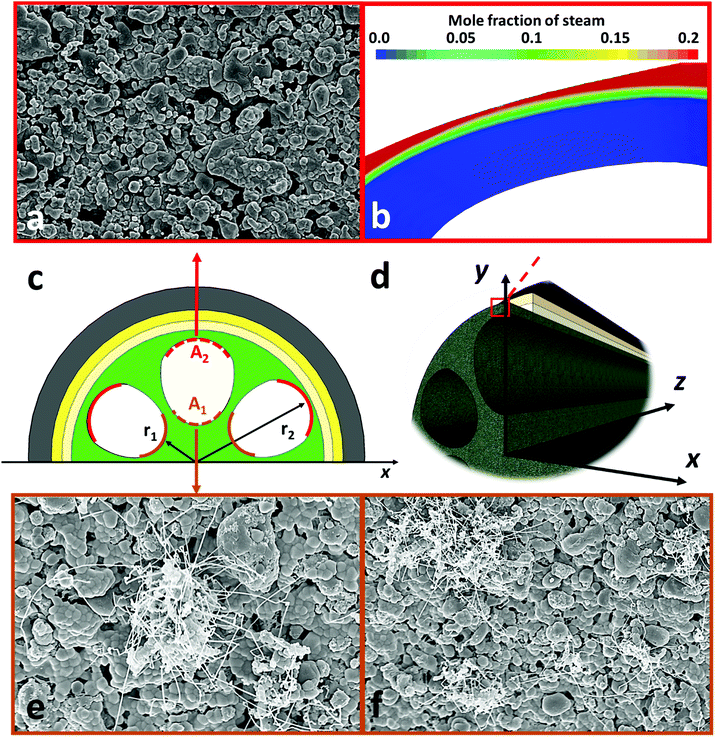
:![[thin space (1/6-em)]](https://www.rsc.org/images/entities/char_2009.gif) 1 ratio), exhibiting a degradation rate over 500 hours of <2% (0.02 A cm−2 kh−1). Fig. 7 shows SEM images around the inner contour after operation. As shown in Fig. 3a, the bulk composition of gaseous fuel varies axially as a result of H2/CO oxidative depletion, with a corresponding increase in steam concentrations. Therefore, the surfaces of the support region (Fig. 7c, region A1) and active region (Fig. 7c, region A2) at both upstream and downstream of the cell were examined. The EAR (A2) along the whole axial direction was free from coking, due to the relatively high steam concentration generated from hydrogen oxidation (Fig. 4a) that maintained the local C
1 ratio), exhibiting a degradation rate over 500 hours of <2% (0.02 A cm−2 kh−1). Fig. 7 shows SEM images around the inner contour after operation. As shown in Fig. 3a, the bulk composition of gaseous fuel varies axially as a result of H2/CO oxidative depletion, with a corresponding increase in steam concentrations. Therefore, the surfaces of the support region (Fig. 7c, region A1) and active region (Fig. 7c, region A2) at both upstream and downstream of the cell were examined. The EAR (A2) along the whole axial direction was free from coking, due to the relatively high steam concentration generated from hydrogen oxidation (Fig. 4a) that maintained the local C![[thin space (1/6-em)]](https://www.rsc.org/images/entities/char_2009.gif) :
:![[thin space (1/6-em)]](https://www.rsc.org/images/entities/char_2009.gif) H
H![[thin space (1/6-em)]](https://www.rsc.org/images/entities/char_2009.gif) :
:![[thin space (1/6-em)]](https://www.rsc.org/images/entities/char_2009.gif) O ratio below the coking threshold (Fig. 7a). In contrast, the steam content at fuel inlet was almost negligible and the feed composition (CH4
O ratio below the coking threshold (Fig. 7a). In contrast, the steam content at fuel inlet was almost negligible and the feed composition (CH4![[thin space (1/6-em)]](https://www.rsc.org/images/entities/char_2009.gif) :
:![[thin space (1/6-em)]](https://www.rsc.org/images/entities/char_2009.gif) CO2 = 1
CO2 = 1![[thin space (1/6-em)]](https://www.rsc.org/images/entities/char_2009.gif) :
:![[thin space (1/6-em)]](https://www.rsc.org/images/entities/char_2009.gif) 1) was well within the coking region. Hence, carbon filaments were observed on the support (A1) at the upstream region (Fig. 7e and f), in agreement with previous reports,17 whereas the downstream side was free of coking. However, the influences of such coking on current densities at constant potential difference and on structural integrity were almost negligible. Thus, it can be concluded that even with a conventional Ni-based electrode, which is well known to be prone to coking, relatively stable operation could be achieved as result of controlling area-specific C
1) was well within the coking region. Hence, carbon filaments were observed on the support (A1) at the upstream region (Fig. 7e and f), in agreement with previous reports,17 whereas the downstream side was free of coking. However, the influences of such coking on current densities at constant potential difference and on structural integrity were almost negligible. Thus, it can be concluded that even with a conventional Ni-based electrode, which is well known to be prone to coking, relatively stable operation could be achieved as result of controlling area-specific C![[thin space (1/6-em)]](https://www.rsc.org/images/entities/char_2009.gif) :
:![[thin space (1/6-em)]](https://www.rsc.org/images/entities/char_2009.gif) H
H![[thin space (1/6-em)]](https://www.rsc.org/images/entities/char_2009.gif) :
:![[thin space (1/6-em)]](https://www.rsc.org/images/entities/char_2009.gif) O ratios via morphology design and optimization. Potentially, this provides a new and more cost-effective approach to suppress the long-standing coking problem and enable efficient utilization of LCVGs as an overlooked energy source.
O ratios via morphology design and optimization. Potentially, this provides a new and more cost-effective approach to suppress the long-standing coking problem and enable efficient utilization of LCVGs as an overlooked energy source.
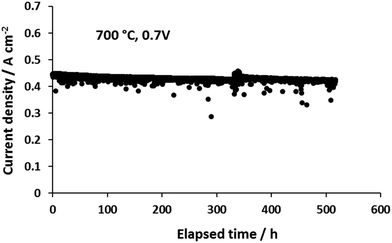 | ||
Fig. 6 Effect of time on current densities of a single cell at a constant cell potential difference of 0.7 V fuelled by CH4–CO2 mixture (1![[thin space (1/6-em)]](https://www.rsc.org/images/entities/char_2009.gif) : :![[thin space (1/6-em)]](https://www.rsc.org/images/entities/char_2009.gif) 1 ratio) and ambient air as the oxidant. 1 ratio) and ambient air as the oxidant. | ||
Conclusions
A new strategy was proposed to realize cost-effective and efficient recovery of LCVGs as a long-overlooked energy source, using a novel high-performance, coking-resistant ceramic fuel cell. Various parameters of the fabrication process were controlled and manipulated to optimize the micro-monolithic design in the anode substrate. The unique geometrical asymmetry, as well as the micro-structure induced from the phase inversion process, dramatically increased mass transport rates, confirmed by CFD modelling assisted by X-ray CT characterization, ensuring adequate fuel supply despite the high concentration of inert diluent in the LCVG feed. The electrochemical characterizations were conducted with both pure hydrogen and simulated LCVGs. A maximum power density of 2.27 W cm−2 was obtained at 700 °C, which is the highest ever reported for any fuel cell geometry. Impedance spectroscopy analysis confirmed the minimization in concentration polarization, the value of which is ca. 1/3 of sub-optimal counterparts. Superior performances were also been obtained when simulated LCVGs were adopted, showing maximum power densities of 1.77, 2.03 and 2.22 W cm−2 with 10, 15, and 20% methane contents, respectively. These performances were also several times higher than reported reference values. The geometrical asymmetry brings additional benefits of enabling control over area-specific gas atmospheres, which helps to suppress coking. A longer-term stability test was conducted with a CH4–CO2 feed ratio of 1![[thin space (1/6-em)]](https://www.rsc.org/images/entities/char_2009.gif) :
:![[thin space (1/6-em)]](https://www.rsc.org/images/entities/char_2009.gif) 1, predicted thermodynamically to favour coking. The cell was operated for more than 500 hours with negligible degradation in current output. Post-mortem examination confirmed the entire EAR was free from coking, and the gradually increased steam concentration in the axial direction protected most of the cell support from carbon formation. This novel fuel cell design represents a new strategy to tackle the long-existing coking issue in a much cheaper and effective way.
1, predicted thermodynamically to favour coking. The cell was operated for more than 500 hours with negligible degradation in current output. Post-mortem examination confirmed the entire EAR was free from coking, and the gradually increased steam concentration in the axial direction protected most of the cell support from carbon formation. This novel fuel cell design represents a new strategy to tackle the long-existing coking issue in a much cheaper and effective way.
Author contributions
The new coking-resistant design was conceived by TL and KL. TL and BW performed the electrode fabrication and morphological analysis. MFR prepared the cells for testing and performed the electrochemical tests and long-term dwelling test with TL, NF and GK. OM and NB performed impedance analysis and equivalent circuit fitting. XL, PS and DB conceived X-CT characterization and CFD modelling. TL, GK and KL prepared the manuscript with feedbacks provided from other authors. KL directed all aspects of the project contributions at Imperial, while PS and DB at UCL. They provided research oversight and funding to support the work.Conflicts of interest
There are no conflicts to declare.Acknowledgements
The authors acknowledge the research funding provided by the UK EPSRC Grant no. EP/R029180/1, EP/M014045/1, EP/M01486X/1. MFR acknowledges the Ministry of Education Malaysia and the University of Malaya for his PhD scholarship. PRS acknowledges the support of The Royal Academy of Engineering, X-ray CT was carried out at the Electrochemical Innovation Lab at UCL, supported by EP/N032888/1.References
- IEA Key World Energy Statistics, The International Energy Agency, 2018.
- BP Statistical Review of World Energy, 2018.
- J. Chomiak, J. P. Longwell and A. F. Sarofim, Prog. Energy Combust. Sci., 1989, 15, 109–129 CrossRef CAS.
- F. Song, Z. Wen, Z. Dong, E. Wang and X. Liu, Energy, 2017, 119, 497–503 CrossRef CAS.
- W. F. J. Burgers, P. S. Northrop, H. S. Kheshgi and J. A. Valencia, Energy Procedia, 2011, 4, 2178–2184 CrossRef.
- V. S. Nørstebø, K. T. Midthun, T. H. Bjørkvoll and L. Kolbeinsen, ISIJ Int., 2012, 52, 1439–1446 CrossRef.
- T. E. Rufford, S. Smart, G. C. Y. Watson, B. F. Graham, J. Boxall, J. C. Diniz da Costa and E. F. May, J. Pet. Sci. Eng., 2012, 94-95, 123–154 CrossRef CAS.
- L. S. Tan, K. K. Lau, M. A. Bustam and A. M. Shariff, J. Nat. Gas Chem., 2012, 21, 7–10 CrossRef CAS.
- S. Basu, A. L. Khan, A. Cano-Odena, C. Liu and I. F. Vankelecom, Chem. Soc. Rev., 2010, 39, 750–768 RSC.
- I. Angelidaki, L. Treu, P. Tsapekos, G. Luo, S. Campanaro, H. Wenzel and P. G. Kougias, Biotechnol. Adv., 2018, 36, 452–466 CrossRef CAS PubMed.
- D. T. Shindell, G. Faluvegi, D. M. Koch, G. A. Schmidt, N. Unger and S. E. Bauer, Science, 2009, 326, 716–718 CrossRef CAS.
- T. M. Gür, Prog. Energy Combust. Sci., 2016, 54, 1–64 CrossRef.
- A. Lanzini, P. Leone, C. Guerra, F. Smeacetto, N. P. Brandon and M. Santarelli, Chem. Eng. J., 2013, 220, 254–263 CrossRef CAS.
- Y. Chen, B. deGlee, Y. Tang, Z. Wang, B. Zhao, Y. Wei, L. Zhang, S. Yoo, K. Pei, J. H. Kim, Y. Ding, P. Hu, F. F. Tao and M. Liu, Nat. Energy, 2018, 3, 1042–1050 CrossRef CAS.
- D. Pakhare and J. Spivey, Chem. Soc. Rev., 2014, 43, 7813–7837 RSC.
- I. Dimitriou, P. García-Gutiérrez, R. H. Elder, R. M. Cuéllar-Franca, A. Azapagic and R. W. K. Allen, Energy Environ. Sci., 2015, 8, 1775–1789 RSC.
- S. Arora and R. Prasad, RSC Adv., 2016, 6, 108668–108688 RSC.
- L. C. Buelens, V. V. Galvita, H. Poelman, C. Detavernier and G. B. Marin, Science, 2016, 354, 449–452 CrossRef CAS PubMed.
- S. McIntosh and R. J. Gorte, Chem. Rev., 2004, 104, 4845–4866 CrossRef CAS PubMed.
- X.-M. Ge, S.-H. Chan, Q.-L. Liu and Q. Sun, Adv. Energy Mater., 2012, 2, 1156–1181 CrossRef CAS.
- C. Duan, R. J. Kee, H. Zhu, C. Karakaya, Y. Chen, S. Ricote, A. Jarry, E. J. Crumlin, D. Hook, R. Braun, N. P. Sullivan and R. O'Hayre, Nature, 2018, 557, 217–222 CrossRef CAS PubMed.
- M. Brown, S. Primdahl and M. Mogensen, J. Electrochem. Soc., 2000, 147, 475–485 CrossRef CAS.
- J. T. S. Irvine, D. Neagu, M. C. Verbraeken, C. Chatzichristodoulou, C. Graves and M. B. Mogensen, Nat. Energy, 2016, 1, 15014 CrossRef CAS.
- Y. Zhang, R. Knibbe, J. Sunarso, Y. Zhong, W. Zhou, Z. Shao and Z. Zhu, Adv. Mater., 2017, 29, 1770345 CrossRef.
- X. Lu, T. Li, A. Bertei, J. I. S. Cho, T. M. M. Heenan, M. F. Rabuni, K. Li, D. J. L. Brett and P. R. Shearing, Energy Environ. Sci., 2018, 11, 2390–2403 RSC.
- T. Li, T. M. M. Heenan, M. F. Rabuni, B. Wang, N. M. Farandos, G. H. Kelsall, D. Matras, C. Tan, X. Lu, S. D. M. Jacques, D. J. L. Brett, P. R. Shearing, M. Di Michiel, A. M. Beale, A. Vamvakeros and K. Li, Nat. Commun., 2019, 10, 1497 CrossRef PubMed.
- X. Lu, O. O. Taiwo, A. Bertei, T. Li, K. Li, D. J. L. Brett and P. R. Shearing, J. Power Sources, 2017, 367, 177–186 CrossRef CAS.
- Z. Lyu, W. Shi and M. Han, Appl. Energy, 2018, 228, 556–567 CrossRef CAS.
- S. Sengodan, S. Choi, A. Jun, T. H. Shin, Y. W. Ju, H. Y. Jeong, J. Shin, J. T. Irvine and G. Kim, Nat. Mater., 2015, 14, 205–209 CrossRef CAS PubMed.
- Z. Du, H. Zhao, S. Li, Y. Zhang, X. Chang, Q. Xia, N. Chen, L. Gu, K. Świerczek, Y. Li, T. Yang and K. An, Adv. Energy Mater., 2018, 8, 1800062 CrossRef.
- Y. Chen, Y. Bu, Y. Zhang, R. Yan, D. Ding, B. Zhao, S. Yoo, D. Dang, R. Hu, C. Yang and M. Liu, Adv. Energy Mater., 2017, 7, 1601890 CrossRef.
- H. J. Choi, K. Bae, S. Grieshammer, G. D. Han, S. W. Park, J. W. Kim, D. Y. Jang, J. Koo, J.-W. Son, M. Martin and J. H. Shim, Adv. Energy Mater., 2018, 8, 1802506 CrossRef.
- T. Wei, P. Singh, Y. Gong, J. B. Goodenough, Y. Huang and K. Huang, Energy Environ. Sci., 2014, 7, 1680–1684 RSC.
- S. Choi, C. J. Kucharczyk, Y. Liang, X. Zhang, I. Takeuchi, H.-I. Ji and S. M. Haile, Nat. Energy, 2018, 3, 202–210 CrossRef CAS.
- C. Guerra, A. Lanzini, P. Leone, M. Santarelli and D. Beretta, Int. J. Hydrogen Energy, 2013, 38, 10559–10566 CrossRef CAS.
- T. Papadam, G. Goula and I. V. Yentekakis, Int. J. Hydrogen Energy, 2012, 37, 16680–16685 CrossRef CAS.
- K. Girona, J. Laurencin, J. Fouletier and F. Lefebvre-Joud, J. Power Sources, 2012, 210, 381–391 CrossRef CAS.
- L. Kleiminger, T. Li, K. Li and G. H. Kelsall, Electrochim. Acta, 2015, 179, 565–577 CrossRef CAS.
- B. G. Higgins and H. Binous, Binary Diffusion Coefficients for Gases, Wolfram Demonstrations Project, 2013 Search PubMed.
- Average Price of Electricity to Ultimate Customers by End-Use Sector, U.S. Energy Information Administration (EIA), 2019.
- S. G. Jadhav, P. D. Vaidya, B. M. Bhanage and J. B. Joshi, Chem. Eng. Res. Des., 2014, 92, 2557–2567 CrossRef CAS.
- M. Pérez-Fortes, J. C. Schöneberger, A. Boulamanti and E. Tzimas, Appl. Energy, 2016, 161, 718–732 CrossRef.
Footnote |
| † Electronic supplementary information (ESI) available. See DOI: 10.1039/d0ee00070a |
| This journal is © The Royal Society of Chemistry 2020 |

