
Karst landform-featured monolithic electrode for water electrolysis in neutral media†
Xueqing
Gao
a,
Yingdong
Chen
a,
Tong
Sun
b,
Jianmei
Huang
c,
Wei
Zhang
 *a,
Qiang
Wang
*c and
Rui
Cao
*ad
*a,
Qiang
Wang
*c and
Rui
Cao
*ad
aKey Laboratory of Applied Surface and Colloid Chemistry, Ministry of Education, School of Chemistry and Chemical Engineering, Shaanxi Normal University, Xi’an 710119, China. E-mail: zw@snnu.edu.cn; ruicao@ruc.edu.cn
bBruker (Beijing) Scientific Technology Co., Ltd, Beijing 100192, China
cCollege of Chemistry and Molecular Engineering, Nanjing Tech University, Nanjing 211816, China. E-mail: wangqiang@njtech.edu.cn
dDepartment of Chemistry, Renmin University of China, Beijing 100872, China
First published on 12th November 2019
Abstract
The development of cheap and efficient electrodes for water splitting is an ongoing challenge. Herein, a nickel foam-based monolithic electrode is reported with high performance for both hydrogen and oxygen evolution reactions in neutral media. The karst landform-featured electrode consists of metallic Ni in the valley areas and Ni/α-Ni(OH)2 heterostructures as towers on the surface. Remarkably, the electrode can switch between HER and OER reversibly and flexibly with long-term viability. Scanning electrochemical microscopy (SECM) analysis and computational studies proved the vital roles of the karst landform structure and the interface of the heterostructure in its efficient bifunctionality. Combined with a common photovoltaic cell, a water electrolysis cell with the bifunctional electrode can implement splitting of natural seawater (pH ∼ 8.0) with a high solar-to-hydrogen (STH) conversion efficiency of 16.5%. This cheap, flexible, robust, easily obtained and bifunctional electrode has potential applications for water splitting in the hydrogen economy.
Broader contextWater splitting is a very critical component in energy conversion strategies for artificial photosynthesis. However, the hydrogen evolution reaction (HER) and oxygen evolution reaction (OER) are thermodynamically unfavorable and kinetically sluggish, considerably limiting the overall energy conversion efficiency. Thus, investigating cheap, efficient and durable electrodes for water splitting is a huge challenge. This work presents a nickel foam-based monolithic electrode that catalyzes both hydrogen and oxygen evolution reactions in neutral media. Combined with a common photovoltaic cell, a water electrolysis cell with the bifunctional electrode can implement splitting of natural seawater with a high solar-to-hydrogen (STH) conversion efficiency of 16.5%. |
Introduction
Solar-driven water splitting provides a blueprint to store and transport sustainable energy in terms of hydrogen.1–4 Combining solar cells with water electrolysis cells, the photovoltaic water splitting is promising for high STH efficiency.5–7 In this process, the overpotentials required to reach considerable currents of the electrolysis cell are one of the controlling factors for the overall energy conversion efficiency.8–11 Thus, it is a prerequisite to develop cheap, efficient and durable electrodes.12On the basis of theoretical and experimental studies, the metal–metal (hydr)oxide interfaces are beneficial for water splitting.13–16 In the metal–metal (hydr)oxide heterojunctions, electrons can flow through the conductor–semiconductor interface due to the Mott–Schottky effect until the pseudo Fermi levels equilibrium is reached, leading to electron deficiency on the less noble side.17–20 The electron deficiency on the semiconductor side is helpful for oxidation reactions such as OER. For example, Janus Co/CoP nanoparticles as efficient Mott–Schottky electrocatalysts can work as bifunctional electrode materials for overall water splitting.19 A series of metal–semiconductor (Cu/CuOx, Co/CoOx, and CuCo/CuCoOx) hybrids as integrated core–shell Mott–Schottky architectures presented remarkable HER and OER performance.20 For HER, the formation of H2 begins with the dissociative adsorption of water on catalytic sites in many cases.21,22 In addition to the HER-favorable electron accumulation on the metal side, the metal (hydr)oxide plays a role in stimulating the dissociation of water with the creation of Had on the adjacent metal surface.23–30 With these considerations, Markovic and co-workers reported a series of catalysts with metal hydr(oxy)oxide–Pt interfaces. They correlated the maximum HER activity to the optimal interaction strength of OHad on the Ni hydr(oxy)oxide–Pt interface.23–25 Both Jin's and Tang's group prepared hybrid materials of single-layer Ni(OH)2 and Pt with optimized dissociative adsorption of water for efficient HER.26,27 Nevertheless, it is still an ongoing challenge to develop metal–metal (hydr)oxide heterostructures by swift and expedient methods for water splitting, especially the splitting of natural water that is rarely reported. Meanwhile, it is also of high significance to study the insights of the interface of heterostructures in promoting electrocatalysis.
Generally, loading powder catalysts on current collectors by binder and electrodepositing/growing catalysts directly on conductive substrates are widely applied in fabricating water splitting electrodes. However, both strategies lead to weak physical contact between electrocatalysts and current collectors, resulting in high charge resistance and poor stability. Thus, it is worthwhile to introduce monolithic electrode with chemically connected species on substrates to address the above-mentioned problems.31 Nickel foam (NF) with desirable 3D open-pore structure, excellent corrosion resistance, good electrical conductivity and cheap commercial cost has the potential for developing integrated electrode.32 In our previous studies, the NF-based integrated electrode from autologous growth of catalysts has proven to be highly active for water oxidation in strong alkaline solutions.33 However, very limited bifunctional catalysts are developed for highly efficient water splitting in neutral media, which is more affordable in real situations. Taking these factors into account, designing metal–metal (hydr)oxide interfaces in NF-based monolithic electrode for advanced HER and OER in neutral water would be critical.
Herein, NF with typical karst landform features (denoted as karst NF hereafter) was obtained by a convenient synergic chemical and electrochemical etching method. Besides the common advantages of NF, the karst NF has the following additional merits. (1) The karst landform structure largely increases the accessible surface area. (2) The surface Ni/α-Ni(OH)2 heterostructure is beneficial for the kinetics of both HER and OER. (3) The contact between catalysts (Ni/α-Ni(OH)2 heterostructures) and the current collector (metallic Ni) is chemically intimate, bringing about much reduced charge resistance and enhanced durability. Electrochemical studies demonstrate that this novel monolithic electrode has excellent performance for overall water splitting in neutral solutions, including natural seawater. Computational studies demonstrated the electron polarization at the interface of the heterostructure, which is beneficial for electrocatalysis. Scanning electrochemical microscopy mappings innovatively visualized the different evolution sites for H2 and O2.
Results and discussion
Synthesis and characterization of the karst NF
To prepare the karst NF, NF was firstly sonicated in HCl, water and ethanol to remove surface pollutants. Then, one piece of the pretreated NF (0.5 × 0.5 cm2) was used as the working electrode for controlled potential electrolysis (CPE) at 0.3 V vs. reversible hydrogen electrode (RHE, all potentials are vs. RHE hereafter unless otherwise stated) in 0.5 M H2SO4 for 5 min. This preparation process created a karst landform-featured surface of NF by the concerted chemical and electrochemical etching of metallic Ni within minutes (Fig. 1).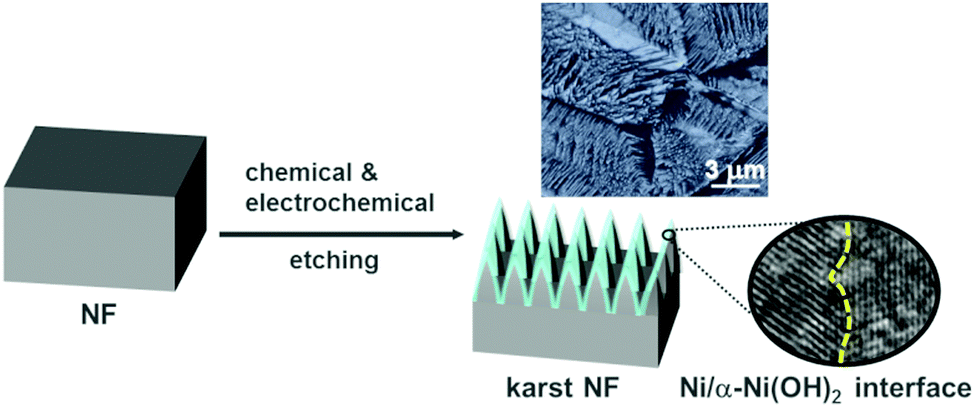 | ||
| Fig. 1 The illustration of the karst NF with Ni/α-Ni(OH)2 interface. | ||
The scanning electron microscopy (SEM) images of the blank NF and karst NF are shown in Fig. 2. The as-prepared karst NF preserves the 3D skeleton of NF. The metal domains are roughened to have a typical karst morphology with arrays of tall towers and deep valleys, dramatically increasing accessible surface area. Transmission electron microscopy (TEM) image indicates that the tower has a length of ∼500 nm and width of 100–200 nm. The detailed structure of the tower was characterized by high resolution TEM (HRTEM). In the central region, the lattice spacing at 0.205 nm is assigned to metallic Ni(111) facets.34 In the edge region, two different phases with a clear chemical interface are observed. The lattice fringes with spacing of 0.159 nm are indexed to the (110) facets of α-Ni(OH)2,15 which is from the epitaxial conversion of Ni. The elemental mapping images of Ni, O, and S (from H2SO4) demonstrate the uniform distribution of the surface Ni/α-Ni(OH)2 (Fig. S1, ESI†). The composition of the valley and the peak areas of the karst NF was analyzed by the EDX mapping and line scan patterns (Fig. 3), indicating the valley areas are rich in nickel metal and the peak areas are rich in hydroxides (proved by the incorporated sulfate, vide infra). The composition of the karst NF was also analyzed by Raman spectroscopy (Fig. 4a). Raman bands at 460, 2910 and 3628 cm−1 correspond to the lattice, 2nd order O–H bend and O–H stretch modes of α-Ni(OH)2, respectively.35 Additional peaks at 636 (v4) and 995 (v1) cm−1 are vibrational modes of adsorbed SO42−.36 These peaks shift to higher frequencies of free SO42−, due to its interaction with adjacent cations. Weak feature at ∼804 cm−1 corresponds to the surface NiOx. Moreover, the surface chemical states of the karst NF were examined by X-ray photoelectron spectroscopy (XPS) (Fig. 4b). The Ni 2p spectrum with Ni 2p3/2 main peaks at 852.0 and 855.6 eV confirms the Ni0 and NiII states of the surface catalyst.37 It is worth noting that the binding energy of Ni0 is slightly lower in Ni–Ni(OH)2 than that in Ni metal (∼852.6 eV), indicating rich charges in the Ni side; while the binding energy of Ni(OH)2 is slightly higher in Ni–Ni(OH)2 than that in Ni(OH)2 (∼854.9 eV), indicating deficient charges in the Ni(OH)2 side. These findings are further confirmed by computational studies (vide infra). Other valence state of Ni has also been detected due to the formation of surface NiOx.
 | ||
| Fig. 2 Morphological characterization of the karst NF. SEM images of (a−c) blank NF and (d−f) karst NF. (g) TEM and (h and i) HRTEM images of the tower in karst NF, showing metallic Ni in the bulk and Ni/α-Ni(OH)2 interface on the surface. | ||
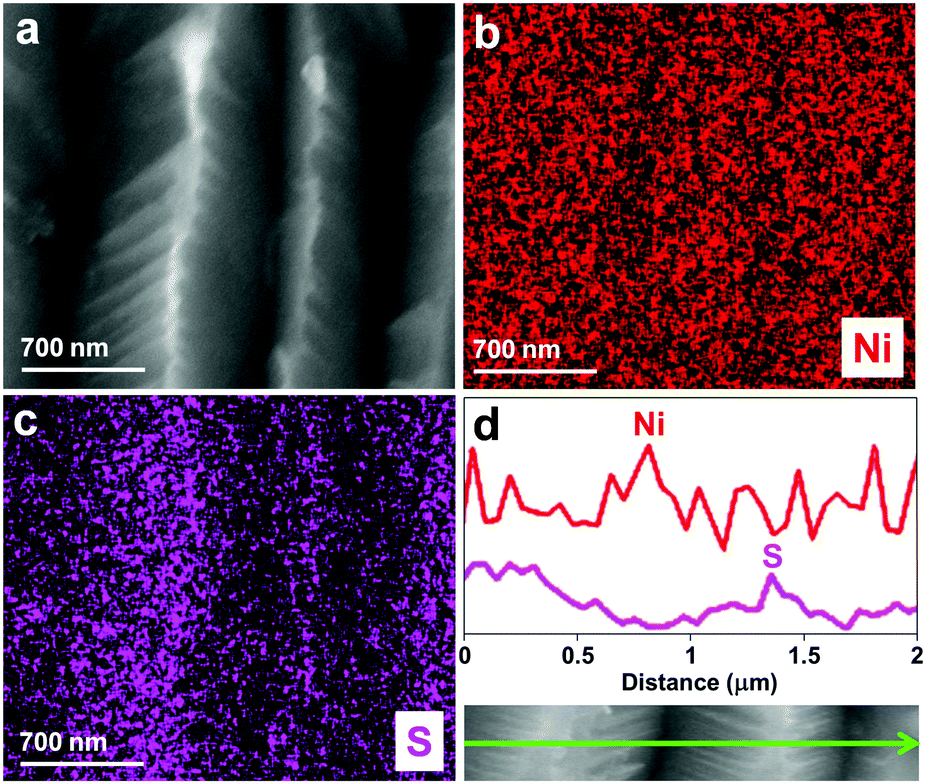 | ||
| Fig. 3 (a) SEM image, EDX (b and c) mapping and (d) line scanning patterns of karst NF, showing the abundance of Ni in the valleys and abundance of Ni(OH)2 with the intercalation of SO42− in the peak areas. | ||
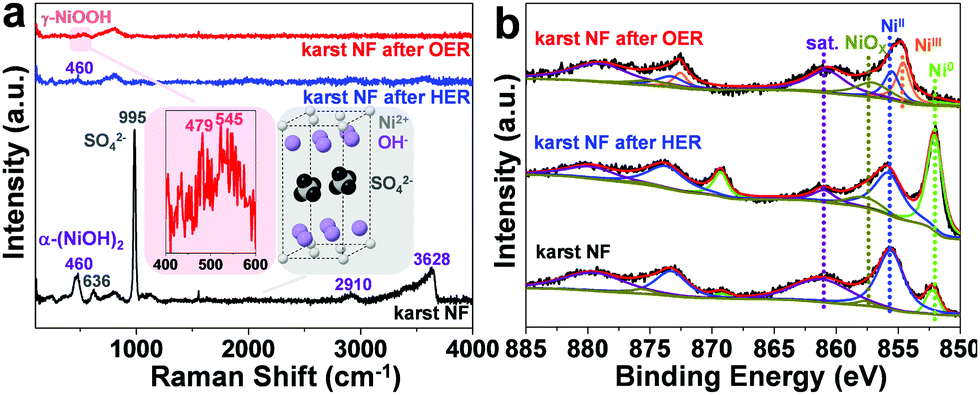 | ||
| Fig. 4 Spectral characterization of the karst NF. (a) Raman spectra and (b) narrow scan Ni 2p XPS spectra of karst NF and karst NF after HER or OER electrolysis at −0.21 and 1.91 V, respectively, without iR compensation. | ||
Electrocatalytic water splitting performance of the karst NF
The electrochemical performance of the karst NF was measured by linear sweep voltammetry (LSV) in 1.0 M pH = 7 phosphate buffered saline (PBS) solution (Fig. 5). The commercial Pt/C and Ir/C electrocatalysts on NF show expected high HER and OER activities with small overpotentials of 45 and 464 mV to drive a current density of 10 mA cm−2, respectively. Compared with the blank NF with very low activities, the karst NF from simple surface treatment of blank NF reveals much lower overpotentials of 110 mV (HER) and 432 mV (OER) at 10 mA cm−2. Notably, the HER and OER can be realized within one single cyclic voltammetry (CV) scan (Fig. 5c). Very few electrocatalysts are functional for both HER and OER in neutral solutions, and the activities of karst NF are superior to most electrocatalysts reported previously in near neutral solutions (Table S1, ESI†). The comparison of HER and OER performance for karst NF with other 3D-electrodes owning separate active sites are also provided in Tables S2 and S3 (ESI†) to demonstrate the advantage. The karst NF is much better than Pt/C to achieve large currents, indicating the enhanced mass diffusion. The Tafel slopes were determined to be 99 mV dec−1 for HER and 249 mV dec−1 for OER, respectively (Fig. S2, ESI†). The HER Tafel result indicates that the Volmer step (the first discharge of water) is the rate-limiting step.38 The surface Ni/α-Ni(OH)2 heterostructures can facilitate water dissociation in the following process: H2O + Ni + Ni(OH)2 + e− → Ni–Had + Ni(OH)2–OH−ad.30 For OER, the high Tafel slope indicates a slow discharge process, mainly attributed to the strong pre-catalytic events. The electrochemical performance of the karst NF was also measured in a 1.0 M KOH solution. As compared with the performance in PBS, the karst NF reveals much lower overpotentials of 60 mV (HER) and 293 mV (OER) at 10 mA cm−2. The Tafel slopes were determined to be 45 mV dec−1 for HER and 65 mV dec−1 for OER, respectively (Fig. S3, ESI†). The concentration of the substrates not only affects the rates but also the reaction paths of HER and OER.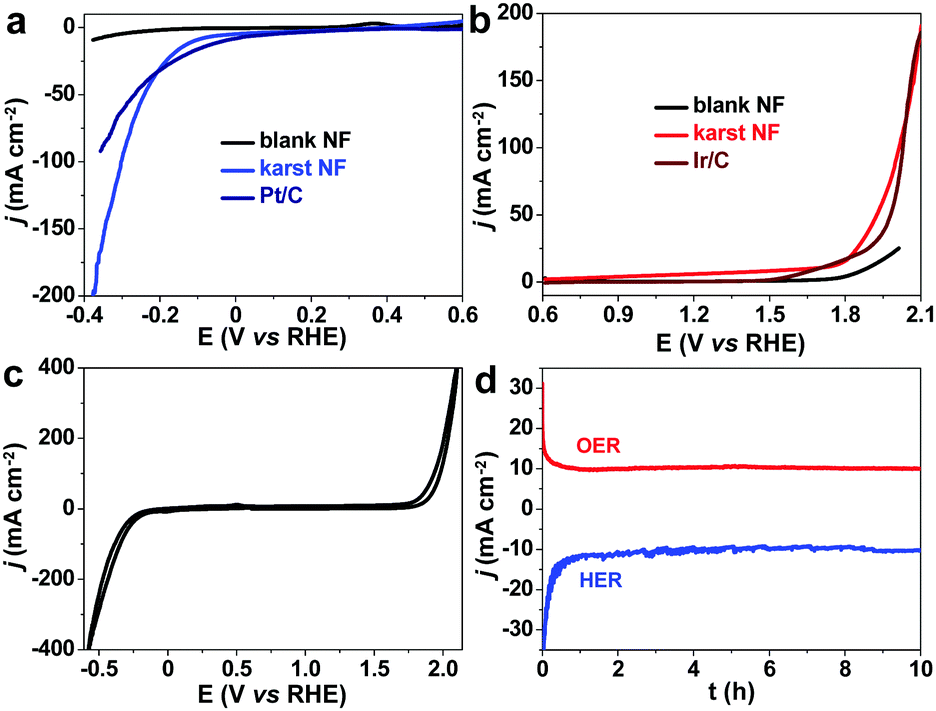 | ||
| Fig. 5 HER and OER electrocatalytic performance of the karst NF. Electrocatalytic (a) HER and (b) OER performance of black NF, karst NF and commercial electrocatalysts in 1.0 M pH = 7 PBS. (c) CV of the karst NF for both HER and OER in a single CV cycle. (d) Chronoamperometry of karst NF for HER and OER without iR compensation. | ||
The electrochemically active surface area (ECSA) of the electrode was measured using the coulombic charge quantities of surface redox reactions. The determined ECSA values for surface α-Ni(OH)2 and Ni0 are 0.84 and 0.77 cm2, respectively (see Fig. S4, ESI† for details). The LSV curves for HER and OER in PBS are normalized to the ECSAs (Fig. S5, ESI†), showing overpotentials of 190 mV (HER) and 648 mV (OER) to drive a current density of 10 mA cmECSA−2. On the basis of the ECSAs, we calculated the number of surface sites of α-Ni(OH)2 and Ni0 (see Fig. S6, ESI† for details) to derive the turnover frequency (TOF) values, which are 0.499j/(mA cm−2) and 0.744j/(mA cm−2) s−1 for HER and OER, respectively (Fig. S6, ESI†). The faradaic efficiency is calculated to be ∼100% for H2 and O2 in 1.0 M pH = 7 PBS and sea water, confirming that the evolved gases are from water splitting (Fig. S7, ESI†).
To investigate the stability of the karst NF, long-term chronoamperometry studies for HER at −0.21 V and OER at 1.91 V were carried out without iR compensation (Fig. 5d). The electrode displayed stable currents during 10 hour HER and OER, confirming its bifunctional activity stability in neutral conditions. Raman and XPS were conducted to analyze the surface reconstruction during HER and OER (Fig. 4). After 10 h HER chronoamperometry test at −0.21 V without iR compensation, part of α-Ni(OH)2 was reduced into metallic Ni with a decrease of NiII and an increase of Ni0 signals in the XPS analysis. Weak Raman peaks also indicate the reduced amount of α-Ni(OH)2 after HER. After 10 h OER chronoamperometry test at 1.91 V without iR compensation, the surface NiII species was oxidized into γ-NiOOH with Raman peaks at 479 and 545 cm−1.39 The XPS results also indicate the presence of NiIII and the reduced Ni0. The bifunctional karst NF showed reversible activity stability for HER and OER. If the surface of the electrode is deactivated after long-term reduction, the system can be easily switched for oxidation to regenerate the active surface, and vice versa. This idea has been proposed in fuel cell technologies.40 As shown in Fig. 6a–d, switched CPE is performed by alternating the electrode between cathode (blue lines) and anode (red lines). Obviously, this karst NF exhibits considerable activity and stability with fully reversible flexibility, which is rarely observed in bifunctional catalysts. After the polarization switch of HER (−0.21 V, 2 h, no iR compensation) and ORE (1.91 V, 2 h, no iR compensation), the karst NF was characterized by XPS (Fig. S8, ESI†). The coexistence of Ni0 and NiII state suggests the presence of surface Ni/α-Ni(OH)2 heterostructures, even though the composition of metallic Ni and α-Ni(OH)2 may change upon repeated switches. The SEM and TEM images of the sample after switches indicate the existence of interface and the karst landform-featured morphology (Fig. S9, ESI†). Furthermore, long term electrolysis results are provided in Fig. S10 (ESI†). It can be concluded that this cheap karst NF||karst NF cell is efficient and robust for electrocatalytic water splitting up to 200 h at high current densities.41,42 The evolution on the time of the surface Ni and α-Ni(OH)2 contents were indicated by ECSA measurements (Fig. S11, ESI†). With the electrolysis time going, the amount of α-Ni(OH)2 decreases in HER, and amount of Ni reduces in OER (Table S4, ESI†). Although the proportion of Ni and α-Ni(OH)2 changed during HER or OER process, their electrocatalytic activity is stable (Fig. S10, ESI†). In addition, the electrochemical impedance spectroscopy (EIS) tests show that the charge transfer impedances of the karst NF do not change obviously with the progressing of electrolysis (Fig. S12, ESI†).
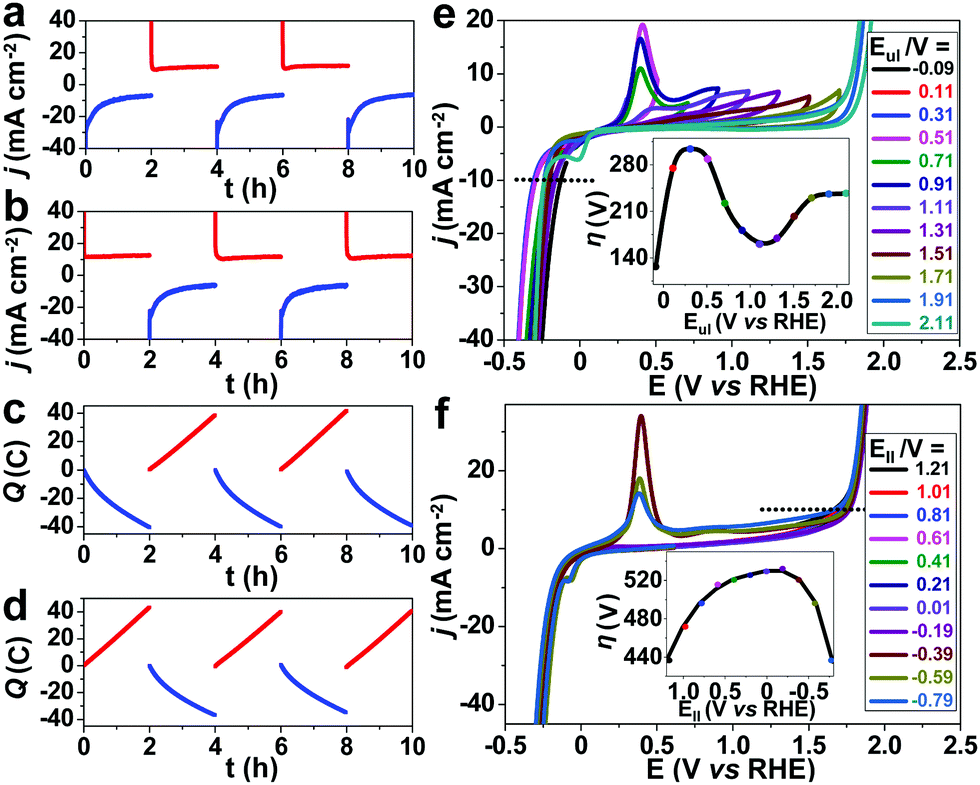 | ||
| Fig. 6 Surface evolution analysis of the karst NF. (a and b) CPEs and (c and d) passed charges with the potential switched between reductive (−0.21 V, blue lines) and oxidative (1.91 V, red lines) conditions. CVs of the karst NF at different (e) upper limit potentials (Eul) and (f) lower limit potentials (Ell). The inset is the overpotentials at 10 mA cm−2 plotted against Eul or Ell. | ||
To shed more light on the surface evolution of the karst NF during cathodic and anodic scans, electrochemical studies were conducted by varying the upper limit potential (Eul) or lower limit potential (Ell) in CV (Fig. 6e and f).30 On the one hand, the overpotential of HER at 10 mA cm−2 increases when Eul is increased from −0.09 to 0.31 V and then reaches a trough at the range of Eul from 0.51 to 2.0 V (Fig. 6e, inset). It indicates that moderate composition of metallic Ni and α-Ni(OH)2 is favorable for HER. In the range of Eul from 0.51 to 0.91 V, the electrocatalytic activity improves because of the formation of Ni(OH)2 43 on the surface. However, much higher Eul will bring about excess α-Ni(OH)2 and γ-NiOOH
 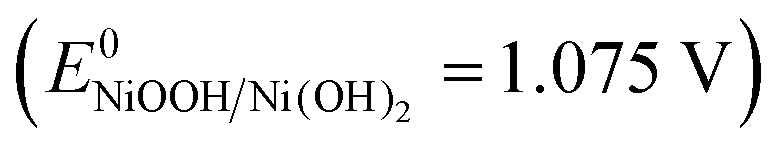 43 to passivate surface active sites. In addition, a broad anodic peak is observed at ∼0.4 V in the Eul range of 0.91 to 1.31 V, and it splits into two weaker anodic peaks at ∼0.35 and ∼0.5 V at higher Eul (Fig. S13, ESI†). The latter case may stem from the oxidations of discriminative Ni and α-Ni(OH)2. On the other hand, the OER activity shows a volcano-shape relationship with respect to the Ell and peaks at about Ell = −0.19 V (Fig. 6f inset). The OER activity decrease with the decrease of Ell at >−0.19 V. A further decrease of Ell at <−0.19 V can increase the activity of the OER, owing to the formation of Ni/α-Ni(OH)2 heterogeneous structure. At Ell from −0.39 to −0.79 V, a weaker Ni oxidation peak is observed, which is probably due to the coverage of surface Ni by the large amount of H2 gas formed at more negative potentials or the depletion of surface Ni during the H2 formation at more negative potentials.
To obtain the correlation between the surface topography and the electrocatalytic activity, we performed the PeakForce scanning electrochemical microscopy (PF-SECM) studies of the karst NF for HER and OER. The protocol is illustrated in Fig. 7a. First, the 3D topographical profile of the electrode surface was captured by traditional tapping mode, showing the valley areas (dark) and tower areas (bright) (Fig. 7b). During the electrochemical scans, the lift height between the reaction surface and the tip was fixed at 120 nm based on the topographical profile to record the currents. The corresponding 3D electrocatalytic currents are displayed in Fig. 7c and d for HER and OER, respectively. For HER, the peak currents are mainly observed in two valley areas of the karst NF, as indicated by the dark areas in the topographical profile and the blue-white areas in the electrochemical profile. For OER, the peak currents are mainly observed in the tower areas of the karst NF, as indicated by the bright areas in the topographical profile and the pink-red areas in the electrochemical profile. These deep valley areas are the exposed metallic sites from the bulk, which can proceed the formation of Ni–Had. The tower areas are the hydroxides for oxygen evolution. As discussed above, the different parts in the Ni/α-Ni(OH)2 heterostructures have different functions in HER and OER. The metallic site generates the Ni–Had for subsequent hydrogen formation and the other part assist the water dissociation by accepting the leaving hydroxide anion. The hydroxides are the evolution sites for OER, and the polarization of electrodes at the interface of the heterogeneous helps for the electron depletion on the NiII to boost OER. This in situ SECM observation innovatively demonstrates the importance of different reaction sites for HER and OER, which can be realized by the novel karst topographic features in our electrode, for transition metal-based bifunctional water splitting electrodes.
 | ||
| Fig. 7 Scanning electrochemical microscopy studies of the karst NF for both HER and OER. (a) The illustration of substrate generation/tip collection (SG/TC) mode of SECM experiments on the karst NF. (b) 3D surface topography of the karst NF. (c and d) The corresponding 3D electrochemical current profiles for (c) HER and (d) OER captured at a lift height of 120 nm. | ||
We performed computational studies to further consolidate the understandings on the Ni–Ni(OH)2 heterostructure in promoting both HER and OER (Fig. 8). At the interface of the heterostructure, the electrons transferred from the hydroxide to the metal (Fig. 8a). The resulted polarization of the electrons at the interface can, on one hand, promote the dissociation of the H–OH bond and, on the other hand, stabilize the Ni–Had on the metallic Ni centers. The synergic effects have also been observed in oxygen reduction reaction recently.44 The density of states (DOS) of different models are provided in Fig. 8b. The overall DOS of the Ni–Ni(OH)2 heterostructure indicates an expected strong metallic nature. Interestingly, the partial DOS of the α-Ni(OH)2 in the Ni/α-Ni(OH)2 (Fig. 8b middle) shows continuous spin-up bands through the Fermi level, indicating some semi-metallic nature of the surface Ni(OH)2 caused by the formed electric field at the interface. On contrast, the DOS of pure Ni(OH)2 indicates normal signals of semiconductors. The semi-metallic nature of the surface Ni(OH)2, as induced by the interface, should be favorable in electrocatalysis by improving charge transfer.45 With the information of band structures and electrostatic potential calculations (Fig. S14, ESI†), the energy levels of the Ni metal and the Ni(OH)2 semiconductor are plotted in Fig. 8c. As the work function of the metal is larger than the n-type semiconductor in the heterostructure, a zone of charge and upward band bending is formed with the depletion of electrons in the semiconductor to achieve the same position of the Fermi levels. After the formation of heterostructure between the two components, electron polarization happens, which is consistent with the results in Fig. 8a. The redistribution of electrons at the Ni/α-Ni(OH)2 interface results in upward band bending in the semiconductor. The metal side is negatively charged, which is favorable to form the key M–H intermediate. The oxidation of the semiconductor enhances the accumulation of positive holes to boost OER. The accumulated carriers are consumed properly in HER (electrons) and OER (holes) to reduce the surface degradation.
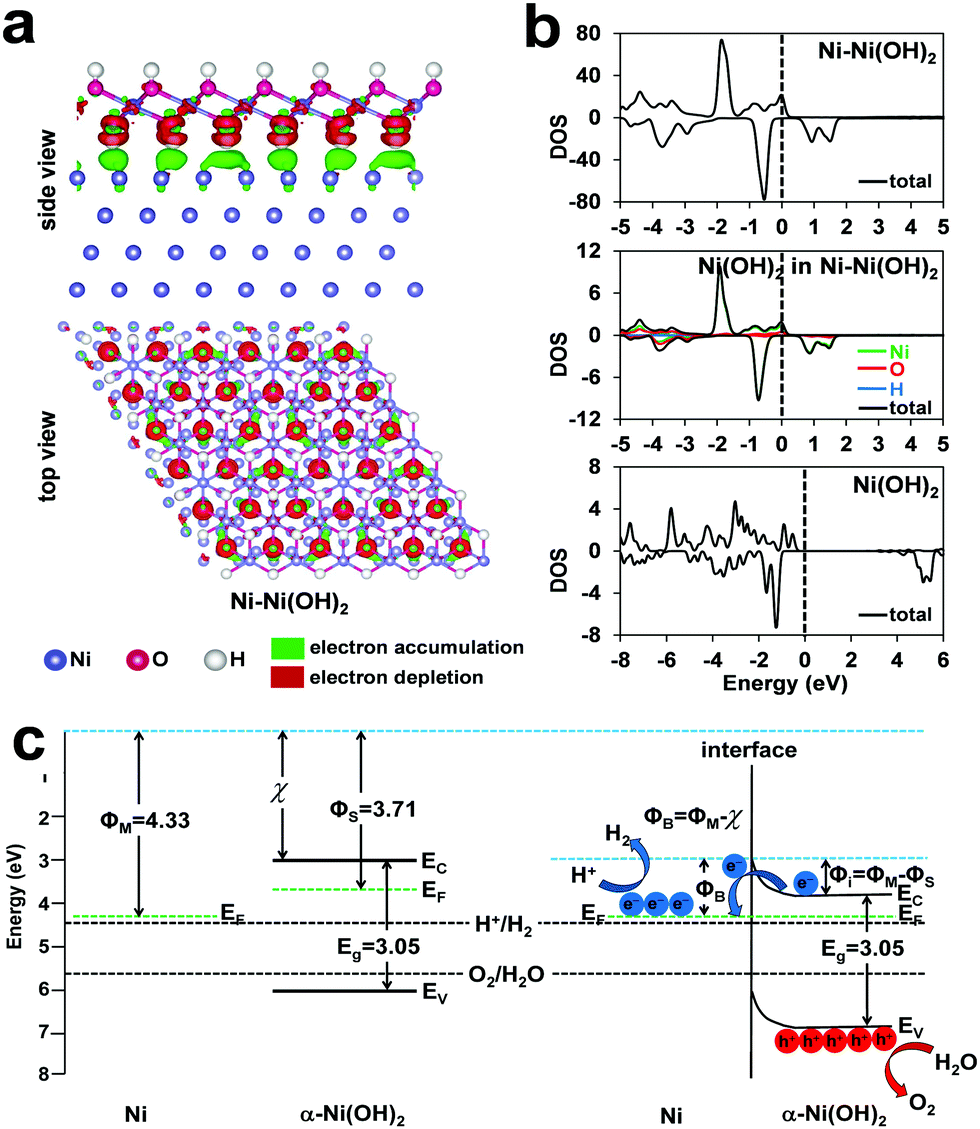 | ||
| Fig. 8 Computational studies. (a) The charge density distribution at the interface of the Ni–Ni(OH)2 heterostructure. (b) The density of states (DOS) of the Ni–Ni(OH)2 (top), the Ni(OH)2 in Ni–Ni(OH)2 (middle) and the bare Ni(OH)2 (bottom). (c) The energy levels of the two components in Ni–Ni(OH)2 before and after contact. The black dash lines are the redox potentials of water splitting. | ||
To demonstrate the STH concept using our efficient electrode, a two-electrode cell (karst NF||karst NF) was fabricated for electrocatalytic overall water splitting in 1.0 M pH = 7 PBS solution and natural seawater. Compared with the expensive Pt/C||Ir/C cell, our cost-efficient cell needs much lower voltages of 2.0 and 2.2 V to drive current densities of 30 and 100 mA cm−2 in PBS solution, respectively (Fig. 9a). For practical concerns, we also used natural seawater (pH = ∼8) to carry out water electrolysis. A current density of 10 mA cm−2 was recorded at an applied bias of 1.79 V, even better than that in PBS solution. Long-term stability of these cells had been evaluated at constant current density of 10 mA cm−2 (Fig. 9b). Compared with the Pt/C‖Ir/C cell with obvious attenuation, the karst NF||karst NF cell displayed a stable cell voltage during 24 h electrolysis. The cell voltage fluctuated dramatically in natural seawater due to the complicated composition of seawater. The composition of seawater is complex with abundant dissolved salts, microorganisms and gases. Thus, we considered major ions including Cl−, Na+, SO42− and Mg2+ for their interactions with the electrode during seawater splitting. After a chronopotentiometry test at a constant current density of 10 mA cm−2 in natural seawater for 5 h, the surface of the anode and cathode are analyzed by EDX, XPS and Raman spectroscopy (Fig. S15, ESI†). For cathode, EDX confirms that precipitates containing Mg are deposited on the surface. The Mg 2p XPS spectrum with a main peak at 49.3 eV confirms the MgII state of the surface precipitates. Raman bands at 460 and 3628 cm−1 correspond to the lattice and O–H stretch modes of α-Ni(OH)2. Additional peaks at 280 (Eg lattice mode), 725 (Eg O–H bend) and 3652 (A1g O–H stretch) cm−1 are assigned to the deposited Mg(OH)2.46 These analyses indicate the electrodeposition of Mg(OH)2 during HER in seawater on the karst NF electrode. For anode, EDX confirms that there is no obvious change of the electrode. The S 2p XPS spectrum with a main peak at 168.3 eV confirms the presence of sulfate on the surface after OER. Raman bands at 479 and 545 cm−1 correspond to the surface γ-NiOOH formed during OER. Additional peaks at 636 (v4) and 1004 (v1) cm−1 further suggest the presence of sulfate. Peaks at 1439 cm−1 and 1596 cm−1 correspond to S–O vibration. These spectral analyses indicate the occurrence of polyatomic sulfate passivating layers during OER process in seawater on the karst NF electrode. These formed polyatomic sulfate layers hinder Cl− and protect the electrode itself from corrosion in seawater.41
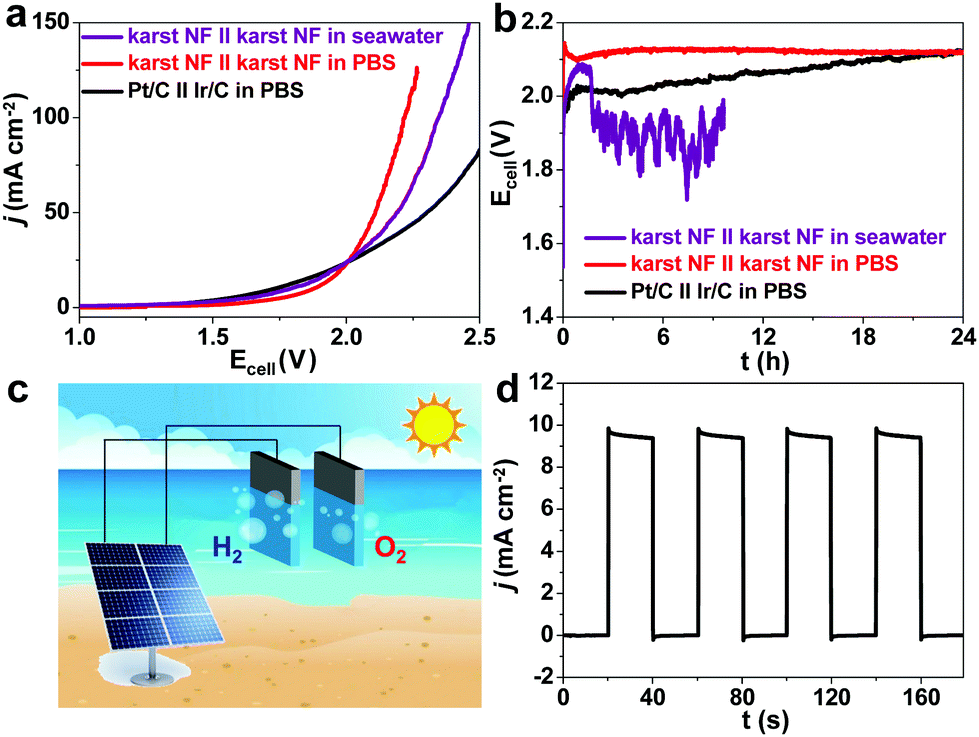 | ||
| Fig. 9 Solar-driven seawater splitting. (a) LSVs of the karst NF‖karst NF and Pt/C‖Ir/C cells for water electrolysis in neutral media. (b) Stability test of water electrolysis cells under a current density of 10 mA cm−2 without iR compensation. (c) Schematic illustration of the solar seawater splitting cell without additional applied potential. (d) Current density–time profile of the integrated seawater splitting device under chopped illumination. | ||
Finally, the karst NF-based cell was wired to a commercial planar silicon solar cell for light-driven seawater splitting (Fig. 9c).5,47 At sun radiation of 70 mW cm−2, the Si solar cell exhibits an open-circuit voltage of 2.3 V with a photon-current conversion efficiency of 25.5% (Fig. S16, ESI†). The integrated seawater splitting device generated a current density of 9.4 mA cm−2 with the repeated on–off cycles of simulated sunlight illumination (Fig. 9d), during which bubbles of oxygen and hydrogen were released from the electrodes. An electric-to-hydrogen conversion efficiency of 64.7% and an overall STH conversion efficiency of 16.5% were obtained from seawater splitting, which is superior to most water electrolysis cells reported previously even in strong alkaline solutions (Table S5, ESI†). Of particular note is that a cheap Si solar cell with moderate solar-to-electricity conversion efficiency is used in our STH test.
Conclusions
We reported a NF-based monolithic electrode that is flexibly bifunctional for both electrocatalytic HER and OER in natural neutral media. The electrode was prepared by a convenient synergic chemical and electrochemical etching of cheap NF, forming typical karst landform-featured towers on the surface. This novel karst landform brings about both HER and OER sites on the surface of NF. It can fulfill efficient solar-driven overall seawater splitting with a STH conversion efficiency of 16.5% (the solar-to-electricity conversion efficiency of the applied Si solar cell is 25.5%). The HER evolution sites on the surface of the karst NF are observed to be the exposed metallic areas by PeakForce scanning electrochemical microscopy. Because the blank NF has negligible electrocatalytic activity, we believe that the surface heterostructure on karst NF is essential for electrocatalysis. With the help from computational studies, the formation of heterostructures brings about electron polarization at the interface of the heterostructures. The slightly negative-charged Ni0 atoms can act as better accommodation sites for Ni–Had. The slightly positive-charged Ni(OH)2 side can accept hydroxide anions to boost the dissociation of water molecules and also to enhance the kinetics of OER. In addition, because of its electron-donation to the inner Ni metal, the surface Ni(OH)2 species is calculated to show some semi-metallic nature for better charge conductivity in electrocatalysis. In sum, the enhanced catalytic performance of the karst NF was due to the following reasons. (1) Surface Ni/α-Ni(OH)2 heterostructures are beneficial for the kinetics of both HER and OER. (2) The karst landform morphology ensures abundant catalytic sites and facile mass diffusion. (3) The chemically intimate contact between the autologous catalyst and current collector reduces the charge transfer resistance and strengthens the durability. This bifunctional, efficient, easily obtained and cheap monolithic electrode is affordable for applications in future hydrogen technologies.Experimental section
Preparation of the karst NF
Nickel foam (NF) was sonicated in 2 M HCl, water and ethanol for 30 min in turn to remove the surface oxides and pollutants. Electrochemical modification of the NF working electrode (working area: 0.5 × 0.5 cm2) was conducted in a conventional three-electrode setup, with saturated Ag/AgCl as the reference electrode and graphite rod as the counter electrode. In a typical procedure to obtain the karst NF, controlled potential electrolysis (CPE) of the pretreated NF was conducted at 0.3 V in a 0.5 M H2SO4 electrolyte for 5 min. The obtained karst NF was collected by washing with water and ethanol for several times and was stocked in ethanol for subsequent uses.Physical characterizations
The transmission electron microscopy (TEM) images were taken using a FEI Tecnai G2 F20 field transmission electron microscopy operated at 200 kV. Energy-dispersive X-ray analysis (EDX) and the elemental mappings were conducted on an AMETEK Materials Analysis EDX equipped on the TEM. The samples were exfoliated and dispersed on carbon-coated copper grids for TEM analysis. The scanning electron microscope (SEM) images were observed on a Hitachi SU8020 cold-emission field emission SEM with an accelerating voltage of 5 kV. The Raman spectra were recorded on a Renishaw inVia Reflex confocal Raman microscope. The X-ray photoelectron spectroscopy (XPS) was carried out on a Kratos AXIS ULTRA using monochromatic Al Kα radiator (1486.6 eV) with photoelectron take-off angle of 90° with respect to the surface plane. Corrections of the binding energy were carried out using C 1s peak at 284.5 eV.Electrochemical studies
All electrochemical experiments were performed using a CH Instruments Electrochemical Analyzer (CHI 660E) at room temperature. A standard three-electrode system, which consists of a graphite rod as the counter electrode, a saturated Ag/AgCl as the reference electrode, and the karst NF as the working electrode (0.5 × 0.5 cm2), was used for all electrochemical experiments. Potentials in this study were reported against the reversible hydrogen electrode (RHE) based on the equation: ERHE = EAg/AgCl + (0.197 + 0.0591 × pH) V. Linear sweep voltammograms (LSV), at a scan rate of 5 mV s−1, were recorded in a 15 mL of N2-saturated 1.0 M pH = 7 phosphate buffered saline (PBS) solution. The LSV measurements were iR compensated at 90%. Tafel plots were acquired by plotting the overpotentials versus the logarithm of the steady state current densities. Chronopotentiometry test was recorded under the same experimental setup in a fritted cell without the iR-drop compensation. Two-electrode setup for PBS solution and seawater electrolysis was made using the karst electrodes as the anode and cathode for LSV curve and electrolysis at room temperature. The PeakForce scanning electrochemical microscopy (PF-SECM) measurements were performed on Bruker Dimension ICON atomic force microscope (AFM) equipped with standard PeakForce SECM accessories. In PF-SECM imaging, the probe moved alternately in PeakForce tapping (PFT) and lift modes. In PFT mode, we captured the topographical profile. In lift mode, the tip did not oscillate and followed the topographical profile obtained by the previous PFT scan at a defined height above the surface. In this work, the lift height was 120 nm. Electrochemical current information was captured during the lift scan. For the electrochemical studies, the electrolyte contained 5 mM [Ru(NH3)6]3+ and 1.0 M PBS. The former was used to detect the working state of the probe. A CHI 760E bipotentiostat (CH Instruments) was used to control the electrochemical conditions. The electrochemical cell had a Pt wire counter electrode, a Ag/AgCl reference electrode, the nanoelectrode AFM probe and the sample working electrodes. In the HER SECM scan, the tip was biased at 0.7 V, while the sample was held at −0.65 V vs. Ag/AgCl. In the OER SECM scan, the tip was biased at −0.65 V, while the sample was held at 1.2 V vs. Ag/AgCl. Electrochemical impedance spectroscopy (EIS) measurements were performed by using an AC voltage with 5 mV amplitude in a frequency range from 0.1 Hz to 1 MHz under 1.0 M PBS solution at a potential of −0.21 and 1.91 V (vs. RHE) respectively. The Nyquist plots were thus obtained based on the EIS data.For comparative studies, the Pt/C and Ir/C working electrode was prepared through a drop-casting method and the typical procedure was as follows. A catalyst ink was prepared by dispersing 2 mg of the sample powder in 1 mL of water–ethanol solution at volume ratio of 2![[thin space (1/6-em)]](https://www.rsc.org/images/entities/char_2009.gif) :1 containing 30 μL of Nafion solution. The mixture was treated by sonication until a homogeneous suspension was obtained. The working electrode was prepared by loading 62.5 μL of the catalyst ink evenly on the effective working area of the blank NF and drying at room temperature. The mass loading of the catalysts on the working electrodes were all 0.5 mg cm−2.
:1 containing 30 μL of Nafion solution. The mixture was treated by sonication until a homogeneous suspension was obtained. The working electrode was prepared by loading 62.5 μL of the catalyst ink evenly on the effective working area of the blank NF and drying at room temperature. The mass loading of the catalysts on the working electrodes were all 0.5 mg cm−2.
Computational studies
Spin-polarized computations were performed using the projector augmented wave (PAW) method for electron ion interactions using the Vienna Ab Initio Simulation Package (VASP).48–50 The generalized gradient approximation (GGA) with the Perdew–Burke–Ernzerhof (PBE) was used to treat the exchange–correlation density functional.51,52 The cutoff energy for the plane-wave basis set was set to 400 eV, and the Brillouin-zone integrations were done using a 7 × 7 × 1 k-point mesh for geometry optimizations.53 The electronic self-consistency criterion was set to 10−6 eV. Each vacuum region was at least 12 Å in the direction perpendicular to the interface to avoid interaction with their own images. All the atoms in the Ni(OH)2 unit cell were fully relaxed, while the bottom layer of Ni(111) were fixed, other three layers were allowed to relax during geometry optimization. In our system, we focused on the heterostructures between Ni and Ni(OH)2. The crystal structures of both parts are assumed by TEM analysis. We chose to put one layer of Ni(OH)2 atop Ni lattice to study the detailed information about the heterostructure. Although the actual surface Ni(OH)2 may have more than one layer, the interactions between layers in Ni(OH)2 are mainly van der Waals forces. More layers of Ni(OH)2 would not essentially affect the heterostructure but largely increase computation complexity. In order to avoid the shortcoming of conventional PBE calculation, the hybrid Heyd–Scuseria–Ernzerhof functional (HSE06)54 calculations were used to calculate the accurate electronic structure and band gap. The optimized lattice constant of the monolayer Ni(OH)2 is defined as 3.13 Å.Conflicts of interest
W. Z., X. G. and R. C. filed a Chinese patent application (no. 2018102431344) based on the work reported herein.Acknowledgements
We are grateful for the Starting Research Funds of Shaanxi Normal University, and the National Natural Science Foundation of China (Grant No. 21503126, 21573139, 21773146 and 21872092).References
- Y. Tachibana, L. Vayssieres and J. R. Durrant, Nat. Photonics, 2012, 6, 511–518 CrossRef CAS.
- J. Qi, W. Zhang and R. Cao, Adv. Energy Mater., 2018, 8, 1701620 CrossRef.
- I. Staffell, D. Scamman, A. V. Abad, P. Balcombe, P. E. Dodds, P. Ekins, N. Shah and K. R. Ward, Energy Environ. Sci., 2019, 12, 463–491 RSC.
- L. Kornblum, D. P. Fenning, J. Faucher, J. Hwang, A. Boni, M. G. Han, M. D. Morales-Acosta, Y. Zhu, E. I. Altman, M. L. Lee, C. H. Ahn, F. J. Walker and Y. Shao-Horn, Energy Environ. Sci., 2017, 10, 377–382 RSC.
- J. Luo, J. H. Im, M. T. Mayer, M. Schreier, M. K. Nazeeruddin, N. G. Park, S. D. Tilley, H. J. Fan and M. Grätzel, Science, 2014, 345, 1593–1596 CrossRef CAS.
- J. Li, Y. Wang, T. Zhou, H. Zhang, X. Sun, J. Tang, L. Zhang, A. M. Al-Enizi, Z. Yang and G. Zheng, J. Am. Chem. Soc., 2015, 137, 14305–14312 CrossRef CAS.
- Y. Xin, X. Kan, L. Y. Gan and Z. Zhang, ACS Nano, 2017, 11, 10303–10312 CrossRef CAS.
- S. Mukhopadhyay, J. Debgupta, C. Singh, A. Kar and S. K. Das, Angew. Chem., Int. Ed., 2018, 57, 1918–1923 CrossRef CAS.
- J. Wang, H. Zhang and X. Wang, Small Methods, 2017, 1, 1700118 CrossRef.
- S. Anantharaj, S. R. Ede, K. Karthick, S. S. Sankar, K. Sangeetha, P. E. Karthik and S. Kundu, Energy Environ. Sci., 2018, 11, 744–771 RSC.
- J. A. Gauthier, C. F. Dickens, L. D. Chen, A. D. Doyle and J. K. Norskov, J. Phys. Chem. C, 2017, 121, 11455–11463 CrossRef CAS.
- Y. P. Zhu, T. Y. Ma, M. Jaroniec and S. Z. Qiao, Angew. Chem., Int. Ed., 2017, 56, 1324–1328 CrossRef CAS.
- H. Jin, J. Wang, D. Su, Z. Wei, Z. Pang and Y. Wang, J. Am. Chem. Soc., 2015, 137, 2688–2694 CrossRef CAS.
- X. Liu, W. Liu, M. Ko, M. Park, M. G. Kim, P. Oh, S. Chae, S. Park, A. Casimir, G. Wu and J. Cho, Adv. Funct. Mater., 2015, 25, 5799–5808 CrossRef CAS.
- Z. Xing, L. Gan, J. Wang and X. Yang, J. Mater. Chem. A, 2017, 5, 7744–7748 RSC.
- J. Wang, Y. Xie, Y. Yao, X. Huang, M. Willinger and L. Shao, J. Mater. Chem. A, 2017, 5, 14758–14762 RSC.
- X. H. Li and M. Antonietti, Chem. Soc. Rev., 2013, 42, 6593–6604 RSC.
- J. Ren, M. Antonietti and T.-P. Fellinger, Adv. Energy Mater., 2015, 5, 1401660 CrossRef.
- Z.-H. Xue, H. Su, Q.-Y. Yu, B. Zhang, H.-H. Wang, X.-H. Li and J.-S. Chen, Adv. Energy Mater., 2017, 7, 1602355 CrossRef.
- J. Hou, Y. Sun, Y. Wu, S. Cao and L. Sun, Adv. Funct. Mater., 2018, 28, 1704447 CrossRef.
- X. Zou and Y. Zhang, Chem. Soc. Rev., 2015, 44, 5148–5180 RSC.
- Y. Shi and B. Zhang, Chem. Soc. Rev., 2016, 45, 1529–1541 RSC.
- R. Subbaraman, D. Tripkovic, D. Strmcnik, K. C. Chang, M. Uchimura, A. P. Paulikas, V. Stamenkovic and N. M. Markovic, Science, 2011, 334, 1256–1260 CrossRef CAS.
- R. Subbaraman, D. Tripkovic, K. C. Chang, D. Strmcnik, A. P. Paulikas, P. Hirunsit, M. Chan, J. Greeley, V. Stamenkovic and N. M. Markovic, Nat. Mater., 2012, 11, 550–557 CrossRef CAS.
- N. Danilovic, R. Subbaraman, D. Strmcnik, K.-C. Chang, A. P. Paulikas, V. R. Stamenkovic and N. M. Markovic, Angew. Chem., Int. Ed., 2012, 51, 12495–12498 CrossRef CAS.
- L. Wang, C. Lin, D. Huang, J. Chen, L. Jiang, M. Wang, L. Chi, L. Shi and J. Jin, ACS Catal., 2015, 5, 3801–3806 CrossRef CAS.
- H. Yin, S. Zhao, K. Zhao, A. Muqsit, H. Tang, L. Chang, H. Zhao, Y. Gao and Z. Tang, Nat. Commun., 2015, 6, 6430 CrossRef CAS.
- M. Gong, W. Zhou, M. C. Tsai, J. Zhou, M. Guan, M. C. Lin, B. Zhang, Y. Hu, D. Y. Wang, J. Yang, S. J. Pennycook, B. J. Hwang and H. Dai, Nat. Commun., 2014, 5, 4695 CrossRef CAS.
- X. Yun-Fei, G. Min-Rui, Z. Ya-Rong, J. Jun and Y. Shu-Hong, Angew. Chem., Int. Ed., 2013, 52, 8546–8550 CrossRef.
- Z. Liang, H. S. Ahn and A. J. Bard, J. Am. Chem. Soc., 2017, 139, 4854–4858 CrossRef CAS.
- B. Q. Li, C. Tang, H. F. Wang, X. L. Zhu and Q. Zhang, Sci. Adv., 2016, 2, e1600495 CrossRef.
- H. Yang, C. Wang, Y. Zhang and Q. Wang, Sci. China Mater., 2019, 62, 681–689 CrossRef CAS.
- W. Zhang, J. Qi, K. Liu and R. Cao, Adv. Energy Mater., 2016, 6, 1502489 CrossRef.
- N. K. Chaudhari, H. Jin, B. Kim and K. Lee, Nanoscale, 2017, 9, 12231–12247 RSC.
- D. S. Hall, D. J. Lockwood, S. Poirier, C. Bock and B. R. MacDougall, J. Phys. Chem. A, 2012, 116, 6771–6784 CrossRef CAS.
- H. Schulze, N. Weinstock, A. Müller and G. Vandrish, Spectrochim. Acta, Part A, 1973, 29, 1705–1709 CrossRef.
- M. C. Biesinger, B. P. Payne, L. W. M. Lau, A. Gerson and R. S. C. Smart, Surf. Interface Anal., 2009, 41, 324–332 CrossRef CAS.
- B. You, X. Liu, G. Hu, S. Gul, J. Yano, D. E. Jiang and Y. Sun, J. Am. Chem. Soc., 2017, 139, 12283–12290 CrossRef CAS.
- R. D. Smith and C. P. Berlinguette, J. Am. Chem. Soc., 2016, 138, 1561–1567 CrossRef CAS.
- M. Neergat, T. Seiler, E. R. Savinova and U. Stimming, J. Electrochem. Soc., 2006, 153, A997–A1003 CrossRef CAS.
- Y. Kuang, M. J. Kenney, Y. Meng, W.-H. Hung, Y. Liu, J. E. Huang, R. Prasanna, P. Li, Y. Li, L. Wang, M.-C. Lin, M. D. McGehee, X. Sun and H. Dai, Proc. Natl. Acad. Sci. U. S. A., 2019, 116, 6624–6629 CrossRef CAS.
- A. Sahasrabudhe, H. Dixit, R. Majee and S. Bhattacharyya, Nat. Commun., 2018, 9, 2014 CrossRef.
- B. Beverskog and I. Puigdomenech, Corros. Sci., 1997, 39, 969–980 CrossRef CAS.
- Y. Wang, Y. Yang, S. Jia, X. Wang, K. Lyu, Y. Peng, H. Zheng, X. Wei, H. Ren, L. Xiao, J. Wang, D. A. Muller, H. D. Abruna, B. J. Hwang, J. Lu and L. Zhuang, Nat. Commun., 2019, 10, 1506 CrossRef.
- L. Tao, M. Qiao, R. Jin, Y. Li, Z. Xiao, Y. Wang, N. Zhang, C. Xie, Q. He, D. Jiang, G. Yu, Y. Li and S. Wang, Angew. Chem., Int. Ed., 2019, 58, 1019–1024 CrossRef CAS.
- P. Dawson, C. D. Hadfield and G. R. Wilkinson, J. Phys. Chem. Solids, 1973, 34, 1217–1225 CrossRef CAS.
- J. Jia, L. C. Seitz, J. D. Benck, Y. Huo, Y. Chen, J. W. D. Ng, T. Bilir, J. S. Harris and T. F. Jaramillo, Nat. Commun., 2016, 7, 13237 CrossRef CAS PubMed.
- G. Kresse and D. Joubert, Phys. Rev. B: Condens. Matter Mater. Phys., 1999, 59, 1758–1775 CrossRef CAS.
- G. Kresse and J. Furthmüller, Comput. Mater. Sci., 1996, 6, 15–50 CrossRef CAS.
- P. E. Blöchl, Phys. Rev. B: Condens. Matter Mater. Phys., 1994, 50, 17953–17979 CrossRef.
- J. P. Perdew, K. Burke and Y. Wang, Phys. Rev. B: Condens. Matter Mater. Phys., 1996, 54, 16533–16539 CrossRef CAS.
- J. P. Perdew, K. Burke and M. Ernzerhof, Phys. Rev. Lett., 1996, 77, 3865–3868 CrossRef CAS PubMed.
- A. H. MacDonald, Phys. Rev. B: Condens. Matter Mater. Phys., 1978, 18, 5897–5899 CrossRef CAS.
- J. Heyd, G. E. Scuseria and M. Ernzerhof, J. Chem. Phys., 2003, 118, 8207–8215 CrossRef CAS.
Footnote |
| † Electronic supplementary information (ESI) available. See DOI: 10.1039/c9ee02380a |
| This journal is © The Royal Society of Chemistry 2020 |