
Comment on “Powering sustainable development within planetary boundaries” by I. M. Algunaibet, C. Pozo, A. Galán-Martín, M. A. J. Huijbregts, N. Mac Dowell and G. Guillén-Gosálbez, Energy Environ. Sci., 2019, 12, 1890
Yi
Yang
 ab
ab
aKey Lab of Urban Environment and Health, Institute of Urban Environment, Chinese Academy of Sciences, Xiamen 361021, P. R. China
bDepartment of Bioproducts and Biosystems Engineering, University of Minnesota, St Paul, 55108, USA. E-mail: yang1385@umn.edu
First published on 12th December 2019
Abstract
Algunaibet et al. (2019) reported an important and novel study linking planetary boundaries to individual sectors—in their case, electricity generation in the US—and explored designs that could keep the sector operating within a safe space. In determining the total emissions associated with electricity generation in the US, the authors multiplied electricity's life cycle emission intensities by the total generation. This method, however, commits an accounting error that can lead to overestimation. First, I use an example to illustrate, theoretically and conceptually, why it is incorrect to multiply the total output of an intermediate product, by its life cycle emission intensities. Then, I show that this overestimation error in the specific case of US electricity sector can range from 5% to 200% across different environmental impacts, using the environmentally extended input-output model of the US (USEEIO). Given the novelty and importance of their work, I encourage Algunaibet et al. to revisit their analysis using correct accounting methods.
In a recent article,1 Algunaibet et al. presented an important and novel study that downscaled planetary boundaries to electricity generation and analyzed how sustainable design of energy mix may help the electricity sector keep, or close to keeping, operating within a safe space. Another recent study applied a similar approach and linked planetary boundaries with the global food system.2 Such work opens new frontiers of research in industrial ecology and sustainability science at large, and thus is commendable, and the ideas behind should be further explored.
However, in quantifying the total emissions of electricity generation, Algunaibet et al. made an accounting error. Correcting this error may substantially change their results and major conclusions. While Algunaibet et al. developed complicated modeling, it is clear that they calculated the total emissions associated with electricity generation in the US by multiplying the life cycle emission intensities of electricity, taken from the ecoinvent LCA database,3 by the total electricity generation. This calculation is erroneous. It double-accounts or overestimates the actual contribution of electricity in the total emissions of an economy.4
Why is it incorrect to multiply the life cycle environmental intensities of electricity (or any intermediate product) by the total generation (or gross output)? The problem lies in the latter. The way the life cycle emission intensities of electricity (e.g., CO2e per kW per h)—or, more precisely, cradle-to-gate emissions—are calculated is basically the sum of (1) direct emissions from electricity generation per kW per h and (2) indirect emissions embodied in the input materials used (e.g., coal, natural gas, capital investment).5 And the indirect, or embodied, emissions are simply a result of attributing a fraction of the output of other products, traced through the supply chain,6 and associated emissions to electricity generation. When we multiply the life cycle emission intensities of electricity by the total generation, the results would include part of the total output and emissions of other products. And if we were to do the same calculation for all products (from electricity to data center, electric cars, chemical manufacturing, etc.) and sum them up, we would end up with a total that requires more electricity than is actually generated in the economy. This is because electricity is also part of the embodied emissions of other products. In fact, we would end up with a total amount of emissions which requires more output of any product than is actually produced in the economy, and which is greater than is actually emitted by the entire economy.
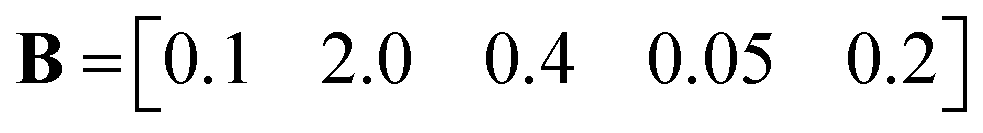
Here, I use a fictitious example to further illustrate this error. Suppose an economy consists of 5 productive processes (coal, electricity, machinery, service, and bus), and they emit CO2 only. Data on each process's input use (A) and direct emissions (B) per unit of output, total output (x), and final demand (y) that is consumed by households are presented in Fig. 1.
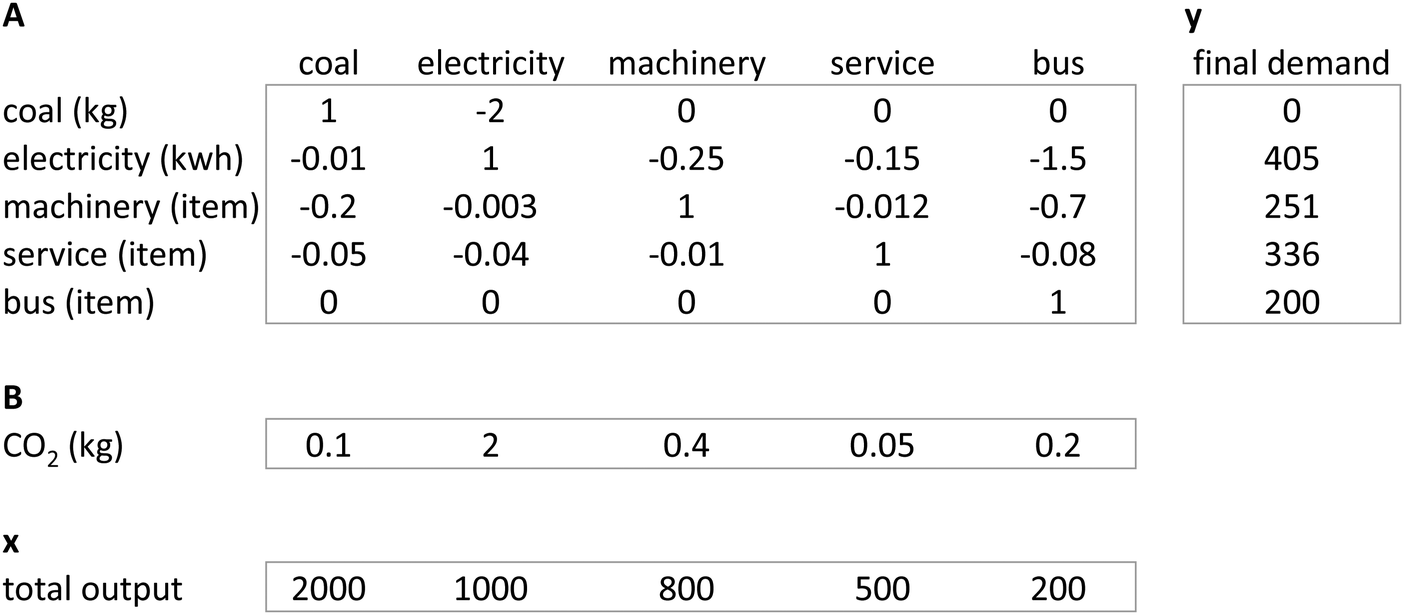 | ||
| Fig. 1 An example of a 5-process economy, where A is the technology matrix showing process input (−) per unit of output (+), B is the environmental matrix showing direct emission intensity, x indicates the total gross output of each process, and y indicates final demand by households. | ||
Given the data in Fig. 1, we can calculate the total CO2 emissions released by the entire economy using (T indicates transpose):
| BxT = 2585 kg | (1) |
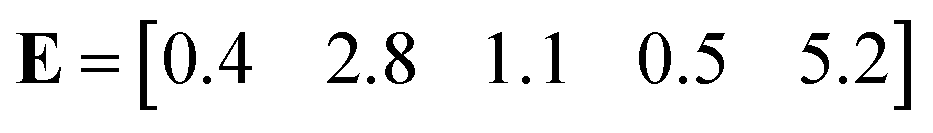
| E = BA−1 | (2) |
 | (3) |
 | (4) |
To calculate the total CO2 emissions of electricity, what Algunaibet et al. did was basically multiply the life cycle emission intensity by the total output:
| 2.8 kg kW−1 h−1 × 1000 kW h = 2800 kg | (5) |
| ExT = 5651 kg | (6) |
Conventionally, the two methods to account for emissions associated with a product or a sector are production-based and consumption-based,10
| BxT = BA−1y | (7) |
Using the production-based accounting, emissions from electricity generation are simply the direct emission intensity multiplied by total output:
| 2 kg kW−1 h−1 × 1000 kW h = 2000 kg | (8) |
| 2.8 kg kW−1 h−1 × 405 kW h = 1119 kg | (9) |
This simple 5-process example is meant to give a theoretical or conceptual explanation of the overestimation error. Using the Environmentally Extended Input–Output model of the US (USEEIO),11 which is based on real-world data of the US economy, the life cycle impact of electricity generation is greater than its direct impact by 5% to 200% across different environmental impact categories (Table 1). In other words, the overestimation error of Algunaibet et al. could range from 5% to 200%, depending on the particular impact category. And correcting this error may substantially change their results and major conclusions. Note that USEEIO is an input–output (IO) based LCA model developed by the US Environmental Protection Agency (EPA) to support their Sustainable Materials Management program.11 IO-based models are another major approach of LCA.12 Compared with process-based models (the one used in the example above), IO-based models are at a more aggregate sector level with the entire economy covered. The two approaches share the same theoretical foundation, though.13 IO-based LCA models are widely applied, notably, to estimate environmental impacts embodied in international trade.14–16
| Impact category | Unit | Direct impact | Life cycle impact | Overestimation error (%) |
|---|---|---|---|---|
| Acid rain | kg SO2-eq. | 1.71 × 10⁻² | 1.81 × 10⁻² | 6 |
| Eutrophication | kg N-eq. | 1.41 × 10⁻³ | 2.10 × 10⁻³ | 49 |
| Freshwater ecotoxicity | CTUE | 1.23 × 10⁻² | 2.70 × 10⁻² | 119 |
| Global climate change | kg CO2-eq. | 6.16 × 10 | 6.48 × 10 | 5 |
| Human health noncancer | CTUH | 5.58 × 10⁻¹⁰ | 1.69 × 10⁻⁹ | 203 |
| Human health respiratory | kg PM2.5-eq. | 1.47 × 10⁻³ | 1.61 × 10⁻³ | 10 |
| Human health cancer | CTUH | 9.20 × 10⁻¹¹ | 2.68 × 10⁻¹⁰ | 191 |
| Ozone layer depletion | kg CFC11-eq. | 1.11 × 10⁻⁷ | 1.74 × 10⁻⁷ | 58 |
| Smog formation | kg O3-eq. | 1.44 × 10⁻¹ | 1.76 × 10⁻¹ | 22 |
It is beyond question that Algunaibet et al. did seminal work by linking planetary boundaries to individual sectors. Given the importance of their work, I would encourage the authors to revisit their analysis, using correct accounting methods. Besides the production- and consumption-based accounting mentioned above, a mixed approach4 that allocates burdens between suppliers and consumers is also an option. Whichever method is used, however, emissions from individual products or sectors must add up to the total.
Conflicts of interest
There are no conflicts to declare.Acknowledgements
The author acknowledges funding by the National Science Foundation under grant CBET-1639342.References
- I. M. Algunaibet, C. Pozo, Á. Galán-Martín, M. A. J. Huijbregts, N. Mac Dowell and G. Guillén-Gosálbez, Energy Environ. Sci., 2019, 12, 1890–1900 RSC.
- M. Springmann, M. Clark, D. Mason-D’Croz, K. Wiebe, B. L. Bodirsky, L. Lassaletta, W. de Vries, S. J. Vermeulen, M. Herrero, K. M. Carlson, M. Jonell, M. Troell, F. DeClerck, L. J. Gordon, R. Zurayk, P. Scarborough, M. Rayner, B. Loken, J. Fanzo, H. C. J. Godfray, D. Tilman, J. Rockström and W. Willett, Nature, 2018, 562, 519–525 CrossRef CAS PubMed.
- R. Frischknecht and G. Rebitzer, J. Cleaner Prod., 2005, 13, 1337–1343 CrossRef.
- M. Lenzen, J. Ind. Ecol., 2008, 12, 583–599 CrossRef CAS.
- B. Kuczenski, J. Ind. Ecol., 2019, 23, 574–586 CrossRef CAS.
- Y. Yang and R. Heijungs, Int. J. Life Cycle Assess., 2018, 23, 751–758 CrossRef.
- R. Heijungs, Ecol. Econ., 1994, 10, 69–81 CrossRef.
- R. Heijungs and S. Suh, The computational structure of life cycle assessment, Kluwer Academic Pub, Dordrecht, 2002 Search PubMed.
- S. Suh, B. Weidema, J. H. Schmidt and R. Heijungs, J. Ind. Ecol., 2010, 14, 335–353 CrossRef.
- G. P. Peters, Ecol. Econ., 2008, 65, 13–23 CrossRef.
- Y. Yang, W. W. Ingwersen, T. R. Hawkins, M. Srocka and D. E. Meyer, J. Cleaner Prod., 2017, 158, 308–318 CrossRef PubMed.
- C. T. Hendrickson, D. L. B. Lave and H. S. Matthews, Environmental Life Cycle Assessment of Goods and Services: An Input-output Approach, Resources for the Future, Washington, DC, 2006 Search PubMed.
- Y. Yang, R. Heijungs and M. Brandão, J. Cleaner Prod., 2017, 150, 237–242 CrossRef.
- G. P. Peters and E. G. Hertwich, Environ. Sci. Technol., 2008, 42, 1401–1407 CrossRef CAS PubMed.
- T. Wiedmann, Ecol. Econ., 2009, 69, 211–222 CrossRef.
- J. Guo, Z. Zhang and L. Meng, Energy Policy, 2012, 42, 486–497 CrossRef.
- W. Ingwersen and Y. Yang, USEEIO v1.1 - Matrices [Data set], US Environmental Protection Agency, 2017, DOI:10.23719/1369615.
- R. K. Rosenbaum, T. M. Bachmann, L. S. Gold, M. A. J. Huijbregts, O. Jolliet, R. Juraske, A. Koehler, H. F. Larsen, M. MacLeod and M. Margni, Int. J. Life Cycle Assess., 2008, 13, 532–546 CrossRef CAS.
| This journal is © The Royal Society of Chemistry 2020 |