
 Open Access Article
 This Open Access Article is licensed under a
 Creative Commons Attribution 3.0 Unported Licence
The facile and additive-free synthesis of a cell-friendly iron(III)–glutathione complex†
Ziyu
Gao
 ab,
Pablo
Carames-Mendez
a,
Dong
Xia
a,
Christopher M.
Pask
a,
Patrick C.
McGowan
a,
Paul A.
Bingham
c,
Alex
Scrimshire
c,
Giuseppe
Tronci
*bd and
Paul D.
Thornton
*a
ab,
Pablo
Carames-Mendez
a,
Dong
Xia
a,
Christopher M.
Pask
a,
Patrick C.
McGowan
a,
Paul A.
Bingham
c,
Alex
Scrimshire
c,
Giuseppe
Tronci
*bd and
Paul D.
Thornton
*a
aSchool of Chemistry, University of Leeds, Leeds, UK. E-mail: p.d.thornton@leeds.ac.uk
bBiomaterials and Tissue Engineering Research Group, School of Dentistry, St. James's University Hospital, University of Leeds, UK. E-mail: g.tronci@leeds.ac.uk
cMaterials and Engineering Research Institute, Sheffield Hallam University, City Campus, Howard Street, Sheffield, UK
dClothworkers’ Centre for Textile Materials Innovation for Healthcare, School of Design, University of Leeds, UK
First published on 13th July 2020
Abstract
The straightfoward creation of an unreported glutathione-stabilised iron(III) complex is disclosed. In contrast to previous reports, glutathione was shown to coordinate and stabilise iron directly under physiological conditions in the absence of additional sulfur containing molecules, such as sodium sulfide. The complex was extensively characterised; the molecular geometry was determined as two inequivalent octahedra, approximately 2/3 of which are slightly distorted towards more tetrahedral in character, with the remaining 1/3 more regularly octahedral. The dispersion of the iron(III)–glutathione complex in aqueous solution yielded particles of 255 ± 4 nm in diameter that enhanced the growth and proliferation of L929 fibroblast cells over 7 days, and inhibited the activity of matrix metalloproteinase-13. Consequently, the unprecedented glutathione-stabilised iron(III) complex disclosed has potential use as a simple-to-prepare growth factor for inclusion within cell culture media, and is an excellent candidate as a therapeutic for the treatment of metalloproteinase-13-associated diseases.
Introduction
Glutathione (GSH) is imperative for cellular defence against reactive oxygen species that cause apoptosis and tissue inflammation.1 Free radicals and reactive oxygen species are deactivated by the sulfhydryl moiety that the tripeptide presents, undergoing conversion to stable and innocuous compounds. Numerous disease states are linked to GSH deficiency in cells, including chronic hypertension,2 pulmonary fibrosis,3 human immunodeficiency virus-related disease,4 and respiratory distress syndrome.5 GSH is administered as an oral supplement, however the half-life of GSH within the blood plasma (t = 1.6 min) ensures that a significant proportion of the supplement is oxidised prior to reaching the gastrointestinal tract.6 Consequently, alternative methods of GSH storage and localised delivery, or reversible GSH modification, are required to elevate depleted tissue GSH levels.Transition metal ions perform a number of cellular functions within eukaryotes, including photosynthesis and respiration.7 Metalloproteins, which contain a metal ion cofactor, play a vital role in the storage and transport of enzymes and signal transduction proteins, and make-up a third of proteins within the human body.8 Iron is the most abundant redox-active metal within the body owing to its presence within haemoglobin. The natural presence of haemoglobin in vivo provides great encouragement for the formation of iron-protein and iron-peptide complexes as materials that are suitable to be deployed within living organisms.
Complexes that contain redox-active metal centres may be exploited as therapeutics and diagnostic tools.9 Notably, such organometallic materials have been proposed as contrast agents in which the variety of oxidation states that the redox-active metal can adopt is associated with distinct paramagnetic properties that enable their effective detection in vivo.10 Iron has potential for use within a contrast agent composition due to its capability to form high-spin Fe3+ complexes. Wang et al. recently reported biochemically responsive Fe2+-PyC3A complexes that, upon oxidation by reactive oxygen species, form Fe3+-PyC3A that enable contrast enhancement within inflamed pancreatic tissue.11 Within healthy tissue, Fe2+-PyC3A is maintained and so signal enhancement does not occur.
GSH has been reported to form stable complexes with transition metals including mercury,12 silver,13 cadmium,14 and zinc.15 Consequently, it has been cited as a candidate for metal speciation in aqueous environments for the detection and remedy of heavy metal pollution.16 However, the formation of hydrolytically-stable iron–GSH complexes is more limited, especially in a cluster-free configuration. Qi et al. reported that glutathione-complexed clusters [2Fe–2S] are stabilised by glutathione aggregates that form intermolecular salt bridges and hydrogen bonds, providing a stable binding pocket for the [2Fe–2S] cluster core.17,18 However, despite these advances, the binding of glutathione to ferrous iron in the absence of iron–sulfur cluster formation has not been reported due to the rapid reduction of Fe3+ in the presence of GSH.19,20 In this case, a complex that contains GSH ligands, but lacks [Fe2S2] bridged dimers, is anticipated to form.
We report the formation of a Fe3+–GSH complex by combining equimolar quantities of GSH and FeCl3. Additives that promote iron–sulfur cluster formation, for instance sodium sulfide, were not included in the synthesis. Analysis reveals that reduced GSH forms a complex with Fe3+, yielding a stable complex suitable for extensive characterisation. Notably, the Fe3+–GSH complex possessed excellent cell compatibility, promoting the growth and proliferation of L929 fibroblast cells over seven days in vitro. Consequently, it is highly promising as a drug-free approach to enhance fibroblast growth in vitro within cell culture medium at low concentrations (<0.5 mg mL−1), and as a constituent to restore homeostasis in chronic tissue states.
Results and discussion
To confirm complex formation upon GSH addition to FeCl3 solution, UV-Vis optical absorption spectroscopy was used to track metal-chelate coordination for various molar ratios after 30 minutes, when the solution colour remained consistent. The specific absorbance peak at 456 nm was ascribed to Fe–S formation. However, following Fe3+–GSH complex formation, two additional absorption peaks were detected at positions of 452 nm and 550 nm (Fig. S1a†) in our system that did not present in the spectrum of FeCl3 solution (Fig. S2†). These peaks are attributed to Fe3+–GSH coordination.21,22 A regular decrease in absorbance intensity was observed in solutions containing a decreasing molar ratio of FeCl3![[thin space (1/6-em)]](https://www.rsc.org/images/entities/char_2009.gif) :GSH (6 → 1), until no peak could be detected in solutions containing a molar ratio lower than 1 (Fig. S1†). This observation can be rationalised by the fact that when solutions with a FeCl3:GSH molar ratio of 1:1.2 or lower were analysed, Fe2+ was present exclusively and so no Fe3+-associated absorbance could be recorded, illustrating that binding between Fe3+ and GSH occurred only at increased FeCl3:GSH molar ratios (i.e. >1). This observation also reveals that the thiol-induced reduction of Fe3+ to Fe2+ is expected to occur prior to Fe chelation in solutions with increased GSH content, and that the chelating interaction detected by UV-Vis spectroscopy was exclusively between GSH and Fe3+, rather than between GSH and Fe2+, in solutions with decreased GSH content.
:GSH (6 → 1), until no peak could be detected in solutions containing a molar ratio lower than 1 (Fig. S1†). This observation can be rationalised by the fact that when solutions with a FeCl3:GSH molar ratio of 1:1.2 or lower were analysed, Fe2+ was present exclusively and so no Fe3+-associated absorbance could be recorded, illustrating that binding between Fe3+ and GSH occurred only at increased FeCl3:GSH molar ratios (i.e. >1). This observation also reveals that the thiol-induced reduction of Fe3+ to Fe2+ is expected to occur prior to Fe chelation in solutions with increased GSH content, and that the chelating interaction detected by UV-Vis spectroscopy was exclusively between GSH and Fe3+, rather than between GSH and Fe2+, in solutions with decreased GSH content.
Monitoring the colour of the Fe3+–GSH complex-yielding solution (FeCl3:GSH = 1:1) revealed that the starting yellow-like ferric chloride solution immediately shifted to a dark green colour for approximately three seconds upon addition of GSH (Fig. 1A). The solution then became lighter yellow, in comparison with the starting FeCl3 solution, as shown in Fig. 1A. The quick formation of dark green solution is attributed to the reduction of Fe3+ to Fe2+, and the oxidation of the GSH thiol, whereby either a disulfide bridge forms between two GSH molecules, a Fe–S bond forms, or a combination of both may form depending on the selected Fe3+:GSH molar ratio (Fig. 1B). As the pH of the solution containing both FeCl3 and GSH is acidic (pH < 3), the disulfide bridge may be reduced and Fe2+ undergo oxidation after approximately 3 seconds, when the light-yellow solution formed. Ethanol was then added to the yellow solution (Fig. 1A(f)), yielding a pale red precipitate (Fig. 1A(g)), which was dried at 37 °C and further characterised. The proposed mechanism for complex formation is provided in Fig. 1B. The capability of GSSG to induce iron oxidation, as shown in step 2, was confirmed by the GSSG-induced colour change of a FeCl2 solution. The solution shifted to a pale red colour that is ascribed to the formation of a Fe3+–GSH complex (Fig. S3†).
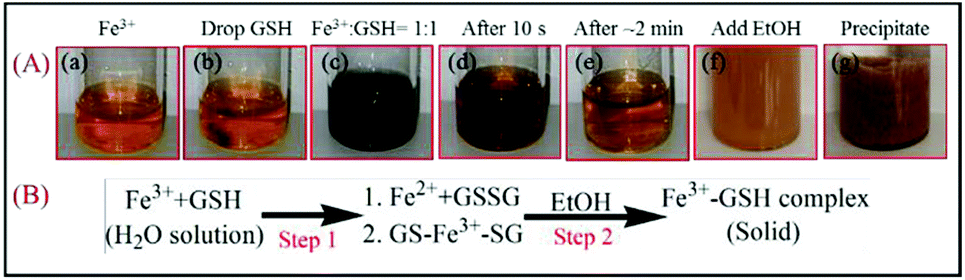 | ||
| Fig. 1 Colour solution change that accompanies the transition of FeCl3 solution to the precipitated Fe3+–GSH complex (A) and proposed mechanism of Fe3+–GSH complex formation (B). | ||
The iron valence of the Fe3+–GSH complex was evaluated by 57Fe Mössbauer spectroscopy at room temperature, 293 K (Fig. 2). All iron in the complex was confirmed to be Fe3+, with no evidence of any magnetically ordered phases.17,18,23 Approximately 60% of the spectral area is consistent with Fe3+ with an octahedral structure that is slightly distorted towards tetrahedral in character, as evidenced by the relatively low Δ (doublet 1, centre shift (δ) = 0.417 mm s−1, quadrupole splitting (Δ) = 0.650 mm s−1),17,18,23 and approximately 40% of the spectral area is consistent with a more regular octahedral Fe3+ structure (doublet 2, δ = 0.447 mm s−1, Δ = 0.987 mm s−1).17,18,23 The 1H-NMR spectrum of the Fe3+–GSH complex is displayed in Fig. 3, whereby broader peaks can be observed compared to the spectrum of GSH. Peak broadening is ascribed to the paramagnetism of ferric ions (Fe3+), which affects the magnetic field of the instrument. An obvious shift of the CH2-S (position c) protons from 2.87 ppm to 2.89 ppm and 3.19 ppm is evident, and is attributed to Fe–S binding, as the strong metal-chelate coordination affects the neighbouring carbon environment. FTIR spectroscopy also revealed differences between the spectra of GSH and the Fe3+–GSH complex. A significant shift in the C![[double bond, length as m-dash]](https://www.rsc.org/images/entities/char_e001.gif) O peak position from 1708 cm−1 (GSH) to 1737 cm−1 (Fe3+–GSH complex) suggests coordination between Fe and glutathione hydroxyl oxygen (Fig. S4†). The peak at 2522 cm−1, corresponding to a thiol vibration, disappeared from the spectrum of the complex, suggesting Fe–S binding. The peaks at 3271 cm−1, 1636 cm−1, and 1526 cm−1 correspond to the amine groups of GSH. Both 1H NMR and FTIR spectra revealed the formation of Fe–S and Fe–O bonds.
O peak position from 1708 cm−1 (GSH) to 1737 cm−1 (Fe3+–GSH complex) suggests coordination between Fe and glutathione hydroxyl oxygen (Fig. S4†). The peak at 2522 cm−1, corresponding to a thiol vibration, disappeared from the spectrum of the complex, suggesting Fe–S binding. The peaks at 3271 cm−1, 1636 cm−1, and 1526 cm−1 correspond to the amine groups of GSH. Both 1H NMR and FTIR spectra revealed the formation of Fe–S and Fe–O bonds.
 | ||
| Fig. 2 Fitted Mössbauer spectrum for the Fe3+–GSH complex. | ||
 | ||
| Fig. 3 X-ray photoelectron spectra of the Fe3+–GSH complex and GSH, C 1s (a), S 2p (b), O 1s (c). Fe 2p (d) and Fe 3p (e) of Fe3+–GSH. | ||
The Fe3+–GSH complex was also found to display specific peaks in its CD spectrum (Fig. S5†). Compared with uncoordinated GSH in deionised water, the Fe3+–GSH complex presented a broad positive peak from 750 to 460 nm and a negative peak from 460 to 302 nm, assigned to Fe3+ coordination. In 60 mM HCl solution, no obvious structural change was observed for the GSH molecule, however, in the spectrum of the Fe3+–GSH complex, an abrupt change was recorded, whereby the opposite trend was observed, at 750–422 nm and 422–360 nm, with respect to when the complex was incubated in H2O. This change may be due to the presence of H+,24 suggesting a reversible pH-induced peptide folding within the Fe3+–GSH complex.
Surface element analysis confirmed the chemical composition and the coordinated binding energy of the Fe3+–GSH powder. GSH powder was used as a control. The elements present in the Fe3+–GSH complex are presented in Fig. S6,† which reveals that significant shifts were detected in CO, C–O and S-related bonds (Fig. 4). No S–S bond was detected in this complex, which would be revealed by a peak at 166 eV, or greater.25 The thiol group is protected from forming disulfide bridges with other GSH molecules by Fe chelation. In addition, no evidence for Fe2+ was found, which would be anticipated to appear at 708 eV,26 rather than the pre-peak, which is normally observed in Fe related compounds.27 This confirmed the exclusive existence of ferric iron, consistent with the results from Mössbauer spectroscopy.
 | ||
| Fig. 4 1H-NMR spectra of Fe3+–GSH complex (black) and GSH (blue) in D2O. | ||
X-ray powder diffraction analysis revealed that 2θ = 23.58° with a full width at half maximum value of 12.13°, as shown in Fig. S7.† The d spacing of the complex was calculated to be 0.38 nm, and Dp = 0.70 nm. The Fe3+–GSH complex was confirmed to possess a 3-layer packing mode, which varied markedly to the crystal structure that was obtained for FeCl3 (Fig. S8†), confirming that a new stacking structure is formed for the Fe3+–GSH complex.
UV-Vis fluorescence spectroscopy exposed an emission peak at 555 nm under excitation wavelength of 408 nm for the Fe3+–GSH complex dispersed in deionised water (Fig. 5). This peak was also present in the spectrum corresponding to a mixture of FeCl3 and GSH (Fig. S9†). Upon the addition of HCl to the complex solution, the emission peak at 555 nm disappeared. A peak at 473 nm position formed, which lies between values of pure GSH (470 nm) and FeCl3 (493 nm) (Fig. S9†). The peak at 555 nm is considered to result from the strong binding between Fe3+ and GSH, yielding a rigid structure that provides a new emission peak. Its disappearance after adding HCl suggests that this structure is not stable in acidic solution, with the coordination between Fe3+ and GSH reduced, as supported by the accompanying solution colour change from a turbid pale yellow/creamy colour to a transparent colourless solution.
 | ||
| Fig. 5 UV-Vis fluorescence spectra of the Fe3+–GSH complex in deionised water with a concentration of 1.0 mg mL−1, initial status (solid) and after adding 20 μL HCl (dash). | ||
Thermogravimetric analysis (TGA) was carried out to further corroborate the chemical composition and composition of the complex. As observed in Fig. S10,† the first mass loss of 12.0% was considered due to water evaporation; the next mass loss from 88.0% to 11.5%, which commenced at 148.3 °C, is ascribed to the loss of GSH. After heating up to 611.8 °C, the complex max remained constant at 11.5%, which was due to the presence of iron. Consequently, it was found that the complex contains 87% GSH and 13% Fe by mass. This is very close to the theoretical composition of 84.6% GSH and 15.4% Fe, based on a total complex mass of 145.4 mg that contains 123 mg GSH.
Although Fe was coordinated to water-soluble GSH, the solubility of the Fe3+–GSH complex in water remained low due to the ionisation equilibrium of Fe itself. Iron ions tend to gain hydroxide ligands in neutral and basic water. Mass spectrometry analysis revealed peaks at 615 m/z, attributed to GSSG, and 308 m/z, attributed to GSH (Fig. S11†). In contrast to mass spectrometry, X-ray photoelectron spectroscopy (XPS) investigations revealed the absence of S–S bridges, suggesting that the formation of the oxidised product in the mass spectra is attributed to the electron source forming ionised species, which form GSSG in the instrument channel. Significant enhancement in peak intensity was observed after adding 20 μL HCl (final concentration of HCl was 120 mM), from 8.9 × 10⁵ to 13.2 × 10⁵ peak intensity at 615 m/z and from 0.8 × 10⁵ to 5.3 × 10⁵ at 308 m/z. The peak at 669 m/z confirms the formation of the GS–Fe–SG complex, although its intensity surprisingly increased upon the addition of HCl. The enhancement of this peak following HCl addition, together with the change in solution colour from medium yellow to almost a colourless solution, suggested the ionisation of the Fe3+–GSH complex had occurred, resulting in the oxidisation of GSH to GSSG, and the partial formation of Fe2+ species.
DLS analysis revealed that the Fe3+–GSH complex was stable in water, leading to nanoaggregates with an average effective size of 255 ± 4 nm (PDI = 0.258 ± 0.015). Following 24-hour storage in water, the complex remained well dispersed with an average size of 257 ± 2 nm (PDI = 0.247 ± 0.008, Fig. 6). This characteristic may be exploited to generate bespoke Fe3+–GSH carriers capable of the prolonged, or redox-mediated, release of GSH to, for example, chronic tissues that have downregulated levels of GSH.28
 | ||
| Fig. 6 The effective size of Fe3+–GSH in H2O at a concentration of 0.5 mg mL−1, initial status (solid) and storage in water for 24 hours (dash). | ||
The paramagnetic property of Fe3+–GSH was observed using a vibrating-sample magnetometer and increased in magnetic moment from −0.1474 emu g−1 to 0.1474 emu g−1 under 3 T magnetic field, revealing the paramagnetism of the complex (Fig. S12†).
Following systematic characterisation of the complex, attention moved to its applicability within a biological environment. Cytotoxicity experiments were carried out with L929 mouse fibroblasts and confirmed high cellular tolerability of the Fe3+–GSH complex. Growth and proliferation of L929 cells were measured during a 7-day culture (Fig. 7) with all the complex concentrations used in the cell culture medium, strongly supporting the excellent complex cytocompatibility (Table S1†). Even compared with TCPs, only temporary inhibition was found in cell proliferation in the first 3 days. After 5-day culture, no significant difference could be observed in cell growth between cells cultured with either 0.125 mg mL−1, 0.25 mg mL−1, 0.5 mg mL−1 or 0.75 mg mL−1 of Fe3+–GSH. After 7 days culture, L929 cells in 0.125 mg mL−1 presented significant higher viability and no significant difference was found at 0.25 mg mL−1 and 0.5 mg mL−1 conditions. The complex is described as being ‘cell-friendly’ due the positive effect that it has on cell growth when included in the assessed cell culture medium at 0.125 mg mL−1, and due to it being non-cytotoxic when included in the assessed cell culture medium at concentrations ≤0.5 mg mL−1. Conversely, when high Fe3+–GSH content (>0.5 mg mL−1) was supplemented to the cell culture medium, cells proved to grow slower with respect to cells cultured on tissue culture polystyrene (TCPs), suggesting a significant GSH-induced impact on cellular activity at increased complex concentrations. In addition to possessing cellular tolerability, the Fe3+–GSH complex proved also to be stable following 24-hour incubation in cell culture medium, suggesting long-lasting GSH storing capability (Fig. S13a–d†) and potential applicability as magnetic resonance contrast agent.
 | ||
| Fig. 7 L929 cell viability without/with Fe3+–GSH complex for 7 days culture. | ||
The effect of the complex on matrix metalloproteinase-13 (MMP-13) activity was then assessed to determine the effectiveness of the material as a viable therapeutic for ailments in which MMP-13 is overexpressed. Studies revealed that MMP-13 activity decreased to 80 ± 7% after 12-hour incubation in the presence of the complex (Fig. 8). After 48 hours incubation, MMP-13 activity was downregulated to 74 ± 1%. A significant difference was shown at all time points compared with the MMP-13 group, in which no complex was included. In addition, no significant difference was observed in the GSH group signifying the requirement of both organic and inorganic components for effective enzyme inhibition. This quick and lasting downregulation proved the ability of the Fe3+–GSH complex to inhibit MMP-13 activity and suggested great potential for the complex to be applied to inflammation, wound, and arthritis management by downregulating MMP activity.
 | ||
| Fig. 8 MMP-13 activity following incubation with Fe3+–GSH or GSH for (a) 12 hours, (b) 24 hours, (c) 48 hours. | ||
Conclusions
The formation of a Fe3+–GSH complex without additional sulfur within its structure is reported and characterised for the first time. Aggregate formation of the complex in water yielded stable particulates with an initial average effective size of 255 ± 4 nm. Such aggregates dispersed in aqueous solution and were found to be non-cytotoxic against L929 fibroblast cells. Fibroblast growth and proliferation was enhanced versus TCP after seven days of cell culture, suggesting that the material has great potential for use as a growth factor in cell culture medium. Additionally, the complex reduced the activity of MMP-13 over 48 hours, rendering it a highly promising candidate as a treatment for MMP-13-associated conditions.Conflicts of interest
There are no conflicts to declare.Acknowledgements
The authors would like to thank Sarah Myers for support in the laboratory, and Dr Mark Howard for NMR training and guidance.Notes and references
- A. T. Dharmaraja, J. Med. Chem., 2017, 60, 3221–3240 CrossRef CAS PubMed.
- S. Sagar, I. J. Kallo, N. Kaul, N. K. Ganguly and B. K. Sharma, Mol. Cell. Biochem., 1992, 111, 103–108 CrossRef CAS PubMed.
- K. M. Beeh, J. Beier, I. C. Haas, O. Kornmann, P. Micke and R. Buhl, Eur. Respir. J., 2002, 19, 1119–1123 CrossRef CAS.
- L. A. Herzenberg, S. C. De Rosa, J. G. Dubs, M. Roederer, M. T. Anderson, S. W. Ela, S. C. Deresinski and L. A. Herzenberg, Proc. Natl. Acad. Sci. U. S. A., 1997, 94, 1967–1972 CrossRef CAS PubMed.
- E. R. Pacht, A. P. Timerman, M. G. Lykens and J. Merola, Chest, 1991, 100, 1397–1403 CrossRef CAS.
- A. Wendel and P. Cikryt, FEBS Lett., 1980, 120, 209–211 CrossRef CAS.
- I. Yruela, Metallomics, 2013, 5, 1090–1109 RSC.
- K. J. Waldron, J. C. Rutherford, D. Ford and N. J. Robinson, Nature, 2009, 460, 823–830 CrossRef CAS PubMed.
- S. Betanzos-Lara, N. P. Chmel, M. T. Zimmerman, L. R. Barrón-Sosa, C. Garino, L. Salassa, A. Rodger, J. L. Brumaghim, I. Gracia-Moraa and N. Barba-Behrens, Dalton Trans., 2015, 44, 3673–3685 RSC.
- Y. Miao, F. Xie, J. Cen, F. Zhou, X. Tao, J. Luo, G. Han, X. Kong, X. Yang, J. Sun and J. Ling, ACS Macro Lett., 2018, 7, 693–698 CrossRef CAS.
- H. Wang, V. C. Jordan, I. A. Ramsay, M. Sojoodi, B. C. Fuchs, K. K. Tanabe, P. Caravan and E. M. Gale, J. Am. Chem. Soc., 2019, 141, 5916–5925 CrossRef CAS PubMed.
- E. Bramanti, A. D'Ulivo, L. Lampugnani, G. Raspi and R. Zamboni, J. Anal. At. Spectrom., 1999, 14, 179–185 RSC.
- Y. F. Ma, L. J. Wang, Y. L. Zhou and X. X. Zhang, Nanoscale, 2019, 11, 5526–5534 RSC.
- A. Fang, H. Chen, H. Li, M. Liu, Y. Zhang and S. Yao, Biosens. Bioelectron., 2017, 87, 545–551 CrossRef CAS PubMed.
- M. Gelinsky, R. Vogler and H. Vahrenkamp, Inorg. Chim. Acta, 2003, 344, 230–238 CrossRef CAS.
- W. Chu, Y. Zhang, D. Li, C. J. Barrow, H. Wang and W. Yang, Biosens. Bioelectron., 2015, 67, 621–624 CrossRef CAS PubMed.
- W. Qi, J. Li, C. Y. Chain, G. A. Pasquevich, A. F. Pasquevich and J. A. Cowan, J. Am. Chem. Soc., 2012, 134, 10745–10748 CrossRef CAS PubMed.
- W. Qi, J. Li, C. Y. Chain, G. A. Pasquevich, A. F. Pasquevich and J. A. Cowan, Chem. Commun., 2013, 49, 6313–6315 RSC.
- S. M. Hamed, J. Silver and M. Wilsonx, Inorg. Chim. Acta, 1983, 78, 1–11 CrossRef.
- R. Hider and X. Kong, BioMetals, 2011, 24, 1179–1187 CrossRef CAS PubMed.
- S. Gervason, D. Larkem, A. B. Mansour, T. Botzanowski, C. S. Muller, L. Pecqueur, G. Le Pavec, A. Delaunay-Moisan, O. Brun, J. Agramunt, A. Grandas, M. Fontecave, V. Schunemann, S. Cianferani, C. Sizun, M. B. Toledano and B. D'Autreaux, Nat. Commun., 2019, 10, 3566 CrossRef PubMed.
- C. Bonfio, L. Valer, S. Scintilla, S. Shah, D. J. Evans, L. Jin, J. W. Szostak, D. D. Sasselov, J. D. Sutherland and S. S. Mansy, Nat. Chem., 2017, 9, 1229–1234 CrossRef CAS PubMed.
- M. D. Dyar, D. G. Agresti, M. W. Schaefer, C. A. Grant and E. C. Sklute, Annu. Rev. Earth Planet. Sci., 2006, 34, 83–125 CrossRef CAS.
- L. Quintanar and L. Rivillas-Acevedo, Methods Mol. Biol., 2013, 1008, 267–297 CrossRef CAS PubMed.
- H. Mekaru, A. Yoshigoe, M. Nakamura, T. Doura and F. Tamanoi, ACS Appl. Nano Mater., 2019, 2, 479–488 CrossRef CAS.
- X. Wang, Q. Xiang, B. Liu, L. Wang, T. Luo, D. Chen and G. Shen, Sci. Rep., 2013, 3, 2007 CrossRef PubMed.
- A. P. Grosvenor, B. A. Kobe, M. C. Biesinger and N. S. McIntyre, Surf. Interface Anal., 2004, 36, 1564–1574 CrossRef CAS.
- Z. Gao, B. Golland, G. Tronci and P. D. Thornton, J. Mater. Chem. B, 2019, 7, 7494–7501 RSC.
Footnote |
| † Electronic supplementary information (ESI) available: Spectra corresponding to UV-Vis absorption spectroscopy, FTIR, mass spectrometry, XPS, X-ray powder diffraction, UV-Vis fluorescence spectroscopy, and TGA. Vibrating-sample magnetometer data, cell culture images and statistical analysis of cell viability. See DOI: 10.1039/d0dt02331k |
| This journal is © The Royal Society of Chemistry 2020 |