
 Open Access Article
 This Open Access Article is licensed under a
 Creative Commons Attribution 3.0 Unported Licence
Novel tetranuclear PdII and PtII anticancer complexes derived from pyrene thiosemicarbazones†
Carolina G.
Oliveira
 abc,
Isolda
Romero-Canelón
d,
James P. C.
Coverdale
c,
Pedro Ivo S.
Maia
e,
Guy J.
Clarkson
c,
Victor M.
Deflon
*a and
Peter J.
Sadler
*c
abc,
Isolda
Romero-Canelón
d,
James P. C.
Coverdale
c,
Pedro Ivo S.
Maia
e,
Guy J.
Clarkson
c,
Victor M.
Deflon
*a and
Peter J.
Sadler
*c
aSão Carlos Institute of Chemistry, University of São Paulo, 13560-970, São Carlos, Brazil
bInstitute of Chemistry, Federal University of Uberlândia, 38400-902, Uberlândia, Brazil
cDepartment of Chemistry, University of Warwick, CV4 7AL, Coventry, UK
dSchool of Pharmacy, University of Birmingham, B15 2TT, Birmingham, UK
eDepartment of Chemistry, Federal University of the Triângulo Mineiro, 38025-440 Uberaba, Brazil
First published on 30th June 2020
Abstract
Cyclometallated palladium(II) and platinum(II) pyrenyl-derived thiosemicarbazone (H2PrR) complexes of the type [M4(μ-S-PrR-κ3-C,N,S)4] (M = PdII, PtII; R = ethyl, cyclohexyl) have been synthesised in good yields and fully characterised. X-ray crystallography showed that the tetranuclear complex [Pt4(μ-S-PrCh-κ3-C,N,S)4](CH3)2COCHCl3 contains an eight-membered ring of alternating M–S atoms. The ethyl derivatives [M4(μ-S-PrEt-κ3-C,N,S)4] exhibit potent antiproliferative activity towards A2780 human ovarian cancer cells, with IC50 values of 1.27 μM (for M = PdII) and 0.37 μM (for M = PtII), the latter being an order of magnitude more potent than the anticancer drug cisplatin (IC50 1.20 μM). These promising complexes had low toxicity towards non-cancerous human MRC5 cells, which points towards an early indication of differential toxicity between cancer and normal cells. Experiments that investigated the effects of these tetranuclear complexes on the cell cycle, integrity of the cell membrane, and induction of apoptosis, suggested that their mechanism of action of does not involve DNA targeting, unlike cisplatin, and therefore could be promising for combatting cisplatin resistance.
Introduction
Thiosemicarbazones (TSCs) are well known as a promising class of compounds with a rich coordination chemistry1–3 and a range of pharmacological activities,4–6 including antiparasitic, antibacterial and antitumour activities. Some thiosemicarbazones such as the di-2-pyridylketone 4,4-dimethyl-3-thiosemicarbazone Dp44mT (Chart 1) have been extensively studied because of their selective antitumour and antimetastatic properties, causing lysosomal membrane permeabilisation and cell death.7 The thiosemicarbazone derivative Triapine (Chart 1), which inhibits cancer cell growth at nanomolar concentrations, has undergone Phase 1 and Phase 2 clinical trials for the treatment of cervical cancer.8 It is well established that triapine has the ability to suppress tumour growth by inhibiting ribonucleotide reductase (RR), a key enzyme required for DNA synthesis.9 Following the successful anticancer agent cisplatin (CDDP) and its relatives carboplatin and oxaliplatin, thousands of other metal complexes have been screened in order to study the effects of the metal and their structures on the biological activity.10,11 However, the major challenge of this field, is still to eliminate strong side effects, off-target toxicity and achieve cancer-cell specificity. Accordingly, current antitumour metallo-drug research is focused on the development of compounds with new and unusual features, including metal–carbon bonds (organometallic compounds).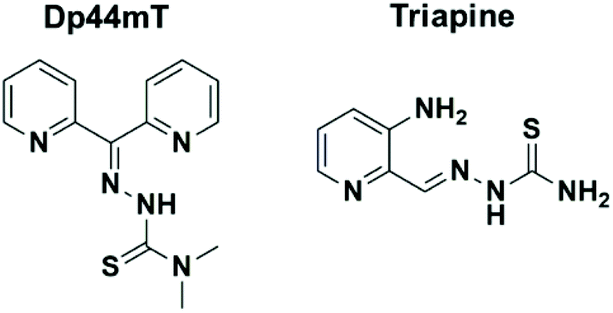 | ||
| Chart 1 Molecular structures of thiosemicarbazones Dp44mT (topoisomerase IIa inhibitor) and triapine (compound in clinical trials). | ||
Organometallic complexes of palladium and platinum containing thiosemicarbazones as ligands have attracted attention. First because of their diverse range of structures, including oligomers, and second because organometallic bonding can increase the stability of the complex as a whole.12 Some cyclometallated complexes have potential antitumour activity.13 Consequently, orthometallated thiosemicarbazone complexes of palladium and platinum have been reported.14,15 For example, Quiroga et al. have described platinum organometallic complexes derived from thiosemicarbazone ligands which have potent cytotoxic activity against three different cell lines.16
Thiosemicarbazone ligands are formed by condensation reactions of a thiosemicarbazide and an aldehyde. The ligand features depend on the aldehyde. Both thiosemicarbazide and aldehyde may provide coordination sites. In this work, we have used 1-pyrenecarboxaldehyde to incorporate a fluorescent pyrene into the thiosemicarbazones as a luminescent probe to track complexes inside cells.17 Furthermore, the well-known intercalating properties of pyrene might enhance inhibition of cellular DNA replication,18 if DNA is a target.
Although there are many studies of metal thiosemicarbazone complexes, only a few reports describe the biological activity of tetranuclear orthometallated complexes with thiosemicarbazone CNS donors.19–21 Herein, we have used potential CNS thiosemicarbazone ligands (Fig. 1A) to prepare tetranuclear cyclometallated palladium and platinum complexes (Fig. 1B) and investigated their biological activity against A2780 human ovarian cancer cells. Since selectivity is important for reducing the severity of undesired side-effects, we have also studied the activity of the most potent complexes against a non-tumourigenic cell line.
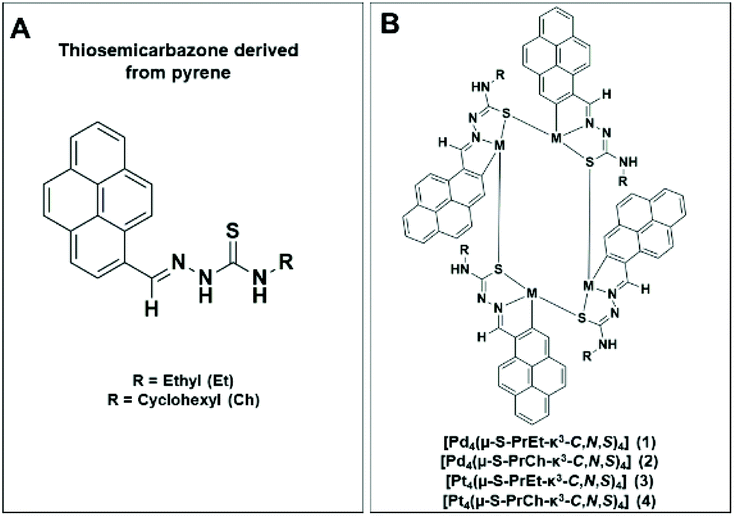 | ||
| Fig. 1 (A) Thiosemicarbazone ligands derived from pyrene and (B) the general chemical structure of tetranuclear complexes studied in this work. | ||
Experimental
Materials and measurements
1-Pyrenecarboxaldehyde, 4-ethyl-thiosemicarbazide, analytical reagents grade chemicals and solvents were purchased from Sigma-Aldrich and used without further purification. The 4-cyclohexyl-3-thiosemicarbazide and trans-[PdCl2(MeCN)2] were prepared as described previously.22,23 CHN elemental analyses were carried out on a CE-440 elemental analyzer by Warwick Analytical (UK) Ltd or on PerkinElmer CHNS/O 2400 Series II equipment. FTIR spectra between 400 and 4000 cm−1 were recorded using KBr pellets on a Shimadzu IR Prestige-21 spectrophotometer. Ultraviolet–visible (UV-vis) spectra of solutions diluted in dichloromethane were recorded using a Shimadzu UV-1800 spectrophotometer. 1H and 195Pt NMR spectra were acquired in 5 mm NMR tubes at 298 K on Bruker spectrometers (1H = 300 or 400 MHz, 195Pt = 107 MHz). 1H NMR chemical shifts were internally referenced to CHCl3 (7.27 ppm) for chloroform. All the δ(Pt) values were referenced to [PtCl6]2−via [PtCl4]2− = −1628 ppm. HPLC studies were performed on a HP 1100 Series HPLC System (Agilent) using a ZORBAX Eclipse Plus C-18 column. The mobile phases were A: water (HPLC grade, Aldrich) containing 0.1% trifluoroacetic acid (TFA) and B: methanol (HPLC grade, Aldrich) containing 0.1% TFA. A flow rate of 1 mL min−1 was used. Electrospray ionization mass spectrometry (ESI-MS) spectra were recorded on an Agilent 6130B single quadrupole detector instrument at 298 K with a scan range of m/z 50–2000 for positive ions. Samples were prepared in mixture of DCM/MeOH (25%/75%)+0.3% formic acid. The stability of the complexes (ca. 500 μM) was investigated by UV-vis spectroscopy over 24 h in 5% DMSO/95% H2O. A Cary 300 UV-Vis recording spectrophotometer was used with 1 cm path-length quartz cuvettes (0.5 mL) and a PTP1 Peltier temperature controller. Spectra were processed using UVWinlab software. Experiments were carried out at 298 K from 600 to 200 nm. ICP-OES analyses were made on a PerkinElmer Optima 5300 DV series ICP-OES instrument. The water (18.2 MΩ) used for analysis was doubly deionized (DDW) using a Millipore Milli-Q water purification system and a USF Elga UHQ water deionizer. ICP standards for platinum (1001 ± 2 μg ml−1, Fluka) and palladium (1015 μg mL−1, Aldrich) were diluted with 3.6% HNO3 DDW to prepare freshly calibrants at concentrations of 50–700 ppb, which were spiked with NaCl to match the salt content of the samples being analysed. All Inductively Coupled Plasma-Mass Spectrometry (ICP-MS) analyses were carried out on an Agilent Technologies 7500 series ICP-MS instrument. ICP standards were diluted with 3.6% HNO3 DDW to prepare fresh calibrants at concentrations of 0.1–1000 ppb. The ICP-MS instrument was set to detect Pd and Pt with typical detection limits of ca. 2 ppt using no-gas mode, with an internal calibration standard of Er (50 pp).Cell culture
![[thin space (1/6-em)]](https://www.rsc.org/images/entities/char_2009.gif) :1 v/v) following serial dilutions in RPMI-1640. Drug exposure period was 24 h. After this, supernatants were removed by suction and each well was washed with PBS. A further 72 h was allowed for the cells to recover in drug-free medium at 310 K. SRB assay was used to determine cell viability.24 Absorbance measurements of the solubilized dye (on a BioRad iMark microplate reader using a 470 nm filter) allowed the determination of viable treated cells compared to untreated controls. IC50 values (concentrations which caused 50% of cell death) were determined as duplicates of triplicates in two independent sets of experiments and their standard deviations were calculated.
:1 v/v) following serial dilutions in RPMI-1640. Drug exposure period was 24 h. After this, supernatants were removed by suction and each well was washed with PBS. A further 72 h was allowed for the cells to recover in drug-free medium at 310 K. SRB assay was used to determine cell viability.24 Absorbance measurements of the solubilized dye (on a BioRad iMark microplate reader using a 470 nm filter) allowed the determination of viable treated cells compared to untreated controls. IC50 values (concentrations which caused 50% of cell death) were determined as duplicates of triplicates in two independent sets of experiments and their standard deviations were calculated.
Metal accumulation in cancer cells
Syntheses
Synthesis of the tetranuclear palladium and platinum complexes
Method A. H2PrR (0.1 mmol) was added to a solution of trans-[PdCl2(MeCN)2] (0.1 mmol) in 3 mL of MeCN. The mixture was stirred for 24 h at room temperature. An orange precipitate was formed during this time, which was filtered off, washed with hexane and dried in a vacuum. Afterwards, MeCN (2 mL) and Et3N (0.5 mL) was added to the solid and the resulting mixture was kept under stirring and reflux for 5 h. The solvent was removed in vacuo and the residue was washed with methanol and then filtered. Afterwards the red solid was recrystallized from a mixture of CHCl3/MeOH (1:1 v/v), affording a crystalline powder.
Method B. To a mixture of 0.1 mmol of trans-[PdCl2(MeCN)2] and 0.1 mmol of 1-pyrenecarboxaldehyde, R-thiosemicarbazone in MeCN (5 mL) 0.5 mL of Et3N was added; the mixture was then heated at 358 K for 8 h. A crystalline powder was obtained as described for method A.
![[double bond, length as m-dash]](https://www.rsc.org/images/entities/char_e001.gif) N) + ν(CC), 715 ν(C–S). Anal. Calcd for C20H15N3PdS (435.83 g mol−1): C, 55.12; H, 3.47; N, 9.64%. Found: C, 55.08; H, 3.37; N, 9.52%. UV-Vis, CH2Cl2 solution concentration: 5.1 × 10⁻⁵ M [λmax (ε, L mol−1 cm−1)]: 279.00 nm (11710), 352.50 nm (7015), 438.00 nm (6719), 491.50 nm (5445). MS (ESI+): m/z for C80H60N12Pd4S4[M]+: calcd 1743.0106, found 1743.0109. Molar conductivity (1 × 10⁻³ mol L−1 in DMSO): 0.02 μS cm−1. HPLC: Rt = 28.18 min (at 254 nm).
N) + ν(CC), 715 ν(C–S). Anal. Calcd for C24H21N3PdS (489.92 g mol−1): C, 58.84; H, 4.32; N, 8.58%. Found: C, 58.06; H, 4.26; N, 8.57%. UV-Vis, CH2Cl2 solution concentration: 1.12 × 10⁻⁵ M [λmax (ε, L mol−1 cm−1)]: 280.50 nm (26714), 353.50 nm (17232), 439.00 nm (15357), 495.00 nm (2857). MS (ESI+): m/z for C96H84N12Pd4S4[M]+: C96H84N12Pd4S4[M]+: calcd 1959.2091, found 1959.1927. Molar conductivity (1 × 10⁻³ mol L−1 in DMSO): 0.004 μS cm−1. HPLC: Rt = 33.03 min (at 254 nm).
N) + ν(CC), 715 ν(C–S). Anal. Calcd for C20H15N3PdS (435.83 g mol−1): C, 55.12; H, 3.47; N, 9.64%. Found: C, 55.08; H, 3.37; N, 9.52%. UV-Vis, CH2Cl2 solution concentration: 5.1 × 10⁻⁵ M [λmax (ε, L mol−1 cm−1)]: 279.00 nm (11710), 352.50 nm (7015), 438.00 nm (6719), 491.50 nm (5445). MS (ESI+): m/z for C80H60N12Pd4S4[M]+: calcd 1743.0106, found 1743.0109. Molar conductivity (1 × 10⁻³ mol L−1 in DMSO): 0.02 μS cm−1. HPLC: Rt = 28.18 min (at 254 nm).
N) + ν(CC), 715 ν(C–S). Anal. Calcd for C24H21N3PdS (489.92 g mol−1): C, 58.84; H, 4.32; N, 8.58%. Found: C, 58.06; H, 4.26; N, 8.57%. UV-Vis, CH2Cl2 solution concentration: 1.12 × 10⁻⁵ M [λmax (ε, L mol−1 cm−1)]: 280.50 nm (26714), 353.50 nm (17232), 439.00 nm (15357), 495.00 nm (2857). MS (ESI+): m/z for C96H84N12Pd4S4[M]+: C96H84N12Pd4S4[M]+: calcd 1959.2091, found 1959.1927. Molar conductivity (1 × 10⁻³ mol L−1 in DMSO): 0.004 μS cm−1. HPLC: Rt = 33.03 min (at 254 nm).
Method A. To a flask containing 0.1 mmol of [PtCl2(COD)] dissolved in 2 mL of acetonitrile was added 0.1 mmol of the desired ligand H2PrR. Et3N (0.5 mL) and then the solution was refluxed for 8 h. After cooling to room temperature, a precipitate was formed which was filtered off, washed with methanol, hexane and dried under vacuum.
Method B. 0.1 mmol of H2PrR dissolved in hot ethanol was added to a solution of the metal precursor K2[PtCl4] (0.1 mmol) in 1 mL of water. The formation of an orange coloured precipitate was observed. The reaction was kept under constant stirring at room temperature for 24 h in the absence of base. The precipitate was filtered, washed with methanol, hexane and dried under vacuum.
Method C. To a solution containing 0.1 mmol of K2[PtCl4] dissolved in 1 mL of water, a solution containing one mol equiv. H2PrR in 3 mL of DCM/MeCN (1:2) mixture was slowly added. Thereafter, 0.5 mL of triethylamine was added. The reaction mixture became clear and a red solid formed. This solution was kept under constant stirring and under reflux for 24 h. Upon slow evaporation of the solvent at room temperature a microcrystalline solid was obtained. The red solid was filtered, washed with methanol and n-hexane, and dried under vacuum. The powder obtained was recrystallized from a mixture of chloroform and acetone (1:1 v/v).
N) + ν(CC), 713 ν(C–S). Anal. Calcd for C20H15N3PtS (524.50 g mol−1): 45.80; H, 2.88; N, 8.01%. Found: C, 45.29; H, 2.91; N, 8.04%. UV-Vis, CH2Cl2 solution concentration: 5.95 × 10⁻⁵ M [λmax (ε, L mol−1 cm−1)]: 281.00 nm (4638), 383.00 nm (4184), 436.00 (3411), 465.00 (3058). MS (ESI+): m/z for C20H15N3PtS [M]+: calcd 2096.25, found 2098.76. Molar conductivity (1 × 10⁻³ mol L−1 in DMSO): 0.003 μS cm−1. 195Pt NMR (CDCl3): δ −3801.88 and −3815.21 ppm.
N) + ν(CC), 715 ν(C–S). Anal. Calcd for C24H21N3PtS (578.59 g mol−1): 54.10; H, 3.11; N, 9.96%. Found: C, 54.29; H, 3.17; N, 9.84%. UV-Vis, CH2Cl2 solution concentration: 6.04 × 10⁻⁵ M [λmax (ε, L mol−1 cm−1)]: 287.00 nm (13476), 386.00 nm (12466), 409.00 (12135). MS (ESI+): m/z for C96H84N12Pt4S4 [M + H]+: calcd 2313.4430, found 2313.4262. Molar conductivity (1 × 10⁻³ mol L−1 in DMSO): 0.009 μS cm−1. 195Pt NMR (CD2Cl2): δ −4053.34 and −4080.67 ppm.
X-ray crystallography
Single crystals of C103H95Cl3N12O2Pt4S4 (4) were grown from acetone/chloroform solution. A suitable crystal was selected and mounted on a glass fibre with Fromblin oil and placed on a Bruker APEX-II diffractometer with a CCD area detector. The crystal was kept at 200(2) K during data collection. Using Olex2,26 the structure was solved with the ShelXT27 structure solution program using Intrinsic Phasing and refined with the ShelXL28 refinement package using Least Squares minimisation. Besides tetrameric complex, the asymmetric unit contained two molecules of solvent, acetone and chloroform. There was further diffuse electron density and attempts were made to model the disordered solvent, but little progress was made using several partially occupied chloroform molecules refined with many restraints. Better progress was made using the Squeeze routine in Platon. Voids located by the Squeeze routine are shown in ESI.†Table 1 presents more detailed information about the structure determinations. The structural data have been deposited at the Cambridge Crystallographic Data Centre under the accession number CCDC 1990070.†| Empirical formula | C103H95Cl3N12O2Pt4S4 |
| Formula weight | 2547.85 |
| Temperature/K | 200(2) |
| Crystal system | Monoclinic |
| Space group | P21/n |
| a/Å | 18.8631(8) |
| b/Å | 26.4584(12) |
| c/Å | 21.3233(8) |
| α/° | 90 |
| β/° | 91.045(3) |
| γ/° | 90 |
| V/Å3 | 10640.4(8) |
| Z | 4 |
| ρ calc/g cm−3 | 1.590 |
| μ/mm−1 | 5.447 |
| F(000) | 4960.0 |
| Crystal size/mm3 | 0.2 × 0.15 × 0.15 red block |
| Radiation | MoKα (λ = 0.71073) |
| 2Θ range for data collection/° | 2.454 to 52.886 |
| Index ranges | −22 ≤ h ≤ 23, −30 ≤ k ≤ 33, −26 ≤ l ≤ 26 |
| Reflections collected | 87773 |
| Independent reflections | 21672 [Rint = 0.1224, Rsigma = 0.1492] |
| Data/restraints/parameters | 21672/216/1181 |
| Goodness-of-fit on F2 | 1.024 |
| Final R indexes [I ≥ 2σ(I)] | R 1 = 0.0657, wR2 = 0.1458 |
| Final R indexes [all data] | R 1 = 0.1516, wR2 = 0.1768 |
| Largest diff. peak/hole/e Å−3 | 1.32/−1.46 |
Results and discussion
Synthesis and characterisation
The reaction of 1-pyrenecarboxaldehyde with ethyl or cyclohexyl-thiosemicarbazide in the presence of a catalytic amount of HCl in methanol afforded yellow precipitates of composition H2PrR, which were isolated in good yields, as described for a procedure reported earlier.25,29 The purity and identities of the free thiosemicarbazones were confirmed by IR, 1H-NMR, 13C NMR, MS, HPLC and UV-vis. The 13C NMR spectra for the uncoordinated thiosemicarbazones had peaks in the expected regions, with those for CN and CS at ca. 140 ppm and 176 ppm, respectively, as observed for similar structures.30
Reactions of trans-[PdCl2(MeCN)2] or K2[PtCl4] with H2PrR in the presence of trimethylamine in MeCN under reflux afforded cyclometallated palladium and platinum complexes (Scheme 1). Two methods were used to prepare the palladium tetramers. For method A, described in the Experimental section, a dimeric product was isolated. The structure of the palladium dimers was confirmed by high resolution mass spectrometry (example in Fig. S7†). In the second method, however, the dinuclear complex was generated in situ, providing higher yields. For the preparation of the platinum tetranuclear complex, three methods were investigated, with method C being the most efficient, providing higher purity with no side products generated. The platinum dinuclear intermediate complexes could not be isolated, but they were generated in situ as described before.31 Generally, dinuclear complexes are used as intermediates in orthometallation reactions, representing the first step for the cyclometallation.32 However, since the aim was to obtain tetranuclear complexes, the isolation of such dimers was not necessary.
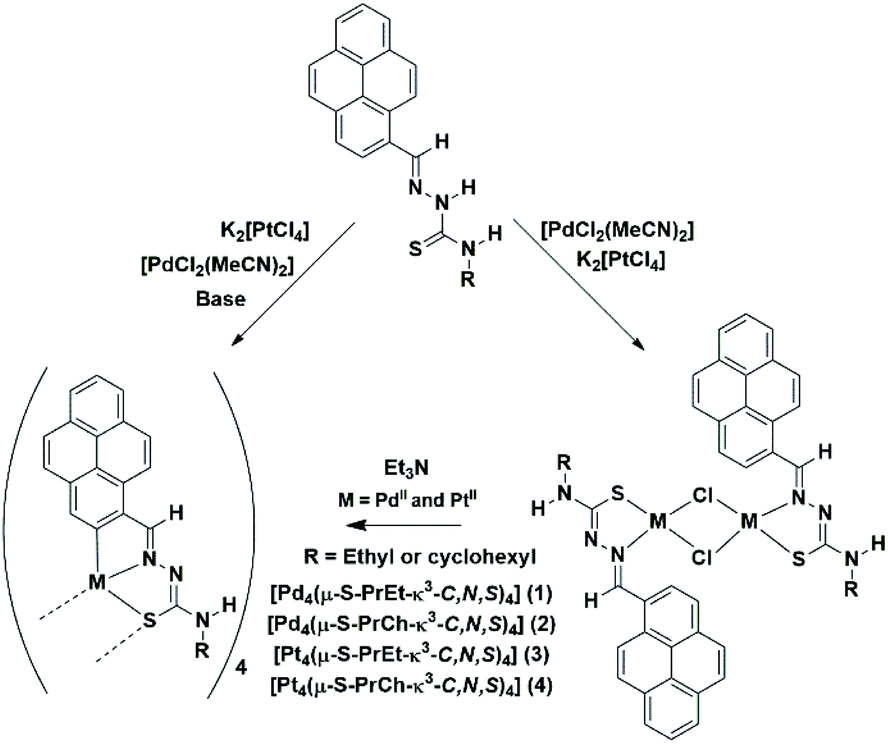 | ||
| Scheme 1 Synthesis route to the preparation of the tetranuclear complexes. | ||
The IR spectra of the free ligands H2PrEt and H2PrCh show two absorptions for the ν(NH) stretching mode, while all the complexes show only one band (see Experimental section). This suggests that the ligands are deprotonated and coordinated in the thiolate form in the four complexes. Furthermore, the ν(CN) absorption band at 1537 cm−1 for H2PrEt, shifts to lower frequencies upon complexation, being found at 1560 cm−1 in the spectra of both complexes 1 and 3. This suggests coordination to the metal ion through the iminic nitrogen. The same bathochromic shift was observed for the H2PrCh derived complexes after complexation, a ca. 30 cm−1 shift.
The 1H NMR spectrum of complex 3, recorded in CDCl3 solution, shows two sets of signals, suggesting that the tetranuclear complex possesses two units in different environments. The 1H-NMR spectrum shows two sets of peaks in the aromatic region from the four pyrene units and two sets of aliphatic hydrogen atoms related to the ethyl group from the thiosemicarbazone ligand. The spectra of the other complexes show a similar pattern. The formation of two different geometric isomers in solution probably arises from the flexibility of the eight-membered ring of alternating M–S atoms.31
The four metallocyclic complexes were analysed by nano-electrospray-ionisation MS (nESI-MS), after dissolution of a few crystals in a mixture DCM/MeOH (25/75 v/v) + 0.3% formic acid. Without the presence of acid, ionisation was poor. Both complexes 1 and 2 showed significant peaks for protonated species at m/z 1743.0109 and 1959.1927, respectively, consistent with the corresponding proposed molecular ion peaks of the palladium tetranuclear complexes (Fig. S8 and S9†). On the other hand, the solvent + acid system did not work well for the platinum tetranuclear complexes. It was possible to observe peaks for protonated complexes 3 and 4 at m/z 2098.76 and 2313.42 respectively, in accord with the formation of the platinum tetramers; however, other species were generated by this method (see Fig. S11,† as an example).
In order to verify the purity of the platinum complexes, we used 195Pt NMR spectroscopy, since each fragment shows only one characteristic signal.33 The 195Pt NMR spectra of the complexes 3 and 4 were recorded in CDCl3 and CD2Cl2, respectively, at ambient temperature. Two broad signals at −3801.9 and −3815.2 ppm were found for 3, and at −4053.3 and −4080.7 ppm for 4 (Fig. S12†), as expected from tetrameric species. The chemical shifts for square planar Pt(II) complexes are consistent with a PtCNS2 coordination sphere (δ(195Pt) −4000 to −3000 ppm), as reported in the literature.34
The electronic absorption spectra of the tetranuclear complexes in CH2Cl2 solution at room temperature display high-energy bands at λ ≈ 279–287 nm, with extinction coefficients (ε) of 1 × 10³ to 1 × 10⁴ L mol−1 cm−1, and low-energy absorption bands at λ = 352–495 nm, with extinction coefficients of 1 × 10³ L mol−1 cm−1. The high-energy absorption bands are assigned to the spin-allowed intraligand IL (π → π*) transitions of the thiosemicarbazone ligands.35 The low-energy absorption bands of the tetranuclear complexes may be metal-to-ligand charge-transfer (MLCT) transitions [dπ(Pt–Pd) → π*(TSC)],36 as observed previously for other organometallic complexes.37
The luminescence properties of the complexes were determined for DMSO solutions at ambient temperature, since only very weak emission bands were observed in CH2Cl2. The maximum emission for the complexes is blue-shifted by ∼270 nm when compared to their free ligand absorption spectra. The palladium complexes show green emission around 500 nm, while the platinum complexes exhibited two emission maxima around 450 nm. Based on such large Stokes shifts, these emissions are indicative of phosphorescence.38 The large spin–orbit coupling caused by the palladium/platinum centre, indicates efficient spin–orbit coupling, often a prerequisite for phosphorescence of organometallic complexes.39 Furthermore, the presence of a fluorophore can increase the luminescence properties of the complex.40 The emission energy of the tetranuclear complexes is not significantly influenced by the R groups of the thiosemicarbazonate ligands, since both ethyl and cyclohexyl substituents are electron-donors.
Reverse phase HPLC studies confirmed the purity of the tetranuclear palladium complexes. The chromatograms obtained show only one peak for complexes 1 and 2. Complex 1 had a retention time of 28.18 min, while the cyclohexyl derivative (complex 2) had a retention time of 33.03 min. From the retention times, it can be assumed that the cyclohexyl derivative is more lipophilic than the ethyl derivative. As indicated by the mass spectra, the platinum complexes are not stable in the acid system used for HPLC studies.
Suitable crystals of [Pt4(μ-S-PrCh-κ3-C,N,S)4](CH3)2COCHCl3 (4) were obtained by slow evaporation of a solution of complex 4 and were studied by single crystal X-ray crystallography. A perspective view of the molecule is shown in Fig. 2. Selected bond distances are summarized in Tables S1 and S2,† respectively. The asymmetric unit contains four tetrameric Pt complexes, and also two molecules of solvent acetone and a chloroform molecule. There was further diffuse electron density and attempts were made to model the disordered solvent, but little progress was made using several partially occupied chloroform molecules refined with many restraints. Better progress was made using the Squeeze routine in Platon. Voids located by the Squeeze routine are shown in detail in the ESI.†
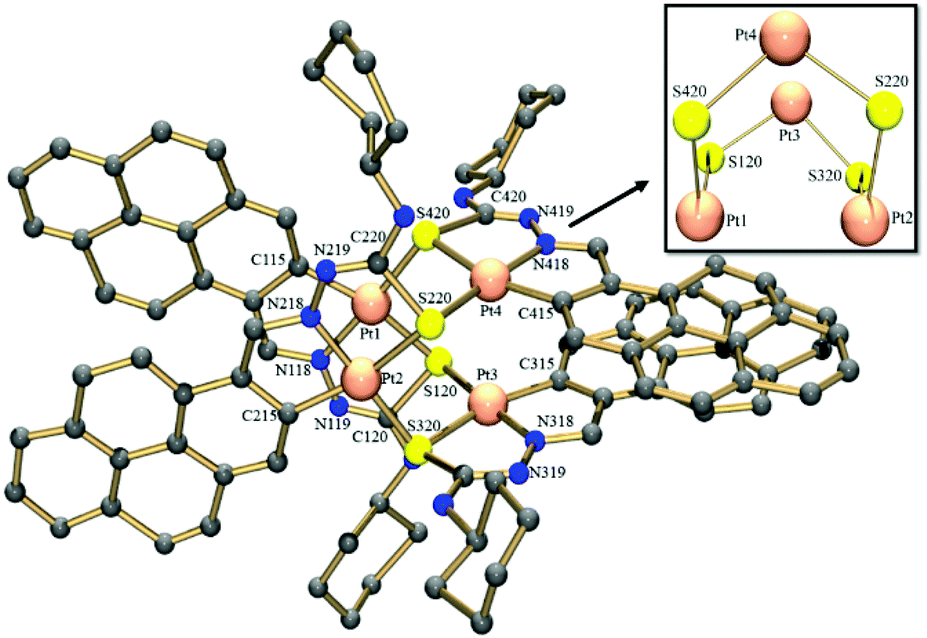 | ||
| Fig. 2 Molecular structure of complex 4. The solvent molecules and hydrogen atoms have been omitted for clarity. | ||
The X-ray structure shows the tetranuclear complex [Pt4(μ-S-PrCh-κ3-C,N,S)4](CH3)2COCHCl3 is composed of four metallated monomers held together by bridging sulfur atoms. In this way, each platinum centre possesses a coordination sphere of donor atoms from the thiosemicarbazone ligand, the imine nitrogen, a sulfur atom and an ortho carbon from the benzyl ring, while the fourth position is occupied by a sulfur atom from a neighboring monomer unit, resulting in a CNSS tetradentate coordination mode. A predominantly double bond is found for CS in the free ligand (1.685(3) Å), while in complex 4 this bond is longer, 1.820(14) Å. The enlongation of the C–S bond in the dianionic ligand is due to the deprotonation of the iminic nitrogen followed by the thioenolization of the CS bond. Pt–N bond distances of ∼2.00 Å and Pt–C of ∼2.03 Å in the five-membered orthometallo cycle are analogous to those found in other similar complexes.41 The trans influence of the metallated carbon is reflected in the lengthening of the Pt–S distance trans to this carbon atom, Pt–Schelating (ca. 2.35 Å), with respect to the Pt-S distance trans to the imine nitrogen, Pt–Sbridging (ca. 2.03 Å). This feature has also been observed for other polynuclear complexes with similar ligands.19 Therefore, the two distinct Pt–sulfur bonds, Pt–Schelating and Pt–Sbridging, show that the sulfur bridge is relatively strong. The strong M–Sbriding bond was also apparent from treatment of the tetranuclear compounds with coordinating solvents such as DMSO, DMF and acetonitrile, which did not lead to opening of the eight-membered Pt4S4 ring core of the tetranuclear structure, nor to ring cleavage of the chelate. However, some papers have described the M–Sbridging (M = Pt or Pd) bond cleavage in reactions of orthometallated TSC tetranuclear complexes with strongly binding phosphine ligands.42 The two 5-membered chelate rings are planar to each other, this planarity being extended to the pyrene fragment. Moreover, the connections between the platinum ions and the bridging sulfur atoms generate a cavity in the centre of the structure (Fig. 3). The Pt4S4 core consists of an eight-membered ring of alternating Pt(II) and S atoms in a boat conformation. The size of this cavity can be assessed by the distance between two platinum centres of parallel monomers: a Pt–Pt distance of ca. 3.37 Å. More inter-metal distances are listed in Table S3.† This Pt–Pt distance indicates little interaction between the platinum centres. This is in agreement with the reported values for tetranuclear Pt4 complexes (2.54–3.51 Å).43 The geometry around the Pt ion is distorted square-planar, in accord with the bond angles C115–Pt1–S120 [166.2(4)°], C315–Pt3–S320 [164.4(4)°], C215–Pt2–S220 [164.8(4)°], C415–Pt4–S420 [164.0(4)°]. Moreover, the two 195Pt NMR peaks are in agreement with the X-ray structure, which shows two pairs of Pt ions in different magnetic environments because of the conformation of the macrocyclic ring.16
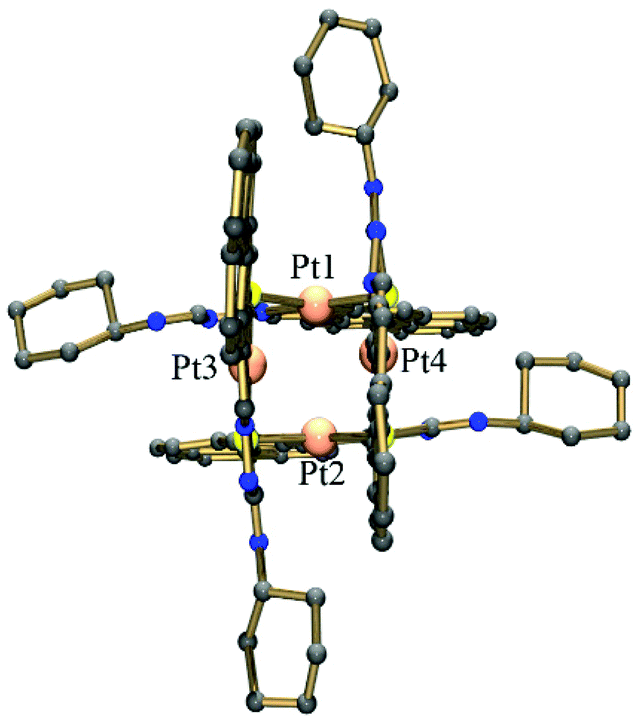 | ||
| Fig. 3 View of the tetramer 4 showing the central cavity. | ||
The crystal structure is stabilized by intermolecular hydrogen bonds involving the NH groups which have short contacts to acetone solvent molecules. Distances and angles related to hydrogen bonds are summarized in Table S4.† There is possible π stacking,44 but with only a very slight overlap between the pyrene rings. Their orientation may be dominated by the requirements of coordination.
Metal-based compounds are sometimes unstable in solution. For this reason, it is important to ensure that the tested compound is stable in aqueous solution. Therefore, as a model system, the stability of complex 1 was investigated and monitored by UV-vis spectra in H2O with 5% of DMSO for at least 24 h period at 25 °C (see Fig. S13, ESI†). The spectra remained unchanged over the time for this assay, suggesting that compounds are stable in solution.
Antiproliferative activity and cellular uptake
The inhibition of cell proliferation in ovarian cancer cell A2780 line by the tetranuclear complexes was evaluated using the SRB method,24Table 2. For comparison purposes, the anticancer drug cisplatin was also assayed under the same experimental conditions. The formation of the cyclometallated complexes resulted in an enhancement of activity against A2780 human ovarian cancer cells for complexes 1 and 3 in comparison with the free ligand H2PrEt (IC50 > 50 μM), whereas the cyclohexyl derivative complexes exhibited lower potency against the cancer cells. Comparing the two analogous complexes 1 (Pd4) and 3 (Pt4), it is notable that the simple exchange of palladium for platinum enhances the activity almost four times. The structural modification in the thiosemicarbazone ligand periphery from cyclohexyl to ethyl group also has a significant effect on the anticancer activity, with the cyclohexyl derivative being much less active in the A2780 cell line. Since the potency of the antiproliferative activity of the ethyl complexes 1 and 3 was the highest, these were then screened against the non-tumourigenic cell line MRC5, human embryonal lung fibroblasts. These two complexes exhibited much higher IC50 values in MRC5 human fibroblasts (>100 μM, Table 2) compared to A2780 cells. This cell line is used routinely as an indicator to investigate differences in toxicity between cancerous and non-cancerous cells in the early-stage development of anticancer complexes and as a preliminary predictor for cancer cell selectivity. In this case, the values obtained are highly promising as there are at least two and three orders of magnitude difference (for complexes 1 and 3 respectively) between the potency in the MRC5 and the A2780 lines.The cellular accumulation of palladium or platinum from 1 or 3, respectively, using equipotent IC50 concentrations was determined in A2780 ovarian cells in order to correlate the amount of metal accumulated with antiproliferative activity and lipophilicity. For these experiments, drug exposure time was 24 h and cells were not allowed to recover. Values are expressed as ng of Pd and Pt per million cells and were determined as independent duplicates of triplicates. The cellular accumulation of Pd for complex 1 was 6.0 ± 0.4 ng of Pd per 106 cells, while for complex 3 was 3.4 ± 0.2 ng of Pt per 106 cells, which is equivalent to a molar uptake of 3.44 and 1.62 μmol respectively, this taking into account the molecular weight of the tetramer units for complexes 1 and 3 (Table 3).
| ng Pt/Pd × 106 cells | |
|---|---|
| 1 | 6.0 ± 0.4 |
| 3 | 3.4 ± 0.2 |
| CDDP | 0.51 ± 0.07 |
Due to the potent cytotoxicity of complex 3, we investigated its effects on the cell cycle (Fig. 4). Complex 3 was incubated with A2780 ovarian cancer cells for 24 h. For this study, cells were stained using propidium iodide (PI) as a fluorescent probe that interacts with DNA through intercalation. In comparison to the control population, data shown in Table S5 (ESI†) for complex 3 at two different concentrations, it is notable that there is no significant difference in the population of G1, G2/M and S phases after 24 h of exposure to the platinum complex (e.g., from 63.5 ± 1.0% for the control versus 61.8 ± 0.6% for G1 at the highest concentration tested). These results contrast dramatically with those for CDDP, which causes cell cycle arrest in the S phase given its DNA-based mechanism of action.45
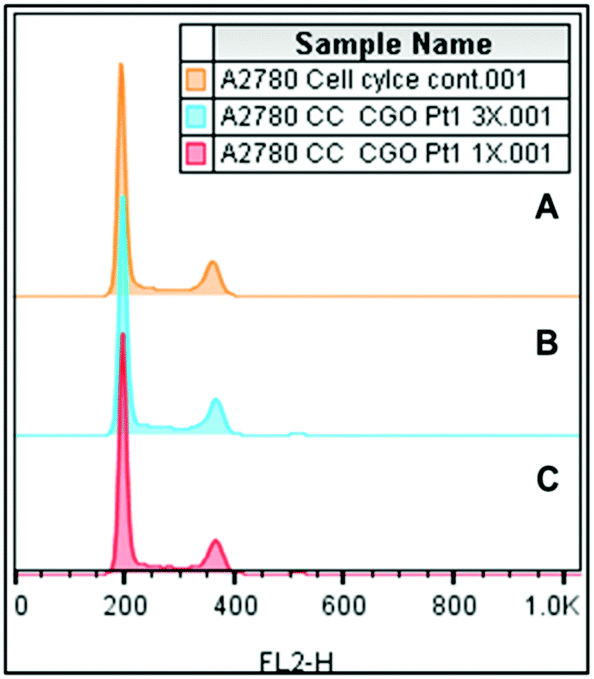 | ||
| Fig. 4 FL2-H histograms obtained by flow cytometry for cell cycle analysis (A) control untreated cells; (B) cells treated using 3 times IC50 concentration of complex 3; (C) cells treated using 0.4 μM of complex 3. Experiments included 24 h drug exposure time. | ||
One cellular response to stress stimuli is programmed cell death (apoptosis). The possibility that treatment of A2780 cancer cells with the platinum tetranuclear complex 3 leads to apoptosis was investigated. Annexin V-fluorescein isothiocyanate (FITC) and propidium iodide (PI) dual-staining allowed the detection of four different cellular populations: viable cells, non-viable cells and early-stage, and late-stage apoptosis. Early-stage apoptosis is characterised by changes in the symmetry of the phospholipid membrane, and late-stage by further disruption of the integrity of the cell membrane so it becomes permeable to PI. Staurosporine, a potent apoptosis-inducer, was used as a positive control.46 After 24 h of drug exposure, the extent of non-viable, early and late apoptotic cells is close to zero. No population of cells in either of these two stages of apoptosis was detected (Fig. 5). The compound does not affect any of the apoptotic populations, showing only viable cells (see Table S2†).
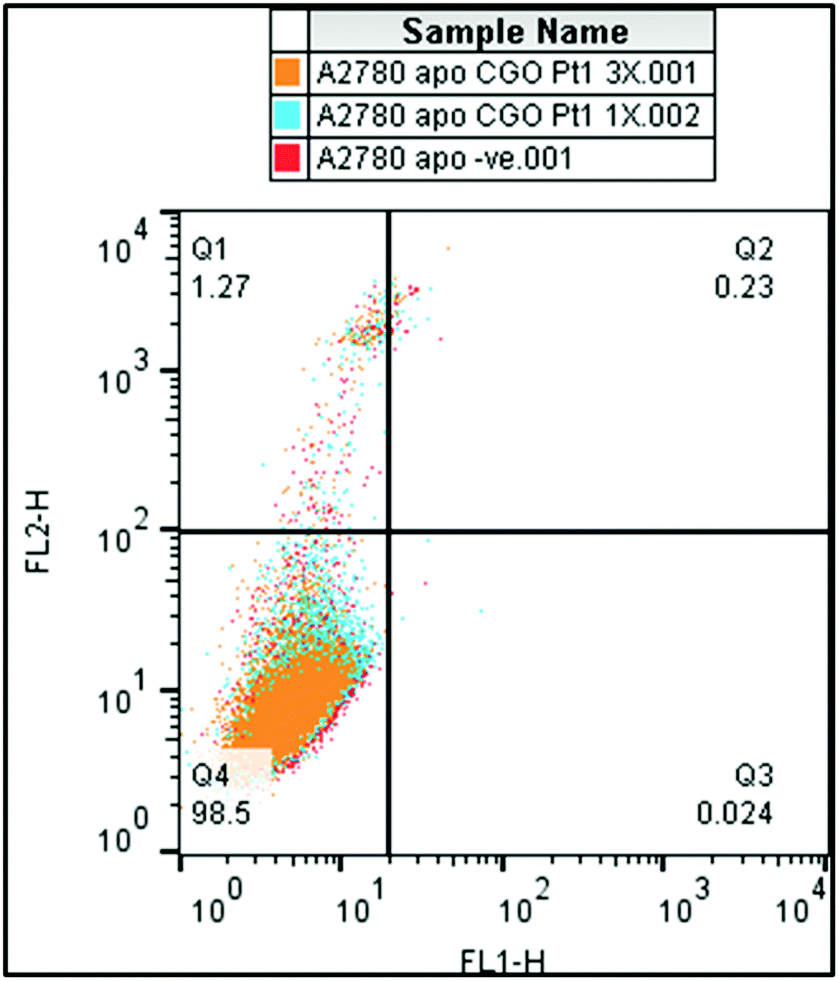 | ||
Fig. 5 FL2-H vs FL1-H dot plots obtained by flow cytometry for apoptosis analysis using FITC (FL1-H channel) and PI (FL2-H channel) staining. ( ) cells treated using 3× IC50 concentration of complex 3; ( ) cells treated using 3× IC50 concentration of complex 3; ( ) Cells treated using 0.4 μM of complex 3. ( ) Cells treated using 0.4 μM of complex 3. ( ) Control untreated cells. For all experiments, drug exposure time was 24 h, cells were treated with RNAse and stained using PI. ) Control untreated cells. For all experiments, drug exposure time was 24 h, cells were treated with RNAse and stained using PI. | ||
In the absence of apoptosis after 24 h of drug exposure, we investigated the cellular membrane integrity by flow cytometry. A2780 cells exposed to complex 3 at two different concentrations (1× IC50 concentration and 3× IC50 concentration) tested negative for increased fluorescence of the 7-ADD stain in the FL2-red channel, indicating that, under these experimental conditions, there is no cellular membrane integrity damage (Fig. 6). However, metal accumulation studies in A2780 cells indicated that complex 3 does accumulate in the cancer cells. We also attempted to investigate the interaction of complexes 1 and 3 with DNA (circular and linear dichroism) and with GSH. However, due to their poor solubility in buffer, it was not possible to perform these experiments despite many attempts at different concentrations of DMSO and water, but in all the cases precipitation of the compounds was observed.
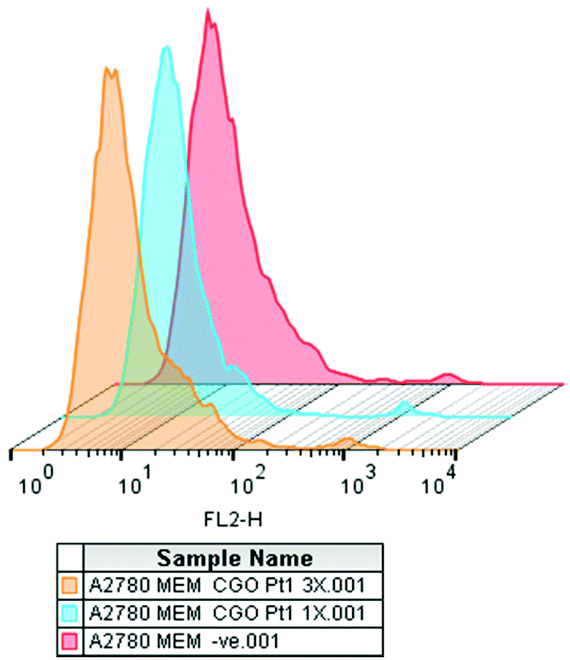 | ||
| Fig. 6 Membrane integrity assessed by flow cytometry for A2780 cancer cells (red) and after treatment with complex 3 at 1× IC50 concentration (blue) and 3× IC50 concentration (orange) at 310 K. Viable cell membrane (FL2−). Non-viable cell membrane (FL2+). No changes were observed after 24 h drug exposure. | ||
Conclusions
Four tetrameric palladium(II) and platinum(II) complexes [M4(μ-S-PrR-κ3-C,N,S)4] containing tridentate thiosemicarbazones (H2PrR) derived from monocyclic aromatic aldehydes and thiosemicarbazides have been synthesised by ortho-metallation reactions via C–H activation of a pyrene ring substituent. These new cyclometallated complexes were fully characterised using various analytical techniques and also for one Pt4 complex by X-ray crystallography. The crystal structure confirmed that the thiosemicarbazone ligands undergo cyclometallation reactions to give tetranuclear compounds with a central core consisting of an eight-membered ring of alternating platinum and sulfur atoms. The R = ethyl PrR thiosemicarbazone complexes are potently cytotoxic to human ovarian cancer cells being as active (Pd, 1) or an order of magnitude more active (Pt, 3) than the clinical drug cisplatin. Moreover, the tetranuclear R = ethyl complexes appear more selective for cancer cells versus non-tumourigenic cells than cisplatin. In contrast to cisplatin, these complexes do not induce apoptosis, nor cause cell membrane damage. Hence, the difference in mechanism of action may provide a basis for combatting cisplatin resistance which is a major current problem and causes an unmet clinical need.Conflicts of interest
There are no conflicts of interest to declare.Acknowledgements
The authors thank CNPq (Grant 141845/2013-9 and 201134/2015-2), CAPES (Finance Code 001), FAPESP (Grant 2009/54011-8), the EPSRC (grant no. EP/F034210/1 and EP/P030572/1 to PJS) and Wellcome Trust (grant no. 107691/Z/15/Z to PJS and IRC) for support.References
- P. I. S. Maia, Z. A. Carneiro, C. D. Lopes, C. G. Oliveira, J. S. Silva, S. de Albuquerque, A. Hagenbach, R. Gust, V. M. Deflon and U. Abram, Dalton Trans., 2017, 46, 2559 RSC.
- M. A. LeBlanc, A. G. Sarrías, F. A. Beckford, P. C. Mbarushimana and N. P. Seeram, Int. J. Inorg. Chem., 2011, 2011, 1 CrossRef PubMed.
- P. I. S. Maia, H. H. Nguyen, A. Hagenbach, S. Bergemann, R. Gust, V. M. Deflon and U. Abram, Dalton Trans., 2013, 42, 5111 RSC.
- C. G. Oliveira, P. I. S. Maia, P. C. Souza, F. R. Pavan, C. Q. F. Leite, R. B. Viana, A. A. Batista, O. R. Nascimento and V. M. Deflon, J. Inorg. Biochem., 2014, 132, 21 CrossRef CAS PubMed.
- C. G. Oliveira, P. I. S. Maia, M. Miyata, F. R. Pavan, C. Q. F. Leite, E. T. de Almeida and V. M. Deflon, J. Braz. Chem. Soc., 2014, 25, 1848 CAS.
- A. R. Rettondin, Z. A. Carneiro, A. C. R. Gonçalves, V. F. Ferreira, C. G. Oliveira, A. N. Lima, R. J. Oliveira, S. de Albuquerque, V. M. Deflon and P. I. S. Maia, Eur. J. Med. Chem., 2016, 120, 217 CrossRef CAS PubMed.
- E. Gutierrez, D. R. Richardson and P. J. Jansson, J. Biol. Chem., 2014, 289, 33568 CrossRef CAS PubMed.
- C. A. Kunos and T. M. Sherertz, Front. Oncol., 2014, 4, 1 Search PubMed.
- R. Trondl, L. S. Flocke, C. R. Kowol, P. Heffeter, U. Jungwirth, G. E. Mair, R. Steinborn, É.A Enyedy, M. A. Jakupec, W. Berger and B. K. Keppler, Mol. Pharmacol., 2014, 85, 451 CrossRef PubMed.
- V. Venkatesh, C. J. Wedge, I. R. Canelón, A. Habtemariam and P. J. Sadler, Dalton Trans., 2016, 45, 13034 RSC.
- D. Hanahan and R. A. Weinberg, Cell, 2000, 100, 57 CrossRef CAS PubMed.
- T. S. Lobana, RSC Adv., 2015, 5, 37231 RSC.
- F. X. Wang, M. H. Chen, X. Y. Hu, R. R. Ye, C. P. Tan, L. N. Ji and Z. W. Mao, Sci. Rep., 2016, 6, 38954 CrossRef CAS PubMed.
- T. T. H. Fong, C. N. Lok, C. Y. S. Chung, Y. M. E. Fung, P. K. C. P, K. Wan and C. M. Che, Angew. Chem., Int. Ed., 2016, 55, 11935 CrossRef CAS PubMed.
- M. Frik, J. F. Gallardo, O. Gonzalo, V. M. Sanjuan, M. G. Alvarez, A. S. del Valle, C. Hu, I. G. Alvarez, M. Bermejo, I. Marzo and M. Contel, J. Med. Chem., 2015, 58, 5825 CrossRef CAS PubMed.
- A. G. Quiroga and C. N. Ranninger, Coord. Chem. Rev., 2004, 248, 119 CrossRef CAS.
- N. Raja, N. Devika, G. Gupta, V. L. Nayak, A. Kamal, N. Nagesh and B. Therrien, J. Organomet. Chem., 2015, 794, 104 CrossRef CAS.
- R. R. Avirah and G. B. Schuster, Photochem. Photobiol., 2013, 89, 332 CrossRef CAS PubMed.
- A. G. Quiroga, J. M. Pérez, I. L. Solera, J. R. Masaguer, A. Luque, P. Román, A. Edwards, C. Alonso and C. N. Ranninger, J. Med. Chem., 1998, 41, 1399 CrossRef CAS PubMed.
- R. N. Prabhu and S. Pal, J. Chem. Sci., 2015, 127, 589 CrossRef CAS.
- P. Chellan, K. M. Land, A. Shokar, A. Au, S. H. An, C. M. Clavel, P. J. Dyson, C. de Kock, P. J. Smith, K. Chibale and G. S. Smith, Organometallics, 2012, 31, 5791 CrossRef CAS.
- T. S. Lobana, P. Kumari, G. Hundal, R. J. Butcher, A. Castineiras and T. Akitsu, Inorg. Chim. Acta, 2013, 394, 605 CrossRef CAS.
- M. S. Inkpen, A. J. P. White, T. Albrecht and N. J. Long, Chem. Commun., 2013, 49, 5663 RSC.
- V. Vichai and K. Kirtikara, Nat. Protoc., 2006, 1, 1112 CrossRef CAS PubMed.
- C. G. Oliveira, I. Romero-Canelón, M. M. Silva, J. P. C. Coverdale, P. I. S. Maia, A. A. Batista, S. Castelli, A. Desideri, P. J. Sadler and V. M. Deflon, Dalton Trans., 2019, 48, 16509 RSC.
- O. V. Dolomanov, L. J. Bourhis, R. J. Gildea, J. A. K. Howard and H. Puschmann, J. Appl. Crystallogr., 2009, 42, 339 CrossRef CAS.
- G. M. Sheldrick, Acta Crystallogr., Sect. A: Found. Adv., 2015, 71, 3–8 CrossRef PubMed.
- G. M. Sheldrick, Acta Crystallogr., Sect. C: Struct. Chem., 2015, 71, 3–8 Search PubMed.
- X. Wang, H. Yan, X. Feng, Y. Chen and J. Qiao, Chinese J. Org. Chem., 2010, 30, 1563 CAS.
- P. I. S. Maia, Z. A. Carneiro, C. D. Lopes, C. G. Oliveira, J. S. Silva, S. Albuquerque, A. Hagenbach, R. Gust, V. M. Deflon and U. Abram, Dalton Trans., 2017, 46, 2559 RSC.
- C. N. Ranninger, I. T. Solera, A. A. Valdés, J. H. Rodriguez, J. R. Masaguer and J. L. G. Ruano, J. Organomet. Chem., 1994, 476, 19 CrossRef.
- A. G. Quiroga, J. M. Pérez, I. López-Solera, J. R. Masaguer, A. Luque, P. Roman, A. Edwards, C. Alonso and C. Navarro-Ranninge, J. Med. Chem., 1998, 41, 1399 CrossRef CAS PubMed.
- E. Gabano, E. Marengo, M. Bobba, E. Robotti, C. Cassino, M. Botta and D. Osella, Coord. Chem. Rev., 2006, 250, 2158 CrossRef CAS.
- S. J. B. Price, L. Ronconi and P. J. Sadler, Prog. Nucl. Magn. Reson. Spectrosc., 2006, 49, 65 CrossRef.
- S. Mandal, V. Kundi, D. K. Seth, K. Srikanth and P. Gupta, Polyhedron, 2014, 80, 290 CrossRef CAS.
- Y. Ai, Y. Li, H. Ma, C. Y. Su and V. W. W. Yam, Inorg. Chem., 2016, 55, 11920 CrossRef CAS PubMed.
- G. Z. Lu, Y. Li, Y. M. Jinga and Y. X. Zheng, Dalton Trans., 2017, 46, 150 RSC.
- A. Kishimura, T. Yamashita, K. Yamaguchi and T. Ainda, Nat. Mater., 2005, 4, 546 CrossRef CAS PubMed.
- J. Martínez, L. A. Adrio, J. M. Antelo, J. M. Ortigueira, M. T. Pereira, J. J. Fernandez, A. Fernandez and J. M. Vila, J. Organomet. Chem., 2006, 691, 2721 CrossRef.
- G. Bains, A. B. Patel and V. Narayanaswami, Molecules, 2011, 16, 7909 CrossRef CAS PubMed.
- D. Yuan and H. V. Huynh, Inorg. Chem., 2013, 52, 6627–6634 CrossRef CAS PubMed.
- F. L. Martínez, L. A. Adrio, P. P. Ces, J. M. Ortigueira, J. J. Fernández, H. Adams, M. T. Pereira and J. M. Vila, Dalton Trans., 2016, 45, 17598 RSC.
- W. Hernándeza, J. Paz, A. Vaisberg, E. Spodine, R. Richter and L. Beyer, Bioinorg. Chem. Appl., 2008, 690952, 1 Search PubMed.
- A. Pitto-Barry, N. P. E. Barry, V. Russo, B. Heinrich, B. Donnio, B. Therrien and R. Deschenaux, J. Am. Chem. Soc., 2014, 136, 17616 CrossRef CAS PubMed.
- J. M. Wagner and L. M. Karnitz, Mol. Pharmacol., 2009, 76, 208 CrossRef CAS PubMed.
- M. Malsy, D. Bitzinger, B. Graf and A. Bundscherer, Eur. J. Med. Res., 2019, 24, 1 CrossRef PubMed.
Footnote |
| † Electronic supplementary information (ESI) available. CCDC 1990070. For ESI and crystallographic data in CIF or other electronic format see DOI: 10.1039/d0dt01133a |
| This journal is © The Royal Society of Chemistry 2020 |