 Open Access Article
Structural characterization of HPM-7, a more ordered than expected germanosilicate zeolite†
Peng
Lu‡
 a,
Yaping
Zhang
 b,
Alvaro
Mayoral
 b,
Luis
Gómez-Hortigüela
 c and
Miguel A.
Camblor
 *a
*a
aInstituto de Ciencia de Materiales de Madrid, Consejo Superior de Investigaciones Científicas (ICMM-CSIC), c/Sor Juana Inés de la Cruz 3, 28049 Madrid, Spain. E-mail: macamblor@icmm.csic.es
bCenter for High-resolution Electron Microscopy (CħEM), School of Physical Science and Technology, ShanghaiTech University, 393 Middle Huaxia Road, Pudong, Shanghai 201210, China
cInstituto de Catálisis y Petroleoquímica, Consejo Superior de Investigaciones Científicas (ICP-CSIC), c/Marie Curie 2, 28049 Madrid, Spain
First published on 4th May 2020
Abstract
HPM-7, a germanosilicate synthesized using long imidazolium-based dications with two different linkers, is shown to possess the POS topology, although disorder may exist but it is very difficult to discern. First, three simple ordered polymorphs (POS-A to POS-C) with very similar energies and structural motifs could give rise to intergrowths that would be very difficult to recognize by powder X-ray diffraction, according to DIFFaX simulations. Another four structures (POS-D to POS-G) can be derived from POS by changing the orientation of two single four rings within the structure, possibly providing an additional source of disorder. While 3D EDT strongly suggests that HPM-7 basically possesses the POS-A (i.e. POS) topology, a detailed HR-STEM study demonstrates the rare existence of some disorder compatible with the polymorph POS-D. The general avoidance of polymorphs with very similar structural motifs and comparable energies points to a rather specific structure-direction by the organic dications used.
1. Introduction
The broad applicability of synthetic zeolites in adsorption, ion-exchange, catalysis and other processes relies on the wide variability of their properties, which is in turn related to the ample diversity of structures and chemical compositions that zeolites possess.1 This ample diversity is the consequence of a large synthesis effort carried out over the last almost eight decades.2,3 Central to rationalizing both the synthesis and applications of a zeolite is the detailed knowledge of its crystalline structure, necessary to determine both structure-synthesis and structure-application relationships. However, the structure determination of zeolites is typically hindered by the difficulty of synthesizing crystals large enough for single crystal diffraction, by their typically large unit cells, by their frequently low crystallinity and, frequently, by the existence of disorder. Zeolites may show several types of structural disorder, including intergrowth of polymorphs, disordered distribution of heteroatoms over the available crystallographic sites, the presence of connectivity defects and disordered arrangement of guests. Despite the recent progress in characterization and analysis techniques,4,5 the accurate and detailed structural determination of zeolites is still far from being a routine endeavor.Here we show our structural characterization of HPM-7, a large pore germanosilicate recently synthesized in our group by using an imidazolium-based long dication in the presence of fluoride.6 While in our previous work we recognized that HPM-7 likely possessed the POS topology, doubts arised concerning the possible existence of several forms of disorder, which we discuss here. This work emphasizes on one hand the difficulty of proving/disproving disorder in certain systems consisting of much similar polymorphs. On the other hand, it shows that the structure-direction may favour the formation of a single polymorph by preventing the extensive formation of closely related structures, even when they have similar or even smaller energies.
2. Experimental
2.1 Synthesis of organic structure directing agents and zeolites
The SDAs used in this work are octamethylene-bis-(2,3-dimethylimidazolium), denoted as 8BDMI (Fig. 1) and decamethylene-bis-(2,3-dimethylimidazolium), denoted as 10BDMI. This type of dication cannot be described as diquaternary ammonium compounds, as wrongly expressed very frequently in the literature, because none of the N is actually a quaternary ammonium (there are only three substituents at the nitrogen atoms).7 The dications were synthesized as described in our previous work,6 where the zeolite synthesis protocol was also described.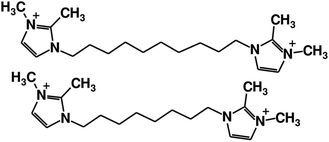 | ||
| Fig. 1 The decamethylene-bis-(2,3-dimethylimidazolium) (10BDMI, top) and octamethylene-bis-(2,3-dimethylimidazolium) (8BDMI, bottom) dications used to synthesize HPM-7, depicted using the open code JChemPaint.8 | ||
2.2 Characterization
Routine powder X-ray diffraction (PXRD) data were obtained on a Bruker D8 Advance diffractometer using Cu Kα radiation (λ = 1.5418 Å). Synchrotron powder X-ray diffraction (SPXRD) was performed in Debye-Scherrer geometry (0.8 mm capillary) using the SpLine BM25A at the ESRF, Grenoble (λ = 0.56383 Å). Rietveld refinement was carried out using GSAS9 under the EXPGUI interface.10 Routine field emission scanning electron micrographs (FE-SEM) were collected using a Philips XL30 S-FEG. HRTEM images and 3D Electron Diffraction Tomography, 3D-EDT, data were collected in a similar way to that reported for HPM-8 in our previous work.62.3 Computational methods
The relative stability of the different polymorphs derived from the POS framework (see below) was studied by DFT, using the CASTEP code,11 the PBE generalized gradient approximation,12 and plane-waves as the basis set (with a cut-off of 571.4 eV). The energies are expressed relative to that of quartz, in kcal mol−1 Si. The simulation of PXRD data corresponding to intergrowths of different polymorphs was performed using DIFFaX.133. Results and discussion
3.1 Powder XRD
In our previous work we pointed to the similarity of the PXRD patterns of HPM-7 and the recently reported PKU-16.14 The PKU-16 topology, containing a 3D system of large (11 × 11 × 12) channels, has been assigned the Zeolite Framework Type code POS.15 Attempts to Rietveld refine the structure of the as-made HPM-7 synthesized using the shorter 8BDMI dication against synchrotron powder diffraction data were however not satisfactory (Fig. S1†). We note here that, unfortunately, the structure of HPM-7 is unstable under ambient air after calcination, being amorphized in a matter of hours. Since it was impossible to properly model and refine in GSAS the highly flexible dication, we used a rigid body SDA with the conformation and in the location determined to be more stable by molecular simulations. The refinement of that system worked relatively well but we noticed a large difficulty in modelling the peak shapes and peak broadenings. Furthermore, while we reached good residuals, we got a couple of too short bonds in spite of using soft bond restrains (T2–T3: 2.95 Å, T4–T4: 2.97 Å), and the Rietveld plot suggested that the model was very far from perfect (see red arrows in Fig. S1†); then, we were not able to reach convergence while refining all relevant parameters. While the observed problems may be possibly due to the difficulty in properly modelling the highly flexible dication, they also raised the question of the possible existence of disorder.Because of the particular POS topology, we could envisage several possible sources of disorder based on intergrowths of closely related feasible polymorphs, by following two possible schemes:
1 – simple intergrowths along the [110] and/or [1−10] directions, made possible by the presence of D4R in both directions, which define layers that could thus be exchanged without much strain.
2 – intergrowths with new polymorphs deriving from POS by shifting the orientation of two different s4r units in the POS structure. POS and the new polymorphs could be intergrown along the [001] direction or, in a way similar to the option right above, along the [110] and [1−10] directions through the D4R rings in the structure.
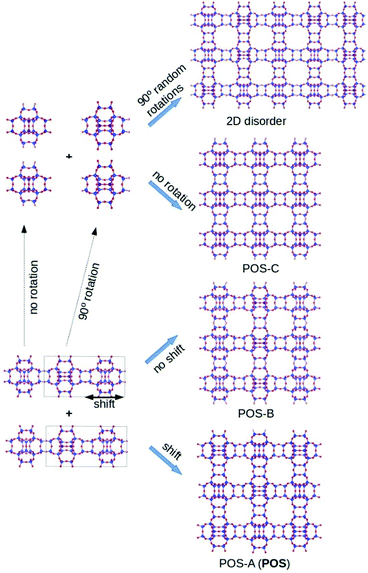
The first possibility is based on the fact that in POS there is a central structural motif that is connected to itself through D4R units along the three crystallographic directions, with or without rotation of the unit along [001]. Thus, in addition to the POS topology (that we shall call here the polymorph POS-A), two different ordered and simple polymorphs (POS-B and POS-C, see Fig. 2) can be constructed and, based on them, intergrowths could occur along [110] and/or [1−10] of the POS structure. The unit cell size and energies of the three pure silica polymorphs fully refined by DFT are given in Table 1. Interestingly, the DFT calculated energies of the three polymorphs are very close to each other. Given their similar stability and the fact that the three polymorphs are built by the same structural unit connected through D4R, we anticipated that their intergrowths could be an important source of disorder.
We simulated the effect of stacking faults along one direction using DIFFaX.13 For DIFFaX, we constructed a layer normal to the intergrowth direction (Fig. 2, bottom left) which can be stacked with a 0.5 cell shift normal to that direction to yield POS-A or without any shift to yield POS-B (Fig. 2, bottom right). Additionally, it is also possible to construct a smaller and simpler unit (half of the unit cell of the layer mentioned above) that can be intergrown with itself along [110], [1−10] or both with or without 90° rotations along c. Without rotations the polymorph POS-C arises, while POS-A and POS-B require alternate rotations along two or one directions respectively (Fig. 2). Stacking faults along a single direction can be simulated by DIFFaX, while disorder along two directions cannot. In Fig. 3, DIFFaX XRD simulations of intergrowths between polymorphs POS-A and POS-B are shown. Interestingly, this kind of intergrowth has very little impact on the corresponding XRD patterns: most reflections are invariant and the reflections that do change have low relative intensity (see Fig. S2† with all the simulations superimposed). Furthermore, when the simple polymorph C is intergrown with itself with or without 90° rotations, again this results in very subtle changes in the corresponding XRD patterns (Fig. S3†). We thus conclude that, while HPM-7 is likely close to POS-A, it is very difficult to prove or disprove by powder XRD the existence of the described types of disorder in HPM-7 and related materials.
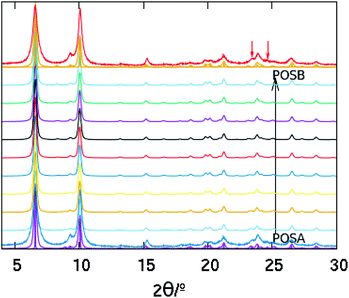 | ||
| Fig. 3 Simulated XRD patterns of a series of structures obtained by intergrowing POS-A and POS-B along [1−10]. The bottom and top noiseless traces correspond to pure POS-A and POS-B, respectively. Two patterns are depicted for each one: those of the pure polymorphs calculated by VESTA (sharp patterns)16 and those of 99% pure polymorphs calculated by DIFFaX (broad patterns). The noisy patterns next to them (red and blue patterns) correspond both to the experimental HPM-7 pattern. The rest of the patterns correspond to the intergrowths of both polymorphs with 10% increase of POS-B from one to the next one. The red arrows point to the peaks more sensitive to the intergrowth, which suggest that HPM-7 is actually closer to the polymorph POS-A. | ||
Additionally, as mentioned above, there can be another source of disorder in HPM-7, as shown in Fig. 4. There are two single 4MR (s4r) in the POS structure that could conceivably change in orientation while maintaining the rest of the topology intact. One is on the ab face of the unit cell and lies on that face in POS-A (s4r-a, below), the other is centred at the center of the unit cell and is normal to the [110] diagonal in POS-A (s4r-b). Four different polymorphs, in addition to POS-A, may arise by changing the orientation of these s4r (Table 2). When the orientation of s4r-a is taken out of the ab plane, the 11MR windows become 12MR windows. We note here that the polymorph that results when the orientation of both s4r is normal to [1−10] is the same as the one obtained orienting them normal to [110] (polymorph F). We have calculated by DFT the stabilities of these polymorphs and two of them are clearly more stable than the rest (Table 2): POS-A and the polymorph POS-E, which turned out to be BEC, the polymorph C of the Beta family.17 Two additional polymorphs (D and F) have higher relative energies while another one, polymorph G, is by far less stable than the rest. The structural relationship between POS and BEC was already noted by Hua et al.14 These two polymorphs can be intergrown in two ways: along z, by sharing O and Si atoms at z = 0 or along [110] or [1−10], due to the existence of equally spaced D4R in both polymorphs, in a similar way as described above for polymorphs A, B and C.
| Polymorph | S4r-aa | S4r-bb | Pores | R.E.c | Space group | a = bd | c |
|---|---|---|---|---|---|---|---|
| a Single 4 ring at the ab face. b Single 4 ring at the unit cell center. c Energy relative to quartz in kcal mol−1 Si. d Unit cell parameters of the DFT geometry-optimized pure-silica polymorphs. e This polymorph is actually BEC. f The a cell edge of this polymorph is roughly half the diagonal of the ab face of the others. | |||||||
| POS-A | ┴[001] | ┴[110] | 12 × 11 × 11 | 2.98 | P42/mnm (136) | 18.9537 | 11.7623 |
| POS-D | ┴[001] | ┴[1−10] | 12 × 11 × 11 | 5.71 | P42/mnm (136) | 18.7893 | 11.7580 |
| POS-Ee | ┴[1−10] | ┴[110] | 12 × 12 × 12 | 3.12 | P42/mmc (131) | 12.7768f | 13.2879 |
| POS-F | ┴[110] | ┴[110] | 12 × 12 × 12 | 6.59 | P42/mnm (136) | 18.0255 | 13.0923 |
| POS-G | ┴[110] | ┴[1−10] | 12 × 12 × 12 | 13.65 | P42/mnm (136) | 18.3279 | 12.3685 |
However, since there are large changes in the unit cell dimensions of polymorphs A and E (particularly along c, Table 2), the first type of intergrowth cannot be simulated by DIFFaX, while the second one would be in our opinion prevented by the large misfit along the [001] direction. Thus, this kind of possible disorder was not considered any further.
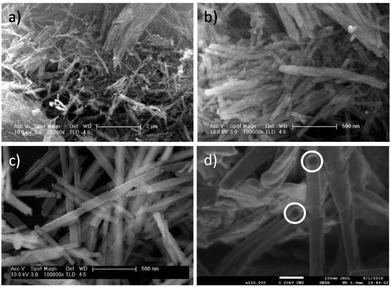
Fig. 5 shows the SEM images of the as-made HPM-7 synthesized with 8BDMI, (Fig. 5a and b) and 10BDMI (Fig. 5c and d). Both samples exhibit similar rod-like morphologies with a crystal length around 1 to 2 μm, while the former shows aggregated crystal sticks in contrast to the latter with isolated and straight ones. High-resolution SEM data, Fig. 5d, allowed the observation of isolated HPM-7 crystallites and visualize the {001} facets presenting four-fold symmetry, marked by white circles.
3.2 3D-EDT
The already presented SEM observation (Fig. 5d) allowed deducing the tetragonal crystal system. Three dimensional electron diffraction tomography (3D-EDT) was used to collect and process the 3D electron diffraction data for structure solution. For 3D-EDT, the main zone axes were avoided during the data collection to reduce the strong dynamic scattering effect from Bragg reflection. The reciprocal lattice obtained confirmed a tetragonal unit cell with lattice constants: a = 19.385 Å, b = 19.385 Å, c = 11.898 Å, α = 89.999°, β = 90.734°, γ = 90.043° obtained after analyzing 29 different crystallites. The space group was determined to be P42/mnm based on the reflection conditions (see Fig. S4 and Table S1†) and from the Fourier diffractogram (FD) analysis obtained from the atomic-resolution images (shown later on). To explore the possibility of any deviation from the aforementioned POS, 29 sets of 3D-EDT data were collected from 29 different particles. Each dataset was collected with a total rotation angle of 120o. Data solutions, unit cell parameters and other possible space group candidates are listed in Table S1.† We conclude that every crystal could be solved as P42/mnm in agreement with the POS topology. Although 3D-EDT allows the analysis of nanocrystals or very small domains in larger particles, limited by the size of the selected area diffraction aperture (SAED), it is still obtained by averaging several unit cells. To obtain more local information of smaller domains or the observation of structural defects at the atomic level, high-resolution imaging is required.183.3 C s-corrected HRSTEM
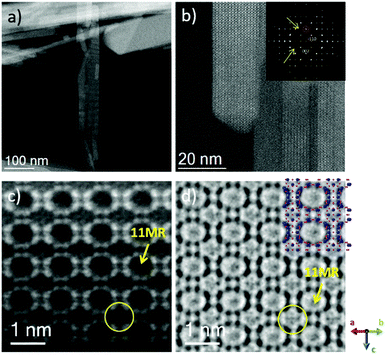
Electron microscopy observations of HPM-7 were performed by means of Cs-corrected STEM-ADF combined with Cs-corrected STEM-ABF. Low magnification analysis was carried out together with atomic-resolution observations in order to extract the maximum degree of information of the materials. Fig. 6a corresponds to the Cs-corrected STEM-ADF low-magnification micrograph where different crystals are visualized. The length of these particles can normally reach up to 1 μm, while the width oscillated from 10 nm up to 100 nm.A magnified region is depicted in Fig. 6b displaying the pore arrangement for this material. The Fourier Diffractogram (FD) is shown in the inset and it can be indexed assuming P42/mnm symmetry on the [110] orientation. From here, the c lattice constant can be directly inferred by measuring the d-spacing of the (00−2) spot, pointed by a red circle, resulting to be 11.75 Å, in agreement with the data reported in the first two rows of Table 2 and from the 3D-EDT evaluation. Furthermore, the analysis of the Fourier diffractogram also displays some clear systematic extinctions (yellow arrows) of the crystal that corroborates the P42/mnm symmetry of HPM-7. The atomic resolution Cs-corrected STEM-ADF is depicted in Fig. 6c, where atomic columns appear as bright spots and the pores appear in dark. Despite the excellent data obtained using the ADF detector the observation of the s4r, perpendicular to each other and enclosed between the 11MR, denoted by a yellow arrow, is not clearly discernible (yellow circle). With the intention of increasing the degree of detail in the image, we turned into ABF data. This mode is particularly interesting for light elements as it collects more electrons to form the image in comparison with the ADF detector due to the smaller scattered angle.19Fig. 6d shows the corresponding ABF image of the same region of the same crystal. Here, in addition to the 11MR that was already visualized by ADF, a faint signal that would correspond to the s4r, marked by a yellow circle, is also distinguished.
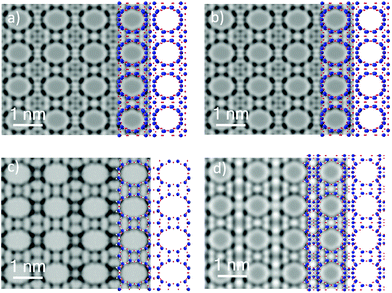
Symmetry averaged data treatment together with image simulations was performed with the intention of corroborating if the experimental data matched that obtained from the POS framework type (simulated). Fig. 7 shows the averaged data assuming plane group symmetry p1, i.e. with no symmetry restrictions imposed (Fig. 7a). Additionally, the p2mm plane group symmetry that would correspond to the space group P42/mnm on the [110] orientation is shown in Fig. 7b together with the ABF simulated image (without a template) for a material with a thickness of 11 nm, Fig. 7c. Additional image simulations were performed over polymorphs, B, C and D, see Fig. 8, along the [110] orientation. From a direct comparison of these images, it is possible to appreciate the significant differences between the experimental results and the suggested C and D models, while along this projection B cannot be differentiated from A. With the intention of obtaining additional information along a different zone axis the sample was embedded in a resin and ultramicrotomed. Fig. S5a† shows the Cs-corrected STEM-ADF image at low magnification along the [001] orientation observing a clear difference when it is compared with the previous data. In this case, a squared-liked morphology is observed, the size of this particle is around 80 nm and the electron diffraction pattern confirms the four-fold axes (Fig. S5b†). The unit cell parameters from this projection are a = b = 18.52 Å assuming the P42/mnm symmetry. A closer look displaying the pore arrangement appears in Fig. S5c and d,† allowing to conclude that the predominant phase was POS.
 | ||
| Fig. 7 C s-corrected STEM-ABF analysis. (a) Symmetry averaged micrograph, p1. (b) Symmetry averaged micrograph, p2mm and (c) ABF simulated data of the POS framework for a sample thickness of 11 nm. | ||
PXRD analyses combined with 3D-EDT data and the atomic resolution observations allowed to safely assume that HPM-7 presents the P42/mnm space group symmetry confirming the predominant POS framework type. Nevertheless, the misfitting in the PXRD analysis and the possible existence of other feasible polymorphs urged us to investigate the issue further. Several crystallites were inspected in order to find the possible deviations from the accepted symmetry. Fig. 9a shows the Cs-corrected STEM-ABF data of another HPM-7 crystal on the [110] orientation. Clearly, significant differences with the images presented before can be observed. The FDs (Fig. 9b) have been extracted from the two different regions marked by red and yellow dashed squares in Fig. 9a. The FD of the red dashed area exhibits additional extra spots, not for the shorter q values but for the longest reciprocal distances; from the [3−30] and higher, additional diffraction spots were observed, marked by circles, also observed along the c axis (white oval). The second FD presented here corresponds to the region marked by a yellow dashed square, which is in good agreement with the previous POS framework shown. A closer look at both regions is presented in Fig. 9c and d. Fig. 9d is in agreement with POS; however, Fig. 9c is significantly different. By direct comparison with the 4 models presented in Fig. 8, there is a much closer relationship with POS-D. The POS-D simulated image has been superimposed in Fig. 9c, bottom right. Additionally, a small framework modulation along the ab axis can be appreciated, which displaces the framework by ≈1 Å, as marked by a red line. Since it occurs in small regions it may be difficult to notice by both XRD and 3D-EDT measurements.
Several of the polymorphs closely related to POS (BEC, POS-B and, specially, POS-C) have energies similar (or even smaller in the case of POS-C) to those of POS-A (Tables 1 and 2) and all have very similar pore systems. The fact that, however, they do not have a large presence in HPM-7 suggests an effective structure-direction during the synthesis. Although our energy calculations correspond to the pure silica polymorphs, the effect of Ge is known to generally favour structures with D4R. Since all the polymorphs discussed here have the same density of D4R, the organic dications are deemed as effective structure-direction agents able to prevent the extensive formation of polymorphs other than POS-A.
4. Conclusions
HPM-7 is isostructural to POS in view of the HRSTEM and 3D-EDT data, although disorder may exist and may be very difficult to distinguish by PXRD, as indicated by DIFFaX simulations. Three ordered polymorphs with a 3D system of 12 × 11 × 11 pores (POS-A), 12 × 11 × 10 (POS-B) and 12 × 12 × 10 (POS-C), able to intergrow with each other and all with very similar energies, have been identified. Additionally, four structurally related structures (POS-D to POS-G, one with 12 × 11 × 11 pores and the rest, including BEC, with 12 × 12 × 12 pores) can be derived from POS. While HPM-7 basically possesses the POS-A (i.e., POS) structural type, a deeper analysis performed on different crystallites corroborates the occasional occurrence of structural defects compatible with the POS-D polymorph. The apparent scarcity of the presence of polymorphs other than POS-A, despite their very similar energy, structural units and pore systems, suggests that the organic dication is able to effectively suppress their appearance.Conflicts of interest
There are no conflicts to declare.Acknowledgements
The authors acknowledge the financial support by the Spanish Ministerio de Economía y Competitividad, the Spanish Agencia Estatal de Investigación and the EU's Fondo Europeo de Desarrollo Regional under projects MAT2016-77496-R (AEI/FEDER, UE) and MAT2015-71117-R (MINECO/FEDER, UE). We are indebted to the ERSF (Grenoble) and the BM25 Spline staff, particularly to G. Castro and A. Serrano as well as to L. A. Villaescusa (Valencia) for help in collecting the SPXRD data and for helpful comments and suggestions. P. L. is grateful to the China Scholarship Council (CSC) for a fellowship and to the Dalian Institute of Chemical Physics for permission to leave. AM acknowledges the Natural National Science Foundation of China (NFSC) through the grants NFSC-21850410448 & NSFC-21835002. AM and YZ acknowledge the Centre for High-resolution Electron Microscopy (CħEM), supported by SPST of ShanghaiTech University under contract no. EM02161943. We acknowledge the support of the publication fee by the CSIC Open Access Publication Support Initiative through its Unit of Information Resources for Research (URICI).References
- J. D. Sherman, Synthetic zeolites and other microporous oxide molecular sieves, Proc. Natl. Acad. Sci. U. S. A., 1999, 96, 3471–3478 CrossRef CAS PubMed.
- M. A. Camblor and S. B. Hong, Synthetic silicate zeolites: Diverse materials accessible through geoinspiration, in Porous Materials, ed. D. W. Bruce, D. O'Hare and R. I. Walton, Wiley, Chichester, Inorganic Materials Series, 2011, pp. 265–325 Search PubMed.
- P. Lu, L. A. Villaescusa and M. A. Camblor, Driving the crystallization of zeolites, Chem. Rec., 2018, 18, 713–723 CrossRef CAS PubMed.
- W. Wan, J. Sun, J. Su, S. Hovmoller and X. Zou, Three-dimensional rotation electron diffraction: software RED for automated data collection and data processing, J. Appl. Crystallogr., 2013, 46, 1863–1873 CrossRef CAS PubMed.
- L. Palatinus and G. Chapuis, SUPERFLIP - a computer program for the solution of crystal structures by charge flipping in arbitrary dimensions, J. Appl. Crystallogr., 2007, 40, 786–790 CrossRef CAS.
- P. Lu, A. Mayoral, L. Gómez-Hortigüela, Y. Zhang and M. A. Camblor, Synthesis of 3D large-pore germanosilicate zeolites using imidazolium-based long dications, Chem. Mater., 2019, 31, 5484–5493 CrossRef CAS.
- https://goldbook.iupac.org/terms/view/Q05003 , accessed on Jan 15th, 2020.
- S. Krause, E. Willighagen and C. Steinbeck, JChemPaint - Using the collaborative forces of the internet to develop a free editor for 2D chemical structures, Molecules, 2000, 5, 93–98 CrossRef CAS.
- A. Larson and R. V. Dreele, General Structure Analysis System (GSAS), Los Alamos National Laboratory Report LAUR 86-748, 2004.
- B. Toby, EXPGUI, a graphical user interface for GSAS, J. Appl. Crystallogr., 2001, 34, 210–213 CrossRef CAS.
- S. J. Clark, M. D. Segall, C. J. Pickard, P. J. Hasnip, M. I. J. Probert, K. Refson and M. C. Payne, First priciple methods using CASTEP, Z. Kristallogr., 2005, 220, 567–570 CAS.
- J. P. Perdew, K. Burke and M. Ernzerhof, Generalized gradient approximation made simple, Phys. Rev. Lett., 1996, 77, 3865–3868 CrossRef CAS.
- M. M. J. Treacy, J. M. Newsam and M. W. Deem, A general recursion method for calculating diffracted intensities from crystals containing planar faults, Proc. R. Soc. London, Ser. A, 1991, 433, 499–520 CrossRef.
- W. Hua, H. Chen, Z.-B. Yu, X. Zou, J. Lin and J. Sun, A Germanosilicate structure with 11 × 11 × 12-ring channels solved by electron crystallography, Angew. Chem., Int. Ed., 2014, 126, 5978–5981 CrossRef.
- C. Baerlocher and L. B. McCusker, Database of Zeolite Structures, http://www.iza-structure.org/databases/, accessed on Jan. 15th 2020 Search PubMed.
- K. Momma and F. Izumi, VESTA 3 for three-dimensional visualization of crystal, volumetric and morphology data, J. Appl. Crystallogr., 2011, 44, 1272–1276 CrossRef CAS.
- J. M. Newsam, M. M. J. Treacy, W. T. Koetsier, C. B. De Gruyter and J. M. Thomas, Structure characterization of zeolite beta, Proc. R. Soc. London, Ser. A, 1988, 420, 375–405 CAS.
- A. Mayoral, R. M. Hall, R. Jackowska and J. E. Readman, Imaging the atomic position of light cations in a porous network and the europium(III) ion exchange capability by aberration-corrected electron microscopy, Angew. Chem., Int. Ed., 2016, 128, 16361–16365 CrossRef.
- E. Okunishi, H. Sawada and Y. Kondo, Experimental study of annular bright field (ABF) imaging using aberration-corrected scanning transmission electron microscopy (STEM), Micron, 2012, 43, 538–544 CrossRef CAS.
Footnotes |
| † Electronic supplementary information (ESI) available: Fig. S1, a Rietveld plot of the as-made HPM-7 (λ = 0.56383 Å); Fig. S2, stacking faults of POS-A and POS-B along a unique direction ([1−10] o [110]); Fig. S3, the simulated XRD patterns for POS-C intergrown with itself with or without a 90° rotation; Fig. S4, different cutting planes from 3D-EDT data; Table S1, 29 independent 3D-EDT datasets; Fig. S5, Cs-corrected STEM ADF analysis of HPM-7 along the [001] zone axis. See DOI: 10.1039/D0DT00818D |
| ‡ Current address: Institute for Nanobiotechnology/WSE, Johns Hopkins University, 3400 Charles Street, Baltimore, Maryland 21218, United States (P.L.). |
| This journal is © The Royal Society of Chemistry 2020 |

