 Open Access Article
Structures of mixed manganese ruthenium oxides (Mn1−xRux)O2 crystallised under acidic hydrothermal conditions†
Lucy K.
McLeod
 a,
Geoffrey H.
Spikes
b,
Reza J.
Kashtiban
c,
Marc
Walker
 c,
Alan V.
Chadwick
d,
Jonathan D. B.
Sharman
b and
Richard I.
Walton
 *a
*a
aDepartment of Chemistry, University of Warwick, Gibbet Hill Road, Coventry CV4 7AL, UK. E-mail: r.i.walton@warwick.ac.uk
bJohnson Matthey Technology Centre, Blounts Court, Sonning Common, Reading, RG4 9NH, UK
cDepartment of Physics, University of Warwick, Gibbet Hill Road, Coventry CV4 7AL, UK
dSchool of Physical Sciences, University of Kent, Canterbury, Kent CT2 7NH, UK
First published on 12th February 2020
Abstract
A synthesis method for the preparation of mixed manganese–ruthenium oxides is presented along with a detailed characterisation of the solids produced. The use of 1 M aqueous sulfuric acid mediates the redox reaction between KRuO4, KMnO4 and Mn2+ to form ternary oxides. At reaction temperature of 100 °C the products are mixtures of α-MnO2 (hollandite-type) and β-MnO2 (rutile-type), with some evidence of Ru incorporation in each from their expanded unit cell volumes. At reaction temperature of 200 °C solid-solutions β-Mn1−xRuxO2 are formed and materials with x ≤ 0.6 have been studied. The amount of Ru included in the oxide is greater than expected from the ratio of metals used in the synthesis, as determined by elemental analysis, implying that some Mn remains unreacted in solution. Powder X-ray diffraction (XRD) shows that while the unit cell volume expands in a linear manner, following Vegard's law, the tetragonal lattice parameters, and the a/c ratio, do not follow the extrapolated trends: this anisotropic behaviour is consistent with the different local coordination of the metals in the end members. Powder XRD patterns show increased peak broadening with increasing ruthenium content, which is corroborated by electron microscopy that shows nanocrystalline material. X-ray absorption near-edge spectra show that the average oxidation state of Mn in the solid solutions is reduced below +4 while that of Ru is increased above +4, suggesting some redistribution of charge. Analysis of the extended X-ray absorption fine structure provides complementary local structural information, confirming the formation of a solid solution, while X-ray photoelectron spectroscopy shows that the surface oxidation states of both Ru and Mn are on average lower than +4, suggesting a disordered surface layer may be present in the materials.
Introduction
The oxides MnO2 and RuO2 have various applications in heterogeneous catalysis. MnO2 has been used extensively as an oxidant in organic transformations,1 in photocatalysis2 and in electrocatalysis.3 RuO2 is a material that has also been well-studied because of its use in electrocatalysis.4 RuO2 is one of the most active materials to catalyse electrochemical oxygen evolution from water under acidic conditions, which is of contemporary interest in energy devices, such as proton exchange membrane electrolysers.5 MnO2 and RuO2 have both also been explored for use in various electrochemical storage devices such as batteries and supercapacitors.6While MnO2 exists in various polymorphs and compositional variants, such as channel and layered structures that contain alkali cations and water of crystallisation,7 RuO2 is known only as a crystalline rutile structure,8 although also poorly crystalline hydrates RuO2·nH2O (n = 0.2–2.4) have been described, which are disordered versions of the rutile structure containing crystal water.9 In tuning the properties of RuO2 there are already a number of reports of how partial replacement of the Ru by another metal cation provides a means of chemically adjusting the reactivity and stability of the material. For example, for electrocatalysis in acid electrolytes, it is well established that corrosion resistance is improved by forming a solid solution with IrO2,10 while TiO2–RuO2 or SnO2–RuO2 solid solutions provide robust and stable electrodes.11 In some cases the electrocatalytic behaviour can be favourably modified by such alloying of oxides: for example Sn-substitution in RuO2 has been shown to improve the selectivity for electrocatalytic chlorine production.12 A range of lightly substituted RuO2 materials including divalent substituents such as Zn, Ni, Mg and Co, have been reported with compositions (Ru1−xMx)O2 and x up to ∼0.3, and although these are actually considered to be intergrowths rather than homogeneous solid solutions, they do show some tuneable properties to enhance electrocatalytic behaviour.13
Wen et al. reported the mixed metal Mn1−xRuxOy as a potential electrode material, and showed that the ruthenium substitution improves the electrochemical properties of the material.14 Gui et al. produced RuO2–MnO2 composite nanowires for supercapacitance applications,15 while Browne et al. suggested a high activity for OER of mixed manganese ruthenium oxide electrocatalysts in alkaline media.16 However, in these examples little evidence was provided for the formation of genuine solid solutions and a full investigation of the extent of the atomic-scale level of elemental mixing was not performed.
In the synthesis of mixed oxide materials, solution crystallisation provides the opportunity for forming nanostructured materials, as well as compositions not accessible using calcination methods, and the hydrothermal route can be particularly advantageous in this respect.17 Much work, for example, has focused on the hydrothermal preparation of TiO2, in its various polymorphs, including the high temperature rutile form as well as low temperature modifications.18 In the case of ruthenium oxides, the oxidant KRuO4 has proven to be a versatile reagent for the hydrothermal crystallisation of a variety of complex mixed-metal oxides, including new structure types.19 Herein we explore the possibility of the crystallisation of mixed ruthenium–manganese oxides in aqueous acidic media under hydrothermal conditions using the precursor KRuO4. We perform a comprehensive characterisation of the materials with the aim of understanding the structures of the materials showing how a solid-solution Mn1−xRuxO2 (x ≤ 0.6) can be produced, but that synthesis in acid conditions is complicated by the differing solubilities of the two metal cations, leading to a product stoichiometry that differs from the metal ratios used in the synthesis. This work follows from earlier work on the formation of ternary ruthenium oxides from KRuO4 in basic hydrothermal solutions,19 and the aim here was to determine whether materials might crystallise at low pH from water.
Experimental section
Materials synthesis
Synthesis of mixed manganese–ruthenium oxides was based on the hydrothermal route of DeGuzman et al. who prepared manganese oxides,20 but with the addition of KRuO4 as oxidant, as well as KMnO4, to oxidise Mn2+. A solution of 0.2945 g (0.001864 moles) KMnO4 in 5 mL of water, was added to a solution of 0.44 g (0.0026 moles) MnSO4·H2O in 1.5 mL of water and 0.7112 g concentrated H2SO4 was added to give a final concentration of 1 mol dm−3 H2SO4. Varying amounts of KRuO4 were substituted for the KMnO4 (as described in the Results and Discussion section). The mixtures were then heated in 20 ml Teflon-lined Parr autoclaves, at a temperature of either 100 °C or 200 °C, for 24 hours. The solid products were recovered by centrifuge, washed with deionised water and dried at 80 °C in air. All chemicals were used as provided by Sigma-Aldrich. For the XANES spectroscopy experiments, the reference materials Mn(NO3)2, Mn2O3, Mn3O4, MnO2, Ru(acac)3 were also purchased from Sigma-Aldrich at the highest available purity and their identity confirmed using powder XRD, while the material La4.87Ru2O12 was synthesised as in our previous work.19aMaterials characterisation
Samples were initially screened using powder X-ray diffraction (XRD) measured using a Siemens D5000 diffractometer (un-monochromated Cu Kα radiation). For lattice parameter refinement, data were recorded using a Panalytical X'Pert Pro MPD equipped with a curved Ge Johansson monochromator, giving pure Cu Kα1 radiation, and a solid state PiXcel detector. A step size of 0.013° was typically used with the time per step 750 s, from the powdered sample on a spinning flat-plate. A Bruker D8 Advance diffractometer equipped with bichromatic Cu Kα1/2 radiation and a VÅNTEC-1 high-speed detector was used for thermodiffraction measurements: powders were heated using an Anton Paar XRK 900 reaction chamber controlled through a TCU 750 temperature unit.Thermogravimetric analysis (TGA) combined with differential scanning calorimetry (DSC) was performed using a Mettler Toledo Systems TGA/DSC 1 instrument under a constant flow of air (50 mL min−1). Data were recorded from room temperature to 1000 °C at a rate of 10 °C min−1. Further thermogravimetric experiments were performed using a coupled mass spectrometry (MS): a Hiden HPR-20 QIC R&D specialist gas analysis system, a triple filter mass spectrometer with SEM detection, on heating in nitrogen was used to analyse water evolved from the materials. Surface area measurements were carried out using a Micrometrics Tristar 3000 porosimeter with samples degassed under nitrogen at 200 °C for 12 hours and surface areas were calculated from the adsorption isotherms using BET theory. Transmission electron microscopy (TEM) was performed using a JEOL 2000FX microscope with energy dispersive X-ray analysis (EDXA) using an EDAX Genesis analytical system. For ICP-OES analysis, 0.05 g of solid sample was digested in duplicate using an Anton Paar 3000 microwave digestor with 10 ml of aqua regia and made up to 100 ml with water before analysing with a Thermo 6500 ICP-OES instrument. Ru and Mn K-edge X-ray absorption near edge structure (XANES) spectra were collected on Beamline B18, at Diamond Light Source, U.K.21 Samples were diluted with polyethylene powder and pressed into pellets approximately 1 mm thick to optimise absorption measurements. Incident X-ray wavelengths were selected using a fixed exit double crystal monochromator with either Si(111) and Si(311) crystals. Data were collected in transmission mode and were normalised using the software ATHENA22 to produce XANES and extended X-ray absorption fine structure (EXAFS) spectra. The k3-weighted EXAFS spectra were modelled using the ARTEMIS software,22 which uses the FEFF code for the calculation of phase shifts and effective scattering amplitudes, with starting structural models produced from published crystal structures to refine interatomic distances and thermal parameters.
Results and discussion
The synthesis method developed herein uses a redox reaction between KRuO4, KMnO4 and Mn2+, as shown in eqn (1). The ratios of reagents were chosen to give the average oxidation state of +4 for both Mn and Ru as expected in the dioxides. | (1) |
We initially investigated the effect of reaction temperature to explore the possibility of isolation of different polymorphs in the ternary Mn–Ru–O system. DeGuzman et al. reported that for manganese oxides prepared under hydrothermal reactions in acidic media, the use of lower reaction temperatures (∼100 °C) resulted in the formation of α-MnO2.20 This material has the hollandite structure (cryptomelane) and variable amounts of potassium included within the channels of inorganic framework, so is best formulated as KxMnO2·nH2O. For hydrothermal reactions using KRuO4 aimed at making mixed-metal hollandites, however, the materials produced at 100 °C are clearly two-phase mixtures, as evidenced by powder XRD, Fig. 1. Here, materials with nominally 10% and 20% Ru are shown but higher amounts of Ru also did not lead to phase pure products. The patterns show two sets of diffraction peaks with different peak widths, and the characteristic low-angle Bragg peaks of the α-MnO2 pattern are considerably less intense than expected. Full pattern fitting using the Pawley method was performed and a satisfactory fit was achieved by modelling the materials as mixtures of α-MnO2 and β-MnO2 (rutile-type). For comparison, a sample of α-KyMnO2 was prepared using a similar synthetic approach. The parameters fitted from the powder XRD analysis, shown in Table 1, do provide some evidence for inclusion of Ru in both phases by increases in the lattice parameters compared to the pure manganese material, indicating that the larger octahedral ion Ru4+ (0.67 Å) has been substituted for the smaller Mn+4 (0.60 Å).23 The comparison with the pure manganese KyMnO2 phase is not necessarily straightforward as the lattice parameters can depend on the potassium content, and hence Mn oxidation state. The unit cell volume of the rutile-type beta phase, however, increases with increasing Ru used in the synthesis.
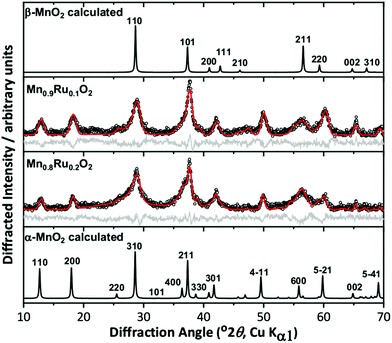 | ||
Fig. 1 Pawley fits of powder XRD patterns of attempted synthesis of α-(Mn,Ru)O2 materials, with simulated patterns of α-MnO2![[thin space (1/6-em)]](https://www.rsc.org/images/entities/char_2009.gif) 25 and β-MnO2 25 and β-MnO2![[thin space (1/6-em)]](https://www.rsc.org/images/entities/char_2009.gif) 24 for comparison. The circles are the experimental data, the red line the fitted profile, and the grey line the difference. See Table 1 for fitted unit cell parameters. 24 for comparison. The circles are the experimental data, the red line the fitted profile, and the grey line the difference. See Table 1 for fitted unit cell parameters. | ||
| Sample | Phase(s) fitted | Lattice parameter a/Å | Lattice parameter c/Å | Volume/Å3 |
|---|---|---|---|---|
| α – KyMnO2 | Alpha | 9.838(5) | 2.8604(11) | 276.8(3) |
| α – KyMn0.9Ru0.1O2 | Alpha | 9.774(15) | 2.856(2) | 272.9(9) |
| Beta | 4.38(2) | 2.945(12) | 56.5(7) | |
| α – KyMn0.8Ru0.2O2 | Alpha | 9.888(8) | 2.8684(11) | 280.4(4) |
| Beta | 4.394(7) | 2.958(8) | 57.1(2) | |
| Literature | β – MnO2![[thin space (1/6-em)]](https://www.rsc.org/images/entities/char_2009.gif) 24 24 |
4.40410(10) | 2.87650(10) | 55.793(4) |
RuO2![[thin space (1/6-em)]](https://www.rsc.org/images/entities/char_2009.gif) 8 8 |
4.4919(8) | 3.1066(7) | 62.68(4) | |
α – K0.17MnO2![[thin space (1/6-em)]](https://www.rsc.org/images/entities/char_2009.gif) 25 25 |
9.866(3) | 2.8720(10) | 279.6(3) | |
| α – MnO2·0.154H2O26 | 9.81359(10) | 2.85077(2) | 274.548(8) |
Increasing the reaction temperature to 200 °C yielded materials that were phase-pure rutile structure type by powder XRD, Fig. 2. This is consistent with work on pure manganese oxides that produced β-MnO2 with increasing temperature of hydrothermal reaction.27 For the β-Mn1−xRuxO2 materials the Bragg peaks become broader with increasing substitution of Mn by Ru and show a shift to lower angles indicating an increase in lattice parameters, consistent with replacement of Mn4+ by the larger Ru4+. The increase in broadness of the peaks may indicate smaller crystallite size, greater strain due to the mixture of cations present, or a combination of both.
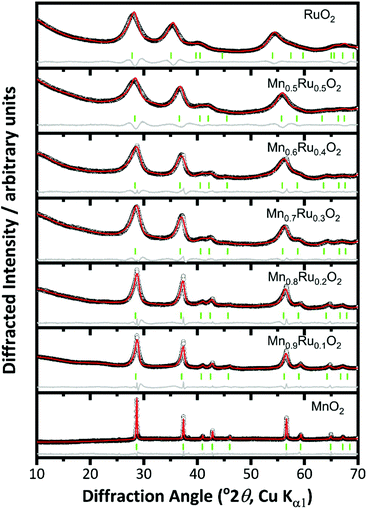 | ||
| Fig. 2 Pawley fits of powder XRD patterns of β-(Mn,Ru)O2 materials (rutile-type structure P42/mnm). The circles are the experimental data, the red line the fitted profile, the grey line the difference and the green ticks the positions of allowed Bragg peaks. See Fig. 1 for Miller indices of Bragg peaks. | ||
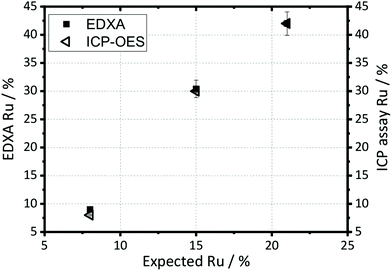
The elemental compositions quoted on Fig. 1 and 2 are taken from EDXA performed using SEM. Both ICP-OES and EDXA were used to calculate the relative amount of ruthenium and manganese in the samples, Fig. 3, which confirmed that both two techniques give essentially the same results (further analysis using XPS spectroscopy provides corroboration of this result; see below). However, the amount of ruthenium in the samples was always significantly larger than anticipated from the molar ratios of reagents used in the synthesis, suggesting that manganese remains in solution after reaction. Hence the elemental composition of every sample was analysed before further study, and the compositions quoted throughout this paper are those measured by EDXA.
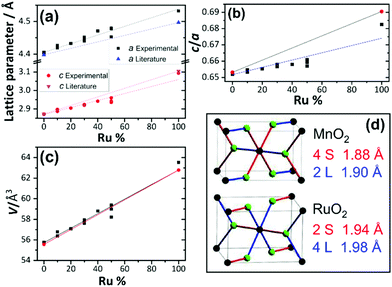
When the fitted unit cell parameters are plotted against ruthenium content, as shown in Fig. 4a, an increase in lattice parameters a and c can be seen with increasing ruthenium content. The expected values for pure RuO2 and pure MnO2 were taken from Bolzan et al.24 and Boman.8 It is observed that for the samples studied here, the lattice parameter a increases more than expected for the given ruthenium content and that lattice parameter c increases less than expected. This is most likely due to the differences in the two pure metal dioxide structures, with MnO2 having two long and four short Mn–O bonds (2L + 4S) and RuO2 having four long and two short Ru–O bonds, as depicted in Fig. 4d. Furthermore, the c/a ratio, shown in Fig. 4b, shows that RuO2 has a larger c/a ratio than MnO2 and this is consistent with the findings of Bolzan et al. who studied a range of rutile dioxides, finding that a compressed arrangement is favoured for larger c/a ratio.23 The volumes of the fitted unit cells increase in a linear trend expected by extrapolation of the pure end members, as shown in Fig. 4c. The results of diffraction analysis thus show that while the there is an anisotropic response of individual lattice parameters, due to the local coordination preferences of each of the ions, the unit cell volume responds in the expected manner upon the substitution of Mn4+ by the larger Ru4+, which taken together is consistent with the formation of a solid solution.
Crystallite sizes were calculated using the Scherrer equation and are shown in Fig. 5. The crystallite size decreases with increasing substitution of manganese with ruthenium. The error bars are particularly large for the lower ruthenium content materials, which are likely to contain two different crystallite sizes, as evidenced from the peak shape seen in the diffraction profiles, but a clear trend is still visible. The BET surface area of the materials shows a correlation with crystallite domain size, with the highest measured values found for the higher Ru content materials, Fig. 5.
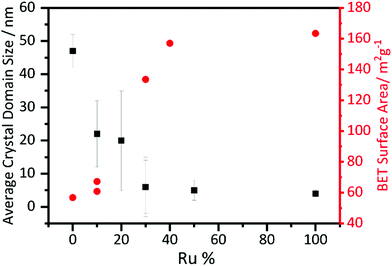 | ||
| Fig. 5 Scherrer crystallite size derived from analysis of powder XRD and BET surface areas of β-(Mn,Ru)O2 materials. | ||
SEM images of β-MnO2 and one of the ruthenium substituted materials are shown in Fig. 6a and b. The morphology of the β-MnO2 crystallised in 1 M sulfuric(VI) acid is that of needles of ∼1 μm in length. When the structure is substituted with ruthenium the particles become significantly smaller and form agglomerated clusters even for the smallest amount of Ru added. As shown by TEM in Fig. 6c the Mn0.9Ru0.1O2 shows the same needle-shaped crystals as β-MnO2 but of considerably smaller size. The material Mn0.5Ru0.5O2 shows even smaller crystallites. The particle size matches the information found from powder XRD, with crystallite size decreasing with increasing substitution of Mn by Ru, indicated by the broadening of Bragg peaks.
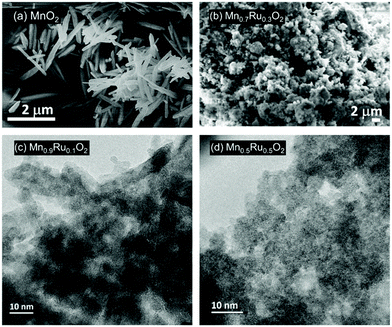 | ||
| Fig. 6 Electron microscopy of β-(Mn,Ru)O2 materials: (a) SEM of MnO2, (b) SEM of Mn0.7Ru0.3O2, (c) TEM of Mn0.9Ru0.1O2 and (d) TEM of Mn0.5Ru0.5O2. | ||
TGA-DSC was used to examine the stability of the (Mn,Ru)O2 materials (ESI†). β-MnO2 is stable until 550 °C, where it undergoes a phase change indicated by loss in mass and an endothermic feature in the heatflow. It then undergoes a second phase change at 875 °C, where it loses mass and the heatflow also changes; this can be assigned to the reduction of MnO2 to Mn2O3 then to Mn3O4.28 The TGA indicates stability until 550–600 °C for the (Mn,Ru)O2 samples. The higher temperature mass losses are observed in Mn0.9Ru0.1O2 and Mn0.7Ru0.3O2, but for the highest ruthenium content materials these features are not seen, which may be because they are either too small to be detected, or that with increasing amounts of ruthenium the sample becomes more like RuO2 and the reduction of Mn does not take place. The initial mass loss in all samples until 500 °C (ESI†) indicates a loss of water from the sample, and the higher the ruthenium content, the larger the loss of water. This may be due to smaller particle size, hence more surface water, or it may also indicate that the structure may incorporate water, similar to the hydrous ruthenium oxides reported by McKeown et al.9 TGA coupled with mass spectrometry confirms that for the higher ruthenium content materials there is indeed the presence of some tightly-bound water within the structure (ESI†).
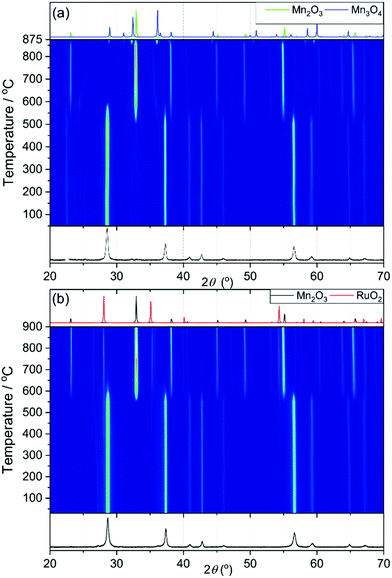
X-ray thermodiffractometry was used to assess the stability and structural evolution of the materials upon heating in air to 900 °C. Fig. 7a shows thermodiffractometry of MnO2. The sample loses oxygen and is reduced to Mn2O3 at 550 °C and then it is reduced further to Mn3O4 at 875 °C. This matches to the trends shown in the TGA-DSC (see ESI†), with an observed initial mass loss of 9.2% and a second mass loss of 3.1%. The powder X-ray patterns of Mn0.9Ru0.1O2 while heating are shown in Fig. 7b, which shows that the structure is stable until 600 °C, whereupon it phase separates into RuO2 and Mn2O3. The RuO2 then becomes more crystalline on further heating shown by the sharpening of the peaks.
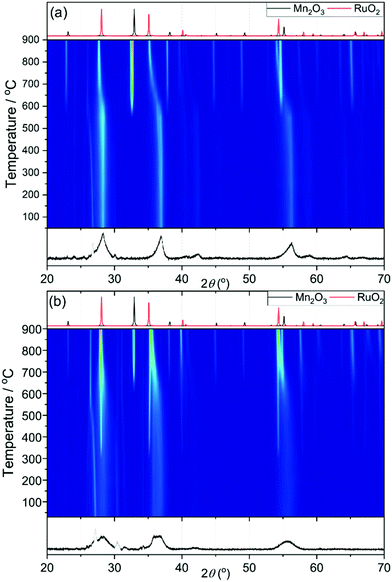
Samples with higher ruthenium content have broader XRD patterns to begin with and this makes it difficult to determine when the ruthenium oxide is formed. For example, in Fig. 8a for the sample Mn0.8Ru0.2O2 the broadness of the peaks remains until 600 °C, which indicates stability until then. At 600 °C the peaks shift to lower diffraction angles, as expected with the larger unit cell of the RuO2 rutile phase, and the manganese is reduced as seen by the appearance of Mn2O3. These results suggest that the β-(Mn,Ru)O2 solid solution would be challenging to synthesise in conventional solid-state reactions, since phase separation at moderate temperatures would have to be avoided by using specific gas atmospheres or pressure. Fig. 8b shows the heating of the Mn0.5Ru0.5O2 sample, and with this higher substitution the appearance of RuO2 occurs at the lower temperature of 300 °C, while Mn2O3 does not form until 600 °C. This may indicate the presence of an amorphous hydrous ruthenium oxide in this sample with higher Ru content that crystallises upon heating, and TGA-MS (ESI†) would be consistent with this view, since the higher Ru content materials contain strongly-bound water. Another possibility is that that the some of the ruthenium in the ruthenium rich materials is extruded upon heating to 300 °C to form a new β-(Mn,Ru)O2 rutile that then phase separates on continued heating into the separate oxides. This would be consistent with the linear expansion of the lattice parameters, as described above, that implies a solid-solution for the initial rutile. But nevertheless the presence of some surface hydrated ruthenium oxide phase cannot be ruled out.
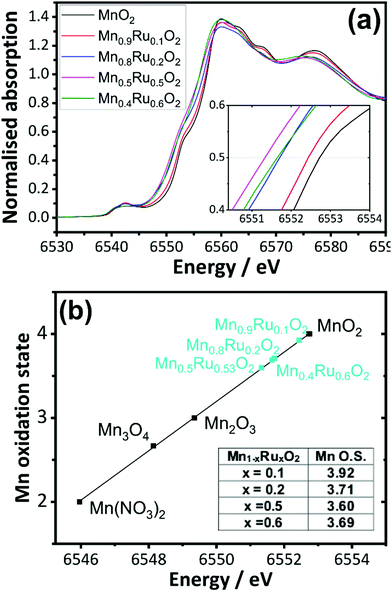
Mn K edge and Ru K edge XANES spectra were used to determine the bulk oxidation states of the manganese and ruthenium in the mixed oxides. Reference materials with known oxidation states were also studied, and edge positions were determined and plotted against oxidation state (ESI†). The linear trend from the reference materials was used to determine the average oxidation states of the metals of the manganese ruthenium oxides. Fig. 9a shows the XANES of the β-(Mn,Ru)O2 materials and Fig. 9b analysis of the XANES spectra used to determine Mn oxidation state using the edge positions taken at normalised absorption of 0.5 as the point of reference. This shows a decrease in the average oxidation state of manganese with increasing ruthenium content of the manganese ruthenium oxides.
The XANES analysis at the Ru K-edge shows a consistent picture: as shown in Fig. 10 the average ruthenium oxidation states increases above +4 in the mixed oxides. This suggests that a redistribution of charge takes place upon introducing ruthenium into MnO2, with reduction of a proportion of the Mn and oxidation of the Ru to charge balance. It is difficult to draw precise conclusions in the trends in calculated oxidation state with composition, but it does appear that the higher Ru-content materials have average Ru oxidation states of closer to +4, which would be consistent with these materials having some excess hydrated Ru present, as also suggested by the thermodiffractometry and the TGA-MS experiments.
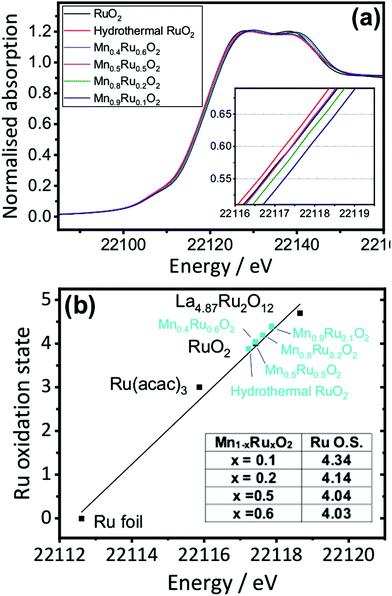 | ||
| Fig. 10 (a) Ru K-edge XANES spectra of β-(Mn,Ru)O2 materials and (b) determination of Mn oxidation state with reference to model compounds. | ||
Analysis of EXAFS spectra was performed to understand further the local atomic arrangement and to provide evidence for the formation of a solid solution. EXAFS spectra from highly crystalline RuO2 and samples of RuO2 and β-MnO2 prepared using hydrothermal synthesis were measured as reference data to establish a data analysis protocol (ESI†). It was not possible to resolve the long and short first metal–oxygen distances expected from the crystal structures (see above) and instead an average first shell of 6 M–O distances fitted the data adequately. For the hydrothermally-prepared materials two further shells of atoms contributed to the EXAFS signal: 2 next-nearest metals at ∼3 Å and 6 more distant at ∼3.5 Å. For a selected set of the mixed-metal materials EXAFS at the Mn and Ru K edges were fitted simultaneously using a single structural model. The substitution of manganese for ruthenium was achieved by using the crystal structure of either manganese or ruthenium dioxide: this was used to create 4 FEFF calculations of Mn–MnO2, Mn–RuO2, Ru–RuO2 and Ru–MnO2, where the first element is the element whose absorption is being studied and the rest of the FEFF calculation was performed assuming the rest of the structure is the second element. The resulting pathways’ amplitudes were multiplied by the occupancy for the element involved. Fig. 11 shows the fits to the EXAFS of the material Mn0.8Ru0.2O2 as an example, with the derived structural parameters provided in Table 2. Similar analysis of Mn0.925Ru0.075O2, Mn0.53Ru0.47O2 and Mn0.41Ru0.59O2 is presented in the ESI.†
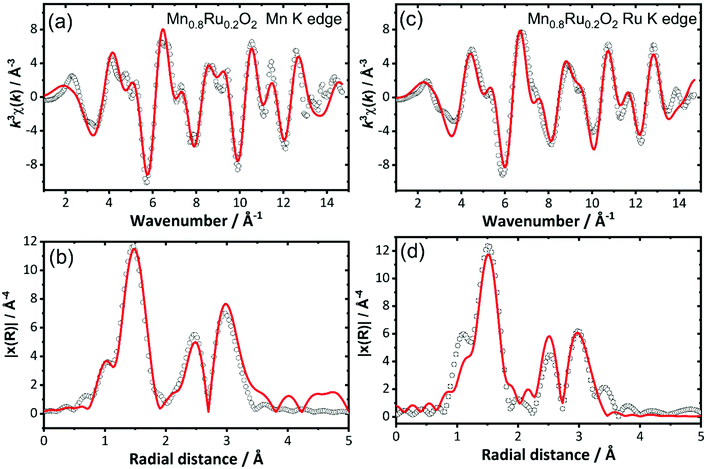 | ||
| Fig. 11 Simultaneously fitted EXAFS spectra (a) and (c), and Fourier transforms, (b) and (d), for Mn0.8Ru0.2O2 at the Mn K-edge and the Ru K-edge. See Table 2 for refined structural parameters obtained from this analysis. | ||
| Path | N | σ 2/Å2 | R cryst/Å | R/Å |
|---|---|---|---|---|
| Ru K edge (S02 = 0.73(9) and E0 = −1.75 eV) | ||||
| Ru–O | 6 | 0.0025(8) | 1.9713 | 1.954(6) |
| Ru–Ru | 0.4 | 0.003(3) | 3.1050 | 2.86(9) |
| Mn–Ru | 1.6 | 0.003(3) | 2.926(15) | |
| Ru–Ru | 1.6 | 0.007(2) | 3.5385 | 3.51(7) |
| Mn–Ru | 6.4 | 0.007(2) | 3.481(12) | |
| Mn K edge (S02 = 0.62(2) and E0 = −6.95 eV) | ||||
| Mn–O | 6 | 0.003(2) | 1.8884 | 1.89(2) |
| Mn–Mn | 1.6 | 0.003(3) | 2.8765 | 2.89(4) |
| Mn–Ru | 0.4 | 0.003(3) | 2.926(15) | |
| Mn–Mn | 6.4 | 0.007(2) | 3.4303 | 3.46(3) |
| Mn–Ru | 1.6 | 0.007(2) | 3.481(12) | |
For materials with the lower ruthenium content the contribution of the second Ru shell at ∼3 Å to the EXAFS is small, which explains the unreliable distances fitted. The trend in Mn–O and Ru–O distances provides the most diagnostic evidence for the formation of a solid solution at the atomic scale: these are plotted on Fig. 12. This reveals that both the Mn–O and Ru–O bond distances increase with increasing Ru content. This is consistent with the expected unit cell expansion, and presumably this must dominate over any change in bond distance from the small change in average metal oxidation state seen from XANES spectroscopy. This would be consistent with the continued formation of a solid-solution over the composition range studied.
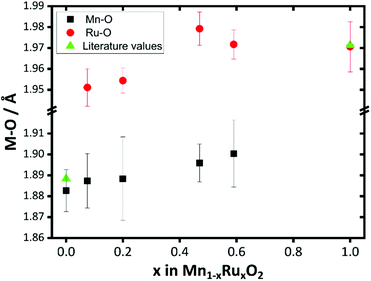 | ||
| Fig. 12 Plot of Mn–O and Ru–O distances derived from EXAFS fitting of β-(Mn,Ru)O2 materials compared with literature values for the binary oxide end members. | ||
Manganese and ruthenium XPS spectra were used to observe the surface oxidation states of the β-(Mn,Ru)O2 materials. Previous work by Morgan was used to assign the ruthenium XPS,29 and work by Biesinger et al. was used to assign the manganese 2p XPS region.30 The manganese XPS (ESI†) shows that octahedral Mn3+ exists in a similar environment to that seen in Mn2O3 at the surface of all of the Mn1−xRuxO2 materials, including the as made MnO2 and the amount of Mn3+ increases with increasing ruthenium content. This is consistent with the XANES, which showed more Mn3+ was present with increasing ruthenium content, implying that the lowering of average Mn oxidation state may be a surface phenomenon. The ruthenium 3d XPS region is more complex due to the overlapping of adventitious carbon signals. Following the work by Morgan,29 the RuO2 peaks were assigned, including satellite features along with the presence of signal that matches the literature for Ru(OH)3. This could suggest that either Ru(OH)3 is present at the surface of the samples or that a similar Ru3+ environment exists. The hydrothermally made RuO2 shows no presence of Ru(OH)3 suggesting that this is a feature of the substituted Mn1−xRuxO2 materials. The XPS was also used to estimate the Mn![[thin space (1/6-em)]](https://www.rsc.org/images/entities/char_2009.gif) :
:![[thin space (1/6-em)]](https://www.rsc.org/images/entities/char_2009.gif) Ru ratio in the materials by integration of the characterisation signals (ESI†): this gave reasonably good agreement with the earlier elemental analysis, showing that the surface metals ratios is very similar to the bulk determined by other methods, in turn suggesting that any additional surface species are only present at low concentrations and do not penetrate far into the bulk structure.
Ru ratio in the materials by integration of the characterisation signals (ESI†): this gave reasonably good agreement with the earlier elemental analysis, showing that the surface metals ratios is very similar to the bulk determined by other methods, in turn suggesting that any additional surface species are only present at low concentrations and do not penetrate far into the bulk structure.
Conclusions
In this work we have reported the synthesis of the solid solution β-(Mn,Ru)O2. Earlier reports of mixed manganese–ruthenium oxides do not provide compelling evidence for the formation of a genuine mixed oxide. The new synthesis method we have used successfully forms a solid solution, and the comprehensive range of techniques, probing long- and short-range atomic order and surface composition/structure provide evidence for the formation of mixed oxides. Powder XRD evidences an expansion of the unit cell volume on replacement of Mn by Ru in the rutile structure, but the tetragonal lattice parameters do not change isotropcially, consistent with the different local environments of the two cations. This conclusion is supported by the local structure as determined by EXAFS. The XANES spectroscopy, independently measured at the absorption edges of the two metals, implies a redistribution of charge in the solid solutions such that Mn is reduced slightly and Ru oxidised to compensate, while XPS provides evidence for some surface redox. Most reported hydrothermal conditions used for the crystallisation of mixed-metal oxides use highly basic conditions, but the acidic conditions used here open the possibility of synthesis of a wider range of materials, including compositions that may be inaccessible by other methods, and solids that may be of relevance for practical applications where acidic conditions are used.Conflicts of interest
There are no conflicts to declare.Acknowledgements
We thank Johnson Matthey for part funding a studentship for LKM via a CASE award (University of Warwick EPSRC Doctoral Training Partnership EP/M508184/1), and Diamond Light Source for provision of beamtime XANES via the Energy Materials Block Allocation Group SP14239. We are grateful to Mr James Crosland and Mr David Hammond for the TGA analysis and Guilherme Freire for valuable discussions. The research data underpinning this article can be accessed at: http://wrap.warwick.ac.uk/131058.References
- A. J. Fatiadi, in Organic Syntheses by Oxidation with Metal Compounds, ed. W. J. Mijs and C. R. H. I. de Jonge, Springer, US, Boston, MA, 1986, pp. 119–260, DOI:10.1007/978-1-4613-2109-5_3.
- D. M. Robinson, Y. B. Go, M. Mui, G. Gardner, Z. J. Zhang, D. Mastrogiovanni, E. Garfunkel, J. Li, M. Greenblatt and G. C. Dismukes, J. Am. Chem. Soc., 2013, 135, 3494–3501 CrossRef CAS PubMed.
- (a) M. Huynh, D. K. Bediako, Y. Liu and D. G. Nocera, J. Phys. Chem. C, 2014, 118, 17142–17152 CrossRef CAS; (b) M. Huynh, D. K. Bediako and D. G. Nocera, J. Am. Chem. Soc., 2014, 136, 6002–6010 CrossRef CAS PubMed; (c) M. Huynh, C. Y. Shi, S. J. L. Billinge and D. G. Nocera, J. Am. Chem. Soc., 2015, 137, 14887–14904 CrossRef CAS PubMed.
- I. M. Kodintsev and S. Trasatti, Electrochim. Acta, 1994, 39, 1803–1808 CrossRef CAS.
- T. Reier, H. N. Nong, D. Teschner, R. Schlogl and P. Strasser, Adv. Energy Mater., 2017, 7, 1601275 CrossRef.
- (a) W. F. Wei, X. W. Cui, W. X. Chen and D. G. Ivey, Chem. Soc. Rev., 2011, 40, 1697–1721 RSC; (b) J. Shin, J. K. Seo, R. Yaylian, A. Huang and Y. S. Meng, Int. Mater. Rev., 2019 DOI:10.1080/09506608.2019.1653520; (c) D. Majumdar, T. Maiyalagan and Z. Q. Jiang, ChemElectroChem, 2019, 6, 4343–4372 CrossRef CAS.
- Q. Feng, H. Kanoh and K. Ooi, J. Mater. Chem., 1999, 9, 319–333 RSC.
- C.-E. Boman, Acta Chem. Scand., 1970, 24, 116–122 CrossRef CAS.
- D. A. McKeown, P. L. Hagans, L. P. L. Carette, A. E. Russell, K. E. Swider and D. R. Rolison, J. Phys. Chem. B, 1999, 103, 4825–4832 CrossRef CAS.
- (a) O. Kasian, S. Geiger, P. Stock, G. Polymeros, B. Breitbach, A. Savan, A. Ludwig, S. Cherevko and K. J. J. Mayrhofer, J. Electrochem. Soc., 2016, 163, F3099–F3104 CrossRef CAS; (b) L. E. Owe, M. Tsypkin, K. S. Wallwork, R. G. Haverkamp and S. Sunde, Electrochim. Acta, 2012, 70, 158–164 CrossRef CAS.
- (a) A. I. Onuchukwu and S. Trasatti, J. Appl. Electrochem., 1991, 21, 858–862 CrossRef CAS; (b) X. Wu, J. Tayal, S. Basu and K. Scott, Int. J. Hydrogen Energy, 2011, 36, 14796–14804 CrossRef CAS.
- B. V. Tilak, K. Tari and C. L. Hoover, J. Electrochem. Soc., 1988, 135, 1386–1392 CrossRef CAS.
- (a) D. F. Abbott, V. Petrykin, M. Okube, Z. Bastl, S. Mukerjee and P. Krtil, J. Electrochem. Soc., 2015, 162, H23–H31 CrossRef CAS; (b) V. Petrykin, Z. Bastl, J. Franc, K. Macounova, M. Makarova, S. Mukerjee, N. Ramaswamy, I. Spirovova and P. Krtil, J. Phys. Chem. C, 2009, 113, 21657–21666 CrossRef CAS; (c) V. Petrykin, K. Macounova, J. Franc, O. Shlyakhtin, M. Klementova, S. Mukerjee and P. Krtil, Chem. Mater., 2011, 23, 200–207 CrossRef CAS; (d) V. Petrykin, K. Macounova, M. Okube, S. Mukerjee and P. Krtil, Catal. Today, 2013, 202, 63–69 CrossRef CAS; (e) V. Petrykin, K. Macounova, O. A. Shlyakhtin and P. Krtil, Angew. Chem., Int. Ed., 2010, 49, 4813–4815 CrossRef CAS PubMed.
- J. G. Wen, X. Y. Ruan and Z. T. Zhou, J. Phys. Chem. Solids, 2009, 70, 816–820 CrossRef CAS.
- Z. Gui, E. Gillette, J. Duay, J. K. Hu, N. Kim and S. B. Lee, Phys. Chem. Chem. Phys., 2015, 17, 15173–15180 RSC.
- M. P. Browne, H. Nolan, G. S. Duesberg, P. E. Colavita and M. E. G. Lyons, ACS Catal., 2016, 6, 2408–2415 CrossRef CAS.
- C. I. Hiley and R. I. Walton, CrystEngComm, 2016, 18, 7656–7670 RSC.
- (a) K. Tomita, V. Petrykin, M. Kobayashi, M. Shiro, M. Yoshimura and M. Kakihana, Angew. Chem., Int. Ed., 2006, 45, 2378–2381 CrossRef CAS PubMed; (b) T. A. Kandiel, R. Dillert, A. Feldhoff and D. W. Bahnemann, J. Phys. Chem. C, 2010, 114, 4909–4915 CrossRef CAS; (c) J. S. McManus, P. D. Cunningham, L. B. Regan and P. W. Dunne, Chem. Commun., 2012, 48, 7453–7455 RSC.
- (a) C. I. Hiley, M. R. Lees, J. M. Fisher, D. Thompsett, S. Agrestini, R. I. Smith and R. I. Walton, Angew. Chem., Int. Ed., 2014, 53, 4423–4427 CrossRef CAS PubMed; (b) C. I. Hiley, M. R. Lees, D. L. Hammond, R. J. Kashtiban, J. Sloan, R. I. Smith and R. I. Walton, Chem. Commun., 2016, 52, 6375–6378 RSC; (c) B. E. Prasad, P. Kazin, A. C. Komarek, C. Felser and M. Jansen, Angew. Chem., Int. Ed., 2016, 55, 4467–4471 CrossRef CAS PubMed; (d) T. Marchandier, Q. Jacquet, G. Rousse, B. Baptiste, A. M. Abakumov and J. M. Tarascon, Chem. Mater., 2019, 31, 6295–6305 CrossRef CAS.
- R. N. DeGuzman, Y. F. Shen, E. J. Neth, S. L. Suib, C. L. Oyoung, S. Levine and J. M. Newsam, Chem. Mater., 1994, 6, 815–821 CrossRef CAS.
- A. J. Dent, G. Cibin, S. Ramos, A. D. Smith, S. M. Scott, L. Varandas, M. R. Pearson, N. A. Krumpa, C. P. Jones and P. E. Robbins, J. Phys.: Conf. Ser., 2009, 190, 012039 CrossRef.
- B. Ravel and M. Newville, J. Synchrotron Radiat., 2005, 12, 537–541 CrossRef CAS PubMed.
- A. A. Bolzan, C. Fong, B. J. Kennedy and C. J. Howard, Acta Crystallogr., Sect. B: Struct. Sci., 1997, 53, 373–380 CrossRef.
- A. A. Bolzan, C. Fong, B. J. Kennedy and C. J. Howard, Aust. J. Chem., 1993, 46, 939–944 CrossRef CAS.
- J. Vicat, E. Fanchon, P. Strobel and D. T. Qui, Acta Crystallogr., Sect. B: Struct. Sci., 1986, 42, 162–167 CrossRef.
- N. Kijima, T. Ikeda, K. Oikawa, F. Izumi and Y. Yoshimura, J. Solid State Chem., 2004, 177, 1258–1267 CrossRef CAS.
- X. Wang and Y. D. Li, Chem. – Eur. J., 2003, 9, 300–306 CrossRef CAS PubMed.
- K. Terayama and M. Ikeda, Trans. Jpn. Inst. Met., 1983, 24, 754–758 CrossRef CAS.
- D. J. Morgan, Surf. Interface Anal., 2015, 47, 1072–1079 CrossRef CAS.
- M. C. Biesinger, B. P. Payne, A. P. Grosvenor, L. W. M. Lau, A. R. Gerson and R. S. Smart, Appl. Surf. Sci., 2011, 257, 2717–2730 CrossRef CAS.
Footnote |
| † Electronic supplementary information (ESI) available. See DOI: 10.1039/c9dt04156g |
| This journal is © The Royal Society of Chemistry 2020 |

