 Open Access Article
Creative Commons Attribution 3.0 Unported Licence
Investigation on the simultaneous removal of COS, CS2 and O2 from coke oven gas by hydrogenation on a Pd/Al2O3 catalyst
Eva
Kamp
a,
Holger
Thielert
b,
Olaf
von Morstein
b,
Sven
Kureti
c,
Norman
Schreiter
c and
Jens-Uwe
Repke
 *a
*a
aTU Berlin, Process Dynamics and Operations Group, Strasse des 17. Juni 13, Berlin 10623, Germany. E-mail: jens-uwe.repke@tu-berlin.de
bThyssenkrupp Industrial Solutions AG, Friedrich-Uhde-Strasse 15, Dortmund 44141, Germany
cTU Bergakademie Freiberg, Institute of Energy Process Engineering and Chemical Engineering Institut, chair of Reaction Engineering, Freiberg 09599, Germany
First published on 7th April 2020
Abstract
The present study deals with the processing of coke oven gas mainly composed of H2, CH4, N2 and CO to provide a feedstock for the synthesis of base chemicals. In this respect, the particular focus of this work is the simultaneous reduction of critical trace components like COS, CS2 and O2 by catalytic reaction with H2. The investigations were performed in synthetic coke oven exhaust using a Pd/Al2O3 catalyst. The results of the hydrogenation tests showed complete conversion of COS, CS2 and O2 at 200 °C and above with selective formation of H2S. However, below 200 °C the conversion of O2 was markedly reduced and CH3SH appeared as a by-product. Mechanistic studies were performed by in situ diffuse reflectance infrared Fourier transform spectroscopy coupled with mass spectrometry. These investigations demonstrated dissociative adsorption of COS on the catalyst at 150 °C resulting in the formation of bridged CO adsorbates and probably elemental sulfur. It is assumed that these species predominate the active Pd surface under reaction conditions. Consequently, the adsorption of O2 and the reaction to H2O is suppressed thus substantiating the decrease in performance at low temperatures. However, increasing the temperature to 200 °C and above leads to desorption of CO and sulfur compounds restoring the efficiency of the catalyst.
1. Introduction
Deep desulfurization is widely used for the removal of sulfur from natural gas as well as refined petroleum products, for instance gasoline and diesel fuels. The reduction of sulfur is primarily required to avoid poisoning of downstream processes such as fuel cells or depollution catalysts of combustion engines. Although well-established in petrochemical industry, deep desulfurization is still a matter of R&D, particularly to meet future legislative regulations addressing the sulfur fraction of fuels.1–6 Additionally, the reduction of sulfur is also considered for coke oven gases aiming sulfur contents below 10 mol ppm, whereas up to now no cost-efficient process exists. Coke oven gas is a by-product of the steel production and mainly consists of 60 vol% H2, 20 vol% CH4 and 6 vol% CO. Thus, the exhaust of coke ovens shows promising potential as a feedstock for basic chemicals, e.g. methanol.7 However, the exhaust also contains critical sulfur components such as COS, CS2 and mercaptans representing strong catalyst poisons, especially for Ni and Cu catalysts used in steam reforming and methanol synthesis, respectively.7,8 Therefore, deep desulfurization is required, which is mostly realized by hydrodesulfurization (HDS). HDS implies hydrogenolysis of organosulfur compounds on CoMo or NiMo catalysts yielding sulfur-free hydrocarbons and H2S. The H2S produced can subsequently be removed by ZnO adsorbers or scrubbing processes.9–11 As a result, HDS leads to drastic decrease in sulfur proportions down to 15–30 mass ppm as required for ultra-low sulfur fuels for instance.12Furthermore, for deep desulfurization of diesel fuels, noble metal catalysts based on platinum and palladium were investigated with promising results.13–17 But, only little is known on the HDS performance of noble metals in gaseous streams containing COS or mercaptans. Additionally, noble metals provide advantageous features, which are relevant for their use in gas oven exhaust, such as (i) enhancement of the removal of oxygen by reaction with hydrogen to water, since it can be harmful in downstream processes (e.g. due to safety issues or corrosion effects), (ii) suppression of coke formation by hydrogenation of olefins and (iii) their superior HDS activity as referred to traditional CoMo catalysts.14 However, there is a debate in the literature on the stability of noble metal catalysts towards sulfur poisoning.13–18 In this respect, some papers investigated the interaction of sulfur compounds with Pt and Pd catalysts. Bartholomew et al.19 reported on the dissociative adsorption of COS, CS2 and methyl mercaptan (CH3SH) with strong sticking of the sulfur on the noble metals. Moreover, Reinhoudt et al.14 studied the nature of the active sites on alumina–silica-supported Pt suggesting that the desulfurization takes place on vacancies present in small platinum particles. High activity was also attributed to the support acidity affecting the electron deficiency and weakening the noble metal–sulfur bond.20 Additionally, Pt and Pd sulfides originated from HDS can effectively be regenerated by reaction with H2 above 463 K.17,21,22
With the above background the present study is the first that deals with the simultaneous removal of organosulfur compounds and O2 from coke oven gas by hydrogenation on a commercially available Pd/Al2O3 catalyst. The investigations were made in a synthetic exhaust using a laboratory test bench with fixed bed reactor. COS and CS2 were taken as model components showing highest importance among the sulfur species in practice.20 In addition to the evaluation of the catalytic performance, in situ diffuse reflectance infrared Fourier transform spectroscopy coupled with mass spectrometry was conducted to obtain some mechanistic insights into the complex reaction network, particularly at low temperatures.
2. Experimental
2.1. Catalytic studies
The performance of the commercial Pd/Al2O3 catalyst towards hydrogenation of COS and CS2 combined with reduction of O2 was studied in a coke oven model exhaust by employing a laboratory bench equipped with fixed bed reactor. The catalyst implied a Pd load of 0.3 wt% and was used in form of spheres with a diameter of 3 mm. According to Mears and Weisz–Prater criteria it was deduced that neither film nor pore diffusion limit the chemical kinetics.23 The sample (68.6 g) was fixed in the stainless steel tube reactor (i.d. 30 mm) by quartz wool and a sieve resulting in a bed height of 15 cm. In front of the packed bed, glass beads (2.85–3.45 mm, Carl Roth) were placed to improve heating of the inlet gas. The temperature was recorded by two Pt100 shunts (type 27-7125, Bartec) directly located in front of and behind the catalyst bed. The catalyst was initially pre-treated at 350 °C for 1 h with 50% H2 in N2. Before the tests, the sample was heated up in N2 flow (5.2 LN/min) to the specific test temperature and then the feed was adjusted until steady state conditions were reached. Each test point was held for 90 min. After this, temperature (120–400 °C) or feed composition was varied. The model feed consisted of 60–120 mol ppm COS, 55–120 mol ppm CS2, 50 vol% H2, 20 vol% CH4, 1 vol% O2 and N2 as balance. The reactor pressure was regulated with a needle valve behind the reactor to 1.2 bara, whereas the total gas flow was kept at 5.2 LN/min corresponding to a space velocity of 3000 h−1. All gases were purchased from Linde. Pure H2 (5.0), CH4 (2.5) and N2 (5.0) were taken, while the sulfur compounds as well as O2 were used as mixtures with N2. Each volume flow rate was checked by independent mass flow controllers (Brooks Instruments). All electronic devices were controlled by Freelance 2013 software from ABB.The gas analysis was carried out by gas chromatography (Compact GC 4.0, Global Analyser Solutions) using a pulsed flame photometric detector (PFPD) for COS, CS2 and H2S and a thermal conductivity detector (TCD) for O2. Simultaneous measurement of organic sulfur components, H2S and O2 was not possible. Before entering the GC, the gas stream passed a condensate trap to reduce the amount of water in the columns. Furthermore, a pressure regulator was implemented to ensure a constant pressure at the inlet of the GC. With this set-up, reproducible results were achieved.
2.2. In situ DRIFTS and MS studies
The reaction of COS, O2 and H2 on the Pd/Al2O3 catalyst and the bare Al2O3 support was investigated by diffuse reflectance infrared Fourier transform spectroscopy (DRIFTS). The analyses were performed on a FTIR Spectrometer Tensor 27 (Bruker) equipped with MCT detector (Internal) and Praying Mantis DRIFTS optics (Harrick), while gas phase was simultaneously checked by mass spectrometry (Cirrus 2, MKS Instruments). In each experiment, fresh catalyst sample was placed into the cell and was subsequently pre-reduced with a mixture of N2 and H2 (50 vol% each) at 300 °C for 15 min following the pre-treatment in the catalytic studies. DRIFTS data were recorded by accumulating 200 scans resulting in a time resolution of ca. 5 min. Background spectra were taken at 40 °C and 150 °C and under flowing N2 (500 mL min−1). Subsequently, the sample was exposed to COS (200 mol ppm) at 40 and 150 °C to investigate the resulting adsorbates. For temporal separation of the overall reaction, H2 and O2 were successively dosed after the pre-adsorption of COS at 150 °C. Additionally, the simultaneous conversion of the reactive gases was checked at the same temperature by exposing the catalyst and bare support to a mixture of 200 mol ppm COS, 60 vol% H2, 1 vol% O2. N2 was used as balance. After the adsorption and reaction steps, the sample was flushed with 500 mL min−1 N2 for 25 min to differentiate gas-phase and surface species, while each exposure was made until equilibrium or steady state. The overall gas flow was always kept at 500 mL min−1. The DRIFT spectra are presented in form of the Kubelka Munk function defined as F(R) = (1 − R)2/(2R); R is the quotient of sample and background scans.3. Results and discussion
3.1. Conversion of COS, CS2 and O2 on Pd/Al2O3 catalyst
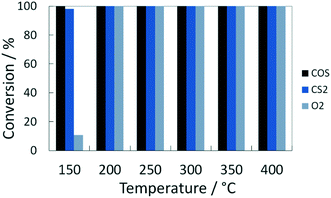
At temperatures over 200 °C the conversion of organosulfur compounds (60 mol ppm COS and 55 mol ppm CS2) as well as 1 vol% O2 was complete and stable for the established time on stream of 90 min (Fig. 1). Additionally, the formation of 140 mol ppm H2S was observed between 200 and 400 °C, which is the thermodynamically favored product under these conditions. This proportion is in line with the stoichiometry of the conversion of COS and CS2 according to eqn (1) and (2). Note that the discrepancy to the theoretical yield (170 mol ppm) is referred to influence of the condensate trap in front of the GC.| COS(g) + H2(g) ⇌ H2S(g) + CO(g) ΔRH0 = 7 kJ mol−1 | (1) |
| CS2(g) + 2H2(g) ⇌ 2H2S(g) + C(s) ΔRH0 = −158 kJ mol−1 | (2) |
| O2(g) + 2H2(g) ⇌ 2H2O(g) ΔRH0 = −484 kJ mol−1 | (3) |
| CS2(g) + 3H2(g) ⇌ CH3SH(g) + H2S(g) ΔRH0 = −160 kJ mol−1 | (4) |
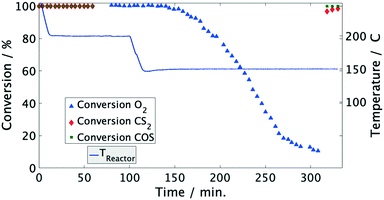 | ||
| Fig. 2 Conversion of COS, CS2 and O2 over time in model coke oven gas on Pd/Al2O3 catalyst. Conditions: 3000 1/h, 60 mol ppm COS, 55 mol ppm CS2, 50 vol% H2, 20 vol% CH4, 1 vol% O2, N2 balance. | ||
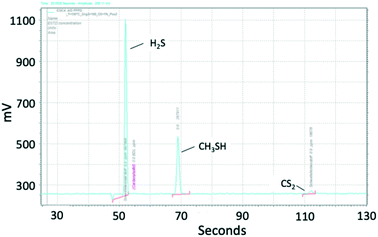 | ||
| Fig. 3 Chromatogram of sulfur components, measured with PFPD. Conditions: 3000 1/h, 150 °C, 60 mol ppm COS, 55 mol ppm CS2, 50 vol% H2, 20 vol% CH4, 1 vol% O2, N2 balance. | ||
| X(COS) in % | X(CS2) in % | y(CH3SH) in mol ppm | y(H2S) in mol ppm | X(O2) in % | |
|---|---|---|---|---|---|
| 200 °C | 100 | 100 | <3 | ≈140 | 100 |
| 150 °C | 100 | 98 | ≈30 | ≈90 | 10.6 |
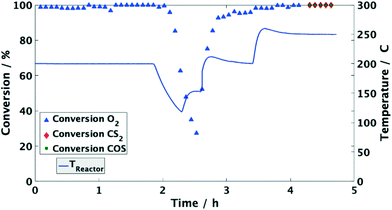
Moreover, the catalyst was exposed to a model coke oven gas with higher sulfur mole fractions, i.e. each 125 mol ppm for COS and CS2, to evaluate the effect of sulfur on the catalytic performance. At 200 °C the conversion of O2 and organic sulfur is complete. Subsequently, the temperature was lowered to 120 °C. This leads to a drop of oxygen conversion below 30% within less than 1 h (Fig. 4). Subsequently, it was heated again to 200 °C resulting in an immediate rise of the conversion to over 95%. Entire removal of O2 was achieved by further increasing the temperature to 250 °C, whereas COS and CS2 were also completely converted, i.e. the same performance was obtained than before (Fig. 2). Measuring the concentration of the sulfur components at the outlet showed the initially measured full conversions and solely a H2S peak in the product stream; note that quantitative detection of H2S was not available. This shows that sulfur, which inhibits the O2 conversion below 150 °C, is released from the catalyst and therefore it can be regenerated by an increase of temperature.
Since the conversion of O2 to H2O is inhibited below 150 °C, while the sulfur compounds are still efficiently converted (<3 ppm), it can be concluded that COS, CS2 and H2 predominately chemisorb on the active sites of the catalyst. Furthermore, the higher fractions of the sulfur components obviously favor their adsorption as indicated by the stronger inhibition of the O2 conversion (Fig. 4). This conclusion is in line with Bartholomew et al.,19 who also observed preferential adsorption of sulfur compounds compared to O2. Additionally, it is well known in the literature that sulfur forms strong bonds with metals of group 10 (Ni, Pd, Pt) due to unshared electrons. Therefore, it is assumed that in an initial step COS adsorbs on at least one Pd atom followed by dissociation into CO and S adsorbates as described by eqn (5) and (6).17,19,26–29 Obviously, the coverage of the Pd sites by S grows at lower temperatures (120 °C) thus suppressing the H2–O2 conversion as found in the experiments (Fig. 2 and 4). However, when re-increasing the temperature (>150 °C) the S adsorbates increasingly react with H2 to yield Pd and H2S,21 which was detected in the gas-phase (eqn (7)). Consequently, the active Pd sites are regenerated and are again available in sufficient abundance for the conversion of O2 as evidenced in Fig. 4.14,17,28 Since this reaction is highly exothermic (eqn (3)), it probably leads to a self-acceleration of the reaction rate. This explains the rapid rise of the conversion to over 95% when heating up from 120 °C. Above that, the conversion rises slowly, but can be accelerated by increasing the temperature.
| COS + xPd ⇌ COS–Pdx | (5) |
| COS–Pdx ⇌ CO–Pdy + S–Pdz (x = y + z) | (6) |
| S–Pdz + H2 ⇌ H2S + Pdz | (7) |
As shown by other groups, the supports' acidity has a positive effect on the regeneration of the catalyst: firstly, the number of active sites is increased because of stabilization of small noble metal particles.17,28 Secondly, acid support material weakens the Pt–S bond and therefore promotes the formation vacant sites.30,31
In this series of experiments no other side reactions were observed. However, it was previously described that metals of group 10 can catalyze the methanation reaction in this temperature range.33
3.2. Mechanistic studies
In situ DRIFTS measurements were conducted with both Pd/Al2O3 as well as Al2O3 to evaluate the role of sulfur in the inhibition of the O2 conversion at low temperatures. In these studies, COS was taken, as it represents the most prominent organic sulfur compound present in real coke oven gas.32 The DRIFTS studies were conducted by subsequently exposing the sample to O2, H2 and COS as well as by simultaneously supplying the gases.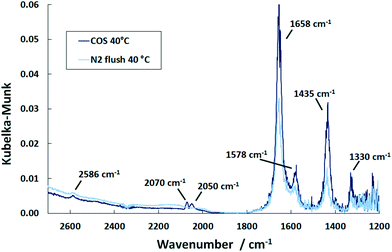 | ||
| Fig. 5 DRIFT spectra of the Pd/Al2O3 catalyst after saturation with COS at 40 °C and upon subsequent flushing with N2 (500 ml min−1, 500 ppm COS, N2 balance). | ||
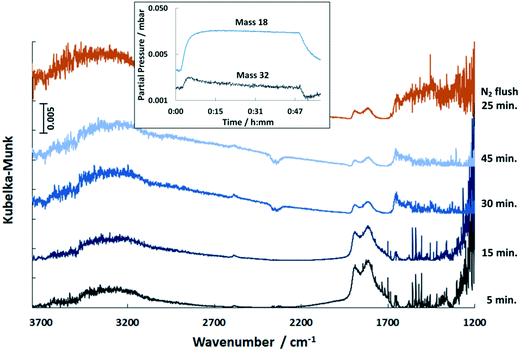
In the COS exposure at the reaction temperature of 150 °C (Fig. 6), the DRIFT spectra of the Pd/Al2O3 catalyst also show the features of HCO3− and HSCO2−. However, the intensities of the HCO3− band decline with time, whereas that of the HSCO2− entities increase. Also, molecularly adsorbed COS and the HS surface species are again observed. This result is in contrast to Jackson et al.39 who did not observe COS adsorption on Pt/Al2O3. Nevertheless, since Al2O3 is used as a catalyst for the hydrolysis of COS in Claus plants, the mechanism was widely investigated.25,40 It is generally accepted that in the initial step COS adsorbs on a OH− surface group of Al2O3 leading to the formation of HSCO2−. According to George,41 HSCO2− further reacts with water, originated from surface OH groups and H present on Pd, and subsequently dissociates to CO2, H2O and SH−. Finally, SH− is converted with H2O into H2S while OH− is reformed. This mechanism explains the formation of HCO3− on the surface, which increases at 40 °C. Since at this temperature only traces are detected by MS, most CO2 formed is adsorbed on the surface as indicated by the DRIFTS features at 1658 and 1435 cm−1 (Fig. 5). The decreasing peak at 150 °C (Fig. 6) shows that HCO3− is decomposed at higher temperatures and CO2 is released to the gas phase. Contrary, SH− remains on the catalyst surface, which is shown by the band located at 2586 cm−1 (ν(HS)), (not shown in Fig. 6).
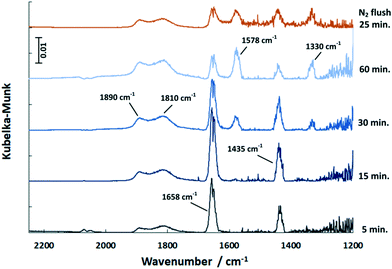 | ||
| Fig. 6 DRIFT spectra of the Pd/Al2O3 catalyst exposed to COS at 150 °C over time and upon subsequent flushing with N2 (500 ml min−1, 500 ppm COS, N2 balance). | ||
In contrast to 40 °C, a double band with maxima at 1890 and 1810 cm−1 is obtained upon COS exposure at 150 °C. According to the literature,42,43 the band at 1890 cm−1 refers to bridged Pdx–CO (with x = 2–3) moieties, whereas the feature at 1810 cm−1 is likely due to threefold hollow binding CO (Pd3–CO).42,44–47 The presence of CO adsorbates is ascribed to the dissociation of COS on Pd sites in line with the literature.39 However, the proof of resulting Pd–S species is difficult, as the corresponding stretching vibration is expected below 600 cm−1,48 which is not accessible by the DRIFTS cell used.
Compared to 40 °C a higher partial pressure of CO2 is detected in the outlet stream at 150 °C decreasing over time (Fig. 7). This effect is referred to the above mentioned HCO3− decomposition. Additionally, it is likely that the adsorbed CO reacts with surface oxygen of the support to yield CO2 which is released in the gas phase. When the excessive oxygen is consumed, CO remains on Pd as demonstrated by the growing DRIFTS bands between 1800 and 2000 cm−1 (Fig. 6). This leads to increased absorption of COS on the support (growing bands at 1578 and 1330 cm−1 in Fig. 6). Flushing the catalyst afterwards with nitrogen leads stable adsorbates. However, it has little influence on the HCO3− and HSCO2− deposits. The weakly adsorbed COS is removed immediately from the catalyst surface upon N2 flushing.
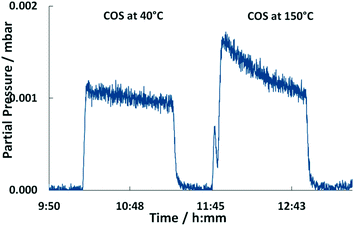 | ||
| Fig. 7 MS traces of m/z = 44 upon COS exposure of the Pd/Al2O3 catalyst at 40 °C and 150 °C over time (500 ml min−1, 500 ppm COS, N2 balance). | ||
The COS adsorption on bare Al2O3 performed at 150 °C provides no CO bands indicating that Pd is necessary for COS dissociation. Besides that, all the other features appear which confirms that they are surface species formed on Al2O3 and not on the active sites of the catalyst (Fig. 8).
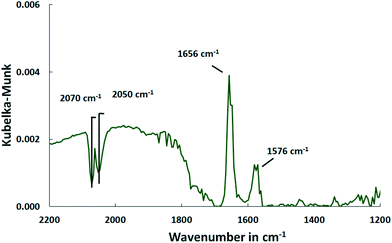 | ||
| Fig. 8 DRIFT spectra of the Al2O3 support after saturation with COS at 150 °C (500 ml min−1, 500 ppm COS, N2 balance). | ||
When supplying H2 to the catalyst at 150 °C after COS adsorption and N2 flushing all the DRIFTS bands decrease and disappear with the exception of the feature of the HCO3− species (Fig. 9). Considering the outlet stream, the MS trace showed strong release of water upon addition of H2 referred to the reaction with some surface oxygen species of the support.49 Simultaneously, the MS signal with m/z = 32 increased sharply followed by slow decay (inlay in Fig. 9). Since no oxygen has been added, it is presumably 32S derived from small amounts of H2S which were removed from the catalyst by reduction of sulfur species. This is confirmed by small and noisy signals of mass 33 and 34 that were also detected. Since the catalyst reveals little load of Pd (0.3 wt%), the amount of H2S is expected to be very small and hence hard to detect.
During the addition of H2 the bands in the region above 3000 cm−1 correlated to stretching vibrations of OH groups increase in intensity (Fig. 9), which is associated with the adsorption of H2O. Additionally, the formation of H2O enhances the hydrolysis of COS leading to the reaction of SH− and H2S, respectively. This is confirmed by detection of mass 32 that appears due to ionization and decomposition of COS into CO and S inside the mass spectrometer. Mass 60, that would indicate appearance of COS in the outlet stream was not detected. As shown in Fig. 9, the addition of H2 to the catalyst led to further but not complete reduction of the CO peak(s). It is presumed that it is thermally desorbed due to the exothermic reaction of H2 with surface oxygen species (eqn (3)). Flushing with N2 had no effect on the CO bands.
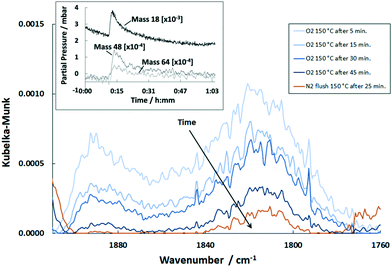
Continuing with 1 vol% O2 after exposure of the catalyst with COS and H2 induced a slow but almost complete removal of CO (Fig. 10). A small band of threefold bound CO was still observed at 1807 cm−1 after 45 min. Additionally, MS indicates signals with m/z ratios of 33 and 34, which are clearly more pronounced as compared to the natural abundance of 16O17O and 17O2. Due to the relatively high partial pressure these masses are unlikely to be HS− or H2S. Instead they are probably different combinations of H and O atoms and hence of a minor importance of the catalytic activity.
Furthermore, the exposure of O2 lead to weak MS peaks 64 (SO2+) and 48 (SO+) associated with SO2 (inlay in Fig. 10). Hence, residues of sulfur were still present on the catalyst surface after H2 treatment. Since SO2 is produced on Pd/Al2O3 and Al2O3, it can be assumed that remaining sulfur existed on the Al2O3 support.50,51 It was shown by Hoyos et al.52 that H2S adsorbed on Al2O3 can be completely oxidized to SO2 or SO3. Furthermore, Ordóñez et al.53 showed little desorption of SO2 below 200 °C when conducting temperature programmed oxidation of SO2-poisoned Pd/Al2O3. Hence, it is derived that although H2 was shown to release sulfur from the support material, residues still remain on Al2O3 subsequently oxidized by O2 to produce SO2. Additionally, the MS signal with m/z = 18 (H2O) increased sharply upon exposure to O2 and decreased afterwards (inlay in Fig. 10). This indicates that adsorbed hydrogen is still present on the Pd sites even after N2 flushing which reacts with O2 to form H2O.54
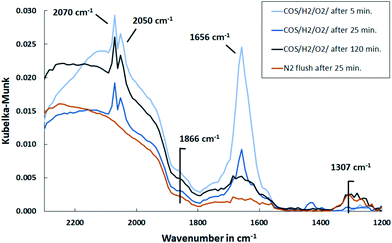 | ||
| Fig. 11 DRIFT spectra of Pd/Al2O3 support exposed to synthetic coke oven gas at 150 °C over time and upon subsequent flushing with N2 (500 ml min−1, 500 ppm COS, 60 vol% H2, 1 vol% O2, N2 balance). | ||
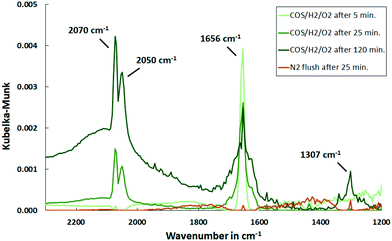 | ||
| Fig. 12 DRIFT spectra of Al2O3 support exposed to synthetic coke oven gas at 150 °C over time and upon subsequent flushing with N2 (500 ml min−1, 500 ppm COS, 60 vol% H2, 1 vol% O2, N2 balance). | ||
Considering that the catalyst is plain and active sites are free until the gas mixture is exposed to it, it can be assumed that initially all substances bind to it. Hence, besides the formation of CO–Pd and S–Pd by dissociation of COS, it is likely that oxygen and hydrogen also chemisorb to Pd.54 Consequently, CO can be oxidized in a Langmuir–Hinshelwood mechanism to CO2 and in addition H2O is formed. The initial increase of HCO3− bands indicate an adsorption of CO2 on Al2O3. At the same time, CO2 is detected in the MS with a decreasing trend that coincides with the removal of HCO3− deposits. Therefore, the adsorption is an intermediate phenomenon. In addition, the MS data show a peak of H2O in the beginning of the experiment, hence a release into the gas phase, that is more pronounced with Pd present. This is plausible, since Pd enhances the oxygen–hydrogen reaction.
At 150 °C CO is favorably adsorbed over O2, so in the steady state Pd is preferably covered with CO and S, which inhibits O2 adsorption and hence CO2 formation. As investigated by Klauck et al.55 and also shown in this work, for the same reason, the oxygen–hydrogen reaction is inhibited.
Since CO–Pd is formed by dissociation of COS, it can be once more assumed that in addition S–Pd is formed. While a high concentration of H2 is present in the gas stream, it can be concluded that this bound sulfur reacts with dissociatively adsorbed H2 on Pd to H2S and is removed from the surface.17 It was previously described that this reduction of metal sulfides such as Pd–S is catalyzed by the adsorption of H2 molecules on Pd and their subsequent dissociation into atoms.17,21
The conversion of COS to H2S catalyzed by Pd is confirmed by the MS spectra. A comparison of the outlet streams of simultaneous gas exposure on the catalyst and the support shows that with Pd/Al2O3 the partial pressure of mass 60 (COS) is lower (Fig. 13). In addition, comparing the spectra reveals that the masses 34, 33 and 32 showed steady signals in both cases, but with Pd/Al2O3 the partial pressure is higher compared to the support only. This indicates the formation of H2S, HS− and 32S, the latter derived from splitting of H2S in the MS.
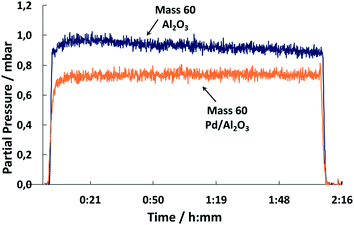 | ||
| Fig. 13 MS trace of m/z = 60 upon exposure of Pd/Al2O3 and Al2O3 to synthetic coke oven gas (150 °C, 500 ml min−1, 500 ppm COS, 60 vol% H2, 1 vol% O2, N2 balance). | ||
Moreover, the DRIFT spectra show that CO is bound to Pd over the entire duration. Therefore, it can be concluded that COS adsorption is not inhibited by CO, sulfur or H2, hence all four can adsorb on the active sites under these conditions.
Furthermore, HCSO2− appeared as a shoulder in the DRIFT spectra at 1578 cm−1 only in the beginning and exhibits a lower amount compared to initial COS dosing. This indicates that it is removed by hydrogen as shown before (Fig. 9). Moreover, a small feature at 1307 cm−1 was detected that increased with time and showed a smaller intensity with Pd present. A peak in that range was previously assigned to be physisorbed or chemisorbed SO2 on Al2O3.50,56 This accumulation of sulfates on Al2O3 were smaller when Pd is present. It was explained by Luo et al.21 that sulfates in proximity to noble metal particles are reduced stepwise to H2S by activated H2 and are subsequently released. This reduction is temperature dependent, since higher temperatures increase the mobility of absorbed sulfates to the region where reduction is possible.
Again, small and noisy signals of mass 64 and 48 were detected with both catalyst and support present. This confirms the formation of SO2. However, over time the signals decreased, which leads to the assumption that in the steady state H2S is the predominant sulfur species that is released into the gas phase. It this assumed that this again originates in the inhibited adsorption and therefore reactivity of oxygen molecules. In addition, COS molecularly adsorbed on Al2O3 was present that was again instantly removed by flushing with N2.
4. Conclusions
The performance of a Pd/Al2O3 catalyst was evaluated for the simultaneous hydrogenation of organosulfur compounds and conversion of O2, while some mechanistic investigations were made by DRIFT spectroscopy coupled with MS. The catalyst was tested between 120 and 250 °C in a model coke oven gas consisting of H2, CH4, O2, COS and CS2. The results showed that at 200 °C and above the organosulfur compounds are almost completely converted to H2S. Simultaneously, O2 entirely reacted with H2 to H2O. Upon lowering the reactor temperature below a critical point, the O2 conversion is strongly inhibited, whereas COS and CS2 are still completely converted. Also, the selectivity towards H2S is decreased and CH3SH appears as additional product. This altered performance is rapidly reversed by increasing the temperature just to 200 and 250 °C, respectively.The mechanistic examinations of the Pd/Al2O3 catalyst as well as the bare Al2O3 support were conducted by (I) successive gas dosage of COS, H2 and O2 and (II) simultaneous exposure to all the reactive gases at 150 °C. It was shown that COS dissociates on the Pd sites to form CO and S adsorbates. These surface species located on the Pd sites prevent the adsorption of O2 and they therefore strongly inhibit the oxygen–hydrogen reaction as observed in the catalytic performance tests. In addition, it was demonstrated that CO was removed from Pd due to displacement at 150 °C and it is assumed that desorption is accelerated at higher temperatures. Furthermore, the presence of H2 leads to a removal of bound sulfur to H2S.
Moreover, it was shown that COS also adsorbs on the Al2O3 support resulting in the formation of HSCO2−. Subsequently, HSCO2− reacts with OH− surface groups to CO2 and H2S, which can re-adsorb to yield HCO−3 species. However, HSCO2− plays a rather minor role in the conversion of COS to H2S.
To conclude, the strong blockage of the catalytically active Pd sites by CO and S inhibits side reactions. It is reversible by two effects: firstly, the increase of temperature that leads to the desorption of CO and secondly, by the presence of H2 in the feed stream that removes bound sulfur to form H2S.
Finally, this study shows that commercially available Pd/Al2O3 catalysts can be effectively taken for the removal of organosulfur compounds and oxygen from coke oven model gas. Also, the high amount of H2 simply facilitates the catalyst regeneration. Consequently, HDS by Pd/Al2O3 catalysts is considered as a suitable method for the deep desulfurization of coke oven gas to supply synthesis gas for the chemical industry.
Conflicts of interest
There are no conflicts to declare.References
- C. Song, Catal. Today, 2003, 86, 211–263 CrossRef CAS.
- C. Song and X. Ma, Appl. Catal., B, 2003, 41, 207–238 CrossRef CAS.
- C. Peng, R. Guo and X.-C. Fang, Catal. Lett., 2016, 146, 701–709 CrossRef CAS.
- N. Azizi, S. A. Ali, K. Alhooshani, T. Kim, Y. Lee, J.-I. Park, J. Miyawaki, S.-H. Yoon and I. Mochida, Fuel Process. Technol., 2013, 109, 172–178 CrossRef CAS.
- F. Rashidi, T. Sasaki, A. M. Rashidi, A. Nemati Kharat and K. J. Jozani, J. Catal., 2013, 299, 321–335 CrossRef CAS.
- X. Fang, R. Guo and C. Yang, Chin. J. Catal., 2013, 34, 130–139 CrossRef CAS.
- F. Sowa, B. Otten, J. Kamp and E. Proface, Proceedings of ICC, Ranchi, India, 2009, 20–22 January 2009 (2009), pp. 148–170 Search PubMed.
- H. Hiller, R. Reimert and H.-M. Stönner, Ullmann's Encyclopedia of Industrial Chemistry, 2000, pp. 403–421 Search PubMed.
- G. C. A. Schuit and B. C. Gates, AIChE J., 1973, 19, 417–438 CrossRef CAS.
- E. Furimsky and F. E. Massoth, Catal. Today, 1999, 52, 381–495 CrossRef CAS.
- Catalysis, ed. J. R. Anderson and M. Boudart, Springer, Berlin Heidelberg, Berlin, Heidelberg, 1996 Search PubMed.
- W. Boll, G. Hochgesand, C. Higman, E. Supp, P. Kalteier, W.-D. Müller, M. Kriebel, H. Schlichting and H. Tanz, Ullmann's Encyclopedia of Industrial Chemistry, 2000, pp. 483–539 Search PubMed.
- H. R. Reinhoudt, R. Troost, A. D. van Langeveld, S. T. Sie, J. van Veen and J. A. Moulijn, Fuel Process. Technol., 1999, 61, 133–147 CrossRef CAS.
- H. R. Reinhoudt, R. Troost, S. van Schalkwijk, A. D. van Langeveld, S. T. Sie, J. van Veen and J. A. Moulijn, Fuel Process. Technol., 1999, 61, 117–131 CrossRef CAS.
- E. W. Qian, K. Otani, L. Li, A. Ishihara and T. Kabe, J. Catal., 2004, 221, 294–301 CrossRef CAS.
- A. Ishihara, F. Dumeignil, J. Lee, K. Mitsuhashi, E. W. Qian and T. Kabe, Appl. Catal., A, 2005, 289, 163–173 CrossRef CAS.
- J.-F. Chiou, Y.-L. Huang, T.-B. Lin and J.-R. Chang, Ind. Eng. Chem. Res., 1995, 34, 4277–4283 CrossRef CAS.
- B. Vogelaar, Appl. Catal., A, 2003, 251, 85–92 CrossRef CAS.
- C. H. Bartholomew, P. K. Agrawal and J. R. Katzer, Adv. Catal., 1982, 135–242 CAS.
- C. H. Amberg, J. Less-Common Met., 1974, 36, 339–352 CrossRef CAS.
- J.-Y. Luo, D. Kisinger, A. Abedi and W. S. Epling, Appl. Catal., A, 2010, 383, 182–191 CrossRef CAS.
- N. S. Fígoli and P. C. L'Argentiere, J. Mol. Catal. A: Chem., 1997, 122, 141–146 CrossRef.
- G. Emig and E. Klemm, Technische Chemie: Einführung in die Chemische Reaktionstechnik, 5., aktualisierte und erg. Aufl, Springer, Berlin [u.a.], 2005 Search PubMed.
- P. Clark, N. I. Dowling and M. Huang, Proceedings of Brimstone Sulfur Symposium, Vail, Colorado, USA, September 10-14th, 2012, pp. 16–37 Search PubMed.
- C. Rhodes, S. A. Riddel, J. West, B. Williams and G. J. Hutchings, Catal. Today, 2000, 59, 443–464 CrossRef CAS.
- D. L. Mowery and R. L. McCormick, Appl. Catal., B, 2001, 34, 287–297 CrossRef CAS.
- C. H. Bartholomew, Catalyst Deactivation, 2001, 212, 17–60 CAS.
- P. Albers, J. Pietsch and S. F. Parker, J. Mol. Catal. A: Chem., 2001, 173, 275–286 CrossRef CAS.
- T. Yu, Appl. Catal., B, 1998, 18, 105–114 CrossRef CAS.
- J. T. Miller and D. C. Koningsberger, J. Catal., 1996, 162, 209–219 CrossRef CAS.
- B. H. Cooper and B. B. Donnis, Appl. Catal., A, 1996, 137, 203–223 CrossRef CAS.
- P. Svoronos and T. J. Bruno, Ind. Eng. Chem. Res., 2002, 41, 5321–5336 CrossRef CAS.
- G. A. Mills and F. W. Steffgen, Catal. Rev.: Sci. Eng., 2006, 8, 159–210 CrossRef.
- E. Laperdrix, I. Justin, G. Costentin, O. Saur, J. Lavalley, A. Aboulayt, J. Ray and C. Nédez, Appl. Catal., B, 1998, 17, 167–173 CrossRef CAS.
- R. Fiedorow, J. Catal., 1984, 85, 339–348 CrossRef CAS.
- K. K. Pandey, Coord. Chem. Rev., 1995, 140, 37–114 CrossRef CAS.
- J. Jones, V. Dupont, R. Brydson, D. Fullerton, N. Nasri, A. Ross and A. Westwood, Catal. Today, 2003, 81, 589–601 CrossRef CAS.
- G. Larsen, E. Lotero, R. D. Parra, L. M. Petkovic, H. S. Silva and S. Raghavan, Appl. Catal., A, 1995, 130, 213–226 CrossRef CAS.
- S. Jackson, P. Leeming and G. Webb, J. Catal., 1996, 160, 235–243 CrossRef CAS.
- J. West, B. P. Williams, N. Young, C. Rhodes and G. J. Hutchings, Catal. Lett., 2001, 74, 111–114 CrossRef CAS.
- Z. George, J. Catal., 1974, 35, 218–224 CrossRef CAS.
- E. Ozensoy and D. Wayne Goodman, Phys. Chem. Chem. Phys., 2004, 6, 3765 RSC.
- M. Kantcheva and I. Cayirtepe, J. Mol. Catal. A: Chem., 2006, 247, 88–98 CrossRef CAS.
- M. Valden, R. L. Keiski, N. Xiang, J. Pere, J. Aaltonen, M. Pessa, T. Maunula, A. Savimäki, A. Lahti and M. Härkönen, J. Catal., 1996, 161, 614–625 CrossRef CAS.
- A. I. Boronin, E. M. Slavinskaya, I. G. Danilova, R. V. Gulyaev, Y. Amosov, P. A. Kuznetsov, I. A. Polukhina, S. V. Koscheev, V. I. Zaikovskii and A. S. Noskov, Catal. Today, 2009, 144, 201–211 CrossRef CAS.
- G. Rupprechter, H. Unterhalt, M. Morkel, P. Galletto, L. Hu and H.-J. Freund, Surf. Sci., 2002, 502–503, 109–122 CrossRef CAS.
- M. Borasio, Polarization Modulation Infrared Reflection Absorption Spectroscopy on Pd Model Catalysts at Elevated Pressure, PhD, Freie Universität Berlin, Berlin, 2006 Search PubMed.
- B. Liang, X. Wang and L. Andrews, J. Phys. Chem. A, 2009, 113, 3336–3343 CrossRef CAS PubMed.
- P. Ammendola, P. S. Barbato, L. Lisi, G. Ruoppolo and G. Russo, Surf. Sci., 2011, 605, 1812–1817 CrossRef CAS.
- M. S. Wilburn and W. S. Epling, Appl. Catal., A, 2017, 206, 589–598 CrossRef CAS.
- J. Lampert, M. Kazi and R. Farrauto, Appl. Catal., B, 1997, 14, 211–223 CrossRef CAS.
- L. J. Hoyos, H. Praliaud and M. Primet, Appl. Catal., A, 1993, 98, 125–138 CrossRef CAS.
- S. Ordóñez, P. Hurtado and F. V. Díez, Catal. Lett., 2005, 100, 27–34 CrossRef.
- W. Reschetilowski, Einführung in die Heterogene Katalyse, SpringerBerlin Heidelberg, Berlin, Heidelberg, 2015 Search PubMed.
- M. Klauck, E.-A. Reinecke, S. Kelm, N. Meynet, A. Bentaïb and H.-J. Allelein, Nucl. Eng. Des., 2014, 266, 137–147 CrossRef CAS.
- E. Laperdrix, A. Sahibed-dine, G. Costentin, O. Saur, M. Bensitel, C. Nédez, A. B. Mohamed Saad and J. C. Lavalley, Appl. Catal., B, 2000, 26, 71–80 CrossRef CAS.
| This journal is © The Royal Society of Chemistry 2020 |

