Surface analysis tools for characterizing biological materials
Joe E.
Baio
a,
Daniel J.
Graham
 bc and
David G.
Castner
 *bcd
*bcd
aSchool of Chemical, Biological, and Environmental Engineering, Oregon State University, Corvallis, OR 97331, USA
bNational ESCA and Surface Analysis Center for Biomedical Problems, Box 351653, University of Washington, Seattle, WA 98195, USA. E-mail: castner@uw.edu
cDepartment of Bioengineering, Box 351653, University of Washington, Seattle, WA 98195, USA
dDepartment of Chemical Engineering, Box 351653, University of Washington, Seattle, WA 98195, USA
First published on 11th May 2020
Abstract
Surfaces represent a unique state of matter that typically have significantly different compositions and structures from the bulk of a material. Since surfaces are the interface between a material and its environment, they play an important role in how a material interacts with its environment. Thus, it is essential to characterize, in as much detail as possible, the surface structure and composition of a material. However, this can be challenging since the surface region typically is only minute portion of the entire material, requiring specialized techniques to selectively probe the surface region. This tutorial will provide a brief review of several techniques used to characterize the surface and interface regions of biological materials. For each technique we provide a description of the key underlying physics and chemistry principles, the information provided, strengths and weaknesses, the types of samples that can be analyzed, and an example application. Given the surface analysis challenges for biological materials, typically there is never just one technique that can provide a complete surface characterization. Thus, a multi-technique approach to biological surface analysis is always required.
Key learning points• The surface of a material with its unique properties and reactivity drive the interactions of that material with its environment.• To characterize the surface composition and structure of a material requires specialized techniques that selectively sample the outermost surface layers. • A multi-technique approach, including both experimental and computation methods, is required to obtain a detailed characterization of surfaces. • Extreme care must be used when preparing samples for surface analysis, as their surfaces can be readily contaminated or modified by improper handling. • It is essential to understand the strengths and weaknesses of each surface analysis technique, as well as how to properly interpret the data obtained from each technique. |
Introduction
Most biochemical reactions occur not in a bulk phase, but at a surface or interface. It is the unique properties of a surface that drive these processes to take place at biological interfaces and not within a bulk phase. Examples include: (1) breathing requires gas to be transported across a surfactant/air interface within the lung and (2) tissue growth is initiated by molecular recognition processes that occur via interactions between a cell membrane and the extra cellular matrix. These biological surfaces are unique from the bulk because they are the first plane of access to another phase, thereby, providing an access point for chemical reactions. Additionally, the high areas present at a surface, combined with the drive to minimize surface energy, accelerate adsorption with specific orientations. Biomolecules are also highly mobile within the surface plane of an interface, which contributes to the clustering and structural changes of nucleic acids, lipids or proteins required for molecular recognition processes.It is also these unique characteristics of interfaces that make the design of biomaterials challenging. The biological response to engineered biomaterials is mediated by the interface. Protein adsorption, cell attachment, self-assembly of tissues and the rate of enzymatic reactions at a biomaterial surface are all mediated by the composition, structure and distribution of chemical species at that interface. Therefore, to predict the performance of a new biomaterial one must possess a set of tools to identify the chemical composition, organization, energetics and dynamics of a complex biomaterial interface.
Compared to the bulk there is a tiny mass of material at a surface. This challenges the sensitivity of traditional analytical methods which typically probe both the bulk and surface. The main difficulty is then separating the small signal stemming from the surface from the massive bulk background. To do this most surface analytical techniques involve driving light, electrons, ions and physical probes to the surface and observing the response. Yet, most of these techniques require ultra-high vacuum (UHV) conditions and are typically used to characterize well defined model surfaces – single or simple molecules at non-organic surfaces. In comparison to these simple systems – biological interfaces are orders of magnitude more complex and fragile, typically requiring elaborate sample preparation and storage protocols which can be a challenge for characterization methods that require an UHV environment. As a result, over the last several decades there has been a push to not only simplify sample preparation and handling conditions used by traditional surface analytical techniques, but also to develop new methods that can characterize biological samples in situ. Given that the UHV environment can significantly change the surface structure of biological materials, the ability to characterize biological surfaces and interfaces in situ in their native aqueous environment in real time has significant advantages.
The goal of this tutorial review is to highlight how the composition, structure, orientation and morphology of a biological interface can be determined by electron spectroscopy, mass spectrometry, non-linear vibrational spectroscopy, bio-sensing and scanning probe techniques. The hope is that this introduction will serve as a guide for selecting appropriate combinations of characterization methods for specific experimental goals.
Best practices
There are a wide range of surface analysis techniques that can be used to characterize biological surfaces and interfaces,1 several of which we will discuss in this review. Each of these techniques have specific strengths and weakness for analysis of biological surfaces and interfaces.2 For each technique the analyst needs to understand such things as the underlying physics, the selection rules, the type of information each technique provides, the sampling depth probed, the experimental conditions required, how to process the data, and how to interpret the results. For most materials and systems the surface region (e.g., the outer few atomic layers) represents a miniscule portion of the entire sample, which means techniques with surface sensitivity are required to emphasize the signal from the surface region, especially from thick samples where bulk atoms significantly outnumber surface atoms.3 There are different ways to achieve the required surface sensitivity. For some techniques the particles detected (e.g., photoelectrons or ions) only travel a short distance in the sample and therefore the signal from the surface region dominates, even for large, macroscopic samples. For other techniques the detected signal can only originate from the surface due to selection rules that only allow signals from the surface region to be observed (e.g., sum frequency generation (SFG) vibrational spectroscopy). For samples that are sufficiently small (e.g., nanoparticles) nearly all the atoms in the sample are located in the surface region, so even techniques that don’t have inherent surface sensitivity can provide information about the surface region.Sample preparation and handling for surface analysis studies requires special attention.4 Care must be taken to minimize any surface contamination since surface atoms are typically more reactive than bulk atoms and most surface analysis techniques can readily detect the presence of surface contaminants. Some common surface contaminants include hydrocarbons, poly(dimethyl siloxane) (PDMS), salts and oils. Air exposure can deposit a hydrocarbon film onto most sample surfaces. For example, exposing a clean gold surface even briefly to air will result in a gold surface covered with hydrocarbons. PDMS is even more ubiquitous and can be transferred onto a sample surface from many sources (air, contaminated sample holder, manufacturing process, etc.). Salts can be deposited onto sample surfaces from buffer solutions. A thick layer of salt and oils will be deposited if the sample is touched with bare hands. Surface contamination is the bane of surface analysis and extreme care must be taken in handling and securing samples onto holders for analysis. The surface to be analyzed should never be touched by anything. Containers for storing and shipping samples can also introduce surface contamination (e.g., plasticizers from plastic bags). Tissue culture polystyrene culture dishes are usually good choices for sample storage and shipping, but it is always best to first analyze the surfaces of any containers to ensure they are contamination free. Carefully solvent cleaned tweezers should be used for handling samples and only regions not analyzed (e.g., edges) should be contacted by the tweezers.
Exposure of the sample to any solvents, even when the objective is to “clean” the surface, can deposit contaminants and change the surface composition. For example, rinsing the sample in tap water will typically deposit cations onto the surface (Na+, Ca2+, etc.). For multi-component samples the component with the lowest surface energy is often enriched at the sample surface, so solvent rinsing that changes the surface energetics will typically result in changes in the surface composition. Thus, careful thought must be given to how to process and handle samples for surface analysis. Invariably the first time a new user prepares a sample for surface analysis that sample will have some level of surface contamination. With practice and optimization of the sample preparation and handling procedures the amount of surface contamination can be minimized. However, it should be noted that different surface analysis techniques have different detection limits for surface contamination. For example, time-of-flight secondary ion mass spectrometry (ToF-SIMS) is significantly more sensitive to PDMS compared to X-ray photoelectron spectroscopy (XPS). So, a sample preparation and handling procedure that may show no detectable PDMS contamination by XPS can show detectable PDMS contamination by ToF-SIMS.
It is also important to consider the experimental conditions required for a given surface analysis technique. Techniques such as XPS and ToF-SIMS require the sample to be placed in UHV conditions for analysis, which is significantly different from the hydrated environment biological species and biomaterials function in. For these techniques, it is important to consider how the removal of the sample from an aqueous based environment and insertion into UHV will affect the surface composition and structure of a material.5 The surface chemistry of a polymer with hydrophilic and hydrophobic components can rearrange from a surface enriched in the hydrophilic component in aqueous conditions to a surface enriched in the hydrophobic component in UHV conditions. Also, removal from the aqueous environment and placement into the UHV environment can alter the structure of biological molecules (e.g., proteins can denature and unfold).6 The extent of these changes will depend on the material and molecular properties (energetics, mobility, structure rigidity, etc.).
Each of the surface analysis techniques provide different information from different sampling depths. Thus, to obtain a detailed understanding of a sample's surface chemistry and structure requires analysis with multiple techniques.2 The objectives for the surface analysis experiments will help guide which combination of techniques are selected. The first step is to clearly define the surface analysis objectives. General objectives such as “I want to learn everything I can about the sample surface” can lead to open ended experiments lasting weeks to months. It is preferable to have specific objectives such “quantifying the elemental surface composition” or “is a given surface contaminant present” to define a clear experimental plan. It is usually best to start with determining the level of surface contamination as well as the surface composition. More detail about XPS analysis will be given in the following section, but in general XPS is a good choice for initial surface analysis experiments since XPS detects and can quantify all elements in the surface region except for H and He.7 XPS can also be used to analyze a wide range of samples (polymers, metals, ceramics, biologics, etc.). Thus, performing XPS experiments to determine the surface elemental composition is an excellent starting point. If those initial experiments don’t indicate any unexpected species (e.g., surface contaminants) then addition experiments with XPS and other methods can be carried out to provide further characterization of surface chemistry and structure. It is essential that all information obtained from the various techniques and analysis methods provide consistent information about the sample. This doesn’t mean all techniques will produce identical experimental values (e.g., C/O atomic ratio). It does mean, when those experimental values are corrected for different experimental conditions (sampling depths, selection rules, etc.) they provide the same answer. For example, measuring the C/O atomic ratio with two methods that have different sampling depths (e.g., 2 nm vs. 10 nm) from a sample with a C/O atomic ratio that decreases from the outermost surface into the bulk will provide different measured C/O atomic ratios. However, when the different sampling depths are accounted for the results will provide consistent information about the C/O atomic ratio gradient in the surface region. It is essential that all information obtained from surface analysis experiments on a given sample be consistent. If that is not the case that indicates either there is a problem with data interpretation and processing methods used, or the surface composition and structure is changing during the measurements (either within a given analysis or between different analyses).
Determining absolute surface coverages and concentrations can be challenging for many of the surface analysis techniques. It is possible to obtain absolute numbers (e.g., the number of DNA chains attached to a surface), but that typically requires detailed, extensive calculations or calibration of the surface analysis measurements with a method such as radiolabeling.8,9 It is more straightforward to use surface analysis methods to examine differences among samples. For example, measuring changes in a surface functional group or protein surface coverage across a set of samples. Thus, it is better to design your experiment to examine a set of samples that have a systematic change in surface composition across the sample set. Such experiments on systematic, well-defined sample sets can also be used to develop correlations between the surface analysis and biological results.10 Measuring the biological performance (protein adsorption, cell attachment, etc.) of the same sample set and correlating that information with the surface analysis results can provide insights into how various surface species interact with the biological environment.
As part of the surface analysis experimental design the number of analyses done per sample type must be considered. For well-defined samples (e.g., a homogeneous polymer without surface contamination) a minimum of two replicates with at least three analysis spots across those two replicates is needed. For samples with more variability (e.g., protein films) at least four or five replicates with a minimum of three analysis spots per replicate is needed. For samples with heterogenous surfaces (e.g., patterned samples) multiple analyses are needed in each of the different surface regions of the sample.
X-ray photoelectron spectroscopy (XPS)
XPS, also known as electron spectroscopy for chemical analysis (ESCA), is the most widely used surface analysis technique.7 It provides both qualitative and quantitative information about the surface composition of a material and is an excellent starting point for investigating surface composition and structure. XPS is a well-established technique that has an extensive and detailed understanding developed for both the experimental and theoretical aspects of the technique. It is also a technique that has two Nobel Prizes associated with it, Albert Einstein for developing the equation that describes the photoemission process and Kai Siegbahn for developing instrumentation and methodology to make it an analytical technique. An overview of the XPS technique and the surface information it provides will be given in this review. For readers that are interested in further details there are excellent reviews available.7,11The basic physics of the XPS technique is that an incoming photon beam ejects electrons for analysis. For surface and interface analysis when this photon beam is directed at the sample a fraction of the incident photons interact with the material by transferring their energy to electrons surrounding the atoms in the sample, and if the photon energy is sufficiently high the electrons will be ejected from the sample and their kinetic energy (KE) can be analyzed. The Einstein equation provides the relationship between photon energy (hν), the electron binding energy (BE) and the ejected photoelectron KE as shown in eqn (1).
| BE = hν − KE | (1) |
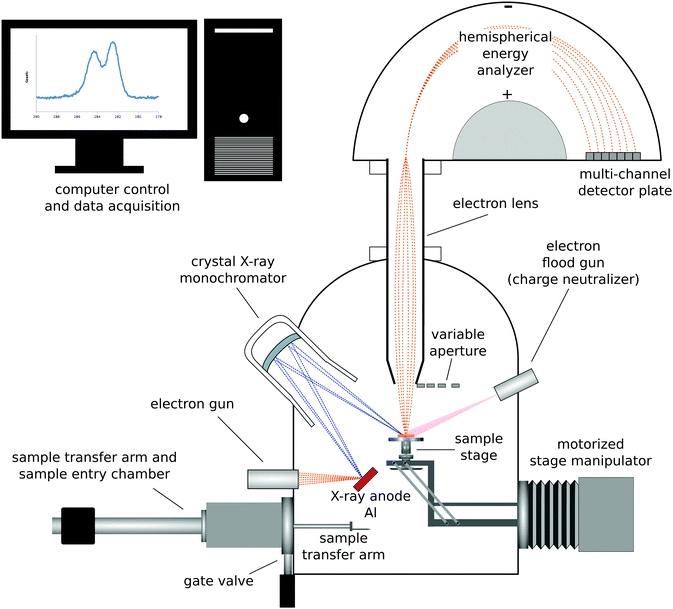 | ||
| Fig. 1 Schematic drawing of a monochromatized XPS instrument with a hemispherical analyzer and multi-channel detector. | ||
XPS analysis starts by acquiring a survey scan that typically spans a BE range from 0 to 1100 eV (although photoelectron KE is the quantity measured, the XPS data is plotted as counts vs. BE with the BE scale increasing from right to left). The XPS peaks in the survey scan originate from photoelectrons which have been ejected from the sample without suffering any energy loss. The position of the photoemission peaks can be used to identify which elements are present in the surface region and the peak area, when normalized by the probability of creating and detecting the photoelectron, can be used to quantify the amount of that element present. XPS analysis typically focuses on photoelectrons ejected from core levels of the atoms (e.g., C1s) since these peaks are the most intense, but photoelectrons are also ejected from valence levels of the atoms. All elements present in the surface region except H and He can be detected in XPS experiments (the cross-sections for ejecting photoelectrons from H and He atoms are typically too low to be emitted at sufficient levels to be detected). Photoelectrons that undergo inelastic collisions with the atoms in the sample on their way out of the sample contribute to the spectral background and loss features. The slope of the background on the high BE side of a photoemission provides information about the location of that element in the surface region.12 For atoms located at the outermost surface the background will typically first increase slightly and then decrease as BE increases above the photoemission peak. For atoms located below the surface the background will continually increase as the BE increases above the photoemission peak. The greater distance the atom is below the surface the higher the increasing slope of the background will be. In addition to the photoelectrons, loss features, and background signal, Auger electrons are also typically observed in the survey scans.7 So an XPS survey scan from poly(ethylene glycol) (PEG), which has a structure of –(O–CH2–CH2)n–, will have C1s, O1s and O2s core level peaks, C–C, C–H and C–O valence band peaks, and KLL Auger peaks. For a clean PEG sample (i.e., no contamination present) analyzed with a properly calibrated XPS instrument, the atomic C/O ratio calculated from the O1s and C1s peak areas will be 2![[thin space (1/6-em)]](https://www.rsc.org/images/entities/char_2009.gif) :
:![[thin space (1/6-em)]](https://www.rsc.org/images/entities/char_2009.gif) 1 after corrections for cross-sections and instrumental parameters have been made.
1 after corrections for cross-sections and instrumental parameters have been made.
While many researchers just use XPS to identify the elements present in the surface region of a sample and quantify the elemental composition of the surface region, there is much more information that can obtained from XPS experiments.7,11 For example, acquiring a narrow scan at high-energy resolution conditions for a particular core level (e.g., C1s) can provide information about the chemical species present in the surface region. For clean PEG the C1s spectrum will just have one peak centered near a BE of 286.5 eV that is due to the CH2 groups singly bonded to the oxygen atoms. However, for samples with multiple chemical species the core level spectrum will contain multiple peaks with different BEs. The exact peak position of a given atom will depend on the number and type of atoms bonded to that atom. For example, bonding electronegative atoms to carbon will result in an increase in the C1s BE. The more electronegative the atom bonded to carbon and more atoms bonded to carbon, the larger the increase in the C1s BE will be. Since F is more electronegative than O, one F atom will increase the C1s BE more the one O atom. Two C–O bonds, either as O–C–O or C![[double bond, length as m-dash]](https://www.rsc.org/images/entities/char_e001.gif) O, will increase the C1s BE twice as much as one C–O bond. The explanation for this BE shift is the electronegative atoms pull charge away from the carbon giving it a partial positive charge. Although this interpretation in terms of the initial charge state can explain the vast majority of BE shifts, there are exceptions since the ejected photoelectron also senses the electron rearrangement of the electrons that happens to an atom with a core level hole. When the degree of electron rearrangement or final state effect is similar for the different initial states, then the initial state differences determine the observed BE shifts. For example, the C1s BE increases as C–C < C–O < C
O, will increase the C1s BE twice as much as one C–O bond. The explanation for this BE shift is the electronegative atoms pull charge away from the carbon giving it a partial positive charge. Although this interpretation in terms of the initial charge state can explain the vast majority of BE shifts, there are exceptions since the ejected photoelectron also senses the electron rearrangement of the electrons that happens to an atom with a core level hole. When the degree of electron rearrangement or final state effect is similar for the different initial states, then the initial state differences determine the observed BE shifts. For example, the C1s BE increases as C–C < C–O < C![[double bond, length as m-dash]](https://www.rsc.org/images/entities/char_e001.gif) O. When the final state effects differ sufficiently they can contribute to the observed BE shifts. For example, a Co3+ ion has a lower Co2p3/2 BE than a Co2+ ion due to the differences in the final states being larger than the differences in the initial states. The high-energy resolution spectra provide important insight into the different types of chemical species that are present in the surface region of a material. However, the interpretation of the BE shifts and assigned chemical species needs to be consistent with the elemental composition determined from the survey scan. The combination of elemental compositions from survey scans and chemical species identification from high-energy resolution scans can provide much information about the surface composition and structure of a material.
O. When the final state effects differ sufficiently they can contribute to the observed BE shifts. For example, a Co3+ ion has a lower Co2p3/2 BE than a Co2+ ion due to the differences in the final states being larger than the differences in the initial states. The high-energy resolution spectra provide important insight into the different types of chemical species that are present in the surface region of a material. However, the interpretation of the BE shifts and assigned chemical species needs to be consistent with the elemental composition determined from the survey scan. The combination of elemental compositions from survey scans and chemical species identification from high-energy resolution scans can provide much information about the surface composition and structure of a material.
By comparing the elemental compositions and chemical species determined from XPS analysis with the corresponding quantities expected from the material's bulk composition and structure it is possible to identify the presence of surface contaminants such as adventitious hydrocarbon or PDMS as well as whether the concentration of any component in the sample is enriched or depleted at the surface. Determining whether or not preparation, processing and handling have resulted in surface contamination of the sample is one of the most common applications of XPS analysis.2 The XPS signals decay exponentially with depth from the sample surface. So, the XPS signals acquired from a given sample represent an exponentially weighted average of the composition from all layers in the surface region. If the sample has a homogeneous composition in the XPS sampling depth then it is reasonably straightforward to determine the surface composition. However, often times the composition varies with depth from the outermost surface and/or one or more overlayers are present on the sample. In these cases, extracting a compositional depth profile from the XPS experimental data is more complicated and often requires complex mathematical transformations.13
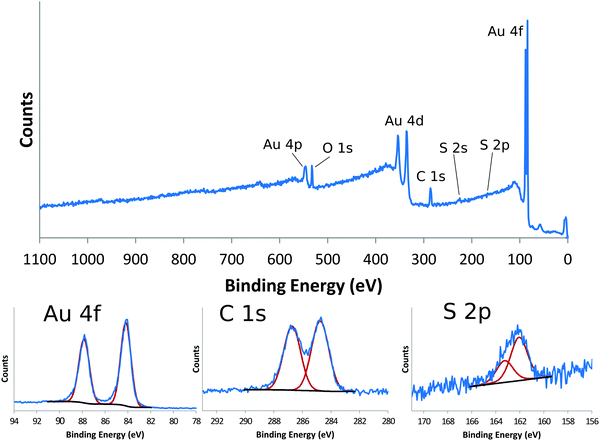
Self-assembled monolayers (SAMs) on gold provide a good reference material for demonstrating the detailed chemical information one can get from XPS.14Table 1 shows the XPS determined atomic composition from a the survey scan shown in the top panel of Fig. 2 for a gold surface functionalized with a SAM prepared using (1-mercapto-11-undecyl)tetra(ethylene glycol) (PEG4thiol, C19H40O5S). This data was collected on a Surface Science Instruments S-Probe using Al Kα X-rays with an energy of 1487 eV. The analysis spot was 800 μm × 800 μm. As seen in Table 1 and in the top panel of Fig. 2, only the expected elements of carbon, oxygen and sulfur from the thiol and gold from the substrate are seen. Since gold is not part of the SAM layer, it is common to recalculate the atomic composition of SAMs without the gold signal. Table 2 shows the XPS composition data rescaled to only show the carbon, oxygen and sulfur signal. The theoretical composition based off the stoichiometry of the PEG4thiol is also shown. As seen in Table 2 the experimental and theoretical compositions agree closely.
| Composition | C | O | S | Au | O/C |
|---|---|---|---|---|---|
| All values are shown in atomic percent. The last row shows the average and standard deviation for the 3 spots analyzed. The last column shows the O/C ratio. | |||||
| PEG thiol spot 1 | 51.1 | 14.4 | 2.3 | 32.2 | 0.28 |
| PEG thiol spot 2 | 50.9 | 14.3 | 2.7 | 32.1 | 0.28 |
| PEG thiol spot 3 | 51.5 | 14.7 | 2.2 | 31.7 | 0.29 |
| avg ± stdev | 51.2 ± 0.3 | 14.5 ± 0.2 | 2.4 ± 0.3 | 32.0 ± 0.3 | 0.28 |
| Composition | C | O | S | O/C |
|---|---|---|---|---|
| All values are shown in atomic percent. | ||||
| PEG thiol | 75.2 | 21.3 | 3.5 | 0.28 |
| Theoretical | 76 | 20 | 4 | 0.26 |
Table 3 shows a summary of the high-resolution Au4f, C1s and S2p peak fits for the PEG4thiol SAM. All binding energies were referenced to the Au4f7/2 peak at 84 eV. The bottom panels of Fig. 2 show the spectral regions and peak fits for each of the elements summarized in Table 3. As seen in Table 3 the C1s spectrum is dominated by peaks at 284.6 eV (C–C) and 286.6 eV (C–O). Table 3 also shows the theoretical percentages of the C–C and C–O peaks based off the molecular stoichiometry. As seen in the table the experimental and theoretical data closely agree, suggesting the SAM layer is present as expected. The S2p data provides additional information about the SAM layer. Previous work has shown that S2p spectra can be fit using doublets of peaks separated by 1.2 eV with an area ration of 2/1.15 Using these fitting guidelines results in a doublet with a S2p3/2 peak at 161.8 eV (see Table 3 and Fig. 2). It has been shown that S2p3/2 peaks near 162 eV represent sulfur bound to the gold substrate. This suggests that the sulfur is bound to the gold substrate. Further details about the characterization of PEG4thiol SAM and its mixture with other thiols is provided in a previous publication.16
| Au4f | B.E. | % | B.E. | % |
|---|---|---|---|---|
| All binding energies (B.E.) are in eV. All percentages are percentages of the total peak area. | ||||
| PEG thiol | 84 | 55.9 | 87.7 | 44.1 |
| C1s | C–C | C–O | ||
|---|---|---|---|---|
| B.E. | % | B.E. | % | |
| PEG thiol | 284.6 | 52.8 | 286.6 | 47.2 |
| Theoretical | 285.0 | 52.6 | 286.5 | 47.4 |
| S2p | Bound | |||
|---|---|---|---|---|
| B.E. | % | B.E. | % | |
| PEG thiol | 161.8 | 66.6 | 163.0 | 33.4 |
The advantage of XPS is that it is a widely accessible surface analysis technique that provides high information content with reasonable analysis times and minimal sample damage for a wide range of sample types (polymers, biological materials, metals, ceramics, etc.) and forms (powders, films, particles, fibers, etc.). The main disadvantage of XPS is the analysis is done in UHV using complex instrumentation. So, the sample must be vacuum compatible (e.g., minimal outgassing) and the impact of vacuum on the sample (e.g., unfolding of surface bound proteins) must be taken into consideration. The UHV challenges can be overcome by using specialized sample handing procedures such as cryogenic cooling. For example, a hydrated sample is rapidly plunged into a cryogenic fluid such as liquid nitrogen to produce a frozen, hydrated sample that locks in the structure of the sample in its hydrated state.4,5 Then the sample is quickly loaded onto a precooled sample holder in the sample entry chamber and pumped down. After reaching UHV conditions the sample temperature is slowly raised to approximately −100 °C to sublime off excess ice formed along with any contaminates deposited during the plunge cooling and sample mounting. Once only 1–2 monolayers of ice remain on the sample, it is cooled back down below −150 °C and transferred to a precooled holder in the analysis chamber. Although these procedures add complexity to the analysis, they do permit UHV analysis of a sample where the surface structure present in an aqueous environment has been locked into place.5
Time-of-flight secondary ion mass spectrometry (ToF-SIMS)
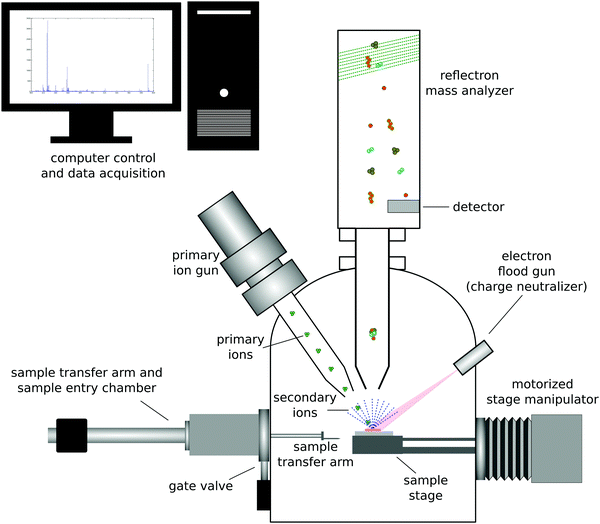
Secondary ion mass spectrometry (SIMS) is a UHV based technique that provides complementary information to XPS about the surface of a material.17 The most common form of SIMS is ToF-SIMS which uses a ToF mass analyzer to detect the ions sputtered from a material. ToF-SIMS is not as widely used as XPS. However, the impressive advancements in analyzers, ion sources, data analysis methods, etc. that have been made in the past 30 years have made ToF-SIMS an extremely powerful surface analysis technique for characterizing organic and biological materials.2 This section will provide an overview of ToF-SIMS. There are reviews available that provide further details and information about ToF-SIMS.17,18The basic physics of the ToF-SIMS technique is that a primary ion beam strikes a sample and sputters off atoms, fragments and molecules from the sample that are then mass analyzed (see Fig. 3 for a schematic drawing of a ToF-SIMS instrument).17 The vast majority (99% or more) of the sputtered material is neutral. The small number of charged particles sputtered from the sample are mass analyzed to determine the mass to charge (m/z) ratio of those particles. For ToF mass analyzers this is done by measuring the time it takes a given secondary ion to travel through the analyzer with a constant energy. The travel times are converted into m/z ratios using the eqn (2)
| KE = 0.5mv2 | (2) |
Historically high-energy, monoatomic primary ions (e.g., 10 keV Ar+) were used for SIMS analysis, resulting in SIMS being divided into two types of analyses, static SIMS and dynamic SIMS.2 Since high-energy, monoatomic ions are highly damaging to organic and biological materials, obtaining molecular information from those surfaces required keeping the total ion dose very low (≤1012 ions per cm2) so that the primary ions only struck a few percent of the surface atoms (static SIMS). Dynamic SIMS uses significantly higher ion doses to rapidly profile through inorganic materials and generate depth profiles (e.g., profile of a boron implant in a silicon wafer for microelectronic applications). With the development of cluster ions (e.g., 5 keV Ar5000) it became possible to depth profile organic and biological materials since these gas cluster ion beams (GCIBs) produced significantly higher secondary ion yields and significantly less residual damage to the sample being analyzed.19
ToF-SIMS is extremely surface sensitive, with sampling depths of ∼2 nm in the low-dose or static mode.20 The exact sampling depth will depend on the type of secondary ion analyzed (atomic ions have larger sampling depths than molecular ions) and the type of primary ion used to create the secondary ions (high-energy monoatomic ions penetrate deeply into the sample causing extensive sample damage and only producing a small crater; GCIBs deposit most of their energy at the surface resulting in the formation of significantly larger sputter craters with minimal residual sample damage). This low-dose ToF-SIMS mode produces a mass spectrum of the outer ∼2 nm of a sample, allowing the power and detail of mass spectral analysis to be used to gain insight and understanding about the surface structure and composition. In particular, the larger molecular fragments contain important information about the molecular structural units present at the sample surface.
Processing all the complex information produced by ToF-SIMS analysis can be challenging given the large number of mass fragments typically detected. For example, each positive and negative secondary ion spectrum can contain hundreds of peaks. For 2D ToF-SIMS images with 256 × 256 pixels contains 65![[thin space (1/6-em)]](https://www.rsc.org/images/entities/char_2009.gif) 536 spectra (one spectrum per pixel). 3D ToF-SIMS images are essentially a stack of 2D ToF-SIMS images, which results in a further significant increase the number of spectra and peaks to be analyzed. A common approach to addressing the challenge of processing ToF-SIMS data with its large amounts of mass fragment information is to use multivariate analysis (MVA).21 There are numerous MVA methods available, but the one most commonly used to process ToF-SIMS data is principal component analysis (PCA). PCA is an excellent way to reduce the dimensionality of a ToF-SIMS dataset, showing which peaks are the most important for separating samples into different groups. Even if other MVA methods are used for ToF-SIMS data processing, PCA is always an excellent method to start with. However, when using MVA methods it is essential to properly nominalize and scale the data before using a given MVA method. Once the MVA processing has been done it necessary to validate the insights and conclusions drawn from the MVA processing with the raw ToF-SIMS data. Unfortunately, many researchers do not properly apply MVA methods which can lead to erroneous conclusions being drawn from the data. Detailed discussions on how to properly process ToF-SIMS data with MVA methods are available.21
536 spectra (one spectrum per pixel). 3D ToF-SIMS images are essentially a stack of 2D ToF-SIMS images, which results in a further significant increase the number of spectra and peaks to be analyzed. A common approach to addressing the challenge of processing ToF-SIMS data with its large amounts of mass fragment information is to use multivariate analysis (MVA).21 There are numerous MVA methods available, but the one most commonly used to process ToF-SIMS data is principal component analysis (PCA). PCA is an excellent way to reduce the dimensionality of a ToF-SIMS dataset, showing which peaks are the most important for separating samples into different groups. Even if other MVA methods are used for ToF-SIMS data processing, PCA is always an excellent method to start with. However, when using MVA methods it is essential to properly nominalize and scale the data before using a given MVA method. Once the MVA processing has been done it necessary to validate the insights and conclusions drawn from the MVA processing with the raw ToF-SIMS data. Unfortunately, many researchers do not properly apply MVA methods which can lead to erroneous conclusions being drawn from the data. Detailed discussions on how to properly process ToF-SIMS data with MVA methods are available.21
The types of ToF-SIMS analysis fall into three different categories. A good starting analysis is to acquire low-dose positive and negative secondary ion mass spectra from the sample. Typically, each spectrum covers a range of 0 to 1000 m/z and is acquired from an area of ∼100 μm × 100 μm. The peaks in the spectra can then be used to determine what chemical species are present at the surface of the sample. If the sample surface is reasonably homogeneous and only information about the surface is required then all that is needed to acquire additional spectra from multiple spots on multiple replicates of the sample. If the sample surface is heterogenous, then 2D images of the surface are needed to determine the distribution of the various chemical species across the surface. It is important to match the pixel size of the image to size the primary ion beam (e.g., 1 μm pixels are used with a 1 μm primary ion beam size).20 Often times the researcher wants to know not only what species are present on the sample surface, but how the species are distributed with depth from the surface. This typically requires GCIB sources to depth profile through organic and biological samples without causing significant residual damage to be built up in the sample by the sputtering process (i.e., the region below the sputter crater does not experience significant damage).20,22 This depth profiling can be done either by averaging spectra from a large area for samples that are laterally homogeneous or by acquiring 2D images at each depth for samples that are laterally heterogenous (e.g., 3D images).
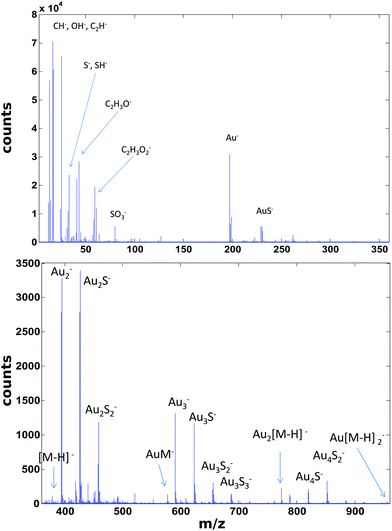
ToF-SIMS data on the PEG4thiol SAM discussed above was collected on a Physical Electronics 7200 ToF-SIMS using an 8 keV Cs+ ion beam. Spectra were acquired from m/z = 0 to 1000 from a 100 × 100 μm2 area while maintaining the primary ion dose below 1 × 10¹² ions per cm2. Fig. 4 shows an overview of the ToF-SIMS negative ion spectrum from the PEG4thiol SAM. The main molecular ion peaks formed from SAMs typically appear in the negative ion data as they prefer to form ions such as [M − H]−, AuM−, Au2[M − H]−, Au[M − H]2− where M = HS(CH2)11(OCH2CH2)4OH for PEG4thiol. Fig. 4 shows the ToF-SIMS negative ion spectrum from the PEG4thiol SAM with the major peaks labelled. As seen in Fig. 4, the spectrum is dominated by Aux−, AuxSy− peaks along with the characteristic molecular ion peaks that confirm the structure of the PEG4thiol used to make the SAM. Fig. 5 shows a zoomed in view of the main molecular ion peaks from the PEG4thiol SAM. Peaks are seen for all expected molecular ions including M − H−, AuM−, Au2[M − H]− and Au[M − H]2−. This provides direct evidence of the presence of the PEG4thiol on the gold surface and the direct bonding of the thiol to the gold through the presence of gold–thiol ions.
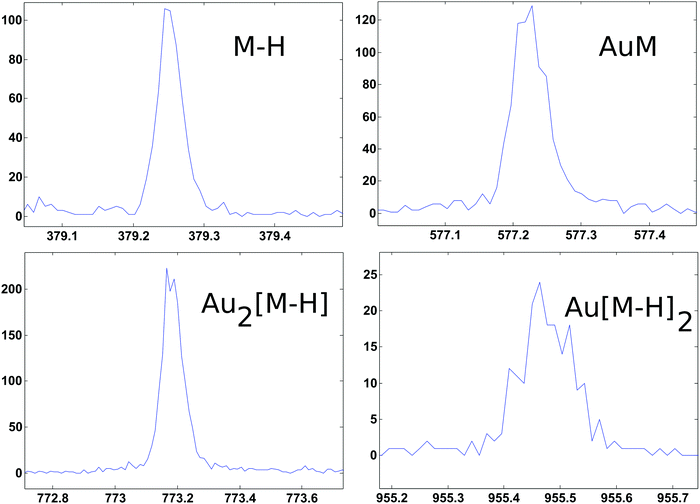 | ||
| Fig. 5 ToF-SIMS negative ion spectra from the PEG4thiol that show the characteristic molecular ion peaks from the PEG4thiol. | ||
The main advantage of ToF-SIMS is the information rich mass spectra produced that provide details about the molecular structure of organic and biological materials. Like XPS it has the disadvantages of being an UHV technique that requires complex instrumentation. The frozen, hydrated method of sample preparation described in the XPS section can also be used for ToF-SIMS analysis to lock in the hydrated surface structure of a sample for UHV analysis. For biological materials such as cells sample preparation methods such as chemical fixation and freeze drying can also be used in addition to frozen hydrated methods.23 Although ToF-SIMS instruments are becoming more widely used, they are not as abundant as XPS instruments. Also, ToF-SIMS requires analysts with significant specialized expertise to properly setup the instrument (select primary ion sources and mass analyzer conditions, etc.), acquire the data (scan parameters, etc.) and process/interpret the data (MVA parameters, etc.). Also quantifying ToF-SIMS data can be challenging since the yield of a particular secondary ion can vary significantly depending the environment it originated from (e.g., the yield of the M+ ion from a metal sample can be a few orders of magnitude higher from an oxygen covered surface compared to a clean surface).
Synchrotron methods
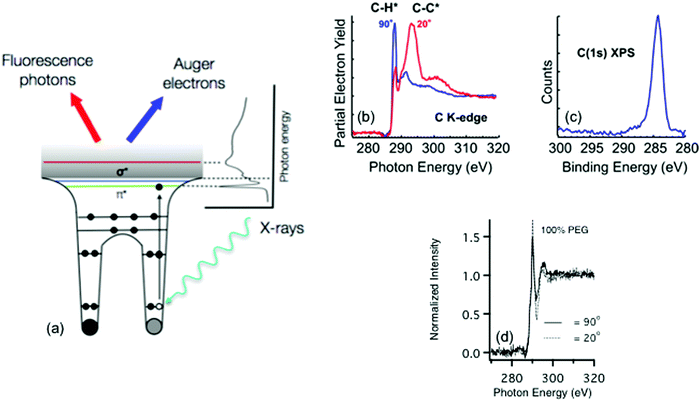
Other electron spectroscopy techniques like near edge X-ray absorption fine structure (NEXAFS) spectroscopy require a tunable photon source produced by a synchrotron.24 Unlike the other techniques described in this review that are focused on laboratory based instruments, synchrotrons are large facilities typically sited at national laboratories. Thus, experiments at synchrotrons usually involve travel and access can be more limited. At the synchrotron, photon radiation stems from charged particles (typically electrons) that are guided by magnetic fields around a curved path at a velocity of close to the speed of light. As the path of the particles is bent, radiation ranging from the far infrared to the hard X-ray region is emitted tangentially to the particle path. At the end of these tangents are experimental end stations that use the radiation for a range of chemical characterization techniques. One key component of these end stations is a monochromator that allows the experimental user to define a range of photon energies that will interact with a sample. For most soft biological samples – where the user will be probing for species made up of carbon, oxygen, and nitrogen – soft X-rays with energies below 2 keV are typically used.25 Hard X-rays (>5 keV) are sometimes used to characterize biological samples via scattering and diffraction, but these techniques are beyond the scope this tutorial.26Information about the elemental composition and molecular orientation of chemical groups at a surface is captured through the observation of the photoexcitation process produced by the pulsed, polarized synchrotron light.27 As the energy of the X-ray source approaches the BE of a core level electron, that electron is excited into unoccupied molecular orbital, producing a hole in the core level, which is filled by an electron from a higher energy level. The energy from this relaxation transition results in the emission of an Auger electron and a fluorescence photon. To remove any effect of fluctuations in X-ray intensity, the observed photoelectron signals are normalized by the photo yield of a known sample that is typically located upstream of the sample in the incident X-ray beam path. Just like XPS, as these photoelectrons travel to the surface they are scattered and can lose energy through interactions with the atoms in the material. Thus, the surface sensitivity of the technique stems from these strong interactions of the photoelectrons with the atoms in the material, which for most biological materials translates into a sampling depth that ranges from 1–10 nm.27 Additionally, as the incident angle of the electric field of the X-rays is varied any resulting change in the observed X-ray absorption can be directly connected to the ordering and orientation of molecular bonds at the sample surface. A schematic drawing of the NEXAFS process is shown in Fig. 6a.
This shallow sampling depth and sensitivity to ordering make NEXAFS spectroscopy a useful method to identify the chemical binding environment of biological surfaces. This has included using NEXAFS spectroscopy to identify specific chemical groups present at the surface of both soft and hard biological tissues while also determining the binding, orientation and structure of surface bound molecules for biosensing applications.
Most chemical species at a biological sample can be identified by features found within NEXAFS spectra collected at the carbon, nitrogen, and oxygen K-edges, which correspond to absorption at the 1s core level. Peaks present within NEXAFS spectra can be used to distinguish between bonds in a molecular structure. For example, Fig. 6b contains carbon K-edge NEXAFS spectra taken from 1-mercaptohexadecane (MHD) SAM on a gold surface at two different incident angles for the polarized, soft X-ray beam. The carbon K-edge spectra contain features from transitions to the C–H σ* and C–C σ* orbitals near 288 and 294 eV, respectively. In contrast, as shown in Fig. 6c, only one peak in the XPS C1s spectrum is observed for this sample since the BE differences between CH2 and CH3 are typically too small to observed with XPS.
In addition to identifying specific chemical groups at a surface, NEXAFS can also shed light on the orientation and geometry of these chemical bonds. This ability to probe orientation is illustrated by NEXAFS spectra collected from the MHD SAM in Fig. 6b and the PEG4thiol SAM in Fig. 6d. For the MHD SAM the C–H σ* peak is most intense when the X-ray beam is incident 90° to the sample surface and the C–C σ* is most intense when the X-ray beam is incident at a glancing angle (20°) to the sample surface. From the intensity variation of these peaks with X-ray incidence angle it can be calculated the tilt angle of the hydrocarbon chain from the surface normal is ∼35°. The MHD SAM is well-ordered. In contrast, the NEXAFS spectra from the OEG SAM show it is not as well ordered. The C–H σ* and C–C σ* peaks from the 11 CH2 groups in the hydrocarbon portion of the OEG molecule still exhibit some polarization dependence, so that part of the OEG molecular retains a degree of ordering in the OEG sample. However, little polarization dependence is observed at the position expected for the C–O σ* peak (∼289 eV), suggesting the ethylene glycol portion of the OEG molecule is disordered.
Several imaging modalities based on synchrotron light sources combine the high surface sensitivity and chemical specificity of NEXAFS with the ability to image a biological surface with sub-micrometer to nanometer lateral resolution. These microscopy methods include scanning X-ray microscopy (STXM), scanning photoemission microscopy (SPEM) and X-ray photoemission electron microscopy (XPEEM).28,29 However, the utility of each of these techniques is limited to the characterization of specific sample types. For example, STXM requires the sample to be thin and X-ray transparent while SPEM and XPEEM raster a focused X-ray beam across the sample, inducing charging effects and radiation damage on soft materials. As a result of these limitations these microscopy techniques have are typically only used to characterize well-defined model systems.
A recently developed NEXAFS microscope at the National Synchrotron Light Source II (NSLS II) addresses the limitations of these other microscopy techniques, by providing a tool to characterize the surface chemistry of thick, chemically complex, rough and insulating samples.30 In contrast to other imaging methods, limited sample prep is required – typically, samples are affixed to a sample bar with double sided conducting tape. Within this microscope the photoelectrons created by the incident X-ray radiation are guided by a magnet onto a channel plate electron detector, thereby, providing a two-dimensional NEXAFS image over a 13 × 18 mm2 region, with a lateral resolution of approximately 5 μm. Low energy photoelectrons are reflected back to the samples surface alleviating any potential charging effects.
This large field of view, combined with the ability to analyze a range of sample types, enables the user to rapidly screen the surface properties of complex biological materials. Recently, this NEXAFS microscope was used to the characterize the surface chemistry across the cuticle of an African flower scarab (E. gralli).31 Both a photograph of the head and NEXAFS carbon K-edge image of scarab head are presented in Fig. 7. The NEXAFS image (Fig. 7 right panel) captures the electron yield across the carbon K-edge region (270–370 eV) and each pixel of the image contains a full NEXAFS spectrum. Variation of surface chemistry across the sample can be visualized by extracting spectra from a user defined region of interest (Fig. 7, bottom panel). For example, the carbon spectra exported from the traverse across the sample (represented by the white line) contain a weak pre-edge feature near 285 eV related to aromatic species as well as resonances related to C–H, C![[double bond, length as m-dash]](https://www.rsc.org/images/entities/char_e001.gif) O and C–C bonds near 286 eV, 288 eV and above 290 eV. In this case, the highlighted distribution of spectral features (i.e. chemical bonds) across the tissue sample surface could be directly related to the tissue's biological function.
O and C–C bonds near 286 eV, 288 eV and above 290 eV. In this case, the highlighted distribution of spectral features (i.e. chemical bonds) across the tissue sample surface could be directly related to the tissue's biological function.
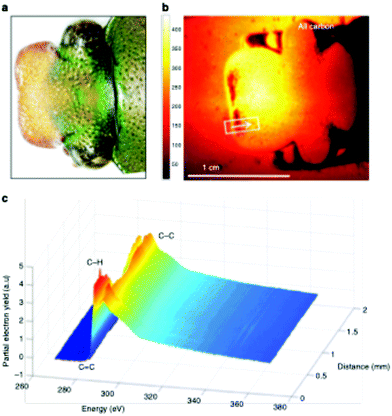 | ||
| Fig. 7 Imaging of an E. gralli head at the carbon K-edge. (a) Photograph of the head of the flower scarab. (b) NEXAFS image of the scarab head. The image is representative of the electron yield across the carbon region 270–370 eV. Each pixel contains a full NEXAFS spectrum. (c) NEXAFS spectra extracted from the image along the line indicated in the image. This figure has been reproduced from ref. 31 with permission from Springer Nature, copyright 2019. | ||
Non-linear optical methods
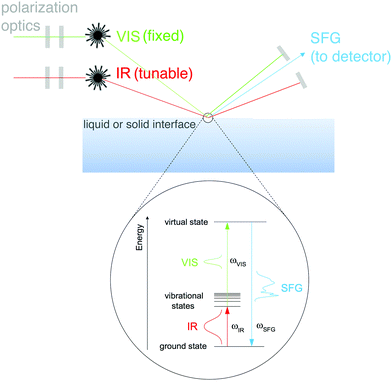
A group of techniques that have the potential to provide molecular-level information about complex biomaterials, without the necessity to place these materials under UHV conditions, are nonlinear optical methods.32 The different modalities of nonlinear optical methods have their strengths and weaknesses. For example, coherent anti-Stokes Raman scattering (CARS) provides high resolution images that allow the user to map chemical information within a biomaterial, but lacks surface specificity. A technique like second harmonic generation (SHG) provides surface sensitivity, but lacks molecular specificity. One optical approach that provides molecular specificity and is sensitive to the order of chemical bonds at an interface is SFG. SFG also has the capability to probe biological interfaces in aqueous environments without the need for complicated sample prep. This fact combined with SFG spectroscopy's unique selection rules makes SFG spectroscopy a powerful method of characterizing biological interfaces.33An SFG signal is produced by a coherent nonlinear optical process where two light pulses are overlapped in time and space (see Fig. 8 for a schematic of the SFG process). One of the incident pulses of light is kept at a fixed frequency, within the visible range, while the other is a tunable, fixed or broadband, infrared pulse.34 The resulting process produces photons with an energy that matches the sum of the two incident photon frequencies. When this SFG photon matches the vibrational frequency of the chemical species at the surface there is an adsorption response. Similar to other vibrational spectroscopic techniques like IR, vibrational modes present within an SFG spectrum allow one to identify molecular bonds present at the surface being probed. Yet – unlike linear vibrational spectroscopies – SFG is a second order nonlinear process, therefore, the selection rules dictate that no signal will be generated in isotropic, randomly ordered or symmetric materials.
SFG is a nonlinear process, as a result, it is inherently sensitive to the molecular structure of species at interfaces. Any observed SFG response (ISFG) is proportional to the magnitude of the second-order nonlinear susceptibility (X(2)eff) tensor, as shown in eqn (3).
| (ISFG) ∝ |X(2)eff|2 | (3) |
| |X(2)eff| ∝ (N, θ, ψ, β) | (4) |
One of the more routine SFG characterizations is to probe the chemical functionalization of planar biomaterial surfaces. For planar surfaces the experimental setup is simple – the pulses of light are reflected off the samples surfaces or go through the backside of an optical prism into a detector. Additionally, the incident (vis and IR) and SFG photons travel through wave plates that allow the user to change the polarization of each beam. The one main advantage of this simple experimental setup is that SFG spectra can be collected from a hydrated sample.
This ability to probe hydrated surfaces is illustrated by SFG spectra collected from PEG4thiol SAMs on Au. Fig. 9 contains SFG spectra collected in the C–H region (2750–3000 cm−1) from both dry and hydrated PEG4thiol SAMs.37 The spectra collected from the PEG4thiol SAM in air is dominated by three peaks at 2846, 2891, and 2950 cm−1 which all correspond to symmetric and asymmetric CH2 vibrational modes.38 The ordering of these PEG4thiol SAMs can then be quantified by taking the ratio of the areas of the CH2 asymmetric (2950 cm−1) and symmetric (2891 cm−1) peaks.39 The observed ratio corresponds to a geometry with the PEG4thiol chains pointing ∼30° with respect to the surface normal. Upon exposure to deuterated water the vibrational mode related to the alkene chains (2846 cm−1) within the PEG4thiol SAM disappears which indicates that upon hydration the PEG4thiol SAMs are induced into a disordered state.
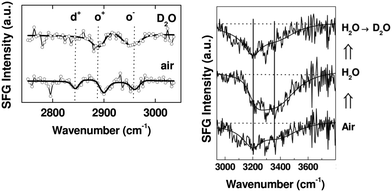 | ||
| Fig. 9 SFG spectra taken from PEG4thiol SAMs on Au. Left Panel: SFG C–H region spectra in contact with air (bottom) and deuterated water (top). Prominent peaks are labeled d+ (2846 cm−1), o+ (2891 cm−1), and o− (2950 cm−1) which all correspond to symmetric and asymmetric CH2 vibrational modes. Right Panel: The resulting SFG spectra taken as water is exchanged with D2O. Prominent peaks at 3200 and 3400 cm−1 stem from ordered water at the PEG4thiol SAM surface. This figure has been reproduced from ref. 37 with permission from American Chemical Society, copyright 2009. | ||
In addition to just comparing the ratio of observed vibrational modes within a spectrum, ordering of chemical groups at an interface can also be determined by collecting SFG spectra at difference polarizations. This involves varying the polarizations of the incident (IR and visible) and resulting SFG photons between s- and p-polarizations. Any observed changes in the SFG response across these different polarization schemes can also be used to identify the tilt and twist angles of ordered molecular bonds at the interface.
In addition to the geometry of the PEG4thiol molecules – SFG can be used to assess the state of water bound to these monolayers. To accomplish this, SFG spectra were first collected from SAMs hydrated with water. This sample was then dried and then an additional spectrum was collected after the sample was exposed to deuterated water. As water is exchanged with D2O the intensity of vibrational modes stemming from ordered water (3200 and 3400 cm−1) present at the surface do not dramatically change. This lack of water–D2O exchange implies that there is a layer of tightly bond water at these PEG4thiol SAMs.
These previous studies of SAMs laid the foundation towards the characterization of more complex and biologically relevant surfaces. This includes number of published studies where SFG-based approaches have provided new information on the conformation of peptides and proteins at air–water interfaces, on polymer substrates and interactions with lipid membrane surfaces. SFG vibrational modes that stem from the amide backbone of a protein are highly sensitive to protein conformation. Therefore, secondary structures of proteins can be determined directly from SFG spectra collected from the amide I vibrational band. For example, alpha-helix, beta-sheet and beta-turn structures have distinct resonance profiles between 1620 cm−1 and 1750 cm−1. Polarization-dependent SFG experiments have been capitalized on to evaluate the orientation of proteins at both solid surfaces and in lipid membranes. Additionally, several groups have developed numerical procedures that allow quantification of the extent of orientations of protein secondary structures from SFG amide I spectra. This includes supplementing SFG experiments with linear vibrational techniques or interpreting complex SFG spectra with the help molecular dynamic simulations.40 Additionally, the geometry of individual bonds within a larger biomolecule (i.e., individual amino acids within a protein) can be effectively isolated by selective substitution with deuterium-labeling.36 The resulting collection of previous work includes protocols that demonstrate how SFG-based approaches can be applied to accurately define the geometry of individual domains within a multi domain protein.
Lots of biomaterials are small and spherical (cells, liposomes, nanoparticles, etc.) so while the bulk of published SFG experiments have centered around the characterization of planar surfaces, there is a need for a technique that provides the surface chemistry of small particles and colloids. A recently developed scattering modality of SFG now enables one to probe the size, shape and interfacial chemistry of spherical particles simultaneously.41
Sum frequency scattering (SFS) experiments involve the overlapping of IR and visible pulses of light within a flow cell that contains particles suspended in a solution. Through the application of light scattering theories SFS data can be treated and analyzed similarly as an SFG spectrum. The observed angle dependency of the detected SFS signal provides insight into particle sizes and shapes. Additionally, SFS spectra can be collected from a suspension of particles before and after exposure to different solution conditions, thereby, providing insight into how composition, pH and temperature of the solution suspension influence particle morphology and surface chemistry.
Biosensing methods
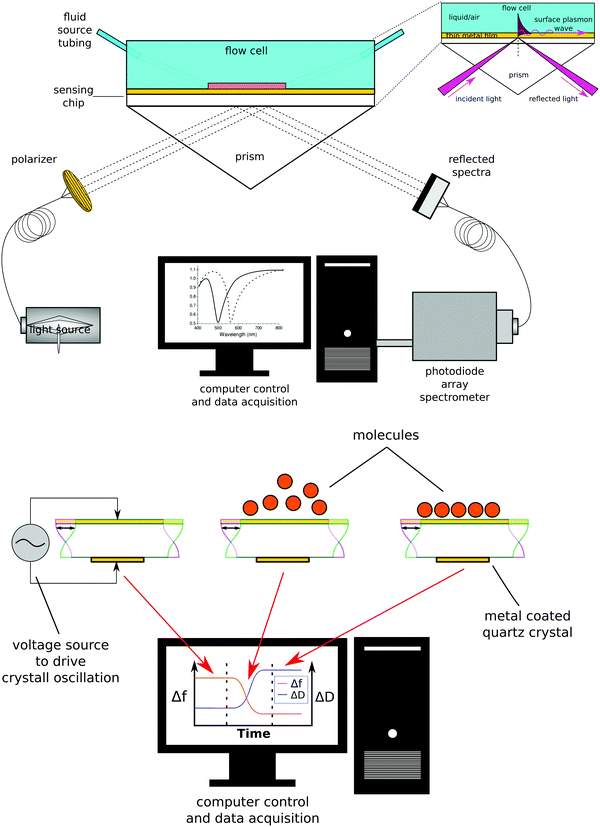
While there are several types of biosensors, two of the most common are surface plasmon resonance (SPR)42 and quartz crystal microbalance with dissipation (QCM-D)43 biosensing (see Fig. 10 for schematic drawings of the SPR and QCM-D processes). Thus, this section will focus on SPR and QCM-D biosensing. In comparison to XPS and ToF-SIMS, biosensing instruments are less complex and expensive, as well as not requiring an UHV environment to operate. This accounts for their wide availability and their use for measuring processes at the liquid–solid interface in real time. A liquid cell is part of all biosensing instruments. Also, unlike XPS and ToF-SIMS instruments, which are largely purchased from commercial instrument manufacturers, many research groups build their own biosensing instruments.The general approach to biosensing is to couple a probe into the sensor and then monitor how the processes at the sensor surface (adsorption, desorption, etc.) affect that probe. For SPR the probe is a light beam that is coupled into and out of a metal film, typically with a prism.44 Gold and silver are the most widely used metals in SPR biosensing as the incoming light beam with the correct wavelength and incident angle will excite a surface plasmon wave at the metal-dielectric interface, creating an evanescent wave with an intensity that decays exponentially with distance from the surface. Most SPR instruments are set up so that the effective sensing depth of evanescent wave is ∼250 nm. The exact wavelength and angle of the incident light beam needed to excite the surface plasmon will depend on the refractive index of the fluid the evanescent wave extends into. Thus, by monitoring changes in the wavelength and angle required to excite the surface plasmon, changes in the refractive index of the fluid at and near the surface can be determined. Since the incoming light beam loses energy when it excites the surface plasmons, the intensity of the outgoing light beam can be measured to determine the wavelength and angle needed to excite the surface plasmon wave.44 This is typically done either by using a fixed wavelength light source and monitoring the angle where there is a loss in intensity or by using a polychromatic light source with a fixed angle and monitoring the wavelength where there is a loss in intensity (Fig. 10 shows a fixed angle setup). By calibrating the SPR instrument with a set of fluids of known refractive index the raw SPR response (change in angle or wavelength) can be converted directly into a refractive index change. This refractive index change can then be converted to the mass of material added or removed to the surface using eqn (5) where d is the overlayer thickness, ld is the evanescent field decay length, S is the SPR sensitivity factor, ΔR is the SPR response, ηa is the refractive index of the absorbate, and ηs is the refractive index of the solution.42 Once d is determined then the mass per unit area can be determined by multiplying d by the bulk adsorbate density.
 | (5) |
In QCM-D the probe is an acoustic wave that is created via the piezoelectric effect by applying a voltage to the quartz crystal sensor.43 When the quartz crystal is in direct contact with a fluid the acoustic wave propagates into the fluid. By monitoring changes in the frequency and dissipation of the acoustic wave as a fluid is passed over the sensor information about changes in mass and viscoelastic properties at the sensor surface is obtained. With a constant voltage applied to the sensor, as mass is added to the sensor surface the frequency will decrease. The dissipation is measured by turning off the voltage to the sensor and observing how quickly the acoustic wave dissipates. The softer the mass attached to the sensor surface the faster the dissipation. For example, a long polymer chain weakly attached to the surface will exhibit a larger dissipation than a small molecule strongly attached to the surface. For molecules attaching rigidly to the sensor surface the change in frequency (Δf) can be directly converted into a change in mass (Δm) using the Sauerbrey relationship45 shown eqn (6) where f0 is the resonance frequency, A is the piezoelectrically active crystal area, is the ρq quartz density and μq is the quartz shear modulus. This equation is only valid when the change in dissipation is <5% of the change in frequency.
 | (6) |
Both SPR and QCM-D are powerful techniques that provide label-free, real-time information about the attachment or detachment of species at the sensor surface.42,46 However, there are several concerns that must be addressed when using these techniques. The standard sensor surfaces (typically gold) don’t have any chemical or biological specificity. For example, a gold surface will adsorb a monolayer of virtually any protein. So, to selectively immobilize a target protein from a complex mixture requires careful functionalization of the sensor surface so only the target protein binds and non-specific adsorption of other species from the complex solution is avoided. To ensure the sensor is surface functionalized as designed it must be thoroughly characterized at each step in the functionalization process by other surface analysis techniques that do provide chemical and biological specificity (XPS, ToF-SIMS, etc.). The other challenge is that more than just mass changes can be responsible for the observed changes in the SPR and QCM-D signals. For example, a change in temperature will affect the SPR and QCM-D signals. So, care must be taken to keep the temperature constant during an experiment. Even better is to use a reference channel when doing SPR and QCM-D experiments to monitor and compensate for any temperature changes. Finally, SPR measurements a change in “dry” mass while QCM-D measures a change in “wet” mass. This difference is important to remember when comparing SPR and QCM-D results for aqueous based biological systems. For example, for measuring protein adsorption from a buffer solution SPR will determine the change in mass of just the adsorbed protein while QCM-D will determine the change in mass of the adsorbed protein plus and any change in mass of water associated with that protein.
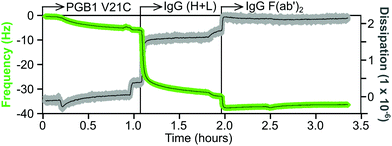
An example of a QCM-D sensorgram for protein immobilization is shown in Fig. 11. The gold coated QCM-D sensor is functionalized with a maleimide-terminated oligoethylene glycol (OEG) SAM. The OEG portion of the SAM will inhibit non-selective protein adsorption and the maleimide group will selectively bind to the cysteine thiol group of a protein. The functionalized sensor is first equilibrated in a flowing buffer solution, then the same buffer containing a cysteine mutant of the 6 kDa Protein G B1 (V21C) is flowed over the sensor. This results in a decrease in frequency, but little change in the dissipation, which corresponds to approximately a monolayer of the Protein G B1 cysteine mutant being tightly attached to the maleimide-terminated OEG SAM. After a buffer rinse to remove any non-specific adsorbed Protein G B1, the Protein G B1 surface is exposed to a buffer solution containing an IgG antibody. This particular Protein G B1 mutant is bound to the maleimide surface in an orientation that has its binding site for the Fc tail of antibodies exposed and available for binding. This results in a monolayer of the IgG antibody being immobilized onto the Protein G B1 surface. The frequency decrease for the antibody attachment is significantly larger than the frequency decrease for the Protein G B1 attachment since the antibody has a significantly higher mass (i.e., the frequency response is proportional to total mass attached, not number of molecules attached). The increase in dissipation is also larger for the IgG antibody compared to the Protein G B1 mutant, as expected since the IgG antibody is larger and less rigid than the Protein G B1 mutant. Finally, after another rinse the IgG covered sensor is exposed to a buffer containing an IgG F(ab′)2 fragment. The changes in both frequency and dissipation for the IgG F(ab′)2 binding are smaller compared to the whole IgG antibody due to the smaller mass of the IgG F(ab′)2 fragment.
Scanning probe microscopy
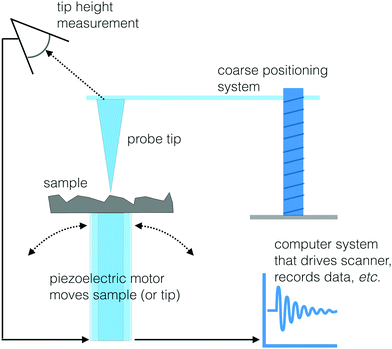
Another set of techniques that can visualize the morphology and chemistry of a surface with high spatial resolution are two scanning probe microscopy (SPM) methods: scanning tunneling microscopy (STM) and atomic force microscopy (AFM).47 The basic approach to SPM methods is similar to the operation of a record turntable. When playing an LP a probe with a very sharp tip is moving up or down in response to the topography of the vinyl record surface. For the case of STM and AFM, the stylus is a sharp probe equipped with a feedback system to control the vertical position of this probe. A piezoelectric scanner moves the sample under the tip (or the tip over the sample) in a rastered pattern and changes in surface structure are identified by sensing the vertical position of the tip (see Fig. 12 for a schematic drawing). Like the SFG and biosensing approaches, STM and AFM are both able to probe biological interfaces in aqueous environments, making them powerful tools to visualize biological surfaces. This section will provide an overview of STM and AFM but there are other reviews available that provide additional details about these and other SPM techniques.47STM images are produced by observing the quantum tunneling between a probe and the surface.48 As the biased tip approaches the sample, electrons are transferred to or from the tip to surface, depending on the direction of the applied bias. An image of the local density of states at the surface can be created by measuring the current passing through the tip as it is moved across the sample. While the resulting image can provide both topographical and spectroscopic information, it is worth noting that the observed difference in electron density may not always be directly related to surface topography. STM images can be acquired in two different modes. A constant current mode where the high of the probe is moved up or down to maintain a constant tunneling current is useful for characterizing surfaces that are not atomically flat. While constant height mode, where the space between the sample and tip is held constant and changes in tunneling current are recorded, accommodates rapid scanning (not dependent on a motor to raise and lower the tip) of relatively flat surfaces.
Despite STM's ability to image surface morphology with extremely high spatial resolution (lateral resolution <0.1 Å, vertical resolution <0.01 Å), the technique's dependence on very specific experimental conditions have limited the widespread use of STM to characterize biological samples. STM's main limitation is that in most cases conductive samples are required, but some insulators can be characterized by working at very low tunneling currents and high biases. Additionally, while it has been demonstrated that STM can be used to image surfaces under ambient conditions – both the surface and tip must be inert and any ions present within the liquid must not affect observed current. As a result, imaging a biological sample submerged in buffers with high salt concentrations are challenging to image with STM.49
Unlike STM, AFM is based on a measurement of force between the probe tip and the sample surface.50 Forces are measured by bringing cantilevered tip in contact with a surface. Any observed deformation of the cantilever, measured by reflecting a laser off the back of the cantilever onto a photodetector, can then be directly related to the force between the tip and substrate. Details about how these forces are quantified can be found in ref. 47. These force measurements can be conducted on both conductors and insulators under a range of environmental conditions.
The most basic quantitative measurement that AFM provides is a force–distance measurement. This is where the tip of the cantilever is lowered toward the sample surface. Then as it approaches, the tip bends into contact with the surface. The tip is then continued to be pushed farther into the material inducing a repulsive force between the surface and tip. The tip is then retracted until it is no longer making contact with the surface. Any hysteresis between the forces observed during the approach and retraction is due to the force of adhesion between the sample and tip.
These force–distance methods have been used to quantify the response of mechanical force on bio-molecular interactions.51 In these studies, the tip of the cantilever is functionalized with protein receptors while the sample to be probed is functionalized with receptors anchored to the surface. First a bond between the receptor and ligand is initiated by lowering the tip to the surface bound receptor. Then then two molecules are pulled apart by raising the cantilever vertically. Again, any hysteresis between the mechanical forces observed during the approach and retraction is due to the adhesion between the two molecules. The force applied to rupture these bonds can be constant or non-linear. These bond breaking events are then repeated hundreds to thousands of times to create histograms of recognition forces. During these molecular recognition studies care must be taken to separate specific adhesion forces from non-specific interactions. This can be accomplished by blocking non-specific receptors with antibodies or other chemical species. Additionally, specific recognition images can be created by scanning an oscillating functionalized tip across the sample (see contact mode imaging below) and specific recognition events can be mapped though observed changes in tip oscillation amplitude.52
The two most common AFM imaging modes are contact mode – where the cantilever tip is in constant contact with the surface as it moves across the surface and tapping mode where the cantilever acts as hammer banging on the sample surface at the cantilever's resonant frequency. In the contact mode the AFM is operated by keeping the tip in mechanical contact with the surface and observed cantilever deflections related to repulsive forces provide the shape and texture of surface features. When collecting images in contact mode the high shear forces applied by the tip to the surface can damage and distort surface features. An example of how AFM images collected in contact mode can damage soft samples is highlighted in Fig. 13. Here, PEG SAMs were formed on Au films and then imaged in contact mode. The authors report that scanning with a with a contact force >0.1 nN would destroy the PEG SAM.53 Additionally, repeated force-distance measurement also induced damage to the PEG SAM layer. Fig. 13 contains AFM images of PEG SAMs before (A) and after (B) repeated contact with the AFM tip.53
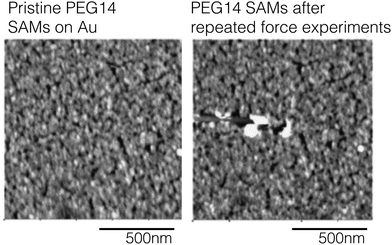 | ||
| Fig. 13 AFM images collected from a PEG SAM on Au before repeated contact with the AFM tip (panel A) and after 20 distance-force curve measurements (panel B). This figure has been adapted from ref. 53 with permission from Elsevier, copyright 2006. | ||
Tapping mode reduces these shear forces and tends to be a bit gentler on soft biological samples. One additional positive aspect of collecting AFM images in tapping mode is that any observed modulation of oscillation frequency and amplitude and can provide information about the viscoelasticity and tensile properties of the surface. This analysis can allow the user to identify phase segregated domains within a biological sample.
One drawback to AFM imaging is that it, compared to other microscopy techniques, is rather time consuming, which makes imaging dynamic surfaces difficult. To overcome this limitation there has been a huge amount of work designing new detection schemes to speed up the tip height feedback operation using smaller cantilever tips with increasing resonant frequencies. A detailed description of how these physical specifications influence scan rate can be found elsewhere.54 However, the result of these technological breakthroughs is an imaging mode termed high-speed AFM (HS-AFM), which now provides users with a method to directly image biological process with molecular level spatial resolution and <100 ms time resolution. These HS-AFM technologies are widely being used to characterize dynamic cellular processes.
STM and AFM images are highly susceptible to both electrical and vibrational noise. Proper grounding and vibrational isolation is key and most commercially available instruments provide sufficient isolation. Artifacts related to STM and AFM tip shape and the positioning motor are always convoluted into the resulting image. No matter how sharp the tip is, one will observe a broadening of morphological features in the imaged surface. As a result, there is a constant push to shrink tip features. Additionally, sample movements are controlled by piezoelectric materials that change shape in response to an applied voltage. However, this deformation response is non-linear and can produce images that look bowed or tilted. Nonetheless, this effect can be easily removed by subtracting out a background plane from the entire image and most image processing software packages provide a straight forward way of removing these experimental artifacts.
Future directions
Biological surface analysis has experienced extensive changes and advances in the past 40 years.2 The improvements in instrumentation and data processing methods along with the introduction of new techniques has given us the ability to characterize biological surfaces and interfaces at an ever-increasing level of detail on increasingly complex samples. However, there are still further advances needed to fully characterize, complex biological samples in aqueous environments. To fully achieve the needed level of detailed characterization (e.g., atomic level structure of surface immobilized proteins) will require the incorporation of computational methods (e.g., molecular dynamics (MD)) into the multi-technique surface analysis approach. Using MD dynamic simulations with surface analysis methods can extend the level of structural detail obtained about a given system.55 Promising results have been obtained for surface immobilized peptides and small proteins.33 The current challenge is to extend this approach to larger proteins. Computational simulations also provide a route for extending the level of detail obtained about complex sample shapes such as core–shell nanoparticles.56 New experimental developments such as sum frequency scattering are providing new information about biological surfaces and interfaces in aqueous environments, but significant advances in methods for interpreting the measured scattering patterns are needed to provide more detailed, quantitative analysis of these systems.57 Recent advances in ToF-SIMS instrumentation and data processing methods are now extending the power of 2D surface analysis of the outer few atomic layers into 3D analysis that go microns into the sample.18,20,22 One particularly exciting recent instrumentation advance is the addition of MS-MS capabilities that increase the assignment power for high mass secondary ions.58 However, further advances are needed in sample preparation and handling such as cryogenic methods, experimental conditions, and data processing to realize the full potential of this technique.Conflicts of interest
There are no conflicts of interest to declare.Acknowledgements
D. G. C. and D. J. G. gratefully acknowledges support from NIH grant EB-002027 during preparation of this manuscript as well as for some the data presented in it. J. E. B. gratefully acknowledges support from NIH grant 5R21HD096301-02 and NSF grant CHE-1905091. Prof. Lara J. Gamble is thanked for providing the NEXAFS data shown in Fig. 6. Dr Elisa T. Harrison is thanked for the providing the QCM-D data shown in Fig. 11.References
- J. C. Vickerman and I. S. Gilmore, Surface Analysis: The Principal Techniques, John Wiley & Sons, Chichester, UK, 2009 Search PubMed.
- D. G. Castner, Biointerphases, 2017, 12, 02C301 CrossRef PubMed.
- D. G. Castner, Surf. Interface Anal., 2018, 50, 981–990 CrossRef CAS PubMed.
- D. G. Castner and B. D. Ratner, Surf. Sci., 2002, 500, 28–60 CrossRef CAS.
- B. D. Ratner, P. K. Weathersby, A. S. Hoffman, M. A. Kelly and L. H. Scharpen, J. Appl. Polym. Sci., 1978, 22, 643–664 CrossRef CAS.
- N. Xia, C. J. May, S. L. McArthur and D. G. Castner, Langmuir, 2002, 18, 4090–4097 CrossRef CAS.
- B. D. Ratner and D. G. Castner, Surface Analysis – The Principal Techniques, John Wiley & Sons, Ltd, 2009, ch. 3, pp. 47–112, DOI:10.1002/9780470721582.
- P. Gong, C. Y. Lee, L. J. Gamble, D. G. Castner and D. W. Grainger, Anal. Chem., 2006, 78, 3326–3334 CrossRef CAS PubMed.
- M. S. Wagner, T. A. Horbett and D. G. Castner, Langmuir, 2003, 19, 1708–1715 CrossRef CAS.
- E. T. Harrison, Y.-C. Wang, L. Carter and D. G. Castner, Biointerphases, 2020, 15, 021002 CrossRef CAS PubMed.
- C. D. Easton, C. Kinnear, S. L. McArthur and T. R. Gengenbach, J. Vac. Sci. Technol., A, 2020, 38, 023207 CrossRef.
- S. Tougaard, Surf. Interface Anal., 1988, 11, 453–472 CrossRef CAS.
- B. J. Tyler, D. G. Castner and B. D. Ratner, Surf. Interface Anal., 1989, 14, 443–450 CrossRef CAS.
- J. C. Love, L. A. Estroff, J. K. Kriebel, R. G. Nuzzo and G. M. Whitesides, Chem. Rev., 2005, 105, 1103–1170 CrossRef CAS PubMed.
- D. G. Castner, K. Hinds and D. W. Grainger, Langmuir, 1996, 12, 5083–5086 CrossRef CAS.
- K. E. Nelson, L. Gamble, L. S. Jung, M. S. Boeckl, E. Naeemi, S. L. Golledge, T. Sasaki, D. G. Castner, C. T. Campbell and P. S. Stayton, Langmuir, 2001, 17, 2807–2816 CrossRef CAS.
- J. C. Vickerman, Surface Analysis – The Principal Techniques, John Wiley & Sons, Ltd, 2009, ch. 4, pp. 113–205, DOI:10.1002/9780470721582.
- J. S. Fletcher, Biointerphases, 2015, 10, 018902 CrossRef PubMed.
- I. Yamada, J. Matsuo, N. Toyoda and A. Kirkpatrick, Mater. Sci. Eng., R, 2001, 34, 231–295 CrossRef.
- I. S. Gilmore, J. Vac. Sci. Technol., A, 2013, 31 Search PubMed.
- D. J. Graham and D. G. Castner, Biointerphases, 2012, 7, 49 CrossRef CAS PubMed.
- N. Winograd, Anal. Chem., 2015, 87, 328–333 CrossRef CAS PubMed.
- M. A. Robinson and D. G. Castner, Biointerphases, 2013, 8, 15 CrossRef PubMed.
- C. A. Lucas, in Surface Analyisis – The Principal Techniques, ed. J. C. Vickerman and I. S. Gilmore, John Wiley & Sons, Ltd, 2009, pp. 424–463 Search PubMed.
- Y. Zubavichus, A. Shaporenko, M. Grunze and M. Zharnikov, Nucl. Instrum. Methods Phys. Res., Sect. A, 2009, 603, 111–114 CrossRef CAS.
- C. Y. J. Hémonnot and S. Köster, ACS Nano, 2017, 11, 8542–8559 CrossRef PubMed.
- J. Stöhr, NEXAFS Spectroscopy, Springer-Verlag, Berlin, 1992 Search PubMed.
- M. K. Abyaneh, L. Gregoratti, M. Amati, M. Dalmiglio and M. Kiskinova, e-J. Surf. Sci. Nanotechnol., 2011, 9, 158–162 CrossRef.
- B. O. Leung, A. P. Hitchcock, R. M. Cornelius, J. L. Brash, A. Scholl and A. Doran, J. Electron Spectrosc. Relat. Phenom., 2012, 185, 406–416 CrossRef CAS.
- J. E. Baio, C. Jaye, D. A. Fischer and T. Weidner, Anal. Chem., 2013, 85, 4307–4310 CrossRef CAS PubMed.
- J. E. Baio, C. Jaye, E. Sullivan, M. H. Rasmussen, D. A. Fischer, S. Gorb and T. Weidner, Nat. Commun., 2019, 10, 4758 CrossRef PubMed.
- P. K. Johansson, L. Schmuser and D. G. Castner, Top. Catal., 2018, 61, 1101–1124 CrossRef CAS PubMed.
- T. Weidner and D. G. Castner, Phys. Chem. Chem. Phys., 2013, 15, 12516–12524 RSC.
- Y. R. Shen, Nature, 1989, 337, 519–525 CrossRef CAS.
- K. T. Nguyen, S. p V. Le Clair, S. Ye and Z. Chen, J. Phys. Chem. B, 2009, 113, 12169–12180 CrossRef CAS PubMed.
- T. Weidner, N. F. Breen, K. Li, G. P. Drobny and D. G. Castner, Proc. Natl. Acad. Sci. U. S. A., 2010, 107, 13288–13293 CrossRef CAS PubMed.
- M. J. Stein, T. Weidner, K. McCrea, D. G. Castner and B. D. Ratner, J. Phys. Chem. B, 2009, 113, 11550–11556 CrossRef CAS PubMed.
- M. Himmelhaus, F. Eisert, M. Buck and M. Grunze, J. Phys. Chem. B, 2000, 104, 576–584 CrossRef CAS.
- S. Roke, J. Schins, M. Müller and M. Bonn, Phys. Rev. Lett., 2003, 90, 128101 CrossRef PubMed.
- T. W. Golbek, M. Padmanarayana, S. J. Roeters, T. Weidner, C. P. Johnson and J. E. Baio, Biophys. J., 2019, 117, 1820–1830 CrossRef CAS PubMed.
- S. Roke, ChemPhysChem, 2009, 10, 1380–1388 CrossRef CAS PubMed.
- C. T. Campbell and G. Kim, Biomaterials, 2007, 28, 2380–2392 CrossRef CAS PubMed.
- M. Rodahl, F. Hook, A. Krozer, P. Brzezinski and B. Kasemo, Rev. Sci. Instrum., 1995, 66, 3924–3930 CrossRef CAS.
- J. Homola, H. Vaisocherova, J. Dostalek and M. Piliarik, Methods, 2005, 37, 26–36 CrossRef CAS PubMed.
- G. Sauerbrey, J. Phys., 1959, 155, 206–212 CAS.
- F. Hook, M. Rodahl, P. Brzezinski and B. Kasemo, Langmuir, 1998, 14, 729–734 CrossRef.
- G. J. Leggett, in Surface Analyisis – The Principal Techniques, ed. J. C. Vickerman and I. S. Gilmore, John Wiley & Sons, Ltd, 2009, pp. 479–562 Search PubMed.
- M. S. J. Marshall and M. R. Castell, Chem. Soc. Rev., 2014, 43, 2226–2239 RSC.
- D. Cui, J. M. MacLeod and F. Rosei, Chem. Commun., 2018, 54, 10527–10539 RSC.
- F. Variola, Phys. Chem. Chem. Phys., 2015, 17, 2950–2959 RSC.
- W. E. Thomas, Curr. Opin. Struct. Biol., 2009, 19, 50–55 CrossRef CAS PubMed.
- Y. F. Dufrene, T. Ando, R. Garica, D. Alsteens, D. Martinez-Martin, A. Engel, C. Gerber and D. J. Mueller, Nat. Nanotechnol., 2017, 12, 295–307 CrossRef CAS PubMed.
- J. Rundqvist, J. H. Hoh and D. B. Haviland, J. Colloid Interface Sci., 2006, 301, 337–341 CrossRef CAS PubMed.
- T. Ando, T. Uchihashi and N. Kodera, Annu. Rev. Biophys., 2013, 42, 393–414 CrossRef CAS PubMed.
- E. T. Harrison, T. Weidner, D. G. Castner and G. Interlandi, Biointerphases, 2017, 12, 2D401 CrossRef PubMed.
- Y. C. Wang, M. H. Engelhardt, D. R. Baer and D. G. Castner, Anal. Chem., 2016, 88, 3917–3925 CrossRef CAS PubMed.
- P. K. Johansson and D. G. Castner, Langmuir, 2019, 35, 7848–7857 CrossRef CAS PubMed.
- M. K. Passarelli, A. Pirkl, R. Moellers, D. Grinfeld, F. Kollmer, R. Havelund, C. F. Newman, P. S. Marshall, H. Arlinghaus, M. R. Alexander, A. West, S. Horning, E. Niehuis, A. Makarov, C. T. Dollery and I. S. Gilmore, Nat. Methods, 2017, 14, 1175–1183 CrossRef CAS PubMed.
| This journal is © The Royal Society of Chemistry 2020 |


