
 Open Access Article
 This Open Access Article is licensed under a
 Creative Commons Attribution 3.0 Unported Licence
Correction: Dyson orbitals within the fc-CVS-EOM-CCSD framework: theory and application to X-ray photoelectron spectroscopy of ground and excited states
Marta L.
Vidal
 a,
Anna I.
Krylov
b and
Sonia
Coriani
a
a,
Anna I.
Krylov
b and
Sonia
Coriani
a
aDTU Chemistry – Department of Chemistry, Technical University of Denmark, DK-2800, Kongens Lyngby, Denmark. E-mail: malop@kemi.dtu.dk; soco@kemi.dtu.dk
bDepartment of Chemistry, University of Southern California, Los Angeles, California 90089, USA. E-mail: krylov@usc.edu
First published on 31st January 2020
Abstract
Correction for ‘Dyson Orbitals within the fc-CVS-EOM-CCSD framework: theory and application to X-ray photoelectron spectroscopy of ground and excited states’ by M. L. Vidal et al., Phys. Chem. Chem. Phys., 2020, DOI: 10.1039/C9CP03695D
An error was detected, and it is hereby corrected, in the computation of the photoelectron spectra obtained by ionizing core electrons of the two lowest excited states of uracil. A re-examination of the Hartree–Fock molecular orbitals in the 6-311(2+,+)G** (uncontracted) basis (which was used in the calculations) has revealed that the SCF procedure did not converge to the desired lowest triplet states of nπ* and ππ* characters, but instead found nRy and πRy solutions. While the character of the hole orbital in these states is the same as in the S1 and S2 states, the character of the particle orbital is different. Thus, the XPS reported in ref. 1 do not correspond to the XPS of the S1 and S2 excited states. This unfortunate problem occurred because of using a non-standard basis set (uncontracted), which affected the default guess in the SCF procedure. Because of the multiple diffuse functions present in the basis, the SCF calculation of the lowest triplet inadvertently converged to a Rydberg state instead of the valence state. This problem can be easily corrected by using molecular orbitals from the ground-state calculation together with the correct user-defined orbital occupation and the MOM algorithm.
The results of the calculations of the spectra with the correct orbital occupations are reported below. Fig. 1–3 show the amended spectra at the carbon, nitrogen, and oxygen K-edges, respectively. They replace Fig. 5–7 in the original article. Tables 1 and 2 summarize the raw data (ionization energies and squared Dyson orbital norms) for the S1 and S2 excited states, and amend the results in Tables 5 and 6 in the original article.
 | ||
| Fig. 1 Uracil. C K-edge fc-CVS-EOM-CCSD/6-311(2+,+)G** (uncontracted) X-ray photoelectron spectra of the ground state (S0), first excited state (S1, nπ*), and second excited state (S2, ππ*) corresponding to the ejection of either an α or a β electron, obtained by convolution of the computed ionization energies and Dyson norms with a Lorentzian function (FWHM = 0.4 eV). | ||
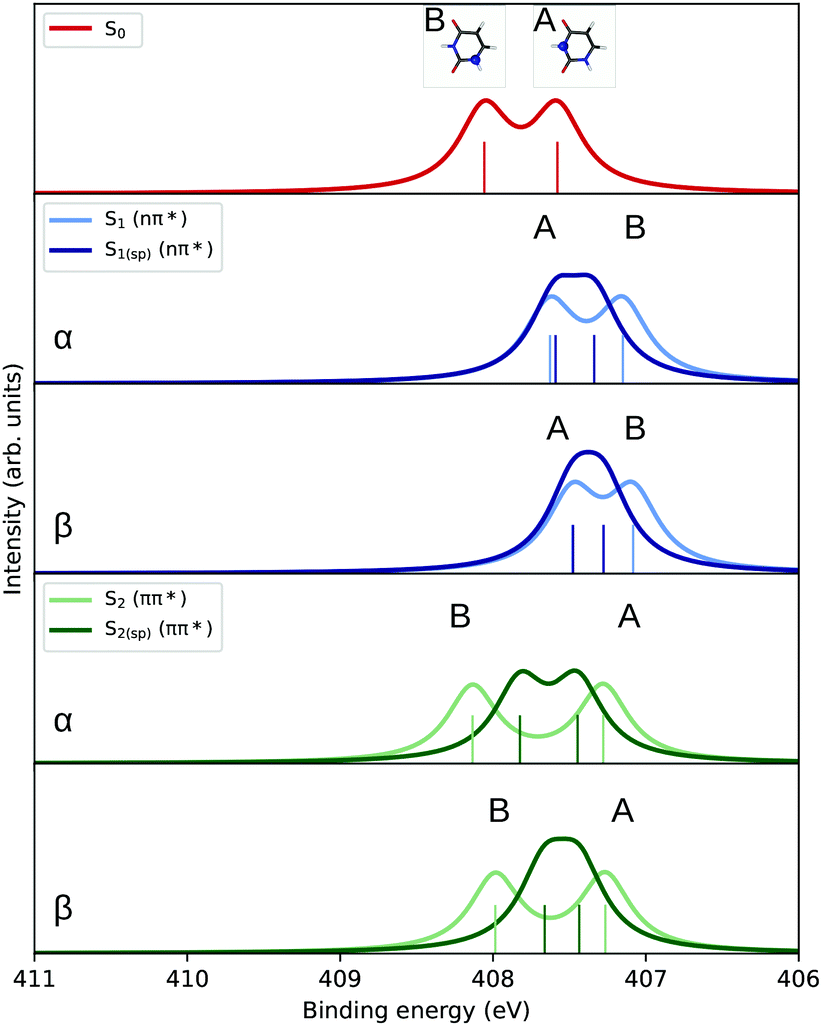 | ||
| Fig. 2 Uracil. N K-edge fc-CVS-EOM-CCSD/6-311(2+,+)G** (uncontracted) X-ray photoelectron spectra of the ground state (S0), first excited state (S1, nπ*), and second excited state (S2, ππ*) corresponding to the ejection of either an α or a β electron, obtained by convolution of the computed ionization energies and Dyson norms with a Lorentzian function (FWHM = 0.4 eV). | ||
 | ||
| Fig. 3 Uracil. O K-edge fc-CVS-EOM-CCSD/6-311(2+,+)G** (uncontracted) X-ray photoelectron spectra of the ground state (S0), first excited state (S1), and second excited state (S2) corresponding to the ejection of either an α or a β electron, obtained by convolution of the computed ionization energies and Dyson norms with a Lorentzian function (FWHM = 0.4 eV). | ||
| K-edge | S1 | S1(sp) | ||||||
|---|---|---|---|---|---|---|---|---|
| IE | ‖ϕDyson‖2 | IE | ‖ϕDyson‖2 | |||||
| α | β | α | β | α | β | α | β | |
| Carbon | 291.47 | 291.68 | 0.876 | 0.882 | 291.68 | 291.96 | 0.878 | 0.883 |
| 292.42 | 291.93 | 0.884 | 0.883 | 292.83 | 292.26 | 0.881 | 0.882 | |
| 294.37 | 293.87 | 0.879 | 0.877 | 294.53 | 294.04 | 0.877 | 0.875 | |
| 296.10 | 296.11 | 0.885 | 0.885 | 296.10 | 296.11 | 0.885 | 0.885 | |
| Nitrogen | 407.15 | 407.08 | 0.880 | 0.881 | 407.34 | 407.28 | 0.879 | 0.880 |
| 407.63 | 407.48 | 0.877 | 0.879 | 407.59 | 407.48 | 0.877 | 0.879 | |
| Oxygen | 538.88 | 538.86 | 0.880 | 0.880 | 538.82 | 538.81 | 0.881 | 0.880 |
| 544.00 | 542.82 | 0.878 | 0.890 | 544.04 | 542.75 | 0.876 | 0.886 | |
| K-edge | S2 | S2(sp) | ||||||
|---|---|---|---|---|---|---|---|---|
| IE | ‖ϕDyson‖2 | IE | ‖ϕDyson‖2 | |||||
| α | β | α | β | α | β | α | β | |
| Carbon | 292.98 | 292.34 | 0.883 | 0.886 | 293.12 | 292.48 | 0.878 | 0.881 |
| 293.27 | 292.60 | 0.879 | 0.883 | 293.58 | 292.94 | 0.870 | 0.875 | |
| 294.94 | 295.04 | 0.879 | 0.880 | 295.08 | 295.24 | 0.872 | 0.875 | |
| 296.35 | 296.37 | 0.883 | 0.883 | 296.30 | 296.32 | 0.882 | 0.881 | |
| Nitrogen | 407.28 | 407.27 | 0.880 | 0.881 | 407.45 | 407.44 | 0.878 | 0.879 |
| 408.13 | 407.99 | 0.870 | 0.874 | 407.82 | 407.66 | 0.870 | 0.873 | |
| Oxygen | 539.32 | 539.27 | 0.877 | 0.878 | 539.11 | 539.11 | 0.878 | 0.877 |
| 539.57 | 539.29 | 0.882 | 0.885 | 539.64 | 539.64 | 0.888 | 0.888 | |
Below we present the amended discussion of the computed spectra. Importantly, the main conclusion of ref. 1 remains valid: The XPS spectroscopy on the oxygen edge can be used to distinguish different electronic states in uracil.
At all three edges, the XPS spectra of the two excited states are now found significantly closer to that of the ground state. In most cases, the binding energies of the core electrons are slightly red-shifted relative to the corresponding S0 values, indicating a destabilization of the core electrons in the excited states.
At the C K-edge, see Fig. 1, the ordering of the A and B bands is reversed in the S2 state, indicating the stabilization (higher binding energy) of the 1s electron of the C atom at position A and destabilization of the 1s electron of the C atom at position B.
At the N K-edge (cf.Fig. 2), the ordering of the A and B bands changes in the S1 state, primarily due to a larger destabilization of the 1s core electron of the N atom at position B than for the one at position A.
The significant overlap of the C and N edge spectra corresponding to the two excited states makes them less attractive probes since no specific spectral signature region emerges.
At the oxygen K-edge, see Fig. 3, substantial differences between the spectra of the three states (ground state, S1 and S2) are found. In line with the localized nature of the nπ* state (see Table 3 in ref. 1), the 1s electron of the oxygen in the A position is strongly stabilized in the S1 state, versus a very modest destabilization of the one in B position, with a separation between the two IEs of 4–5 eV. This confirms our previous conclusion1 that the oxygen K-edge region would be the most interesting edge for probing the excited-state dynamics of the S1 state by UV-pump/XPS-probe spectroscopy.
The Royal Society of Chemistry apologises for these errors and any consequent inconvenience to authors and readers
Conflicts of interest
The authors declare the following competing financial interest(s): A. I. K. is a part owner and a board member of Q-Chem, Inc.Acknowledgements
We are indebted to Dr Shota Tsuru for bringing our attention to the erroneous orbital guess in the MOM calculations using the 6-311(2+,+)G** (uncontracted) basis set. M. L. V. and S. C. acknowledge support from DTU Chemistry (start-up PhD grant). S. C. acknowledges support from the Independent Research Fund Denmark – DFF-RP2 grant no. 7014-00258B and from the H2020-MSCA-ITN-2017 training network “COSINE – COmputational Spectroscopy In Natural sciences and Engineering”. A. I. K. acknowledges support by the U.S. National Science Foundation (No. CHE-1566428) and by the Simons Foundation.References
- M. L. Vidal, A. I. Krylov and S. Coriani, Phys. Chem. Chem. Phys., 2020 10.1039/c9cp03695.
| This journal is © the Owner Societies 2020 |