
 Open Access Article
 This Open Access Article is licensed under a
 Creative Commons Attribution 3.0 Unported Licence
Multiscale modelling investigation of wood modification with acetic anhydride†
Veerapandian
Ponnuchamy
 *ab,
Anna
Sandak
ac and
Jakub
Sandak
ab
*ab,
Anna
Sandak
ac and
Jakub
Sandak
ab
aInnoRenew CoE, Livade 6, 6310 Izola, Slovenia. E-mail: veerapandian.ponnuchamy@innorenew.eu; anna.sandak@innorenew.eu; jakub.sandak@innorenew.eu
bAndrej Marušič Institute, University of Primorska, Titov trg 4, 6000 Koper, Slovenia. E-mail: veerapandian.ponnuchamy@upr.si; jakub.sandak@upr.si
cFaculty of Mathematics, University of Primorska, Natural Sciences and Information Technologies, Glagoljaška 8, 6000 Koper, Slovenia. E-mail: anna.sandak@famnit.upr.si
First published on 11th December 2020
Abstract
Density functional theory (DFT) and molecular dynamics (MD) simulations were employed to investigate the interaction of cellulose and lignin with acetic anhydride for explaining the wood modification process. Cellulose was modelled with a cellobiose unit and dibenzodioxocin was used to represent the lignin model. Results obtained from both methods revealed that acetic anhydride interacted substantially more with the cellobiose model than the lignin model. The interaction energy of cellobiose–acetic anhydride was higher (about 20 kJ mol−1) than that of lignin-acetic anhydride. DFT results on hydrogen bonding indicated that the hydroxyl group from cellobiose and the aromatic hydroxyl group from lignin models have similar energy values, which explain the equal strength of hydrogen bond interaction. The same trend was also obtained for the substitution of acetyl group in the hydroxyl group. MD results have also predicted that acetic anhydride forms a stronger interaction with cellobiose than with the lignin model, and these findings were in agreement with the DFT results.
Introduction
Wood is a highly abundant and sustainable construction material and one of the most common materials used in daily life. It is a source for designing new building structures, façades, furnishings, windows and interior finishes due to its remarkable properties, which combine low density, and good mechanical and insulation properties with high stiffness and strength. Wood is an anisotropic material and consists of three main components: cellulose, hemicellulose and lignin. These cell wall polymers have a strong tendency for absorbing water from the surroundings into wood's hierarchical structure through hydrogen bonding.1,2 Absorption of water causes changes in the mechanical properties, dimensional stability, and durability and affects the physical and chemical properties of wood. Consequently, intensive research is directed toward the development of new methods that might overcome even more intrinsic properties of wood.Different modification processes are available for the improvement of wood properties, including several industrial solutions.3–6 Among the chemical treatments applied for wood modification, acetylation with acetic anhydride is one of the most effective methods to induce chemical changes in the constitutive polymers at the cell wall level. This typical reaction introduces a strong covalent bond between the wood substrate and acetyl groups.7,8 Acetylation reduces wood shrinkage/swelling and increases its durability against biotic agents.9 The reaction of acetic anhydride with wood polymers such as cellulose, hemicellulose and lignin results in the esterification of all accessible hydroxyl groups in the cell wall. The effectiveness of the acetylation reaction can be calculated as the weight gain percentage (WPG) of wood, and 20% WPG has a substantial dimensional stability and is resistant to fungal attack.9–12 The reaction rate can be increased by increasing the temperature or using catalysts. The reaction is also influenced by the type of wood (its permeability and density) as well as its moisture content.10 During the reaction, acetic acid is formed as a by-product that can be converted into acetic anhydride again.5,6,13
Several authors have demonstrated that among wood polymers, hydroxyl groups in the lignin polymer are the fundamental sites that involve the acetylation reaction, rather than hemicellulose and cellulose (being the lowest). Furthermore, the comprehensive analysis of Sadeghifar et al. investigated the reactivity of these polymers within the native wood using a quantitative 31P NMR technique and reported again that lignin is highly reactive.14 About 79% of the lignin hydroxyl groups were acetylated in low density samples compared to hemicellulose (60%), however, the conversion was only about 10% for cellulose. However, the results revealed that accessibility, swelling and chemical effects may also affect the acetylation reaction. On the other hand, the recent quantum structure–activity relationship (QSAR) study showed a reverse trend that cellulose and hemicellulose exhibit higher reactivity than lignin from their various wood polymer-based models.15 Although various studies showed the reactivity of wood polymers against acetic anhydride to understand the conversion, the underlying mechanism is still unclear. Experimental approach, following a top-down approach, requires the use of expensive chemicals, time-consuming reactions and are labor extensive. In contrast, computational techniques can anticipate laboratory work and optimize the studied wood modification process by implementing the bottom-up paradigm. Therefore, in such context, the use of density functional theory (DFT) and molecular dynamics simulations (MD) have proved to be the most promising methods, which allow understanding and complementing the results obtained in laboratory experiments.
Based on the above considerations, the main aim of this study is to provide a basic insight that can anticipate the reactivity and provide an understanding of the key interaction between cellulose and lignin with acetic anhydride (AA). We have employed a combined quantum mechanical density functional theory (DFT) and molecular dynamics (MD) simulation. Cellobiose and a lignin-based model, dibenzodioxocin, to represent cellulose and lignin polymers were considered. DFT calculations were employed to find the most possible conformation of cellobiose–AA and lignin model-AA. Atoms in molecules (AIM), reduced density gradient (RDG) and non-covalent interaction (NCI) methods were used to analyse hydrogen bonding and intermolecular interactions. MD simulations were used to investigate the cellobiose and lignin model interactions in the bulk AA environment.
Models and computational details
Density functional theory (DFT) calculations
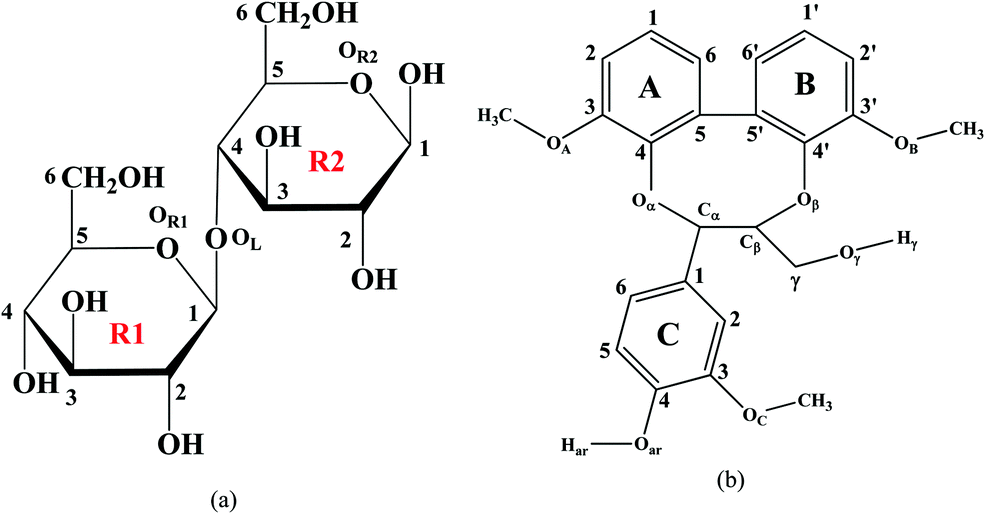 | ||
| Fig. 1 Models considered in the present study: (a) the cellobiose unit and (b) lignin model compound –dibenzodioxocin (DBD). | ||
Quantum chemical DFT calculations have been employed for the optimization of cellobiose, lignin model and acetic anhydride at the wB97D-2 level of theory and the 6-311g(d,p) basis set. It should be emphasized that the dispersion corrected wB97D-2 level of theory has proven to be consistent for intermolecular interaction and reproducing H-bonding since these interactions play a vital role between the molecules.23,24 In this work, the diffuse function is not taken into account in the 6-311g(d,p) basis due to no significant influence on the calculation of interaction energy, H-bonding and O–H stretching frequencies. There are 625 configurations created for each model with AA for finding the best possible interaction of AA with cellulose and lignin models. Afterwards, single-point energy calculations were carried out for all different configurations with the wB97X-D/6-31g(d) level to determine the lowest energy configuration of four conformers, which then optimized at wB97X-D/6-311g(d,p) to show the final geometry. Vibrational analysis was carried out for all final investigated geometries to ensure no imaginary frequencies were obtained, confirming that each geometry has a minimum on the potential energy surface. Zero-point energy corrections were also included, and the energy of all systems was estimated at temperature T = 298.15 K.
The interaction energy (ΔE) of the different configurations has been expressed as the energy difference of the most stable conformer and the corresponding isolated geometries,
| ΔE = 2625.5 × (Eab − Ea − Eb), kJ mol−1 | (1) |
Atoms in molecules (AIM) theory, reduced density gradient analysis (RDG) and non-covalent interaction (NCI) analysis have been performed using Multiwfn25 and VMD26 packages at the same level of theory to account for H-bonds and non-covalent interactions.
Molecular dynamics (MD) simulations
The MD simulations were carried out for two systems, such as cellulose–acetic anhydride and lignin model compound (DBD)–acetic anhydride, using the GROMACS simulation package27,28 to adopt the DFT model in the bulk phase of acetic anhydride. In each case, cellobiose and lignin models were placed at the center of the simulation box with 500 acetic anhydride molecules and periodic boundary conditions were adopted during simulations. The OPLS-AA force field was considered and the doGlycans tool was utilized to construct the glucose dimer.29,30 Whereas, considering the lignin model, the LigParGen server developed by W. L. Jorgensen was used to build the OPLS-AA force field due to the fact that force field potential for this typical lignin model is hardly available.31 Similarly, OPLS-AA potential with the CM1 charge was employed as stated in reference 32 for acetic anhydride molecules.The equations of motion have been integrated with the leapfrog algorithm and the temperature of the system was controlled via a velocity rescaled Berendsen thermostat with an integration step of 1 fs.33,34 Each simulation starts with minimization using the steepest-decent algorithm to minimize the energy from unfavorable impacts, followed by equilibration at a constant temperature of 298.15 K and a volume for 3 ns in relaxing the system to the appropriate state. The bulk simulations were continued by 10 ns NPT simulations at a constant pressure of 1 bar prior to performing NVT ensemble for 40 ns. The resulting periodic dimensions of the simulation box for the cellulose model-AA and lignin model-AA were 42.274 × 42.274 × 42.274 Å3 and 42.324 × 42.324 × 42.324 Å3, respectively. Each NVT trajectory was saved every 1 ps and the final 30 ns were considered for post-simulation analysis. A cut off of 1.0 nm was employed for both Lennard–Jones and short-range interactions. The particle-mesh Ewald summation method was taken into account for long-range coulombic interactions.35 It is pointed out that the position restrain was adopted for cellulose and lignin models, and these models were rescaled to the center of the box during the simulation. Such position restrain can be used to avoid thermal fluctuations of the chain and local concentration of the acetic anhydride molecule.36 The LINCS algorithm37 was employed to constrain the hydrogen bonds in cellobiose, lignin model and acetic anhydride.
Trial simulations have been performed with 500 molecules each for pure cellobiose and lignin model to calculate the density in order to evaluate the consistency of the employed force field for the present study. The obtained results have found pure densities of 1.471 g cm−3 and 1.202 g cm−3 for the cellobiose (at 300 K) and lignin model (298.15 K), respectively. The MD simulation system and the corresponding evolution of density are illustrated in the ESI† (Fig. S1). It should be emphasized that in our case, we consider cellulose in the amorphous state, and the density value is in agreement with references38,39 of 1.285 g cm−3 and 1.3762 g cm−3 (at 300 K). However, the relative difference can be expected due to the fact of degree of polymerization (DP), which is DP = 1 for the present cellobiose model.
Although lignin is highly abundant, the inherent heterogeneity of lignin exhibit a wide range of density values with respect to biomass, softwood and hardwood, and the origin and geographical locations. In the case of lignin, there are numerous studies that have reported the experimental density values,40–42 ranging from 1.28 to 1.50 g cm−3, and simulated values (at 298.15 K)43 appear to be around 6% lower than the experiments. The present DBD lignin model is one of the moieties existing in the lignin sources, and the simulated MD density value of 1.202 g cm−1 can be compared to the reported values in the literature.
Results and discussion
Geometries and interaction energy of cations
The structures of isolated cellobiose, lignin model and acetic anhydride are optimized at the wB97X-D/6-311g(d,p) level of theory, and these initial geometries are used to construct different configurations for cellobiose–AA and lignin–AA. Fig. 2 shows the final configuration of cellulose and lignin with AA in the gas phase, and the calculated interaction energy values are presented in Table 1. It is clearly seen from the geometries that the AA molecule predominantly approaches the cellulose hydroxyl groups at positions H41, H24 and H7, and the corresponding hydrogen-bond (H-bond) distances are 1.882 Å, 2.501 Å and 2.633 Å, respectively. In the case of the lignin model, different hydroxyl groups such as aliphatic and aromatic hydroxyl are present. Comparing the hydrogen bond distances, lignin–acetic anhydride configuration 2 (lignin-AA-C2) has the shortest hydrogen bond distance than lignin–acetic anhydride configurations 1 (lignin-AA-C1). However, the H-bond distance is a little larger than that of cellobiose, and the –OH group of the aromatic ring![[D with combining low line]](https://www.rsc.org/images/entities/char_0044_0332.gif) from the lignin-AA-C2 model substantially participates in H-bond interactions. The obtained H-bond lengths are 1.911 Å and 2.79 Å for O68⋯H37 and O57⋯H44, respectively. The results have demonstrated that the AA molecule favors the interaction with aromatic hydroxyl groups rather than aliphatic hydroxyls, which can be due to the higher acidity of lignin's phenolic hydroxyl groups.44 In the case of the optimized lignin–AA configurations for both, it is clearly seen (Fig. 2b and c) that the geometry of the AA molecule undergoes conformational changes and the corresponding dihedral angle of O57–O58–O68 is about 118.7° and 112.8° for lignin-AA-C1 and lignin-AA-C2, respectively, compared to 73.7° for cellulose-AA model (O47–O48–O58). This particular conformational change in AA is inevitable due to the steric repulsion of aromatic rings from the lignin model. Interaction energy from Table 1 shows that cellobiose has a stronger interaction than both lignin conformers with around 20 kJ mol−1 of energy difference. It is interesting to see that in both Fig. 2(b) and (c) lignin–AA configurations exhibit almost similar interaction energies, which indicate that the two hydroxyl groups equally interact with AA for the acetylation reaction.
from the lignin-AA-C2 model substantially participates in H-bond interactions. The obtained H-bond lengths are 1.911 Å and 2.79 Å for O68⋯H37 and O57⋯H44, respectively. The results have demonstrated that the AA molecule favors the interaction with aromatic hydroxyl groups rather than aliphatic hydroxyls, which can be due to the higher acidity of lignin's phenolic hydroxyl groups.44 In the case of the optimized lignin–AA configurations for both, it is clearly seen (Fig. 2b and c) that the geometry of the AA molecule undergoes conformational changes and the corresponding dihedral angle of O57–O58–O68 is about 118.7° and 112.8° for lignin-AA-C1 and lignin-AA-C2, respectively, compared to 73.7° for cellulose-AA model (O47–O48–O58). This particular conformational change in AA is inevitable due to the steric repulsion of aromatic rings from the lignin model. Interaction energy from Table 1 shows that cellobiose has a stronger interaction than both lignin conformers with around 20 kJ mol−1 of energy difference. It is interesting to see that in both Fig. 2(b) and (c) lignin–AA configurations exhibit almost similar interaction energies, which indicate that the two hydroxyl groups equally interact with AA for the acetylation reaction.
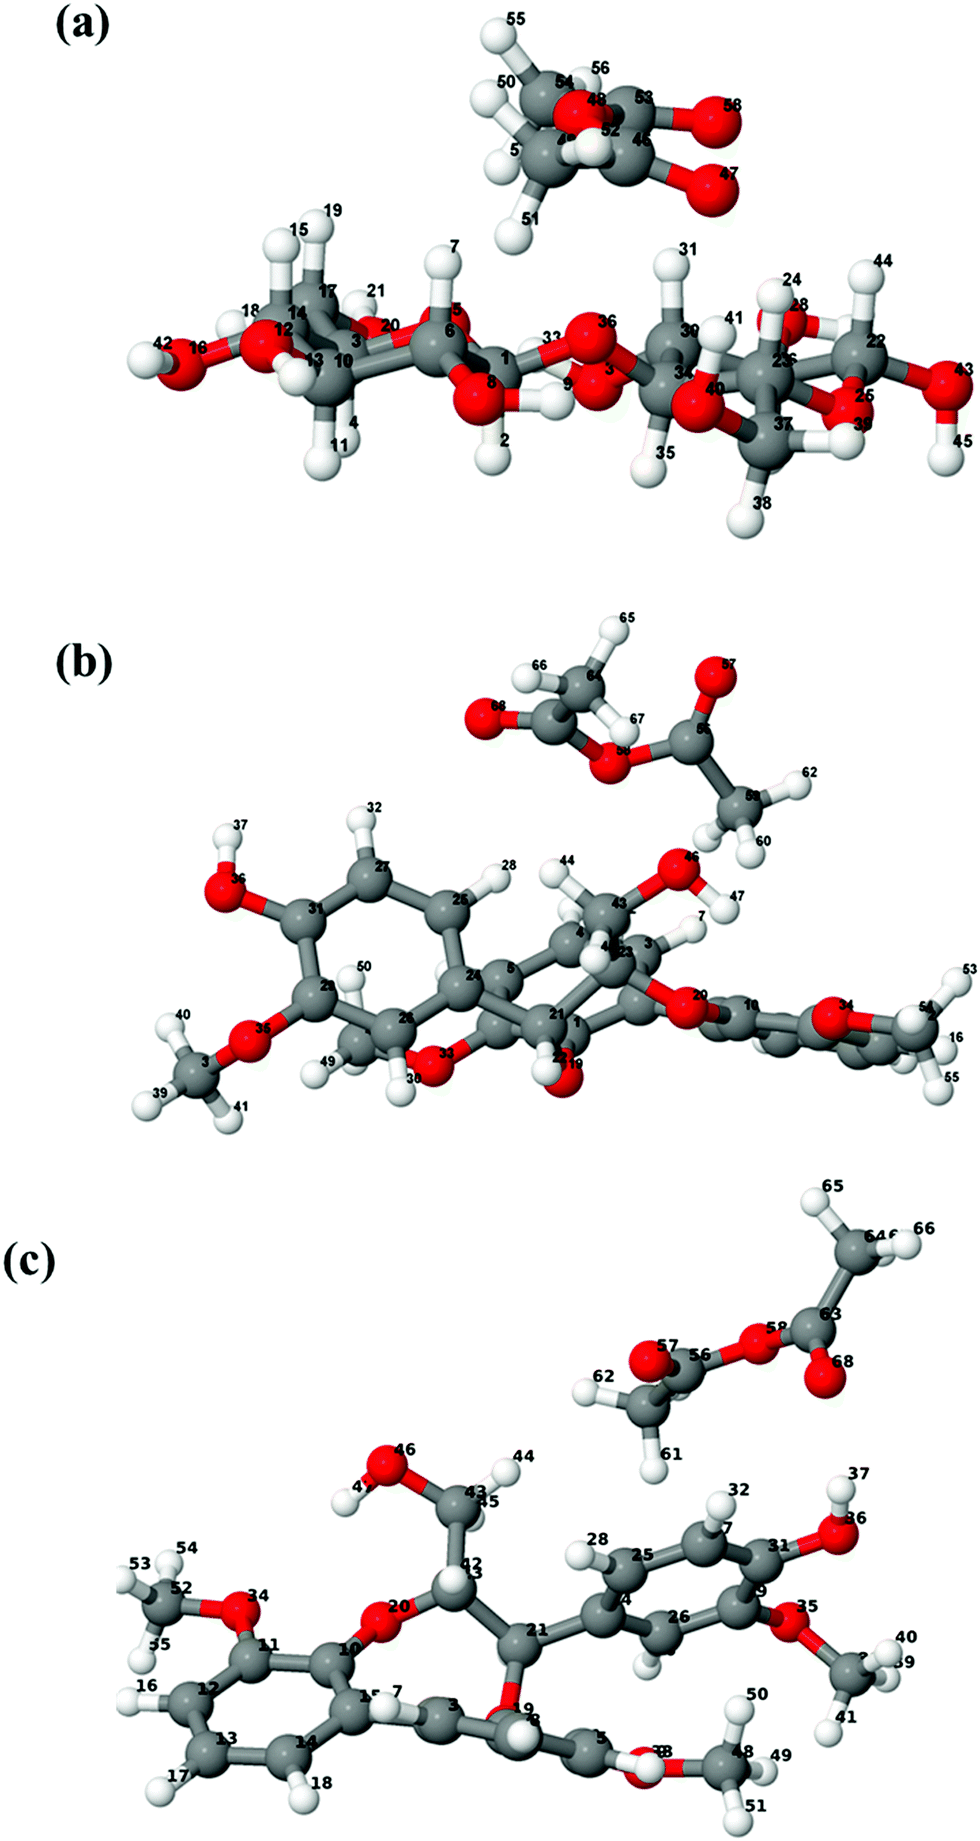 | ||
| Fig. 2 Optimized configurations in the gas phase of (a) cellobiose–acetic anhydride (cellobiose–AA) and (b) lignin–acetic anhydride configuration 1 (lignin-AA-C1) and (c) lignin–acetic anhydride configuration 2 (lignin-AA-C2), respectively. | ||
AIM analysis of cellobiose and lignin with acetic anhydride
The intermolecular interaction between molecules was studied using AIM theory. AIM theory is used to account for the H-bond characteristics such as nature of the H-bond and its strength using electron density (ρBCP) and the Laplacian of electron density (∇2ρBCP).45,46 These parameters are calculated at the bond critical point (BCP) with the criteria of ∇2ρBCP > 0 for hydrogen bonds and ionic bonds and ∇2ρBCP < 0 for covalent bonds.The intermolecular interaction parameters of ρBCP and ∇2ρBCP (presented in Table 2) and AIM molecular bond critical point (BCP) graphs for cellobiose–AA, lignin-AA-C1 and lignin-AA-C2, representing important hydrogen bonds, are illustrated in Fig. 3. In general, the typical criteria for ρBCP and ∇2ρBCP to account for H-bonds at BCP should be in the range of 0.002–0.035 a.u. for electron density and 0.024–0.139 a.u. for its Laplacian value.47 From Table 2, it is found that both cellulose–AA and two lignin–AA configurations are situated in the proposed range. It is interesting to see that the electron density (ρBCP) of lignin-AA-C2 showed a stronger H-bond, O68⋯H37, than the cellulose H-bond that corresponds to carbonyl oxygen of AA and aromatic-OH. The higher acidic nature of hydrogen in phenolic hydroxyl group present in the lignin model substantially contributes to a strong H-bond compared to the cellobiose hydroxyl groups. In the case of the cellobiose–AA model, the dominant H-bond forms for O47⋯H41 (ρBCP = 0.256 a.u. and ∇2ρBCP = 0.1027). The positive values of Laplacian for electron density at BCP show that these investigated H-bonds are non-covalent. Similarly, positive values of energy density (HBCP) in Table 2 reveal that these H-bonds have electrostatic properties. The strength of the H-bond is significantly higher for cellulose, O47⋯H41 (0.2481 a.u.), compared to lignin model conformers, O68⋯H37 (0.1707 a.u.) and H67⋯O46 (0.1310 a.u.), and this result confirmed that the cellulose hydroxyl groups show a strong coordination to AA.
| H-Bond | ρ BCP (a.u.) | ∇2ρBCP (a.u.) | H BCP (10−2 a.u.) | |
|---|---|---|---|---|
| Cellobiose–AA | O47⋯H41 | 0.0256 | 0.1027 | 0.2481 |
| O58⋯H24 | 0.0860 | 0.0281 | 0.0913 | |
| O48⋯H7 | 0.0075 | 0.0232 | 0.0598 | |
| Lignin-AA-C1 | H67⋯O46 | 0.0108 | 0.0370 | 0.1310 |
| H60⋯O46 | 0.0076 | 0.0243 | 0.0765 | |
| O58⋯H42 | 0.0079 | 0.0253 | 0.0725 | |
| Lignin-AA-C2 | O68⋯H37 | 0.0264 | 0.0945 | 0.1707 |
| O57⋯H44 | 0.0049 | 0.0151 | 0.0473 |
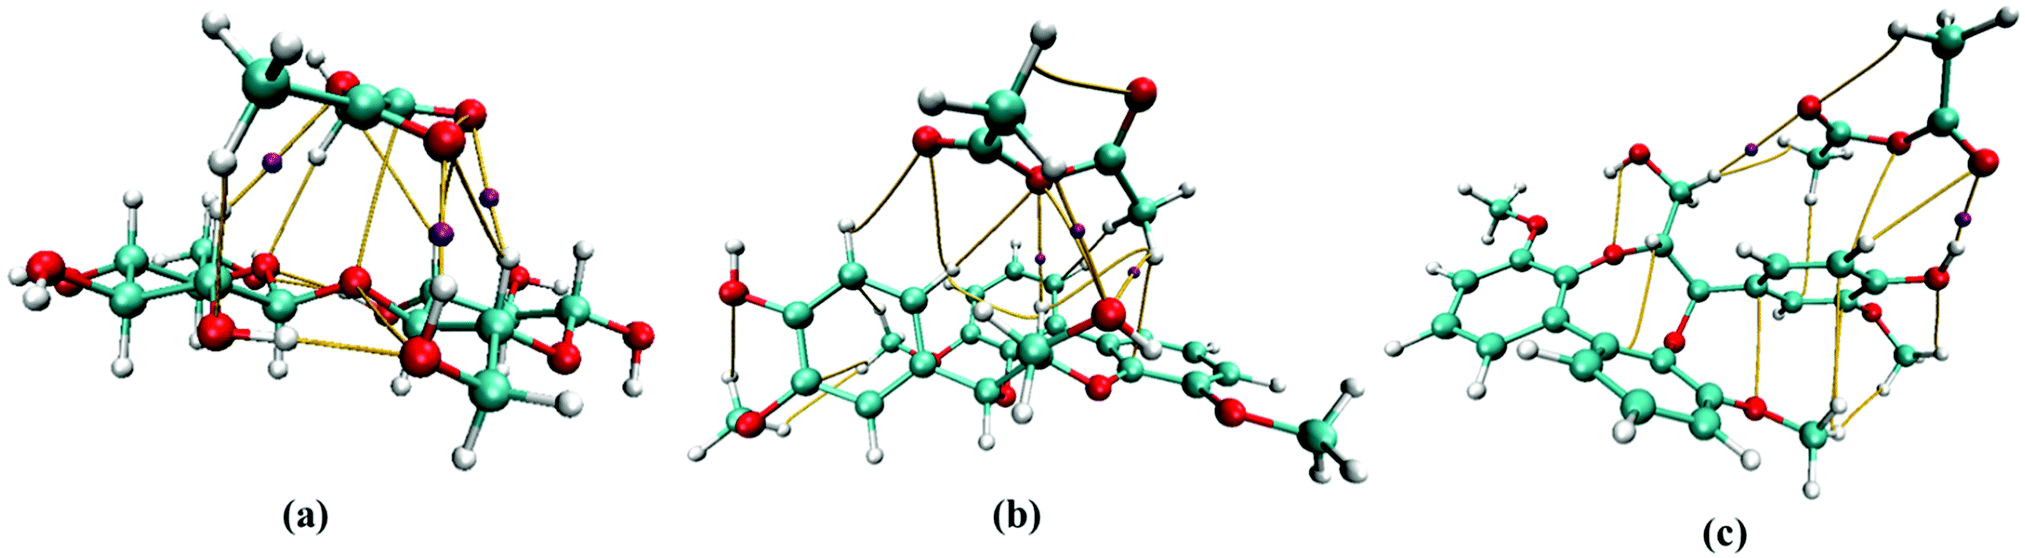 | ||
| Fig. 3 Selected bond critical points (BCP) representing H-bonds between (a) cellobiose-AA, (b) lignin-AA-C1 and (c) lignin-AA-C2. | ||
RDG analysis of cellobiose and lignin with acetic anhydride
Reduced density gradient (RDG) is another useful method to account for non-covalent interaction like in the AIM method. RDG scatter plots and non-covalent interaction (NCI) plots are potentially used to illustrate non-covalent interactions between the molecules.48,49 In this method, RDG is plotted against electron density multiplied by the sign of the second eigenvalue (sign(λ2)ρ)49 and both inter- and intra-molecular weak interactions can be seen in Fig. 4. RDG scattered points indicate H-bonding interactions on the negative scale (blue color), and the spikes (green color) and positive scale of sign(λ2)ρ represent van der Waals interactions and steric repulsions, respectively. Comparing Fig. 4(a) and (c) on the left, it can be seen that both cellobiose−AA (−0.0256 a.u.) and lignin-AA-C2 (−0.0264 a.u.) show stronger H-bonds than lignin-AA-C1 (−0.0108 a.u.); however, the energy difference of former cases is negligible. The RDG points (marked with black circles) are corresponding to O47⋯H41 for cellulose−AA and H67⋯O46 and O68⋯H37 for lignin-AA-C1 and lignin-AA-C2, respectively. Furthermore, NCI plots are used to visualize the respective H-bonds strength, and plots for studied systems are shown in Fig. 4 (right). As can be seen, disk-shaped blocks that indicate non-covalent interactions and the strongest H-bonds are marked with black circles. In the case of cellobiose, two strong H-bonds are indicated; however, one of the H-bonds is interpreted as intra-molecular hydrogen within the cellobiose molecule and another one shows the strongest inter-molecular H-bond. Similarly, the dark blue color-based disk in lignin-AA-C2 indicated strong intermolecular hydrogen bonds, whereas, lignin-AA-C1 exhibits lower H-bond strength and the corresponding region (Fig. 4c right) of the disk-shaped marked block is green. It is interesting to note that both lignin−AA model contains aromatic moieties that apparently participate in the van der Waals interaction with AA as seen from strong RDG spikes in Fig. 4b and c.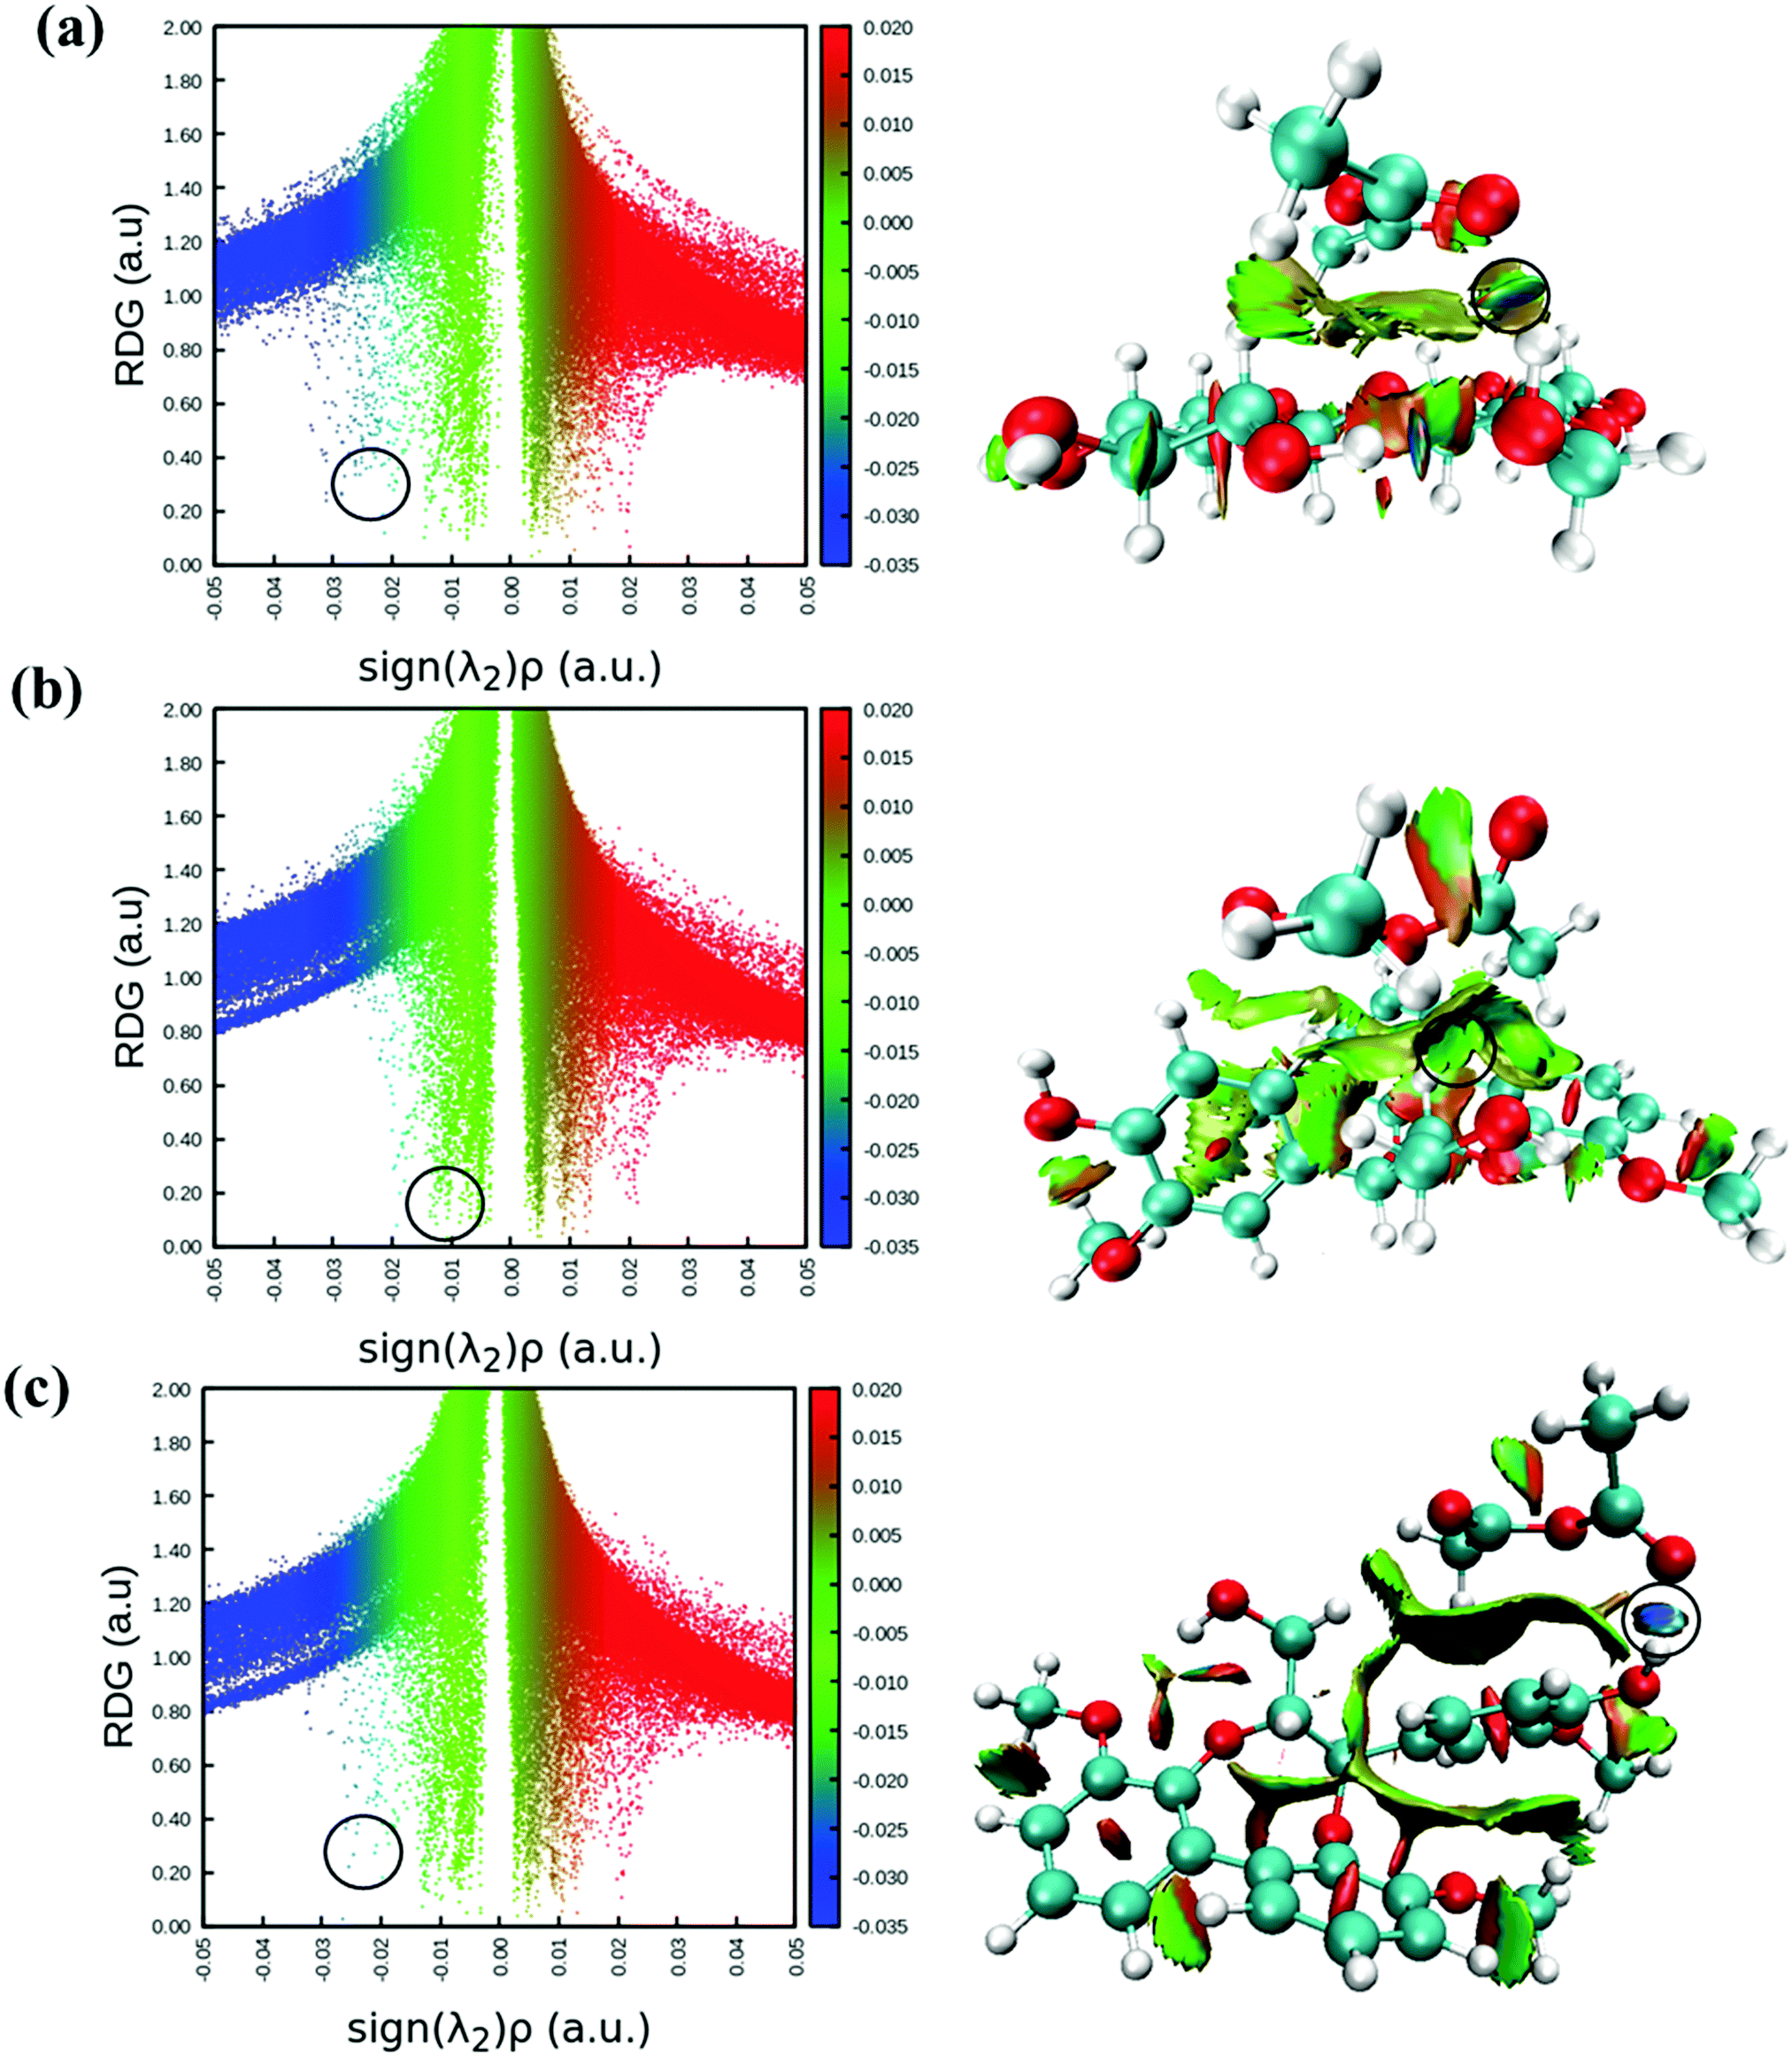 | ||
| Fig. 4 RDG scatter plots (left) and non-covalent interactions (NCI) plots (right) of (a) cellobiose−AA, (b) lignin-AA-C1 and (c) lignin-AA-C2. The isosurfaces are coloured according to the values of sign(λ2)ρ (a.u.), from −0.03 to 0.02 a.u. Colour online: blue represents strong attractive interactions, green indicates van der Waals interactions and red indicates repulsive/steric interactions. | ||
Gibbs free energy calculations
In order to provide an additional insight into the preferable reactive site for acetylation in the cellulose model and lignin model, free energy changes can be determined to find the most favorable path. In such context, the hydrogen atom of the hydroxyl group was substituted by the acetyl group and followed by the DFT optimization of acetylated cellulose and acetylated lignin model in the gas phase to estimate the free energy. It is emphasized that the calculated free energy changes provide basic knowledge to compare the hydroxyl group substitution in different positions. Therefore, the calculated free energy change of the reaction is presented in Table 3, and the optimized structures are shown in the ESI† (Fig. S2). In the case of the cellobiose model, three key substitutions of hydrogen atoms are taken into account; for instance, the position of the corresponding hydrogen in the hydroxyl groups are C2, C3 and C6 positions. It is mentioned that the position C1/C4 is not considered in the free energy calculation because the particular “O” atom greatly involves cellulose β-1 → 4 linkage polymerization of cellulose. Considering the lignin model, aliphatic and aromatic hydroxyl groups were examined. The calculated Gibbs free energy values (Table 3) indicated that acetyl substitution at position C3 in the cellobiose is the most favorable, followed by the substitution at C2, and the least favorable occurred at C6. These obtained results are in good agreement with experimental findings, where authors have shown that C3 and C2 are particularly acetylated using AA.50 However, it was predicted that the aromatic site was the most predominant for the lignin model compared to the aliphatic hydroxyl group. It should be noted that both cellobiose C3 substitution and lignin model aromatic substitution show similar energy values, therefore, the acetylation reaction could occur at the same rate in these cases. However, it is expected that primary hydroxyls are the primary site for the acetylation reaction in the cellulose model due to the acidic character and steric reasons, but our obtained results show an opposite trend. The cellulose model in the present study and intramolecular hydrogen bonds can influence this particular trend. On the other hand, some mixed reviews have been proposed for the reactivity of the hydroxyl group in cellulose that all hydroxyl groups participate and convert into cellulose acetate.51–55| Reaction | ΔG (kJ mol−1) |
|---|---|
| Cellobiose-OHC2 + AA → Cellobiose-OAcC2 + AcOH | −82.34 |
| Cellobiose-OHC3 + AA → Cellobiose-OAcC3 + AcOH | −86.87 |
| Cellobiose-OHC6 + AA → Cellobiose-OAcC6 + AcOH | −80.57 |
| Lignin model-OHγ + AA → Lignin-OAcγ + AcOH | −84.14 |
| Lignin model-OHar + AA → Lignin-OAcar + AcOH | −86.83 |
Radial distribution functions (RDF)
Furthermore, to gain more insight for understanding the influence of acetic anhydride in a bulk phase, MD simulations were performed for both cellobiose and lignin models. The MD trajectories were analyzed as described in the Computational details section. Subsequently, the radial distribution functions were calculated to evaluate the molecular arrangements and distribution of AA molecules around the cellobiose and lignin models. The obtained RDFs of the investigated model are illustrated in Fig. 5. Hydrogen bonds play a crucial role in the investigated systems; RDFs were mainly plotted for possible hydrogen interactions sites. The description of the atom number can be found in Fig. 1. Therefore, in the case of cellobiose–AA (Fig. 5(a) and (b)), three predominant hydrogen bonding interactions with AA were investigated, and the results indicate that the existence of sharp peaks at around 2.0 Å are evident for strong hydrogen bonds between cellobiose and carbonyl group from AA. Comparing the amplitude of different RDFs, the hydroxyl group of cellobiose at position 2, H2⋯OC, shows a strong hydrogen bonding with a high intensity of around 1.88 Å, followed by position 3, H3–OC (1.9 Å) and the least can be seen for position 6, H6⋯OC (2.0 Å). Although the relative intensity varies for different positions, the associated distance for hydrogen bonds is almost the same (the difference is <0.12 Å). Similarly, for the linking atom in cellobiose, OL, the sharp peaks are located at 3.24 Å and 4.46 Å with the carbonyl oxygen of AA, and these two peaks can be foreseen for two carbonyl oxygens present in the AA molecule. It is obvious that the OL atom with OE (center “O” atom in AA, the atoms labels can be found in Fig. S3, ESI†) of the AA peak appears near 5.36 Å. These obtained values were in good agreement with DFT hydrogen bond distances in Table 1 in the case of cellobiose–AA, where DFT found the H-bond distance of around 1.882 Å.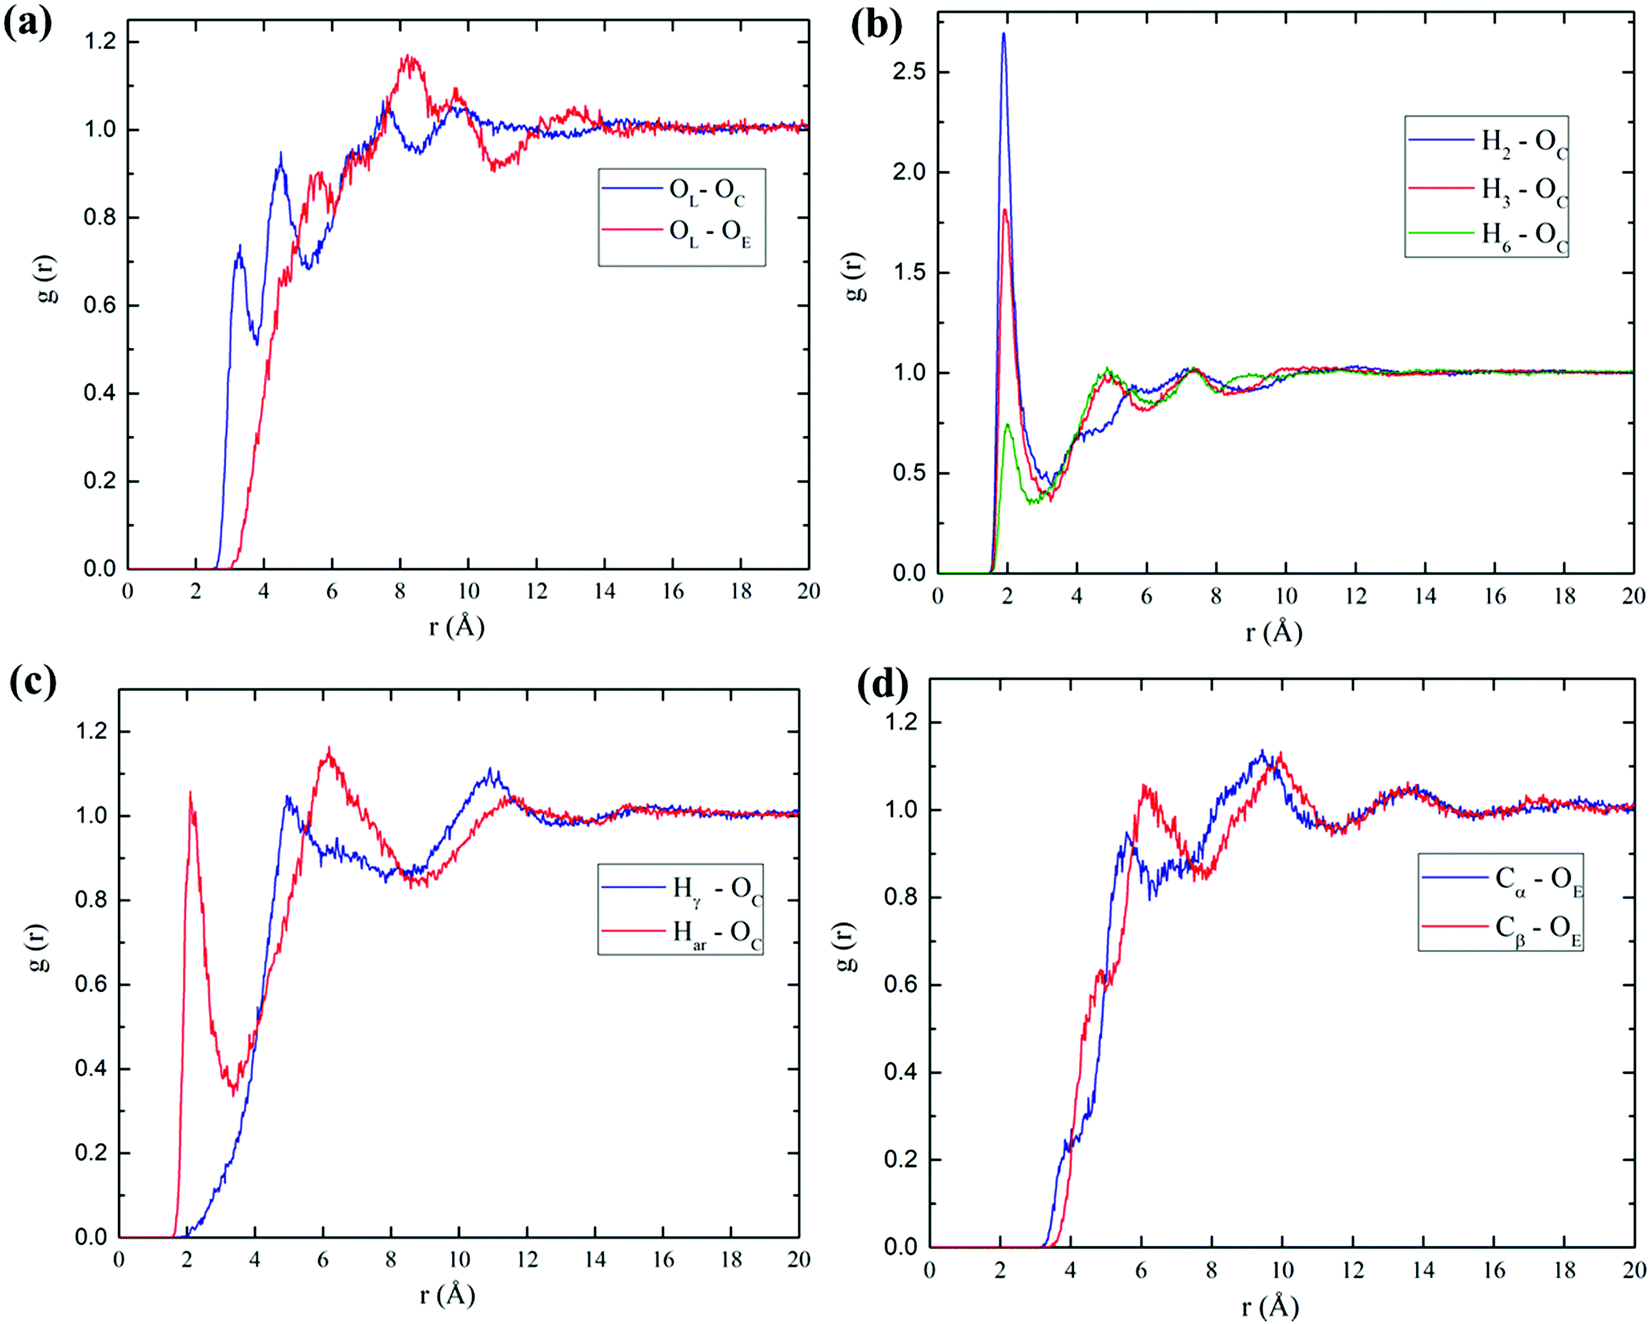 | ||
| Fig. 5 Calculated RDFs of cellobiose–AA (a and b) and lignin–AA (c and d) systems. | ||
Lignin–AA RDFs of two possible hydrogen bonds such as aromatic hydroxyl group and aliphatic hydroxyl groups are compared in Fig. 5(c and d). It is interesting to see that the strong peak appears at around 2.08 Å for the aromatic hydroxyl group rather than the large distance (4.86 Å) that can be seen for the aliphatic hydroxyl with the carbonyl oxygen of AA, which can be due to the fact of steric hindrance of aromatic rings. A similar trend has been expected in the case of Cα with OE (AA) because the side chain in the Cβ position can hinder the interaction of AA molecules, which eventually results in higher RDF distance. The particular hydrogen bond, Har–OC, is well in agreement with the distance obtained from DFT calculations (1.91 Å). The obtained MD results confirmed the further accuracy of DFT results. However, it is expected that the average bond length from MD simulation is longer than the DFT results due to influence of many AA molecules in the system.
Hydrogen bonding analysis
The hydrogen bond between the donor and acceptor of cellobiose and lignin models with AA is implicitly calculated with the criteria of cut-off distance of 3.5 Å and a cut-off angle of 30°. The lifetime of H-bond formation was also quantified using the Luzar and Chandler method.56,57 The results of the hydrogen bond correlation function for cellobiose–AA and lignin–AA models are presented in Fig. 6(a). It is expected that the autocorrelation function of cellobiose converges more slowly than the lignin model due to more hydroxyl group content in the cellobiose model. We observed from the MD simulations that the hydrogen bond lifetimes for cellobiose–AA and lignin–AA models are 3.17 ps and 1.62 ps, respectively. The total number of hydrogen bonds in Fig. 6(b) (only first 5000 ps shown) further explained that cellobiose forms hydrogen bonds three fold higher than that in the lignin model with AA. Furthermore, Fig. 6(c) describes the typical distance associated with hydrogen bond interaction between cellobiose–AA and lignin–AA models and that the donor–acceptor distance is rather low for the cellobiose model than the lignin model. This analysis again demonstrated that cellobiose primarily shows a stronger coordination with the acetic anhydride molecule than the lignin model.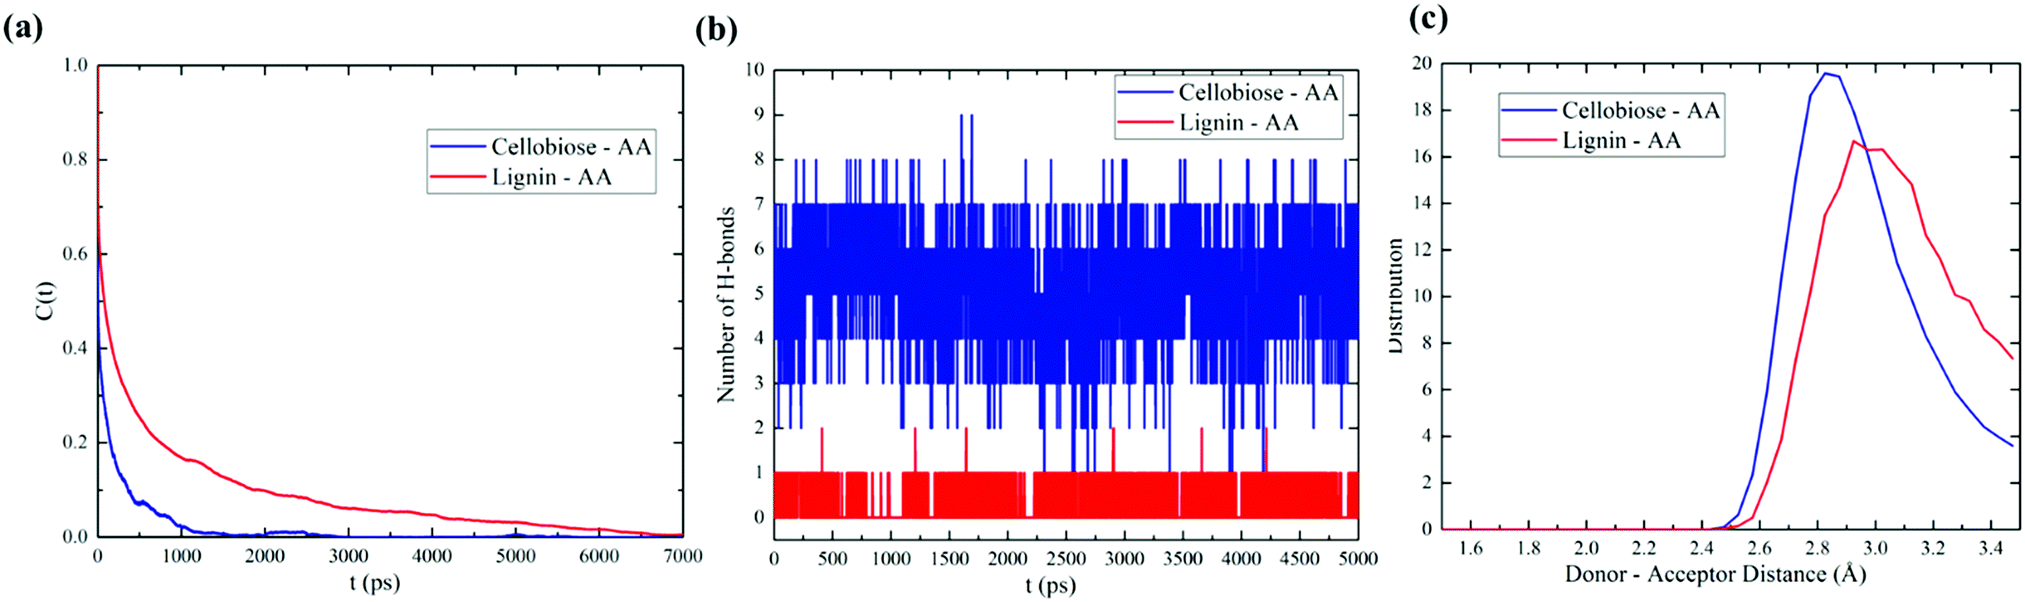 | ||
| Fig. 6 Hydrogen bonding characteristics of cellulose and lignin with the AA system: (a) hydrogen bonding auto-correlation function, (b) the number of hydrogen bonds present in the system, and (c) the typical distance of hydrogen bond formation. | ||
Angle distribution of AA
As seen from DFT calculations, the linear conformation of acetic anhydride has deviated in the cases of optimized lignin–AA configurations. Therefore, we have calculated the angle between OC–OE–OC atoms of the AA molecule from MD simulation trajectories to understand the conformational changes. It is emphasized that the angle of initial conformation of AA is about 78 degrees. Fig. 7 illustrates the angle between OC–OE–OC of AA. The AA conformation in both cellobiose and lignin model simulations was retained, which can clearly be seen in Fig. 7. The resulting angles were found to be around 75.9 degrees. Therefore, it is stressed that bulk MD simulations of cellobiose and lignin models do not affect the geometry of the acetic anhydride molecule, which can be due to the dominant concentration of AA molecules in the simulation system.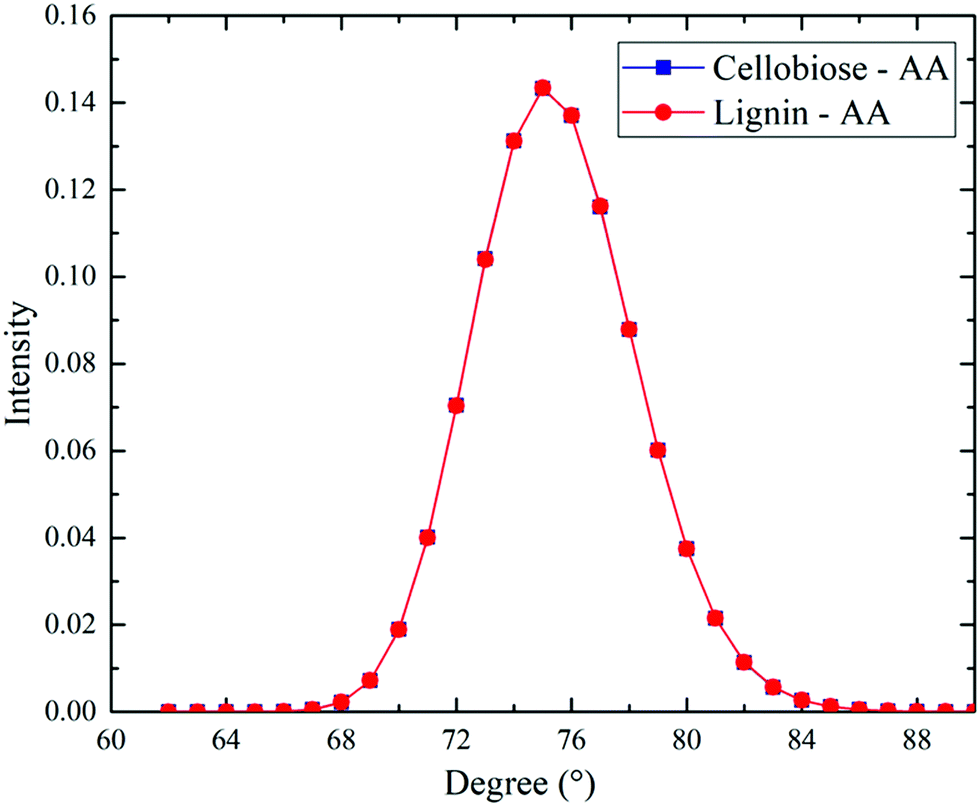 | ||
| Fig. 7 Average distribution of angle between OC1–OE–OC2 of AA molecules in cellobiose–AA and lignin–AA systems. | ||
It has been demonstrated in several studies that the reactivity of cell wall polymers toward acetic anhydride decreases in the order of lignin > hemicellulose > cellulose.10,13,14 Sadeghifar et al. pointed out that acetylation reactions can be related to swelling and accessibility of reactive sites (OH groups in this case).14 A swollen state of the wood material thus enhances the accessibility of the hydroxyl group due to the fact that swelling can lead the cell-wall micro-voids to open up for the diffusion process and promote the reactions. Moreover, a higher degree of substitution and diffusion are inevitable for acetylation of cellulose in the case of prolonged reaction time.58 Considering the diffusion process, the acetic anhydride reagent can access only the surface of cellulose because of the strong crystalline and structural arrangement of the cellulose polymer. This peculiar phenomenon can be related to the current work where a small molecular model of isolated cellobiose and lignin represents the amorphous or surface-based system. The examined system may affect the acetylation reaction trend, and the reported work on isolated polysaccharide (hemicellulose) exhibits higher efficiency of acetylation.59 In such context, a cellobiose model may exhibit strong reactivity against acetic anhydride. Similar results have been proposed by the authors,15 who have investigated the chemical modification of wood using various quantum chemical descriptors to evaluate the reactivity and demonstrate that cellulose and hemicellulose are the most affected by the acetylation reaction. Our findings were in good agreement with this quantum chemical investigation where the analysis showed that cellobiose-OH is a more pronounced site for the acetylation of wood. Apparently, it can be due to a large proportion of hydroxyl groups present in the cellobiose model, and similar results were observed for cellulose polymers without hemicellulose and lignin.60 In the case of the lignin model, the lack of rigidity due to α- and β-O-4 linkages, steric hindrance from aromatic rings and also small number of hydroxyl groups drive the lignin model to lower interaction energy with acetic anhydride. It should be pointed out here that the present study considers a particular lignin model (dibenzodioxocin) and, therefore, interaction energy and the trend can be different for other lignins with more complex model compounds. Consequently, the accessibility, structure, degree of polymerization and reactivity of isolated wood components might be different from those present within native wood (Sadeghifar et al. 2014).
Conclusions
In the present study, structural arrangements and hydrogen bond analysis for determining the interaction of cellulose and lignin model compounds with acetic anhydride (AA) are investigated using density functional theory (DFT) and molecular dynamics (MD) simulations. The calculated interaction energy values from DFT calculations of cellobiose–acetic anhydride and lignin-acetic anhydride revealed that AA makes a strong interaction with cellulose hydroxyls compared to lignin, and the energy difference is about 20 kJ mol−1. Hydrogen bond analysis results demonstrated that cellobiose–AA exhibits a shorter hydrogen bond than the lignin–AA model. However, it should be mentioned that the electron density of a particular interaction, the aromatic hydroxyl group of lignin with AA, is higher electron than cellobiose–AA. On the other hand, the strength of the hydrogen bond in the case of the aliphatic hydroxyl group in lignin is lower than the aromatic hydroxyl of lignin. The estimated Gibbs free energy values of substitution of acetyl group in the hydroxyl revealed that both cellobiose and lignin present similar values, which indicated equivalent reactivity. MD results showed that the radial distribution function of the selected atoms in bulk simulations was in good agreement with the obtained DFT results. MD also showed a higher hydrogen bond lifetime and number of hydrogen bonds for cellobiose than lignin. Furthermore, no significant change in the dihedral angle was observed for AA molecules in MD. Although our results provide significant insight into reactivity and key sites for wood modification process using AA, the present DFT and MD results contrasted with experimental findings, which demonstrated that lignin is highly reactive towards acetylation of wood. This can be due to the fact that cellulose polymer exists in the crystalline state in wood, and our examined model can be linked either to the amorphous phase of cellulose or cellulose molecules on the surface. In the case of lignin, the obtained results were solely related to the investigated lignin model, and the results can differ for other lignin model compounds. Overall, the comprehensive analysis of acetic anhydride interaction with cellulose and lignin using combined DFT and MD provides a fundamental understanding of acetylation of wood using acetic anhydride.Conflicts of interest
There are no conflicts of interest to declare.Acknowledgements
The author gratefully acknowledges the European Commission for funding the InnoRenew project [Grant Agreement # 739574] under the Horizon2020 Widespread-Teaming program, the Republic of Slovenia (investment funding of the Republic of Slovenia and the European Union European Regional Development Fund) and the infrastructural ARRS program IO-0035. Part of this work was conducted during the project Multi-spec (BI-IT/18-20-007) funded by ARRS.References
- R. M. Rowell, Acetylation of wood – A review, Int. J. Lignocellul. Prod., 2014, 1, 1–27 Search PubMed.
- D. Sandberg, A. Kutnar and G. Mantanis, Wood modification technologies – a review, IForest - Biogeosciences For., 2017, 10, 895 CrossRef.
- W. J. Homan and A. J. Jorissen, Wood modification developments, Heron, 2004, 49, 360–369 Search PubMed.
- S. Lande, M. Eikenes, M. Westin and M. H. Schneider, Development of Commercial Wood Preservatives, American Chemical Society, 2008, vol. 982, pp. 337–355 Search PubMed.
- R. M. Rowell and J. P. Dickerson, Deterioration and Protection of Sustainable Biomaterials, American Chemical Society, 2014, vol. 1158, pp. 301–327 Search PubMed.
- R. M. Rowell, R. Simonson, S. Hess, D. V. Plackett, D. Cronshaw and E. Dunningham, Acetyl Distribution in Acetylated Whole Wood and Reactivity of Isolated Wood Cell-Wall Components to Acetic Anhydride, Wood Fiber Sci., 2007, 26, 11–18 Search PubMed.
- R. M. Rowell, Handbook of Wood Chemistry and Wood Composites, CRC Press, 2005 Search PubMed.
- M. A. Fuqua, S. Huo and C. A. Ulven, Natural Fiber Reinforced Composites, Polym. Rev., 2012, 52, 259–320 CrossRef CAS.
- P. Larsson Brelid, R. Simonson, Ö. Bergman and T. Nilsson, Resistance of acetylated wood to biological degradation, Holz Roh- Werkst. (1937-2008), 2000, 58, 331–337 CrossRef CAS.
- C. A. S. Hill, Wood Modification: Chemical, Thermal and Other Processes, John Wiley & Sons, 2007 Search PubMed.
- E. T. Engelund, L. G. Thygesen, S. Svensson and C. A. S. Hill, A critical discussion of the physics of wood–water interactions, Wood Sci. Technol., 2013, 47, 141–161 CrossRef CAS.
- A. N. Papadopoulos and C. A. S. Hill, The sorption of water vapour by anhydride modified softwood, Wood Sci. Technol., 2003, 37, 221–231 CrossRef CAS.
- C. A. S. Hill, D. Jones, G. Strickland and N. S. Cetin, Kinetic and Mechanistic Aspects of the Acetylation of Wood with Acetic Anhydride, Holzforschung, 2009, 52, 623–629 CrossRef.
- H. Sadeghifar, J. P. Dickerson and D. S. Argyropoulos, Quantitative 31P NMR analysis of solid wood offers an insight into the acetylation of its components, Carbohydr. Polym., 2014, 113, 552–560 CrossRef CAS.
- Y. Elrhayam and A. Elharfi, 3D-QSAR studies of the chemical modification of hydroxyl groups of biomass (cellulose, hemicelluloses and lignin) using quantum chemical descriptors, Heliyon, 2019, 5, e02173 CrossRef.
- S. Yan and L. Yao, DFT application in conformational determination of cellobiose, Carbohydr. Res., 2015, 404, 117–123 CrossRef CAS.
- Y. Zhang, H. He, K. Dong, M. Fan and S. Zhang, A DFT study on lignin dissolution in imidazolium-based ionic liquids, RSC Adv., 2017, 7, 12670–12681 RSC.
- Y. Zhu, Z. Han, L. Fu, C. Liu and D. Zhang, Cleavage of the β-O-4 bond in a lignin model compound using the acidic ionic liquid 1-H-3-methylimidazolium chloride as catalyst: a DFT mechanistic study, J. Mol. Model., 2018, 24, 322 CrossRef.
- W. Ji, Z. Ding, J. Liu, Q. Song, X. Xia, H. Gao, H. Wang and W. Gu, Mechanism of Lignin Dissolution and Regeneration in Ionic Liquid, Energy Fuels, 2012, 26, 6393–6403 CrossRef CAS.
- F. Mostaghni, A. Teimouri and S. A. Mirshokraei, Synthesis, spectroscopic characterization and DFT calculations of β-O-4 type lignin model compounds, Spectrochim. Acta, Part A, 2013, 110, 430–436 CrossRef CAS.
- E. M. Kukkola, S. Koutaniemi, E. Pöllänen, M. Gustafsson, P. Karhunen, T. K. Lundell, P. Saranpää, I. Kilpeläinen, T. H. Teeri and K. V. Fagerstedt, The dibenzodioxocin lignin substructure is abundant in the inner part of the secondary wall in Norway spruce and silver birch xylem, Planta, 2004, 218, 497–500 CrossRef CAS.
- T. Elder, Bond Dissociation Enthalpies of a Dibenzodioxocin Lignin Model Compound, Energy Fuels, 2013, 27, 4785–4790 CrossRef CAS.
- J. D. Kubicki, M. N.-A. Mohamed and H. D. Watts, Quantum mechanical modeling of the structures, energetics and spectral properties of Iα and Iβ cellulose, Cellulose, 2013, 20, 9–23 CrossRef CAS.
- M. Cirtog, M. E. Alikhani, B. Madebène, P. Soulard, P. Asselin and B. Tremblay, Bonding Nature and Vibrational Signatures of Oxirane:(Water) n = 1–3. Assessment of the Performance of the Dispersion-Corrected DFT Methods Compared to the ab initio Results and Fourier Transform Infrared Experimental Data, J. Phys. Chem. A, 2011, 115, 6688–6701 CrossRef CAS.
- T. Lu and F. Chen, Multiwfn: A multifunctional wavefunction analyzer, J. Comput. Chem., 2012, 33, 580–592 CrossRef CAS.
- W. Humphrey, A. Dalke and K. Schulten, VMD: visual molecular dynamics, J. Mol. Graphics, 1996, 14, 33–38 CrossRef CAS.
- D. V. D. Spoel, E. Lindahl, B. Hess, G. Groenhof, A. E. Mark and H. J. C. Berendsen, GROMACS: Fast, flexible, and free, J. Comput. Chem., 2005, 26, 1701–1718 CrossRef.
- B. Hess, C. Kutzner, D. van der Spoel and E. Lindahl, GROMACS 4:
![[thin space (1/6-em)]](https://www.rsc.org/images/entities/char_2009.gif) Algorithms for Highly Efficient, Load-Balanced, and Scalable Molecular Simulation, J. Chem. Theory Comput., 2008, 4, 435–447 CrossRef CAS.
Algorithms for Highly Efficient, Load-Balanced, and Scalable Molecular Simulation, J. Chem. Theory Comput., 2008, 4, 435–447 CrossRef CAS. - R. Danne, C. Poojari, H. Martinez-Seara, S. Rissanen, F. Lolicato, T. Róg and I. Vattulainen, doGlycans–Tools for Preparing Carbohydrate Structures for Atomistic Simulations of Glycoproteins, Glycolipids, and Carbohydrate Polymers for GROMACS, J. Chem. Inf. Model., 2017, 57, 2401–2406 CrossRef CAS.
- D. Kony, W. Damm, S. Stoll and W. F. V. Gunsteren, An improved OPLS–AA force field for carbohydrates, J. Comput. Chem., 2002, 23, 1416–1429 CrossRef CAS.
- L. S. Dodda, I. Cabeza de Vaca, J. Tirado-Rives and W. L. Jorgensen, LigParGen web server: an automatic OPLS-AA parameter generator for organic ligands, Nucleic Acids Res., 2017, 45, W331–W336 CrossRef CAS.
- V. Ponnuchamy, A theoretical investigation of different point charges combined with GAFF and OPLS-AA for acetic anhydride, Chem. Phys. Lett., 2020, 754, 137707 CrossRef CAS.
- G. Bussi, D. Donadio and M. Parrinello, Canonical sampling through velocity rescaling, J. Chem. Phys., 2007, 126, 014101 CrossRef.
- H. J. C. Berendsen, J. P. M. Postma, W. F. van Gunsteren, A. DiNola and J. R. Haak, Molecular dynamics with coupling to an external bath, J. Chem. Phys., 1984, 81, 3684–3690 CrossRef CAS.
- T. Darden, D. York and L. Pedersen, Particle mesh Ewald: an N·log(N) method for Ewald sums in large systems, J. Chem. Phys., 1993, 98, 10089–10092 CrossRef CAS.
- K. Kulasinski, Free Energy Landscape of Cellulose as a Driving Factor in the Mobility of Adsorbed Water, Langmuir, 2017, 33, 5362–5370 CrossRef CAS.
- B. Hess, H. Bekker, H. J. C. Berendsen and J. G. E. M. Fraaije, LINCS: a linear constraint solver for molecular simulations, J. Comput. Chem., 1997, 18, 1463–1472 CrossRef CAS.
- K. Kulasinski, S. Keten, S. V. Churakov, D. Derome and J. Carmeliet, A comparative molecular dynamics study of crystalline, paracrystalline and amorphous states of cellulose, Cellulose, 2014, 21, 1103–1116 CrossRef CAS.
- K. Mazeau and L. Heux, Molecular Dynamics Simulations of Bulk Native Crystalline and Amorphous Structures of Cellulose, J. Phys. Chem. B, 2003, 107, 2394–2403 CrossRef CAS.
- F. A. Michelsen and B. A. Foss, A comprehensive mechanistic model of a continuous Kamyr digester, Appl. Math. Model., 1996, 20, 523–533 CrossRef.
- J. V. Cotterill, R. M. Wilkins and F. T. da Silva, Controlled release of diuron from granules based on a lignin matrix system, J. Controlled Release, 1996, 40, 133–142 CrossRef CAS.
- E. M. L. Ehrnrooth, Change in Pulp Fibre Density With Acid-Chlorite Delignification, J. Wood Chem. Technol., 1984, 4, 91–109 CrossRef CAS.
- L. Zhang and E. J. LeBoeuf, A molecular dynamics study of natural organic matter: 1. Lignin, kerogen and soot, Org. Geochem., 2009, 40, 1132–1142 CrossRef CAS.
- A. E. Kazzaz, Z. H. Feizi and P. Fatehi, Grafting strategies for hydroxy groups of lignin for producing materials, Green Chem., 2019, 21, 5714–5752 RSC.
- R. F. W. Bader, Atoms in molecules, Acc. Chem. Res., 1985, 18, 9–15 CrossRef CAS.
- S. J. Grabowski, Non-covalent interactions – QTAIM and NBO analysis, J. Mol. Model., 2013, 19, 4713–4721 CrossRef CAS.
- R. G. Parr, in Horizons of Quantum Chemistry, ed. K. Fukui and B. Pullman, Springer Netherlands, Dordrecht, 1980, pp. 5–15 Search PubMed.
- J. Contreras-García, E. R. Johnson, S. Keinan, R. Chaudret, J.-P. Piquemal, D. N. Beratan and W. Yang, NCIPLOT: A Program for Plotting Noncovalent Interaction Regions, J. Chem. Theory Comput., 2011, 7, 625–632 CrossRef.
- E. R. Johnson, S. Keinan, P. Mori-Sánchez, J. Contreras-García, A. J. Cohen and W. Yang, Revealing Noncovalent Interactions, J. Am. Chem. Soc., 2010, 132, 6498–6506 CrossRef CAS.
- M. Jebrane, F. Pichavant and G. Sèbe, A comparative study on the acetylation of wood by reaction with vinyl acetate and acetic anhydride, Carbohydr. Polym., 2011, 83, 339–345 CrossRef CAS.
- L. A. Hiller, The reaction of cellulose acetate with acetic acid and water, J. Polym. Sci., 1953, 10, 385–423 CrossRef CAS.
- M. M. Mojtahedi and S. Samadian, Efficient and Rapid Solvent-Free Acetylation of Alcohols, Phenols, and Thiols Using Catalytic Amounts of Sodium Acetate Trihydrate, J. Chem., 2013, 2013, 1–7 CrossRef.
- Y. Wang, X. Wang, Y. Xie and K. Zhang, Functional nanomaterials through esterification of cellulose: a review of chemistry and application, Cellulose, 2018, 25, 3703–3731 CrossRef CAS.
- J. Rostami, A. P. Mathew and U. Edlund, Zwitterionic Acetylated Cellulose Nanofibrils, Molecules, 2019, 24, 3147 CrossRef CAS.
- Y. Chai, J. Liu, Z. Wang and Y. Zhao, Dimensional Stability and Mechanical Properties of Plantation Poplar Wood Esterified Using Acetic Anhydride, BioResources, 2017, 12, 912–922 CAS.
- A. Luzar, Resolving the hydrogen bond dynamics conundrum, J. Chem. Phys., 2000, 113, 10663–10675 CrossRef CAS.
- A. Luzar and D. Chandler, Hydrogen-bond kinetics in liquid water, Nature, 1996, 379, 55–57 CrossRef CAS.
- W. R. Wan Daud and F. M. Djuned, Cellulose acetate from oil palm empty fruit bunch via a one step heterogeneous acetylation, Carbohydr. Polym., 2015, 132, 252–260 CrossRef CAS.
- K. Peredo, H. Reyes, D. Escobar, J. Vega-Lara, A. Berg and M. Pereira, Acetylation of bleached Kraft pulp: effect of xylan content on properties of acetylated compounds, Carbohydr. Polym., 2015, 117, 1014–1020 CrossRef CAS.
- A. A. Vaidya, M. Gaugler and D. A. Smith, Green route to modification of wood waste, cellulose and hemicellulose using reactive extrusion, Carbohydr. Polym., 2016, 136, 1238–1250 CrossRef CAS.
Footnote |
| † Electronic supplementary information (ESI) available. See DOI: 10.1039/d0cp05165a |
| This journal is © the Owner Societies 2020 |