 Open Access Article
Creative Commons Attribution 3.0 Unported Licence
More than protection: the function of TiO2 interlayers in hematite functionalized Si photoanodes†
Anurag
Kawde
 abcd,
Alagappan
Annamalai
e,
Anita
Sellstedt
f,
Jens
Uhlig
d,
Thomas
Wågberg
e,
Pieter
Glatzel
*b and
Johannes
Messinger
 *ag
*ag
aUmeå University, Faculty of Science and Technology, Department of Chemistry, Sweden
bEuropean Synchrotron Radiation Facility, Grenoble, France. E-mail: pieter.glatzel@esrf.fr
cLund Institute of advanced Neutron and X-Ray Science, Lund University, Sweden
dNanoLund and Chemical Physics, Department of Chemistry, Lund University, Sweden
eUmeå University, Faculty of Science and Technology, Department of Physics, Sweden
fUmeå University, Faculty of Science and Technology, Department of Plant Physiology, Umeå Plant Science Centre (UPSC), Umeå, Sweden
gMolecular Biomimetics, Department of Chemistry – Ångström Laboratory, Uppsala University, Sweden. E-mail: johannes.messinger@kemi.uu.se
First published on 23rd November 2020
Abstract
Worldwide significant efforts are ongoing to develop devices that store solar energy as fuels. In one such approach, solar energy is absorbed by semiconductors and utilized directly by catalysts at their surfaces to split water into H2 and O2. To protect the semiconductors in these photo-electrochemical cells (PEC) from corrosion, frequently thin TiO2 interlayers are applied. Employing a well-performing photoanode comprised of 1-D n-Si microwires (MWs) covered with a mesoporous (mp) TiO2 interlayer fabricated by solution processing and functionalized with α-Fe2O3 nanorods, we studied here the function of this TiO2 interlayer by high-energy resolution fluorescence detected X-ray absorption near edge structure (HERFD-XANES) spectroscopy, along with X-ray emission spectroscopy (XES) and standard characterization techniques. Our data reveal that the TiO2 interlayer not only protects the n-Si MW surface from corrosion, but that it also acts as a template for the hydrothermal growth of α-Fe2O3 nanorods and improves the photocatalytic efficiency. We show that the latter effect correlates with the presence of stable oxygen vacancies at the interface between mp-TiO2 and α-Fe2O3, which act as electron traps and thereby substantially reduce the charge recombination rate at the hematite surface.
Introduction
Solar-driven photo-electrochemical (PEC) water splitting is one of the most promising routes for producing green fuels, such as hydrogen.1,2 Efficient PEC devices frequently employ co-catalyst decorated semiconductor photo-electrodes to harvest solar energy and to split water into hydrogen and oxygen. In the search for the most efficient photoelectrode for PEC applications, semiconductors like TiO2,3,4 α-Fe2O3,5–7 p/n Si,8–10 WO3,11 CuO2,12,13 BiVO414–17 and Ta3N518,19 have been studied since Fujishima and Honda4 first demonstrated the approach in 1972.To address potential scalability requirements of the PEC water splitting system, photo-electrodes comprising earth-abundant elements are frequently studied. Manufacturing the components employing solution-based techniques may contribute to further lower the costs of the production process. Examples for earth abundant components employed are silicon (Si) and hematite (α-Fe2O3), which under one sun illumination have theoretical solar conversion efficiencies of ∼43% and ∼15%, respectively.20,21 However, the stability of Si in the aqueous condition is low,22 and thus protective layers of, for instance, Ti,23 Ni,24 NiOx,25 or TiO28,22,26,27 have been applied. The thickness of the most frequently used TiO2 layers varies from ∼2 to 130 nm.28 It was initially believed that thick TiO2 films might act as insulators. However, comprehensive studies by the groups of Lewis,27,28 Tilly,29,30 and Chorkendorff31,32 demonstrate that even TiO2 layers exceeding 100 nm thickness efficiently transfer charges.29 Interestingly, our recent study of variously functionalized p-Si microwires photoelectrodes indicates that their performance in seawater splitting was even enhanced by a ∼50 nm thick mesoporous TiO2 interlayer.8 Apparently, the role of the TiO2 protective layer seems to be more versatile and sophisticated then previously assumed. So far, the role of the TiO2 protective layer has been primarily studied by photo-electrochemical techniques,33,34 such as Mott–Schottky measurements35 and incident photon-to-current efficiency measurements (IPCE),36 which both give an integral view of the TiO2 layer. However, there is still a lack of understanding from a fundamental atomic level electronic structure perspective.
Using an all solution-based approach, we prepared an n-Si MWs/mp-TiO2/α-Fe2O3 photoanode with highly competitive photo-electrochemical performance and employed it to understand the multiple roles of the TiO2 interlayer. Our findings suggest that the TiO2 interlayer not only stabilizes the photoanode, but that the mesoporous (mp) morphology of TiO2 also acts as a template for the uniform and high surface area hydrothermal growth of the α-Fe2O3 co-catalyst. Furthermore, the presence of the mp-TiO2 interlayer helps to suppress the exciton charge recombination between n-Si MWs photoelectrodes and co-catalysts, which results in better charge transfer kinetics at the electrode/electrolyte interface for water oxidation. High-energy resolution fluorescence detected X-ray absorption near edge structure (HERFD-XANES), and valence-to-core X-ray emission spectroscopy (vtc-XES) at the Ti K-edge demonstrate significant electronic structural changes. At the same time, the Fe K-edge shows little change indicating that the Fe electronic structure is hardly affected by mesoporous TiO2. Our data suggest that the modification of the electronic structure in the TiO2 interlayer leads to the exceptional photo-electrochemical performance of our functionalized n-Si photoanode during water oxidation.
Results and discussion
Preparation, morphology, and elemental characterization of functionalized n-Si MWs
A 1-D microwire structure (n-Si MWs) on the surface of a planar n-Si was obtained by treating small pieces of n-Si wafers (2 × 2 cm2) with an etching electrolyte comprised of HF and AgNO3 following a previously published procedure (see ESI,† for further details).37 The resulting n-Si MWs were then spin-coated with a TiO2 sol–gel,8,38,39 resulting in n-Si MWs/mp-TiO2 photoelectrodes. In this process, the block-co-polymer formed spherical micelles that supported the formation of a mesoporous structure of the protective TiO2 layer (Fig. SI 1, ESI†). The cross-sectional SEM image in Fig. 1a shows that the MW's have a length of about 25 μm and that the TiO2 coating was complete, yet thin enough not to remove the spacing between the MW. A magnified view of the TiO2 coating is presented in Fig. 1b. Onto this mesoporous TiO2 surface, hematite nanorods were hydrothermally grown40 (see ESI† for further details). The morphology of the resulting n-Si MWs/mp-TiO2/α-Fe2O3 is shown in Fig. 1c and d. It can be seen that despite the acidic conditions during the hydrothermal treatment, the MWs remained mostly intact and that a uniform coverage with ca. 200 nm long Fe2O3 nanorods were obtained. The excellent coverage of the MW with small, similarly sized α-Fe2O3 nanorods suggests that the mesopores of mp-TiO2 acted as templates for nanorod formation by serving as nucleation sites (see also below). After the synthesis, the samples were annealed at 380 °C, so that the Fe2O3 nanorods were converted majorly to alpha hematite (α-Fe2O3), as confirmed by X-ray photoelectron spectroscopy (see details in Fig. SI 2, ESI†) and HERFD-XANES (Fig. SI 8 and 9, ESI†). The UV-vis absorption spectrum for bare α-Fe2O3 nanorods is presented in Fig. SI 6 c, ESI†).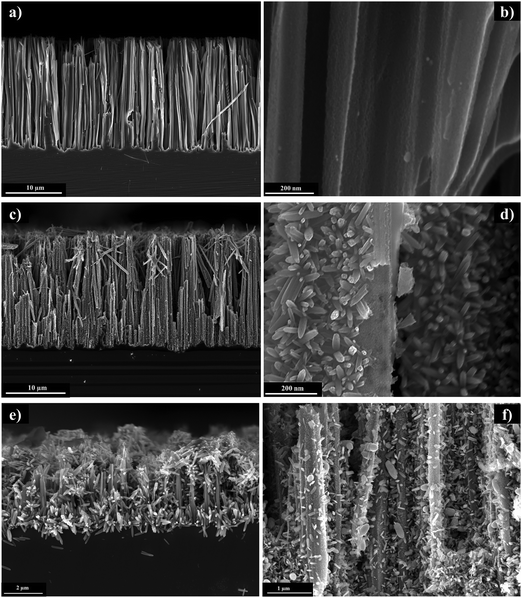 | ||
| Fig. 1 Cross-sectional SEM images of (a and b) n-Si MWs/mp-TiO2, (c and d) n-Si MWs/mp-TiO2/α-Fe2O3, (e) n-Si MWs/α-Fe2O3 and (f) n-Si MWs/a-TiO2/α-Fe2O3. | ||
Fig. 1e shows that in the absence of the TiO2 layer, the n-Si MWs were partially dissolved by the acidic iron precursor and that about 5 times larger α-Fe2O3 rods (ca. 1 μm) were obtained that lacked good contact to the n-Si MWs. The increased size of α-Fe2O3 nanorod/crystallites is likely due to the significantly fewer nucleation sites provided by n-Si MWs as compared to n-Si MWs/mp-TiO2.
To test if the surface morphology of the TiO2 interlayer is indeed essential for an even growth of α-Fe2O3 nanorods, we also prepared a photoanode covered by an amorphous TiO2 layer (n-Si MWs/a-TiO2/Fe2O3). For this, a commercial titanium diisopropoxide bis(acetylacetonate) solution (diluted with ethanol) was applied using a similar spin-coating cycle as for making mp-TiO2.6,8 Due to the absence of a block co-polymer like pluronic P123, which is known to promote mesopore formation,38,39 and due to the lower viscosity of the commercial precursor solution, the resulting TiO2 film on the n-Si MWs was amorphous (a-TiO2) and less-even compared to the sol–gel approach. The electron microscopic image in Fig. 1f shows that although the a-TiO2 interlayer largely protected the n-Si MW during the hydrothermal treatment, fewer Fe2O3 crystallites formed on its surface. In addition, the Fe2O3 crystallites were of varying size and shape, with less good contact to the a-TiO2 surface as compared to mp-TiO2 (Fig. 1d). These results further confirm that mp-TiO2 acts, via its mesopores, as a template for an even and dense hydrothermal growth of well-connected Fe2O3 nanorods on top of the MWs. This is important for providing a large catalytic surface and for minimizing the charge carrier transport pathways within Fe2O3.41,42
Based on this structural inspection, we confirmed that mesoporous TiO2 protects n-Si MWs in acidic media,27,43 and propose that it also provides essential nucleation sites for the growth of uniform and well-connected Fe2O3 nanorods.
Photo-electrochemical characterization
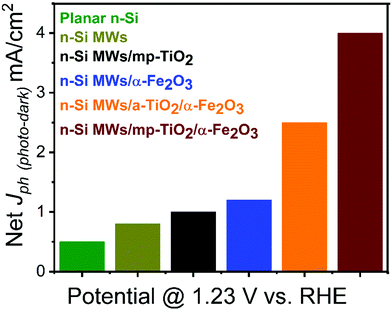
The PEC performance of the n-Si MWs/mp-TiO2/α-Fe2O3 photoanode was systematically compared to various control samples, such as bare planar n-Si, bare n-Si MWs, n-Si MWs/mp-TiO2, n-Si MWs/α-Fe2O3 and n-Si MWs/a-TiO2/α-Fe2O3. The photocurrent densities (Jph) obtained in aqueous 1 M NaOH electrolyte at one sun illumination and an applied potential of 1.23 VRHE (using a Pt counter electrode) are shown in Fig. 2 (see ESI† for further details). The corresponding I/V curves are displayed in Fig. SI 3 and SI 4 (ESI†). Fig. 2 shows that for bare planar n-Si the Jph was 0.5 mA cm−2, and that Jph increased to 0.8 mA cm−2 for bare n-Si MWs, reflecting the expected improved light absorption and charge-transfer capabilities of the microwire morphology.8 Interestingly, mp-TiO2 sol–gel coating of the n-Si MWs led to a further increase of Jph to 1.01 mA cm−2. Most importantly, we noted a significant rise in Jph to 4 mA cm−2 (±0.02 mA cm−2) when the n-Si MWs/mp-TiO2 were additionally decorated with α-Fe2O3 nanorods. In the absence of the protective TiO2 layer, the photocurrent dropped to 1.2 mA cm−2 for n-Si MWs/α-Fe2O3, while the n-Si MW/a-TiO2/α-Fe2O3 photoanode reached a photocurrent of 2.5 mA cm−2, still clearly below the values achieved with a mp-TiO2 protection layer.To confirm solar-assisted water splitting, the photogenerated gases were analyzed by sampling the headspace with gas chromatography during a chronoamperometry (at 1.23 VRHE; Fig. SI 5, ESI†). After a short onset period, a nearly stable photocurrent of about 4 mA cm−2 was observed for the n-Si MW/mp-TiO2/α-Fe2O3 photoanode over the entire sampling period of 2 hours. The accumulated amounts of photogenerated hydrogen and oxygen collected from the headspace of the PEC cell were 4.33 and 2.2 mmol cm−2 (Fig. SI 5b, ESI†), corresponding to faradaic efficiencies of 94% and 97%, respectively.
The TiO2 interlayer also significantly lowered the onset potential, which we defined here as the potential at which the net photocurrent density reached 0.1 mA cm−2. The value for n-Si MW/mp-TiO2/α-Fe2O3 was only 0.27 VRHE (Fig. SI 3b, ESI†), which is, to the best of our knowledge, the lowest reported onset potential for an undoped α-Fe2O3 nanorod based photoanode. In the absence of the mp-TiO2 interlayer, the onset potential was 540 mV higher (0.81 VRHE; Fig. SI 3b, ESI†). The onset potential for an electrode comprising similar α-Fe2O3 nanorods grown on FTO substrate with an a-TiO2 interlayer was found to be 0.77 VRHE.6,44 The above experiments indicate that the low onset potential and high Jph reported here may come from having a dual absorber PEC system made of uniformly sized Fe2O3 nanorods that are well connected to the n-Si MWs via mp-TiO2.
To test if the bandgaps of both Si and Fe2O3 contribute to the light absorption and thus Jph of the n-Si MW/mp-TiO2/α-Fe2O3 photoelectrode, this multilayer system was selectively excited at either 455 nm, to probe the contribution of the α-Fe2O3 nanorods, or at 625 nm for testing the performance if only the n-Si MWs absorbed light (Fig. SI 6, ESI†). Employing 455 nm illumination at 100 mW cm−2, we found that at 1.23 VRHEJph was 2.4 mA cm−2, which was almost 60% of the photocurrent obtained at 1 sun illumination (Fig. SI 6, ESI†). This indicates that under these experimental conditions the α-Fe2O3 nanorods were not simply dark OER catalyst, but instead acted as photo absorbers, while n-Si MWs functioned mainly as a conductive substrate. However, we cannot exclude the possibility that some photons were absorbed also by Si at 455 nm.45 Importantly, essentially no dark currents were observed for the n-Si MWs/mp-TiO2/α-Fe2O3 photoanode up to at least a potential of 2.5 VRHE (Fig. SI 3c, ESI†). Next, we illuminated our photoanode at 625 nm (100 mW cm−2) to selectively excite Si. At 1.23 VRHEJph was found to be 3.7 mA cm−2 (Fig. SI 6a and b, ESI†), which is 93% of the photocurrent obtained with 1 sun illumination (4.0 mA cm−2).
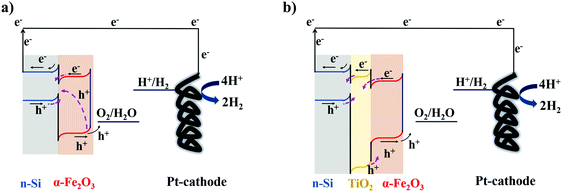
The capacity of the n-Si MWs/mp-TiO2/α-Fe2O3 photoanode to act as a dual solar absorber system became more apparent when the same experiment was repeated at 2.5 VRHE. Here, the Jph reached 20 mA cm−2 under 1 sun illumination. The photocurrent was 20% lower if only the n-Si MWs were excited, and nearly 40% lower if predominantly the α-Fe2O3 nanorods were excited (Fig. SI 6, ESI†). We thus conclude that our n-Si MWs/mp-TiO2/α-Fe2O3 photoanode acts as dual absorber system, which is in line with a recent study on another hematite/Si nanowire PEC system.45 This is schematically illustrated in Fig. 3.
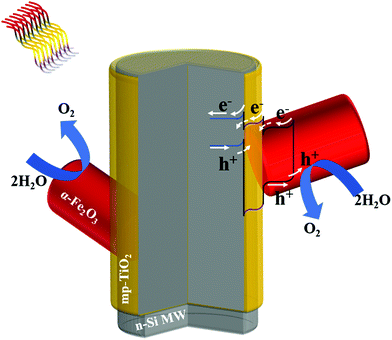 | ||
| Fig. 3 A schematic representation of energy diagrams and charge-carrier mobility in the n-Si MW/mp-TiO2/α-Fe2O3 photoelectrode. | ||
For comparison, Xiaopeng Qi et al.46 reported an n-Si/α-Fe2O3 core–shell structure with 25 μm long Si MWs with a Jph of 5.28 mA cm−2 at 1.23 VRHE and an onset potential of 0.5 VRHE recorded with a scan rate of 50 mV s−1. For the scan rate of 20 mV s−1 used in this study, Xiaopeng Qi et al.46 reported a Jph of ∼3.8 mA cm−2 at 1.23 VRHE with an onset potential of 0.5 VRHE, which is almost twice the onset potential reported in this study. Recently, Zhongyuan Zhou et al.47 achieved a maximal Jph of 3.12 mA cm−2 at 1.23 VRHE and an onset potential of 0.15 VRHE for a Sn-doped hematite film grown on Si MWs, whereas their pristine n-Si/α-Fe2O3 photoanode had an onset potential of 0.85 VRHE.
Insight into the mechanism by which TiO2 improves the performance of photoanodes can be gained by studying the transient photo-response of α-Fe2O3 functionalized n-Si MWs without (Fig. 4a and b) and with (Fig. 4c and d) the mp-TiO2 interlayer. The transient photocurrent density at 1.5 VRHE (2-electrode set-up) was nearly three-fold higher for n-Si MW/mp-TiO2/α-Fe2O3 (6 mV cm−2) than for n-Si MW/α-Fe2O3 (2.2 mV cm−2), which is fully consistent with the data in Fig. 2. The sharp spikes visible for both samples in the anodic (positive-spike) and cathodic (negative-spike) regions arise due to the light-induced generation and the dissipation of charge carriers at the electrode/electrolyte interface. When zooming into the regions of the anodic spikes, it is seen that nearly twice as many charges dissipated in the device lacking the mp-TiO2 layer, and that this process occurred over a significantly longer time period (Fig. 4b and d). Thus, the presence of a mp-TiO2 interlayer appears to block the mobility of the holes photogenerated in α-Fe2O3 towards the n-Si MWs, since the valence band of mp-TiO2 lies at lower energy than in α-Fe2O3 (Fig. 5b). Assuming the same exciton generation with and without the TiO2 layer (as the thin TiO2 layer is optically transparent), the addition of the wide bandgap TiO2 interlayer thus reduced unproductive charge recombination and thereby allowed utilizing the photogenerated holes more efficiently for water oxidation.
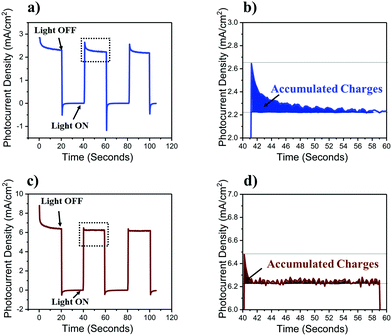 | ||
| Fig. 4 Transient photocurrent response recorded at 1.5 VRHE. (a) n-Si MW/α-Fe2O3 and (b) n-Si MW/mp-TiO2/α-Fe2O3. (c and d) Magnified views of representative anodic spikes. | ||
In summary, besides the well-known function of the TiO2 protection layer in passivating the surface defects on Si MWs,8,32,33 we tentatively assign the superior performance of n-Si MW/mp-TiO2/α-Fe2O3 as compared to n-Si MW/α-Fe2O3 to a better interfacial connection between mp-TiO2 and α-Fe2O3, the creation of stable oxygen vacancies (electron traps) in the mp-TiO2 interlayer, and to the low band edge positioning of TiO2 that likely suppresses the hole mobility from α-Fe2O3 towards n-Si.32
Oxygen vacancies
Various studies discussed the role of surface oxygen vacancies in Fe/TiO2 nanoparticles.48–51 They establish that oxygen vacancies are generated by high-temperature annealing (∼400 °C) of TiO2 in oxygen-deficient atmospheres. This process can be described using the Kröger–Vink notations:51–53 | (1) |
Eqn (1) is a reversible reaction, meaning that the surface oxygen vacancies  disappear gradually in ambient conditions (in the presence of molecular oxygen). Early studies from Grätzel and co-workers,49,54 and Hoffmann and co-workers50 suggested stabilization of surface oxygen vacancies in the nanoparticulate TiO2 lattice by the introduction of acceptor type dopants such as Fe3+ as ionic charge-compensating species represented by eqn (2):
 | (2) |
Previous studies have already correlated the presence of oxygen vacancies in TiO2 with enhanced photocatalytic properties of TiO2.48,52 Additionally, increasing the active surface area of TiO2 particles by reducing their size has also been employed for enhancing photocatalytic properties of TiO2.55,56 As mp-TiO2 thin films are known for having an about 800 times larger effective surface area than planar TiO2 thin films,48,57,58 the incorporation of Fe ions onto mp-TiO2 thin films may prove to be an effective strategy for stabilizing oxygen vacancies, and to thereby enhance photocatalytic water oxidation efficiency. In our study, the Fe ions were incorporated onto the surface layers of mp-TiO2 during the hydrothermal growth of α-Fe2O3 nanorods onto the surface of mp-TiO2 and the subsequent annealing at 380 °C in an oxygen-deficient atmosphere.
High energy resolution fluorescence detected X-ray absorption near edge structure (HERFD-XANES) and valence to core X-ray emission spectroscopy (vtc-XES)
To provide further evidence for the oxygen vacancies and to study what electronic structure changes they cause in TiO2, we performed HERFD-XANES and X-ray emission spectroscopy at beamline ID26 of the European Synchrotron Radiation Facility (ESRF). HERFD-XANES spectra were obtained at the Ti K-edge for bare mp-TiO2, mp-TiO2 coated on planar n-Si (planar n-Si/mp-TiO2), n-Si MWs/mp-TiO2, and n-Si MWs/mp-TiO2/α-Fe2O3 (Fig. SI 7, ESI†). HERFD-XANES spectra at the Fe K-edge were recorded for bare α-Fe2O3, n-Si MWs/α-Fe2O3, and n-Si MWs/mp-TiO2/α-Fe2O3 (Fig. SI 8 and SI 9, ESI†). All spectra were normalized to their total area. The spectra were not corrected for over- (or self-) absorption effects that may significantly distort the spectra of the bare oxides. The spectra are thus also presented as first derivatives in order to facilitate comparison.The Fe K-edge HERFD-XANES taken of all samples are essentially superimposable (Fig. SI 8 and SI 9, ESI†), indicating that neither the deposition of Fe2O3 onto mp-TiO2 nor Si MWs had a significant effect on the electronic structure of α-Fe2O3. Similarly, the first derivatives of the Ti K-edge HERFD-XANES spectra of bare mp-TiO2 and n-Si MWs/mp-TiO2 are nearly identical (Fig. SI 7, ESI†). This indicates that the contact with the n-Si MWs did not induce significant electronic structural changes in the TiO2 lattice.
By contrast, the Ti K-edge HERFD-XANES data reveal that the hydrothermal growth of α-Fe2O3 nanorods onto mp-TiO2 strongly influences the electronic structure of mp-TiO2, as shown in Fig. 6a and b. For Ti, the XANES pre-edge peaks in the energy range of ∼4966 to ∼4976 eV reflect core electron transition to Ti-3d4p hybridized states, which are highly sensitive to the local geometry of the Ti centers.59,60 The pre-edge peak A1 corresponds to the transition of a Ti 1s electron into a t1g band-like state. The small low energy shoulder on the A2 peak (A2*) is due to 1s-eg excitation, while the 1s electron excitation to crystal field split d-states on the neighboring Ti atoms results in the main A2 and the A3 peaks.61,62 The A3 peak corresponds to an eg band-like state, which is due to pure non-local excitation. The non-local excitations are mediated by oxygen nearest neighbors.63,64 The surrounding oxygen thus influences all the pre-edge peaks in the Ti K-edge.59,65–68
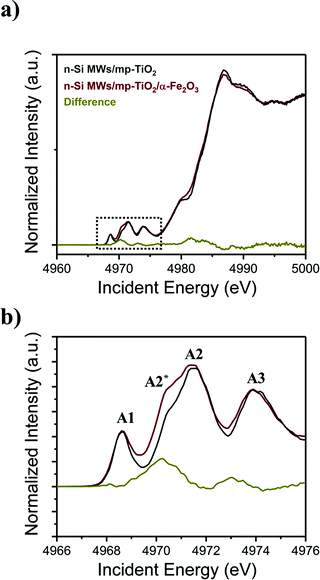 | ||
| Fig. 6 (a) HERFD-XANES spectra acquired for functionalized n-Si MWs photoanodes at the Ti K-edge, (b) magnified view of the pre-edge region. Additional control spectra are displayed in Fig. SI 7 (ESI†). | ||
Comparison of the pre-edge features of the n-Si MWs/mp-TiO2 photoelectrodes with (red line) and without (grey line) α-Fe2O3 nanorods (Fig. 6b) reveals that the A2* peak becomes significantly more prominent when α-Fe2O3 nanorods are present. At the same time, the other features are unchanged, indicating no significant structural changes. As the A2* peak arises from a 1s–eg excitation, the presence of a stronger A2* peak in n-Si MWs/mp-TiO2/α-Fe2O3 is attributed to the creation of oxygen vacancies at the mp-TiO2 and α-Fe2O3 interface that leads to a distortion of the local coordination which increases the mixing of metal p and d orbitals.48 The absence of a shift of the main K-edge shows that the Ti–O distances, on average, do not change,68,69 indicating that the bulk of the Ti remains in oxidation state Ti4+.
In line with our results, Ghaffari et al.70 reported that the increase in the Ti K-edge A2* pre-edge peak intensities correlates with improved photocatalytic properties of their SrTi(1−χ)FeχO(3−δ) system, which are caused by oxygen vacancies or defects. As the vacancies were created during the hydrothermal growth of α-Fe2O3 nanorods and subsequent annealing at 380 °C, we propose that they are restricted to the interface between mp-TiO2 and α-Fe2O3. The band-bending physics presented in Fig. 5b shows that these oxygen vacancies could trap part of the electrons photogenerated in the α-Fe2O3 nanorods. This would then effectively inhibit the recombination of charge-carriers in the α-Fe2O3 nanorods, leaving the photogenerated holes available for enhanced water oxidation.
To comprehend further the changes in the electronic structure of the mp-TiO2 interlayer caused by growing Fe2O3 nanorods onto it, X-ray emission spectroscopy (XES) was performed at the Ti and Fe K-edges. The Kβ fluorescence lines for Ti are shown in Fig. 7, while the Fe Kβ-XES is displayed in Fig. SI 10 (ESI†). Fig. 7b shows that the 3p to 1s core–shell-to-core–shell (Kβ1,3) line of Ti is invariant to the presents of Fe2O3 nanorods, and the same is observed for the corresponding Fe signal (Fig. SI 10b, ESI†). As Kβ1,3 lines are known to be sensitive to the local spin and thus the oxidation state, the absence of a detectable change indicates that the local distortion of the oxygen environment does not involve redox changes of Ti4+ or Fe3+, in line with the observation in the XANES data. The valence-to-core emission lines at higher energies (Fig. 7c and d) arise from metal–ligand mixed orbitals and directly probe the ligand environment. Here we do observe changes for Ti, in agreement with the K absorption pre-edge spectral changes. It is important to note that the maximum amount of TiO2 that can interact with a ∼20 nm diameter α-Fe2O3 nanorods is ∼20%; for detailed calculation, see the ESI.† The percentage of Ti atoms changing the local coordination as derived from the spectral changes in Fig. 6 is in approximate agreement with the estimated interaction of mp-TiO2 with α-Fe2O3 nanorods. Thus, we suggest that the oxygen vacancies created in mp-TiO2 are restricted to the interfacial boundary between mp-TiO2 and the α-Fe2O3 nanorods. This suggests that Fe3+ ions can stabilize oxygen vacancies at this interface, which in turn prevent electron–hole recombination and thereby enhance the water oxidation activity.49,50,71–74
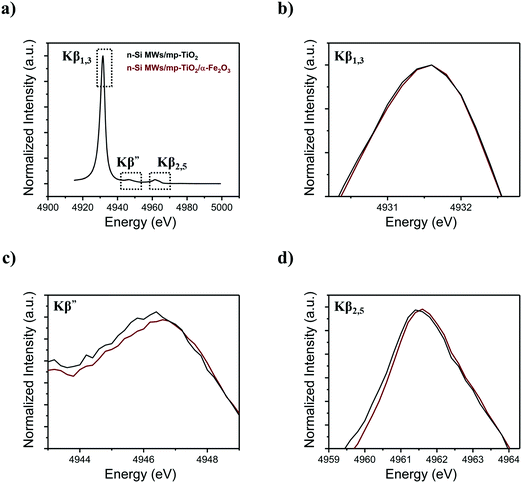 | ||
| Fig. 7 Ti Kβ XES spectra acquired for functionalized n-Si MWs photoanodes with (a) Kβ main and vtc-XES, (b) Kβ1,3, (c) Kβ′ and (d) Kβ2,5. | ||
We found that electronic structural changes take place in the mp-TiO2 when sandwiched between n-Si MW and α-Fe2O3, while the Fe-edge hardly changed. This indicates that the improved photocatalysis arises from improved carrier transport within the device rather than a lowered barrier for water splitting at α-Fe2O3. This is consistent with our recent finding that p-Si MWs/TiO2 photocathodes undergo significant changes when decorated with NiOx or CoOx.8 Thus, our study paves the way towards understanding the crucial role of the TiO2 interlayer by providing X-ray spectroscopic evidence for the stabilization of oxygen vacancies by the application of Fe2O3.
Conclusions
In conclusion, we report here a dual solar photon absorber system comprised of n-Si MWs and α-Fe2O3. The n-Si MWs and the α-Fe2O3 were connected by a thin mp-TiO2 layer, which acted as a template for the growth of α-Fe2O3 nanorods. In the absence of the mp-TiO2 interlayer, the overall photo-electrochemical performance of α-Fe2O3 functionalized n-Si MWs was significantly reduced. Favorable band bending in the n-Si MWs/mp-TiO2/α-Fe2O3 photoanodes was found to be the critical factor for decreasing the charge recombination and thus increasing the availability of holes for water oxidation. A thorough investigation using X-ray spectroscopy suggests that the hydrothermal growth of α-Fe2O3 nanorods on n-Si MWs/mp-TiO2 with subsequent annealing at 380 °C led to favorable changes in the electronic structure of mp-TiO2. By contrast, the electronic structure of α-Fe2O3 was hardly affected by mp-TiO2. In summary, the mp-TiO2 interlayer presented in this study acts (i) as a protective layer for n-Si MWs, (ii) as a template for the uniform and high surface area hydrothermal growth of the α-Fe2O3 nanorods, and (iii) in combination with Fe2O3, it suppresses charge recombination at the mp-TiO2/α-Fe2O3 interface via stabilized oxygen vacancies (electron traps).We expect that, in the future, this multi-functionality of the TiO2 interlayer can be utilized in developing further improved photoelectrodes. As exemplified here, the detailed X-ray spectroscopic characterization of the photoelectrodes will be a crucial analytical tool in this process.
Author contribution
A. K., A. A., T. W., P. G., J. M. conceptualize and conceived the project. A. K. prepared all the samples and collected SEM images. A. K. and A. A. performed all the photo-electrochemical experiments. A. K. and A. S. analyzed the GC data. A. K. and P. G. performed a synchrotron experiment and collected HERFD-XANES and XES data. A. K., J. U., P. G. processed and analyzed HERFD-XANES, XES, and XPS data. A. K., and J. U. estimated and compared the fractional contact between mp-TiO2 and α-Fe2O3 nanorods. P. G., and J. M. supervised the research work and discussed the results. A. K., P. G., and J. M. co-wrote the manuscript with important inputs from the co-authors.Conflicts of interest
The authors declare no competing financial interest.Acknowledgements
The authors thank Andrey Shchukarev for collecting the XPS data. The SEM images were obtained at the Umeå Core Facility for Electron Microscopy (UCEM). The authors thank European Synchrotron Radiation Facility for granting beamtime and the ID26 beamline staff for assistance during the experiments. The Knut and Alice Wallenbergs Foundation (Artificial Leaf Project; KAW 2011.0055) provided financial support. T. W. acknowledges support from Vetenskapsrådet (2017-04862), and Energimyndigheten (45419-1).References
- M. Grätzel, Nature, 2001, 414, 338 CrossRef.
- N. S. Lewis, Science, 2007, 315, 798–801 CrossRef CAS.
- A. Kawde, A. Vats, R. Shende and J. Puszynski, Nanotechnology, 2011, 1, 747–750 CAS.
- A. Fujishima and K. Honda, Nature, 1972, 238, 37 CrossRef CAS.
- A. Annamalai, A. Subramanian, U. Kang, H. Park, S. H. Choi and J. S. Jang, J. Phys. Chem. C, 2015, 119, 3810–3817 CrossRef CAS.
- A. Annamalai, P. S. Shinde, A. Subramanian, J. Y. Kim, J. H. Kim, S. H. Choi, J. S. Lee and J. S. Jang, J. Mater. Chem. A, 2015, 3, 5007–5013 RSC.
- R. van de Krol and Y. Liang, Chimia, 2013, 67, 168–171 CrossRef CAS.
- A. Kawde, A. Annamalai, L. Amidani, M. Boniolo, W. L. Kwong, A. Sellstedt, P. Glatzel, T. Wågberg and J. Messinger, Sustainable Energy Fuels, 2018, 2, 2215–2223 RSC.
- E. L. Warren, H. A. Atwater and N. S. Lewis, J. Phys. Chem. C, 2013, 118, 747–759 CrossRef.
- A. Kawde, A. Annamalai, A. Sellstedt, P. Glatzel, T. Wågberg and J. Messinger, Dalton Trans., 2019, 48, 1166–1170 RSC.
- W. L. Kwong, C. C. Lee and J. Messinger, J. Phys. Chem. C, 2016, 120, 10941–10950 CrossRef CAS.
- J. Luo, L. Steier, M.-K. Son, M. Schreier, M. T. Mayer and M. Grätzel, Nano Lett., 2016, 16, 1848–1857 CrossRef CAS.
- W. Niu, T. Moehl, W. Cui, R. Wick-Joliat, L. Zhu and S. D. Tilley, Adv. Energy Mater., 2018, 8, 1702323 CrossRef.
- F. Ambrosio, J. Wiktor and A. Pasquarello, ACS Energy Lett., 2018, 3, 829–834 CrossRef CAS.
- H. S. Han, S. Shin, D. H. Kim, I. J. Park, J. S. Kim, P.-S. Huang, J.-K. Lee, I. S. Cho and X. Zheng, Energy Environ. Sci., 2018, 11, 1299–1306 RSC.
- Y. Liang and J. Messinger, Phys. Chem. Chem. Phys., 2014, 16, 12014–12020 RSC.
- L. Zhang, X. Ye, M. Boloor, A. Poletayev, N. A. Melosh and W. C. Chueh, Energy Environ. Sci., 2016, 9, 2044–2052 RSC.
- I. Narkeviciute, P. Chakthranont, A. J. Mackus, C. Hahn, B. A. Pinaud, S. F. Bent and T. F. Jaramillo, Nano Lett., 2016, 16, 7565–7572 CrossRef CAS.
- B. A. Pinaud, P. C. Vesborg and T. F. Jaramillo, J. Phys. Chem. C, 2012, 116, 15918–15924 CrossRef CAS.
- Z. Chen, T. F. Jaramillo, T. G. Deutsch, A. Kleiman-Shwarsctein, A. J. Forman, N. Gaillard, R. Garland, K. Takanabe, C. Heske and M. Sunkara, J. Mater. Res., 2010, 25, 3–16 CrossRef CAS.
- ASTM International ASTM Standard G173-03 DOI: 10.150/G0173-03R08 (ASTM, 2008); available via, http://www.astm.org.
- Y. Yu, Z. Zhang, X. Yin, A. Kvit, Q. Liao, Z. Kang, X. Yan, Y. Zhang and X. Wang, Nat. Energy, 2017, 2, 17045 CrossRef CAS.
- B. Seger, A. B. Laursen, P. C. Vesborg, T. Pedersen, O. Hansen, S. Dahl and I. Chorkendorff, Angew. Chem., Int. Ed., 2012, 51, 9128–9131 CrossRef CAS.
- M. J. Kenney, M. Gong, Y. Li, J. Z. Wu, J. Feng, M. Lanza and H. Dai, Science, 2013, 342, 836–840 CrossRef CAS.
- K. Sun, N. Park, Z. Sun, J. Zhou, J. Wang, X. Pang, S. Shen, S. Y. Noh, Y. Jing and S. Jin, Energy Environ. Sci., 2012, 5, 7872–7877 RSC.
- S. Hu, M. R. Shaner, J. A. Beardslee, M. Lichterman, B. S. Brunschwig and N. S. Lewis, Science, 2014, 344, 1005–1009 CrossRef CAS.
- M. R. Shaner, S. Hu, K. Sun and N. S. Lewis, Energy Environ. Sci., 2015, 8, 203–207 RSC.
- M. F. Lichterman, A. I. Carim, M. T. McDowell, S. Hu, H. B. Gray, B. S. Brunschwig and N. S. Lewis, Energy Environ. Sci., 2014, 7, 3334–3337 RSC.
- T. Moehl, J. Suh, L. Sévery, R. Wick-Joliat and S. D. Tilley, ACS Appl. Mater. Interfaces, 2017, 9, 43614–43622 CrossRef CAS.
- W. Cui, W. Niu, R. Wick-Joliat, T. Moehl and S. D. Tilley, Chem. Sci., 2018, 9, 6062–6067 RSC.
- B. Seger, T. Pedersen, A. B. Laursen, P. C. Vesborg, O. Hansen and I. Chorkendorff, J. Am. Chem. Soc., 2013, 135, 1057–1064 CrossRef CAS.
- D. Bae, B. Seger, P. C. Vesborg, O. Hansen and I. Chorkendorff, Chem. Sci. Rev., 2017, 46, 1933–1954 RSC.
- S. A. Lee, S. Choi, C. Kim, J. W. Yang, S. Y. Kim and H. W. Jang, ACS Mater. Lett., 2019, 2, 107–126 CrossRef.
- R. Fan, Z. Mi and M. Shen, Opt. Express, 2019, 27, A51–A80 CrossRef CAS.
- S. Hu, M. H. Richter, M. F. Lichterman, J. Beardslee, T. Mayer, B. S. Brunschwig and N. S. Lewis, J. Phys. Chem. C, 2016, 120, 3117–3129 CrossRef CAS.
- P. Wang, X. Wen, R. Amal and Y. H. Ng, RSC Adv., 2015, 5, 5231–5236 RSC.
- K. Peng, Y. Wu, H. Fang, X. Zhong, Y. Xu and J. Zhu, Angew. Chem., Int. Ed., 2005, 44, 2737–2742 CrossRef CAS.
- K. Liu, H. Fu, K. Shi, F. Xiao, L. Jing and B. Xin, J. Phys. Chem. B, 2005, 109, 18719–18722 CrossRef CAS.
- S. Y. Choi, M. Mamak, N. Coombs, N. Chopra and G. A. Ozin, Adv. Funct. Mater., 2004, 14, 335–344 CrossRef CAS.
- L. Vayssieres, N. Beermann, S.-E. Lindquist and A. Hagfeldt, Chem. Mater., 2001, 13, 233–235 CrossRef CAS.
- A. Tofanello, S. Shen, F. L. de Souza and L. Vayssieres, APL Mater., 2020, 8, 040905 CrossRef CAS.
- G. Ma, T. Hisatomi and K. Domen, From molecules to materials, Springer, 2015, pp. 1–56 Search PubMed.
- H. Jung, S. Y. Chae, C. Shin, B. K. Min, O.-S. Joo and Y. J. Hwang, ACS Appl. Mater. Interfaces, 2015, 7, 5788–5796 CrossRef CAS.
- J. Deng, Q. Zhuo and X. Lv, J. Electroanal. Chem., 2019, 835, 287–292 CrossRef CAS.
- M. T. Mayer, C. Du and D. Wang, J. Am. Chem. Soc., 2012, 134, 12406–12409 CrossRef CAS.
- X. Qi, G. She, X. Huang, T. Zhang, H. Wang, L. Mu and W. Shi, Nanoscale, 2014, 6, 3182–3189 RSC.
- Z. Zhou, S. Wu, L. Qin, L. Li, L. Li and X. Li, J. Mater. Chem. A, 2018, 6, 15593–15602 RSC.
- Q. Wu, Q. Zheng and R. van de Krol, J. Phys. Chem. C, 2012, 116, 7219–7226 CrossRef CAS.
- J. Moser, M. Grätzel and R. Gallay, Helv. Chim. Acta, 1987, 70, 1596–1604 CrossRef CAS.
- W. Choi, A. Termin and M. R. Hoffmann, J. Phys. Chem., 2002, 98, 13669–13679 CrossRef.
- S. Jayashree and M. Ashokkumar, Catalysts, 2018, 8, 601 CrossRef.
- M. K. Nowotny, L. R. Sheppard, T. Bak and J. Nowotny, J. Phys. Chem. C, 2008, 112, 5275–5300 CrossRef CAS.
- X. Pan, M.-Q. Yang, X. Fu, N. Zhang and Y.-J. Xu, Nanoscale, 2013, 5, 3601–3614 RSC.
- R. F. Howe and M. Gratzel, J. Phys. Chem., 1985, 89, 4495–4499 CrossRef CAS.
- K. He, C. Zhao, G. Zhao and G. Han, J. Sol-Gel Sci. Technol., 2015, 75, 557–563 CrossRef CAS.
- P. Hartmann, D.-K. Lee, B. M. Smarsly and J. Janek, ACS Nano, 2010, 4, 3147–3154 CrossRef CAS.
- M. Zukalova, A. Zukal, L. Kavan, M. K. Nazeeruddin, P. Liska and M. Grätzel, Nano Lett., 2005, 5, 1789–1792 CrossRef CAS.
- L. Kavan, J. Rathouský, M. Grätzel, V. Shklover and A. Zukal, Microporous Mesoporous Mater., 2001, 44, 653–659 CrossRef.
- P. C. Angelome, L. Andrini, M. E. Calvo, F. G. Requejo, S. A. Bilmes and G. J. Soler-Illia, J. Phys. Chem. C, 2007, 111, 10886–10893 CrossRef CAS.
- D. Cabaret, Y. Joly, H. Renevier and C. Natoli, J. Synchrotron Radiat., 1999, 6, 258–260 CrossRef CAS.
- Y. Joly, D. Cabaret, H. Renevier and C. R. Natoli, Phys. Rev. Lett., 1999, 82, 2398 CrossRef CAS.
- J. Szlachetko, K. Michalow-Mauke, M. Nachtegaal and J. Sá, J. Chem. Sci., 2014, 126, 511–515 CrossRef CAS.
- P. Glatzel, L. Jacquamet, U. Bergmann, F. M. de Groot and S. P. Cramer, Inorg. Chem., 2002, 41, 3121–3127 CrossRef CAS.
- P. Glatzel, A. Mirone, S. G. Eeckhout, M. Sikora and G. Giuli, Phys. Rev. B: Condens. Matter Mater. Phys., 2008, 77, 115133 CrossRef.
- V. Luca, S. Djajanti and R. F. Howe, J. Phys. Chem. B, 1998, 102, 10650–10657 CrossRef CAS.
- R. Brydson, H. Sauer, W. Engel, J. Thomass, E. Zeitler, N. Kosugi and H. Kuroda, J. Phys.: Condens. Matter, 1989, 1, 797 CrossRef CAS.
- L. Amidani, A. Naldoni, M. Malvestuto, M. Marelli, P. Glatzel, V. Dal Santo and F. Boscherini, Angew. Chem., Int. Ed., 2015, 54, 5413–5416 CrossRef CAS.
- P. Glatzel and U. Bergmann, Coord. Chem. Rev., 2005, 249, 65–95 CrossRef CAS.
- P. Glatzel, T.-C. Weng, K. Kvashnina, J. Swarbrick, M. Sikora, E. Gallo, N. Smolentsev and R. A. Mori, J. Electron Spectrosc. Relat. Phenom., 2013, 188, 17–25 CrossRef CAS.
- M. Ghaffari, T. Liu, H. Huang, O. K. Tan and M. Shannon, Mater. Chem. Phys., 2012, 136, 347–357 CrossRef CAS.
- G. Glaspell and A. Manivannan, J. Cluster Sci., 2005, 16, 501–513 CrossRef CAS.
- M. Zhou, J. Yu, B. Cheng and H. Yu, Mater. Chem. Phys., 2005, 93, 159–163 CrossRef CAS.
- J. Soria, J. Conesa, V. Augugliaro, L. Palmisano, M. Schiavello and A. Sclafani, J. Phys. Chem., 1991, 95, 274–282 CrossRef CAS.
- J. C. Yu, W. Ho, J. Lin, H. Yip and P. K. Wong, Environ. Sci. Technol., 2003, 37, 2296–2301 CrossRef CAS.
Footnote |
| † Electronic supplementary information (ESI) available. See DOI: 10.1039/d0cp04280c |
| This journal is © the Owner Societies 2020 |

