
 Open Access Article
 This Open Access Article is licensed under a
 Creative Commons Attribution 3.0 Unported Licence
Interfacial and bulk properties of concentrated solutions of ammonium nitrate†
Sara
Mosallanejad
 a,
Ibukun
Oluwoye
a,
Mohammednoor
Altarawneh
b,
Jeff
Gore
c and
Bogdan Z.
Dlugogorski
*d
a,
Ibukun
Oluwoye
a,
Mohammednoor
Altarawneh
b,
Jeff
Gore
c and
Bogdan Z.
Dlugogorski
*d
aDiscipline of Chemistry and Physics, College of Science, Health, Engineering and Education, Murdoch University, 90 South Street, Murdoch, WA 6150, Australia
bDepartment of Chemical and Petroleum Engineering, United Arab Emirates University, Sheikh Khalifa bin Zayed Street, Al-Ain, 15551, United Arab Emirates
cDyno Nobel Asia Pacific Pty Ltd, Mt Thorley, NSW 2330, Australia
dEnergy and Resources Institute, Charles Darwin University, Casuarina Campus, Orange 12.3.49, Ellengowan Drive Northern Territory 0909, Australia. E-mail: bogdan.dlugogorski@cdu.edu.au
First published on 20th November 2020
Abstract
We conducted molecular dynamics (MD) simulations to calculate the density and surface tension of concentrated ammonium nitrate (AN) solutions up to the solubility limit of ammonium nitrate in water, by combining the SPC/E, SPCE/F and TIP4P/2005 water models with OPLS model for ammonium and nitrate ions. This is the first time that the properties of concentrated solutions of nitrates, especially AN, have been studied by molecular dynamics. We effectively account for the polarisation effects by the electronic continuum correction (ECC), practically realised via rescaling of the ionic charges. We found that, the full-charge force field MD simulations overestimate the experimental results, as the ions experience repulsion from the interface and prefer to remain in the subsurface layer and the bulk solution. In contrast, reducing the ionic charges results in the behaviour that fits well with the experimental data. The nitrate anions display a greater propensity for the interface than the ammonium cations. We accurately predict both the density and the rise in the surface tension of concentrated solutions of AN, recommending TIP4P/2005 for water and the scaled-charge OPLS model (OPLS/ECC) for the ions in the solutions. We observe that, the adsorption of anions to the interface accompanies their depletion in the subsurface layer, which is preferentially occupied by cations, resulting in the formation of the electric double layer. We demonstrate the ion deficiency for up to 3 Å below the surface and establish the requirement to include the polarisability effects in the OPLS model for AN. While these results confirmed the findings of the previous studies for dilute solutions, they are new in the solubility limit. Concentrated solutions exhibit a strong effect of the abundance of solute on the coordination numbers of ions and on the degree of ion pairing. Surprisingly, ion pairing decreases significantly at the interface compared with the bulk. The present study identifies OPLS/ECC, along with TIP4P/2005, to yield accurate predictions of physical properties of concentrated AN, with precision required for industrial applications, such as a formulation of emulsion and fuel-oil explosives that now predominate the civilian use of AN. An application of this model will allow one to predict the surface properties of supersaturated solutions of AN which fall outside the capability of the present laboratory experiments but are important industrially.
1. Introduction
Ammonium nitrate (NH4NO3, AN) finds applications as an oxidiser in rocket propellant engines, gas generator systems (e.g., automotive inflator systems, automobile airbag systems and heavy-lift launchers) and pyrotechniques, due to its low cost, chemical stability, moderate flame temperature and halogen-free exhaust gases. The chemical serves as the main ingredient of fertilisers, herbicides, insecticides, AN emulsion and fuel-oil (ANFO) explosives, the most frequently employed commercial explosives. The physical stability and detonation of AN emulsions and ANFO highly depend on emulsion formulation and the wettability of AN prills, with the latter affected by several factors including surface tension, density, viscosity and polarisability of the solvent.1 Therefore, determination of density and surface tension of aqueous solutions of AN, especially concentrated solutions, constitutes the essential requirement for engineering applications of this material. Besides the thermodynamic models suggested by several investigators,2–5 molecular simulations have contributed significantly to the present understanding of the surface tension of ionic solutions at the microscopic level, in particular, by describing the distribution of ions near liquid–vapour interfaces.6–12 Normally, the presence of ions at the interface, which attract each other through electrostatic forces, and interact with the solvent through the solute–solvent attraction, increases the surface tension, as there is more resistance to stretch the surface. This makes the formation of new interfaces more energy intensive during the emulsification. To the best of our knowledge, solutions of ammonium nitrate have been largely neglected as a research subject of molecular simulations, despite the practical importance of concentrated solutions of AN. Moreover, a study of the surface activity of germane ions offers insights into heterogeneous aerosol activities and their potential impact on the atmospheric and tropospheric chemistry.13Researchers studied the effect of size, charge and the polarisability of the ions on their location in the solution.14–20 Vrbka et al.21 reported that large polarisable ions such as heavier halides exhibit an affinity for water–vapour interface while small non-polarisable ions (e.g. alkali cations and fluoride) repel from the interface. Based on the results from the polarisable potential models, Dang16 reported that anions display increased affinity, in comparison with cations, for adsorbing to the interface. The larger the anions, the stronger binding to the liquid–vapour interface. Jungwirth and Tobias17 emphasised the effect of size and polarisability of ions at the interface and in the interior of a water slab, and showed that, for all concentrations of aqueous solutions of sodium chloride, the chloride anions occupy a significant portion of slab interfaces, while sodium cations locate themselves toward the interior of the slab.
A controversy exists in the literature about the inclination of nitrate anions at the liquid–vapour interface. Some researchers22,23 suggested no affinity of nitrate cations for the interface, whereas others24–26 argued for their weak propensity to partition to the interface. Tian et al.27 studied the liquid–vapour interfaces of several salt solutions using phase-sensitive sum-frequency vibrational spectroscopy. They revealed the presence of an electric double layer formed by cations and anions induced by the relative attraction to the surface of different ions, in decreasing order of I−, NO3−, NH4+, Cl−, K+, Na+, and SO42−. Hua et al.28 also studied the distributions of interfacial ions of some nitrate salt solutions (LiNO3, NaNO3, NH4NO3, and Mg(NO3)2) using the same experimental technique. They confirmed the appearance of an electric double-layer structure with the greater abundance of NO3− ions at the surface as compared with their counterions. From their measurements, the induced net electric field in AN solution was smaller compared to the other nitrate solutions which suggested the least charge separation distributions between the NH4+ and NO3− among the studied cations. Therefore, NH4+ tended to position themselves closer to NO3−.
It is well documented that, in systems of aqueous electrolyte solutions, the electronic polarisation effects play a critical role. For instance, molecular simulations, using non-polarisable force fields, introduce inaccuracies in describing the short-range ion–water and ion–ion interactions, resulting in artificial ion clustering.29–31 Although polarisable models describe more truthfully the interactions in these systems, they suffer from expensive computations and difficult parametrisation. For these reasons, previous researchers attempted to incorporate polarisation effects into non-polarisable force fields. Recently, Leontyev et al.32–34 suggested an electronic continuum model that incorporates the electronic polarisation into a non-polarisable force field. In this method, all ion charges are scaled with the inverse square-root of the high-frequency dielectric permittivity of water (i.e., with (εel)−1/2 ≈ 0.75).
The ab initio molecular dynamics (AIMD) simulations provide an alternative approach to account for the electronic polarisation effects.35 In an AIMD calculation, Kohn–Sham density functional theory (DFT) framework serves to compute the electronic structures of the ground states of the molecules. The polarisation of electron clouds can result from the response of the electron densities to the surrounding electric field. Forces obtained directly from the calculations of electronic structures, performed “on the fly”, propagate the dynamics of the nuclei. AIMD simulations have been extensively applied to gain understanding of molecular environments in water36 and in aqueous solutions.37–39
A similar “charge scaling” commonly arises in simulations of ionic liquids using non-polarisable force fields.40–42 We refer to this methodology throughout this study as the electronic continuum correction (ECC) model. Applying the ECC model for simulations of liquid water interacting with proteins and solutes in the bulk yielded the same results as those obtained from models that explicitly introduce the electronic polarisation.32,43,44 The importance of the ECC model manifests itself for both monovalent and multivalent ions, as they are capable of polarising their surrounding water molecules.30,45–49 Mason et al.46 and Pegado et al.50 showed that, predictions of the properties of aqueous salt solutions in the bulk improved significantly using the electronic continuum correction model compared with non-polarisable simulations. However, the applicability of the ECC model has not been fully examined for liquid–liquid and liquid–vapour interfaces.
Vazdar et al.51 investigated the affinity of halide ions to the water–oil and water–vapour interfaces using the Smith–Dang/ECC model to account for the polarisation effects. They reported interfacial affinities of anions to the water–oil interfaces consistent with the results of experiments and previous explicitly polarisable models. However, their model overestimated the anionic surface affinities for water–vapour interfaces due to electronic discontinuity upon moving from liquid to the vapour phase.
Neyt et al.18 reported a non-monotonic increase of the surface tension with rising concentration of sodium chloride using the OPLS/ECC and Reif/ECC models, where OPLS stands for optimised potential for liquid simulations. They emphasised a requirement for the consistent re-parametrisation of the non-polarisable force fields for the salt and the scaling of the charges. Contrary to Neyt's et al. unsuccessful application of the ECC model, Otten et al.52 showed an enhanced surface affinity of iodide to a water–vapour interface once they reduced iodide charge, similarly to the prediction from the ECC model, as compared with the results of non-polarisable simulations using full charges on the ions. Breton and Joly,53 in their paper on solutions of sodium chloride, have recently reported the importance of using long-range solvers for Lennard-Jones interactions in non-uniform systems, such as those featuring an interface, to predict the dispersion forces and applying the ionic charge rescaling factor to demonstrate good agreement between computed and measured surface tension and interfacial structure.
We were intrigued by the reports in the literature on the effect of rescaling of ionic charges on the ability of non-polarisable force field to yield improved values of macroscopic properties, and were curious about the applicability of this approach to predict the bulk and surface properties of a wide range of solutions of ammonium nitrate, starting with dilute solutions up to highly concentrated systems; the latter close to the solubility limit of ammonium nitrate in water (65 wt% equivalent to 23 mol kg−1 at 298.15 K54). For this reason, we computed the bulk density, structure of the solvation shells and the surface tension, with and without rescaling of the charges. In the sections that follow, we complement these results with the discussion that compares the distribution and the number of molecules in the first solvation shell of the ions in the bulk and at the liquid–vapour interfaces to discover excellent agreement between our modelling results and the experimental measurements of Tian et al.27 and Hua et al.28 The same physical behaviours appear both in the model and in the experiments, such as the formation of the ionic double layer induced by the relative propensity of ions to the surface (NO3− > NH4+), underpinning the observed accord.
This paper is organised as follows: in Section 2, we provide details of our simulations and the analytical methods. Sections 3.1 and 3.2 discuss the results for the bulk solutions of AN, with Section 3.3 focusing on predicting the surface tension of mixtures of AN with water. This leads us to pondering, in Sections 3.4 and 3.5, the distribution of ions and the hydration structure in the interior and at surface of the solution slabs. We summarise the major findings of this investigation in Section 4. As far as we are aware, this is the first MD investigation of concentrated solutions of nitrates, and the first MD study that examines the molecular properties of ammonium nitrate, a technologically important group of chemicals. In the chapters that follow, we will identify a MD model capable of predicting both bulk and surface properties of concentrated solutions of AN with accuracy required for practical applications, such as predictions of the surface tension in making AN emulsion explosives.
2. Computational methods
2.1. Potential models
In the simulations, we consider three non-polarisable models for water, SPC/E,55 SPCE/F56 and TIP4P/2005.57 The SPC/E, also known as the extended simple point charge model, represents rigid water molecules with three-point masses, whereas the SPCE/F serves as a flexible version of the SPC/E water model and TIP4P/2005 considers a rigid four points; two hydrogens, oxygen and one Lennard-Jones interaction site located at the oxygen atom. Table S1 of ESI† lists molecular parameters of the three models. Both SPCE/F and TIP4P/2005 reproduce very well the surface tension of water at 298.15 K.58–63 In this article, we compare the results from the SPCE/F and TIP4P/2005 models with the simple and commonly used SPC/E model to gain a clear overview on the performance and transferability of ion parameters to the three water models.64,65We represent the ammonium and nitrate ions (NH4+ and NO3−) by a molecular force field compatible with the non-polarisable optimised potentials for liquid simulations all-atom (OPLS-AA), abbreviated in this contribution as OPLS, except for Table 1.66 This model comprises harmonic bonds and angles, torsion energy defined by cosine series, and non-bonded interactions given by electrostatic partial charges (Coulomb) and 12-6 Lennard-Jones atomic sites. Eqn (1) presents the functional form of the total potential energy (U)
| U = UINTRA + UINTER | (1) |
| UINTRA = Ubonds + Uangles + Utorsion | (2) |
 | (3) |
 | (4) |
 | (5) |
| σ (Å) | ε (kJ mol−1) | q (|e|) | 0.75 × q (|e|) | |
|---|---|---|---|---|
OPLS-AA model for NH4+![[thin space (1/6-em)]](https://www.rsc.org/images/entities/char_2009.gif) 67 67 |
||||
| N | 3.25 | 0.711 | −0.4000 | −0.3000 |
| H | 0 | 0 | 0.3500 | 0.2625 |
| N–H distance (Å) | 1.01 | |||
| H–N–H angle (°) | 109.50 | |||
| k b (kJ (mol Å2)−1) | 1815.85 | |||
| k θ (kJ (mol rad2)−1) | 182.42 | |||
| OPLS-AA model for NO3−68,69 |
||||
| N | 3.15 | 0.711 | 0.7940 | 0.5955 |
| O | 2.86 | 0.878 | −0.5980 | −0.4485 |
| N–O distance (Å) | 1.256 | |||
| O–N–O angle (°) | 120.00 | |||
| k b (kJ (mol Å2)−1) | 2653.50 | |||
| k θ (kJ (mol rad2)−1) | 505.50 | |||
| O–O–N–O torsion (kJ mol−1) | V 1 | V 2 | V 3 | V 4 |
| 0 | 8.368 | 0 | 0 | |
The intermolecular interactions are composed of repulsion, dispersion and electrostatic contributions that are represented by the Lennard-Jones (LJ) and coulombic (ELEC) potentials, respectively:
| UINTER = ULJ + UELEC | (6) |
 | (7) |
In the current study, we have considered the effects of electronic polarisation of the ions using non-polarisable force fields for both ammonium and nitrate ions, through the ECC model.32 In this approach, to account for the electronic polarisability, the fixed charges of the ions are scaled by the inverse square-root of the electronic part of the dielectric constant, (εel)−1/2, of the surrounding medium. Since the parameter εel has a value of 1.78 for water, the atomic charges are rescaled by the factor of (1.78)−1/2. The last column of Table 1 lists the rescaled charges of ions deployed in this study.
2.2. Molecular dynamics
The LAMMPS package70 served to perform the classical molecular dynamic simulations. We approximated the long-range forces due to Lennard-Jones and coulombic interactions with accuracy of 1 × 10⁻⁶, with respect to untruncated values, by a particle–particle particle–mesh (pppm) method, implemented by Ismail et al.63,71 in the package. This approach removes the need for the analytical tail correction in the computation of surface tension. Periodic boundary conditions were applied in the three directions, and the Verlet algorithm integrated the equation of motion with a time step of 1 and 0.5 fs for the rigid and non-rigid water models, respectively. In the rigid models of water, the SHAKE technique72 constrained the bond lengths and bond angles.The Packmol software73 facilitated the random insertion of the ions and water molecules into a box with initial dimensions of LxLyLz (Lx = Ly = 40 Å). All simulations started from low density configurations with the total number of water molecules fixed to 2133, and the number of NH4+ and NO3− ions increased from 25 to 720 to reflect the target range of molality (0.65 to 18.7 mol kg−1). Table 2 summarises the number of molecules and the concentrations of the simulated solutions. Before equilibrating the MD simulations, we applied the conjugate gradient method to minimise the energy and to remove strain from the initial configurations. To calculate the density of the solutions, the systems were subjected to 4 ns equilibration runs for the isobaric–isothermal ensemble (NPT) at p = 0.1 MPa and T = 298.15 K, with Nosé–Hoover thermostat and barostat with relaxation time constants, respectively, of 0.1 and 1 ps for the rigid models of water and 0.05 and 0.5 ps for the flexible water. As the length and width of the simulation box remain constant, the changes in the box volume, due to the variation in density at different concentrations, vary the height of the box along the z direction from 41.27 to 75.45 Å. Once the bulk density of each system reached a constant, indicating that the equilibrium has been attained, we computed the bulk density by averaging the values obtained in the last 2 ns. We also identified the bulk solvation structure of ion assemblies in the system.
| No. | Number of water molecules | Number of AN molecules | m (mol kg−1) | Wt% AN in solution | Size of simulation boxa | Number density of AN (Å−3) |
|---|---|---|---|---|---|---|
| a The sizes of the box along the z direction are reported for the last time step of the simulation runs. | ||||||
| 1 | 2133 | 25 | 0.65 | 4.9 | 40 × 40 × 41.27 | 0.00038 |
| 2 | 2133 | 96 | 2.5 | 16.7 | 40 × 40 × 44.55 | 0.00135 |
| 3 | 2133 | 119 | 3.1 | 19.9 | 40 × 40 × 45.32 | 0.00164 |
| 4 | 2133 | 157 | 4.1 | 24.6 | 40 × 40 × 47.43 | 0.00207 |
| 5 | 2133 | 228 | 5.9 | 32.2 | 40 × 40 × 50.74 | 0.00281 |
| 6 | 2133 | 332 | 8.6 | 40.9 | 40 × 40 × 56.06 | 0.00370 |
| 7 | 2133 | 525 | 13.6 | 52.2 | 40 × 40 × 65.52 | 0.00501 |
| 8 | 2133 | 719 | 18.7 | 60.0 | 40 × 40 × 75.45 | 0.00596 |
For calculating the surface tension, we again randomly inserted specified number of molecules in a simulation box and then extended the simulation box to three times its initial size along the z direction, to create two interfaces between the AN solution and the vacuum.74Fig. 1 depicts a typical molecular configuration of 0.65 mol kg−1 AN solution with 2133 water molecules and 25 pairs of NH4+ and NO3− ions. We placed two reflecting walls just outside of the interfaces to retain the molecules in the slab and the simulations were started with an NPT ensemble at p = 0.1 MPa and T = 298.15 K to equilibrate the system for 1 ns. Then, we switched to the NVT ensemble at 298.15 K with no reflecting walls with the Nosé–Hoover thermostat relaxation time of 0.1 ps and 0.05 ps for the rigid and flexible water models, respectively. The NVT runs involved 12 Å cut-off distance and 1 and 0.5 fs time steps for the models of rigid and flexible water, respectively. The systems were equilibrated for 1 ns followed by a production run in the range of 15 ns. We finally compared the results for density and surface tension with the available experimental values for solutions of AN.
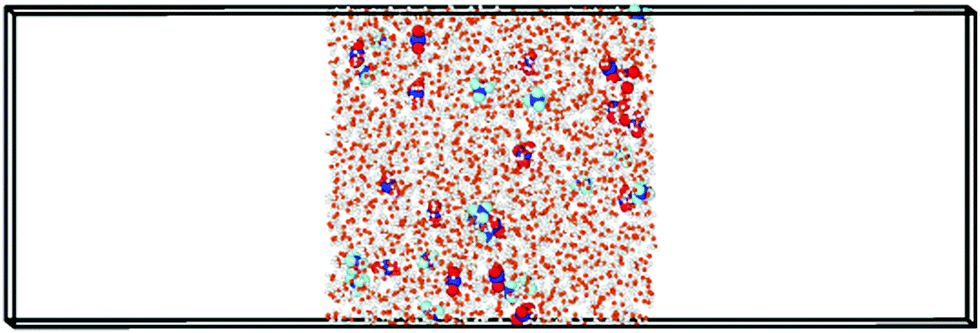 | ||
| Fig. 1 Typical slab (Lx × Ly × Lz = 40 × 40 × 120 Å3) that contains solution of AN at concentration of 0.65 mol kg−1. Nitrate ions are shown in dark blue and red; ammonium ions are presented in dark and light blue. For clarity, water molecules are shown smaller compared with the ions. | ||
To validate the computational methodology, we calculated the density and the surface tension of pure (i.e., neat) water within the temperature range of 298.15 to 600 K, and then juxtaposed the results of our calculations against the experimental measurements. Fig. S1 (ESI†) presents the temperature dependence of the surface tension and liquid–vapour coexistence curve of water obtained from the SPC/E, SPCE/F and TIP4P/2005 models and from experimental measurements.75,76 The values of the surface tension for pure water obtained from the SPC/E, SPCE/F and TIP4P/2005 models amount to 61.2 ± 0.1, 68.7 ± 0.2 and 67.2 ± 0.1 mN m−1 at 298.15 K, respectively, in comparison to the data of 61.8 ± 0.1, 70.2 ± 2.1, and 68.4 ± 0.2, reported in literature.58–61,63 Table S2 of ESI† summarises all calculated values within a temperature range of 298.15–600 K in addition to the surface thickness in which the density of water increases from 10% to 90% of its bulk value, with this layer denoted as the 10–90 surface thickness (δt). We described the calculation of δt further in this section.
Moreover, the simulation of pure water from the TIP4P/2005 model, employing a system of 4000 water molecules (Lx = Ly = 49 Å) or a larger system of 6500 molecules (Lx = Ly = 58 Å), resulted in essentially no differences in the calculated values of surface tensions, 67.42 ± 0.06 and 67.25 ± 0.07, respectively. Therefore, we expect that, our calculations for the system containing 2133 water molecules with dimensions of 40 Å along the x and y directions will not suffer from the artefacts observed for small systems. Furthermore, a comparison of the pure water–water radial distribution function (see below) with those for solutions of AN reveal the perturbation of the hydration shells by the salt.
We calculated the surface tension of the solutions by evaluating the normal (pN = pzz), and tangential (pT = 0.5(pxx + pyy)) components of the Kirkwood–Buff (KB) stress tensor. The surface tension follows from the expression below
 | (8) |
We computed the radial distribution function (RDF, g(r)) in the bulk and at the interface of solutions from the recorded trajectories of the molecules, saved during the production runs. In addition, we calculated the coordination number, as function of distance from the central atom, from the RDF formula
 | (9) |
2.3. Interfacial region detection
There are various methods of different suitability and quality for detection of the interfacial region.77–80 In this study, we considered the Gibbs dividing surface (GDS) as a convenient point of reference to analyse the perturbations in molecular distributions at the liquid–vapour surface in detail. The location of the GDS can be obtained by fitting the total density profile, ρ(z), to a hyperbolic tangent function commonly used81 of the following form | (10) |
 | ||
| Fig. 2 A schematic diagram illustrating the location of the interface (surface), subsurface and bulk regions, shown in pink, green and blue colour, respectively. We set the position of the Gibbs dividing surface to z = 0. The distance between the two purple vertical solid lines corresponds to the thickness of the interface. The density profiles of NO3− and NH4+ reflect values obtained from different models, as described later in the text. The graph with high frequency fluctuations reflects the charge density, reporting to the ordinate axis on the right-hand side. | ||
3. Results and discussion
3.1. Bulk density of AN solutions
Fig. 3 compares the experimental bulk densities of AN solutions over a molality range of 0.65–18.7 mol kg−1 at 0.1 MPa and 298.18 K82,83 with the simulation results for the force fields considered in this study. The charges on the NH4+ and NO3− ions in the original model (OPLS) are scaled by 0.75 in line with the scaling factor of the electronic continuum correction model (ECC model). We observed that, the predictions of the OPLS model, without the electronic continuum correction for ions, for the three water models, agree quite well with the experimental values for concentrations up to 2 mol kg−1. However, for higher molality, these models overestimate the density of the solutions. | ||
| Fig. 3 Density of AN solutions calculated using various combination of water and ion models as a function of the molality of the solution. The experimental densities82,83 are represented by the cross (Expt 1) and black closed circle (Expt 2) symbols and the simulated densities, for the OPLS and the OPLS/ECC force fields, by open and closed symbols, respectively as explained in the legend. The standard deviation of the simulated densities corresponds to less than 0.4%. | ||
The results of the OPLS/ECC model, with the selected force fields of water, demonstrate excellent agreement with the experimental data.82,83 The maximum percentage error decreases from 8.3%, 9.5% and 9.9% to 1.7%, 2.7% and 1.5% for the SPC/E + OPLS, SPCE/F + OPLS and TIP4P/2005 + OPLS models, without and with the ECC, respectively. These models comprise different ion–water interactions but the same ion–ion interactions. The ion–ion interactions become increasingly crucial as the concentration of the salt increases.84 Neyt et al.18 also reported a reduction in the calculated density values with the ECC version of the Reif and Hünenberger85 and OPLS86 models, compared with the original models for the aqueous solutions of sodium chloride.
3.2. Structure of the bulk solvation shell
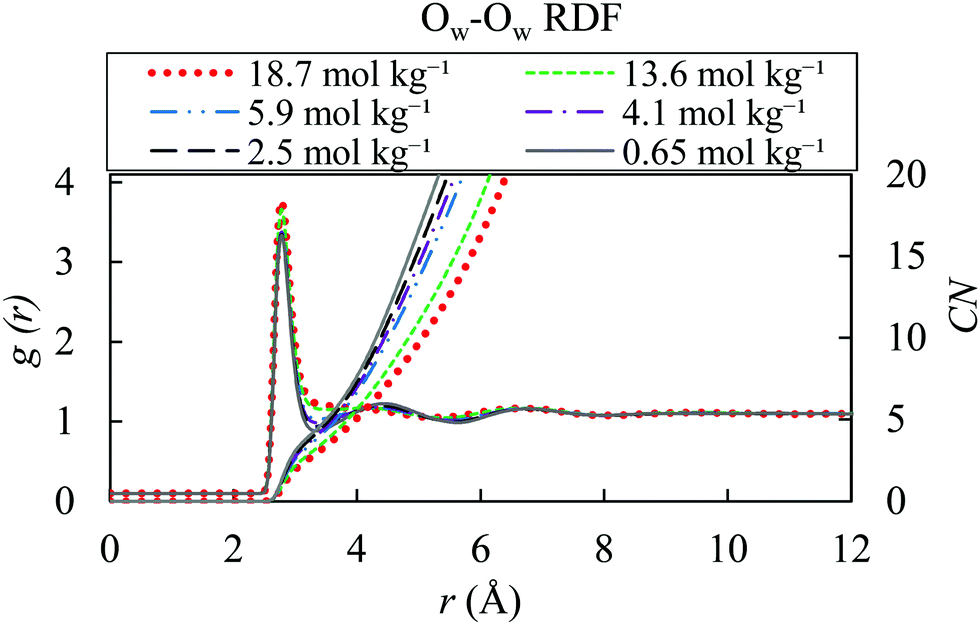
We studied the local structure of the bulk AN solutions by investigating the ion–water, ion–ion and water–water radial distribution functions (RDFs) for the OPLS/ECC force fields, and present the RDFs results for different molality of bulk AN solution and the TIP4P/2005 model at 298.15 K. Functions corresponding to the SPC/E and SPCE/F models have not been plotted since they do not differ significantly from those for the TIP4P/2005. Fig. 4 illustrates the calculated ion–water and pure water–water radial distribution functions obtained in a separate simulation (TIP4P/2005), with the nitrogen atoms in the nitrate and ammonium shown as Nn, Na, respectively, and oxygen and hydrogen atoms of water presented as Ow, Hw. | ||
| Fig. 4 Ion–water and pure water–water radial distribution functions and coordination-number functions for different molality of AN solutions (0.65, 2.5, 4.1, 5.9, 13.6 and 18.7 mol kg−1) with the OPLS/ECC model for the ions and the TIP4P/2005 water model at 298.15 K; Nn and Na denote nitrogen atoms in nitrate and ammonium ions, whereas Ow and Hw represent oxygen and hydrogen atoms of water. While g(r) varies little as function of solution molality, the significant differences in the coordination numbers (CN) stem from the number density, ρ, included in eqn (9), with the relevant values for AN (i.e., for NO3− and NH4+) provided in the last column of Table 2. | ||
The first maxima of gNn–Ow and gNn–Hw in the TIP4P/2005 + OPLS/ECC model in our simulation stand at 3.48 and 2.77 Å, in that order. These results indicate the distance of the hydration shell around the nitrate ions. The doublet character of the first maximum of gNn–Ow, with a shoulder at 3.81 Å, corresponding to the second water shell, is also distinguishable in the studies of Dang et al.87 and Thomas et al.,8 who applied a polarisable force field for nitrate ion in aqueous solution. The two peaks in the gNn–Hw suggest that, one of the hydrogens in a water molecule points toward the nitrate ion and the other away from it (see Fig. 4). As the concentration of AN increases, the number of water molecules in the first hydration shell decreases, and the first minimum in gNn–Ow becomes more pronounced, suggesting the formation of crystal-like domains in the solutions. In addition, gNa–Ow and gNa–Hw display the first peaks at 2.87 and 3.35 Å, correspondingly. Evidently, oxygen atoms in water molecules in the hydration shells of ammonium ions point toward the ammonium and both hydrogen atoms in a water molecule position themselves away from NH4+. Comparing with gOw–Ow of pure water presented in the left panels of Fig. 4, the hydration shell of gNn–Ow is less prominent and is not as well-defined as the one of the gNa–Ow. In addition, nitrate ions introduce a longer-range perturbation and the second hydration shell emerges as a shoulder of the first shell.
Table 3 contrasts the distance of the first bulk hydration peaks for different pairs obtained from the TIP4P/2005 + OPLS/ECC model employed in this study with their corresponding values published in the literature. Good agreement exists between our values and those reported by other researchers. Therefore, we remark that the models for nitrate and ammonium ions implemented in this study accurately reproduce the structure of the hydration shells in the bulk that surround the solvated ions. The increased formation of ion pairs in concentrated solutions of AN represents the reason of slight drop in the intensity of the first hydration shell for the higher ion concentrations. In other words, the hydration numbers decrease with the increased formation of ion pairs at higher concentrations of AN. Table S3 (ESI†) lists the calculated coordination number (CN) for the first minimum in g(r) of Fig. 4.
The force field used here accurately reproduces the structural properties of hydrated ammonium and nitrate ions. Similarly, to the previous studies, the original non-polarisable force field (OPLS) yields a more structured hydration shell than the OPLS/ECC model.94 This is evident in sharpening of the peaks in RDF for non-ECC force fields. Fig. S3 of the ESI† presents a comparison between the calculated RDF from the OPLS and OPLS/ECC force-field models.
In Fig. 5, we present the ion–ion pair correlation functions (Nn–Na, Nn–Nn and Na–Na). The Nn–Na RDF shows a pronounced peak at around 3.50 Å. The maximum of the peak decreases from 3.53 Å to 3.48 Å as molality increases from 0.65 to 18.7 mol kg−1. These correlation functions indicate the presence of ion pairs in the solutions. Ions are paired if the distance between them is less than the cut-off radius of 4.87 Å. The cut-off radius is often selected as the first minimum of the pair correlation function between ions that carry the opposite charges.95 The probability of ion-pair formation increases with increasing the concentration of the salt. The presence of two peaks in RDFs of Nn–Nn and Na–Na reveals the formation of the crystal-like domains, with increasing salt concentration in the solution. In addition, the coordination number increases with concentration due to formation of more ion pairs.
 | ||
| Fig. 5 Ion–ion radial distribution functions for different molality of AN solution (18.7, 13.6, 5.9, 4.1, 2.5 and 0.65 mol kg−1) with OPLS/ECC for the ions and the TIP4P/2005 water model at 298.15 K; Nn and Na denote nitrogen atoms in nitrate and ammonium ions. Please see the caption to Fig. 4 explaining the variation in CN as a function of the solution molality. | ||
The RDFs for the Nn–Nn and Na–Na pairs, at 18.7 mol kg−1, are in excellent agreement with the RDF of melted pure AN at temperatures of 550 K in that Velardez et al.96 study that investigated the structural changes of solid-state of AN using molecular dynamics. These authors reported the maximum of the first peak in both ion pairs (Nn–Nn and Na–Na RDFs) to appear around 4.6 Å. The RDFs calculated in our study exhibit the maxima of the first and second peaks for Nn–Nn pairs at 4.73 and 6.87 Å and for Na–Na at 4.64 and 7.03 Å, respectively. Wahab and Mahiuddin82 concluded that, the free hydrated ions of NH4+ and NO3− exist up to the molality of 9.1 mol kg−1, whereas the solvent-separated ion pairs form in the concentration range of 9.1–12.0 mol kg−1. Finally, beyond 12.0 mol kg−1, a transition to the solvent-shared ion-pairs occurs as a result of a decrease in the number of available water molecules.
Fig. 6 demonstrates lack of a well-defined second hydration shell at high ion concentrations of 13.6 and 18.7 mol kg−1. This occurs because of the presence of ions in the interstitial positions, concurring with a similar behaviour observed for highly concentrated solutions of NaCl and KCl.97 The function related to the low salt concentration are comparable with the one of the gOw–Ow of pure water.
 | ||
| Fig. 6 Water–water radial distribution functions for different molality of AN solution (18.7, 13.6, 5.9, 4.1, 2.5 and 0.65 mol kg−1) with OPLS/ECC model and the TIP4P/2005 water at 298.15 K. | ||
3.3. Surface tension of AN solutions
We computed the surface tension of AN solutions over the studied range of molality (0.65–18.7 mol kg−1). Fig. 7 compares the surface tension of AN solutions with the OPLS and the OPLS/ECC models for the ions, and the three models of water (SPC/E, SPCE/F, and TIP4P/2005). The experimental results of the surface tension of AN solutions at 298.15 K were obtained from the interpolation between the surface tension values of AN solutions measured by Abramzon and Gauberk98 for the two temperatures of 293.15 and 313.15 K and plotted in Fig. 7 with cross symbols. Abramzon and Gauberk reported a linear dependence of surface tension of AN solutions on the concentration up to 60.78 wt% AN solutions, equal to a molality of 19.36 mol kg−1 (see Fig. S4 of the ESI†). We also plotted the experimental values of the surface tension of AN solution from Khurshid's et al. study99 for the molality of up to 2 mol kg−1.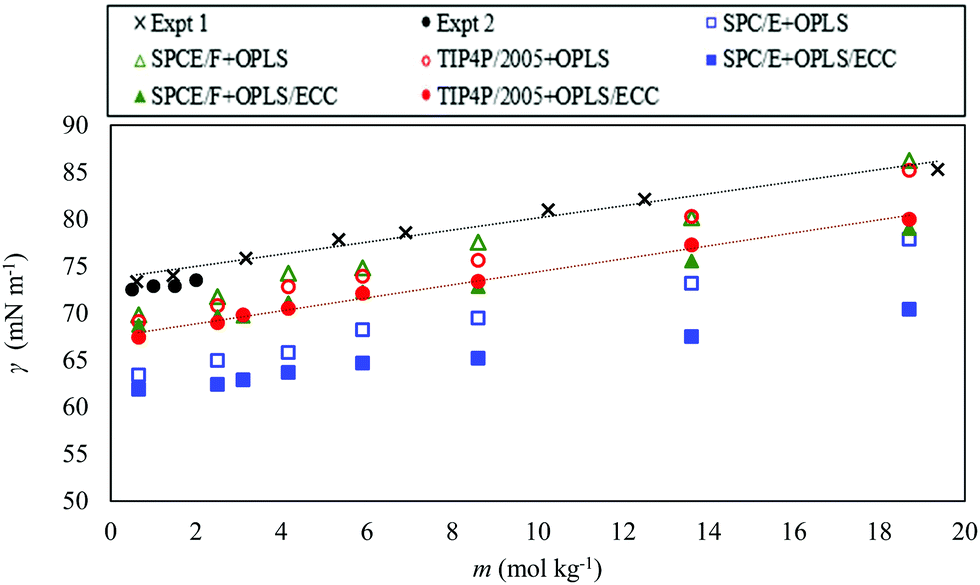 | ||
| Fig. 7 Surface tension as a function of the molal concentration of AN for the OPLS (open symbols) and OPLS/ECC (closed symbols) ion models and for the three water models, as explained in the legend. We also plot the experimental values extracted from literature;98,99 shown as crosses (Expt 1, from ref. 98) and closed black circles (Expt 2, from ref. 99). | ||
As indicated in Fig. 7, the OPLS and the OPLS/ECC models yield a linear dependence of the surface tension on the molality; however, the OPLS model increases the surface tension of AN solutions with steeper slope compared with the OPLS/ECC. Linear regressions produce slopes of 0.784 ± 0.031, 0.831 ± 0.062 and 0.866 ± 0.010 for the SPC/E, SPCE/F and TIP4P/2005 water models, respectively, and the OPLS model for the ions. Considering the OPLS/ECC model, the slopes decrease to 0.464 ± 0.035, 0.555 ± 0.028 and 0.674 ± 0.045 for the SPCE, SPCE/F and TIP4P/2005, in that order. The trend obtained using TIP4P/2005 + OPLS/ECC concurs well with the trends observed in the experiments (slopes of 0.674 ± 0.00999 and 0.650 ± 0.03898). Evidently, TIP4P/2005 + OPLS/ECC provides the most accurate prediction of the rise in the surface tension over a broad range of concentrations of AN and the other two water models (SPCE and SPCE/F) are less able to predict the increasing trend of the surface tension of solutions of AN compared with the trend of experimental measurements; see the slopes plotted in Fig. 7.
The error between the computed and the experimental measurements arise due to underestimation of the surface tension of pure water by TIP4P/2005 compared with the experimental measurements. The surface tension calculated with the SPC/E, SPCE/F and TIP4P/2005 models underpredicted the measurements by 15%, 4.5% and 6.6%, in that order, in comparison to the experimental figure of 71.99 ± 0.05 mN m−1 at 298.15 K.76 In a summary evaluation, only the TIP4P/2005 model in conjunction with the OPLS/ECC description of the AN ions provide precise predictions of the surface tension of AN solutions with the accuracy needed for industrial applications over the entire range of concentrations. The simulated results account well for the experimental trend in the measurement of surface tension with increasing concentration of the solute. Table 4 lists the computed surface tensions of AN solutions for different salt molality at 298.15 K for the OPLS/ECC models and different models of water compared with experimental values. Industrial applications, such as AN emulsion explosives, involve supersaturated solutions of AN, which properties are often outside the reach of the present experimental techniques. As far as we can ascertain, this finding is new and of great practical relevance.
| m (mol kg−1) | SPC/E + OPLS/ECC | SPCE/F + OPLS/ECC | TIP4P/2005 + OPLS/ECC | Expt60 |
|---|---|---|---|---|
| 0.65 | 61.91 | 68.70 | 68.11 | 73.76 (± 0.01) |
| 2.5 | 62.43 | 69.64 | 68.98 | 75.00 (± 0.02) |
| 3.1 | 62.89 | 69.66 | 69.81 | 75.41 (± 0.02) |
| 4.1 | 63.70 | 71.11 | 70.52 | 76.08 (± 0.01) |
| 5.9 | 64.72 | 72.25 | 72.14 | 77.30 (± 0.04) |
| 8.6 | 65.23 | 75.81 | 73.41 | 79.12 (± 0.03) |
| 13.6 | 67.56 | 75.53 | 77.25 | 82.49 (± 0.02) |
| 18.7 | 70.44 | 79.10 | 80.21 | 85.93 (± 0.03) |
3.4. Density profile
To quantify the physical behaviour of ions and their occurrence at the surface or in the interior of the slab, we plotted in Fig. 8 the water, ion and total density along the z direction for three concentrations under study (2.5, 8.6 and 18.7 mol kg−1) relative to the GDS; all results represent the use of the TIP4P/2005 water model. The GDS is positioned at z = 0 along the direction perpendicular to the open surface. The solid and dash lines reflect the simulation results for the OPLS and OPLS/ECC models, respectively, with charge density from the latter reporting to the secondary y-axis. To calculate the quantities displayed in Fig. 8, we have divided the simulation box into the vertical slabs of 0.2 Å in thickness.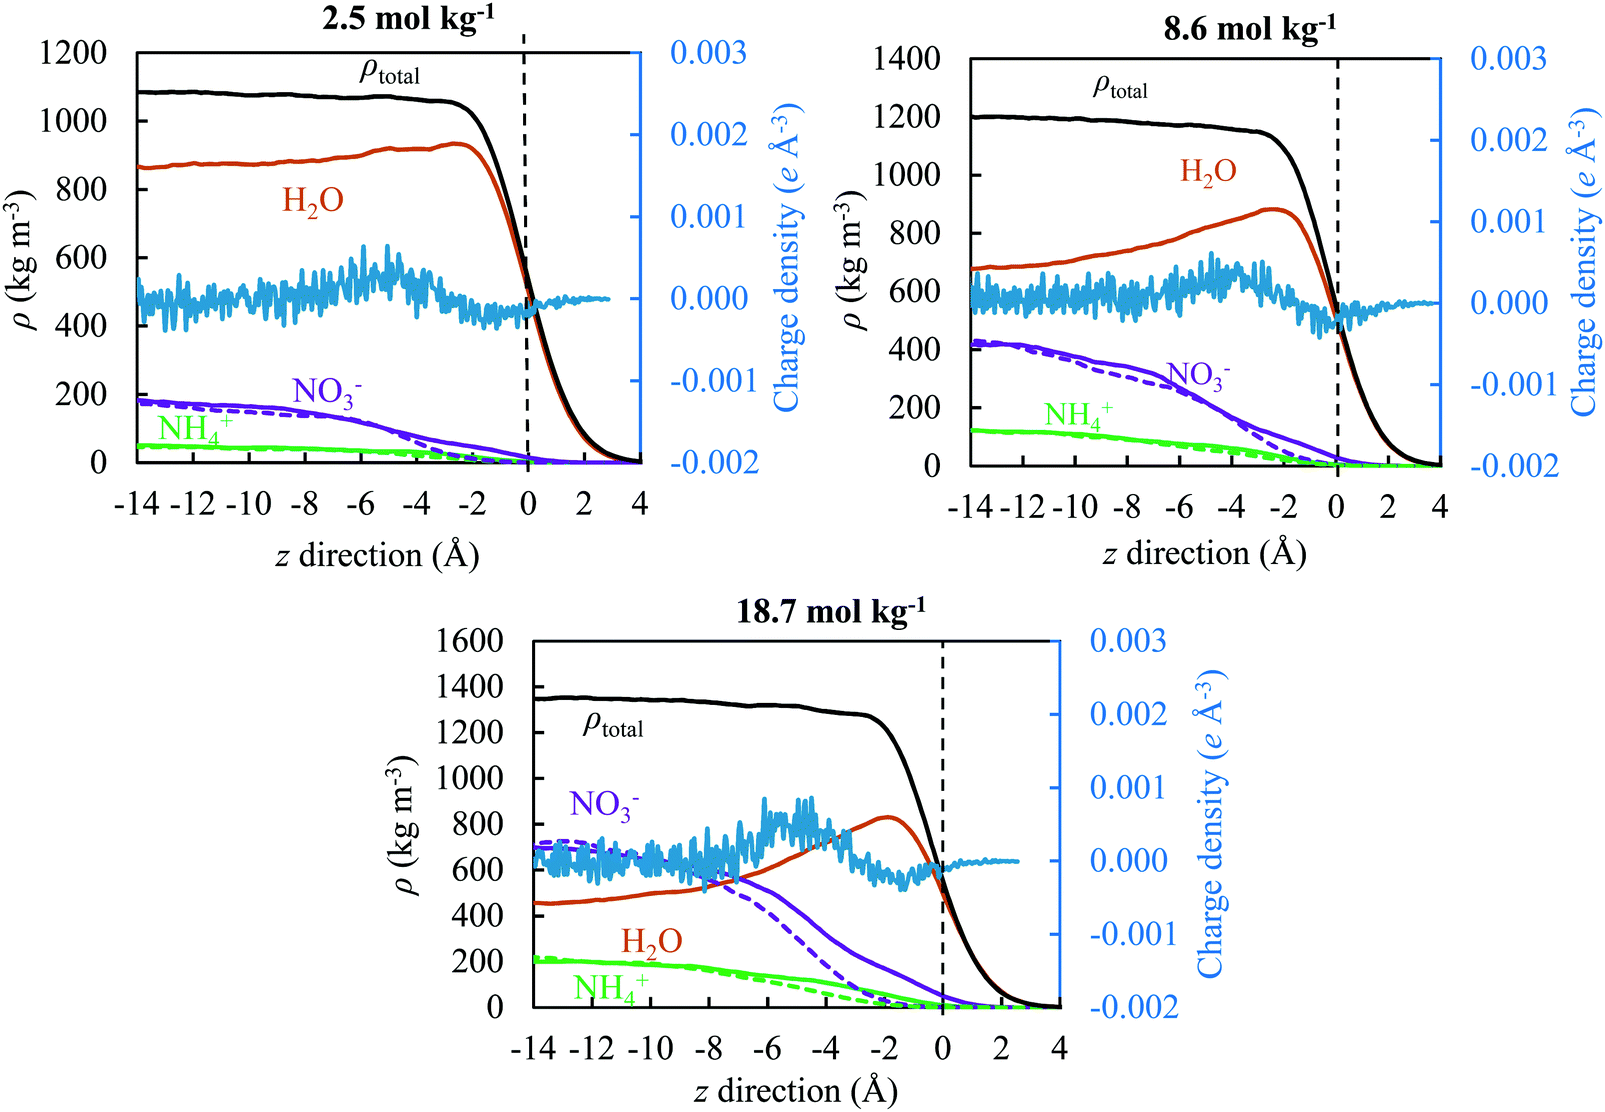 | ||
| Fig. 8 Primary axis: total (black), TIP4P/2005 water (brown), ammonium (green) and nitrate (purple) density profile of AN solutions (2.5, 8.6 and 18.7 mol kg−1) along the z direction relative to the Gibbs dividing plane using the OPLS (dash lines) and the OPLS/ECC (solid lines) models for the ions; Secondary axis: charge density profile of the OPLS/ECC ions. The vertical dash line presents the Gibbs dividing plane and values greater than zero correspond to the vapour phase. | ||
We found that, the approach of ions to the interface and their separation differ significantly as predicted from the OPLS and the OPLS/ECC models. For the former, ions repel from the interface and form a depletion layer with a thickness of approximately 5 Å and the separation between layers of ions is rather small. While for the latter, the ions display pronounced segregation, with nitrate anions preferring to place themselves at the interface. This leads to the depletion of NO3− in the subsurface, resulting in the formation of a layer preferentially occupied by the cations.
Fig. 8 illustrates the structure of this ionic double layer, arising for all concentrations of AN considered in this study, with weak affinities of anions and cations for the surface and subsurface, respectively. The predictions from the OPLS/ECC model reproduce well the results of the polarisable force fields for the ions.100 We demonstrate the ion deficiency up to 3 Å below the surface of the solution and that polarisability effects must be considered in the OPLS model to predict correctly the aqueous properties of AN. While our calculations accord well with the results of the previous experimental27,28 and theoretical24–26 studies for dilute solutions of nitrates that yielded weak propensity of the NO3− ions to segregate themselves at the surface, the finding are new for the concentrated solutions of AN, which are of particular industrial interest.
Although the previous investigation concluded that the surface excess of one type of ions may not necessarily induce the emergence of an electric double layer, we did not observe this behaviour in our investigation. Table 5 lists the values of density of the liquid and vapour phases, together with thickness of the interface, as computed from the hyperbolic tangent function (see eqn (10)) for all studied concentrations of AN. We observed a monotonic increase in the width of the interface with the rising concentration of solutions of AN.
| m (mol kg−1) | ρ liq (kg m−3) | ρ vap (kg m−3) | δ t 10–90 (Å) |
|---|---|---|---|
| 0.65 | 1019.98 ± 0.97 | 0.0 | 3.47 ± 0.01 |
| 2.5 | 1080.92 ± 1.50 | 0.0 | 3.74 ± 0.02 |
| 3.1 | 1097.27 ± 1.12 | 0.0 | 3.79 ± 0.02 |
| 4.1 | 1118.42 ± 1.52 | 0.0 | 3.89 ± 0.03 |
| 5.9 | 1156.45 ± 2.40 | 0.0 | 4.01 ± 0.03 |
| 8.6 | 1203.37 ± 2.21 | 0.0 | 4.34 ± 0.04 |
| 13.6 | 1305.56 ± 2.28 | 0.0 | 4.74 ± 0.05 |
| 18.7 | 1352.21 ± 2.06 | 0.0 | 5.07 ± 0.04 |
3.5. Structure of the solvation shell
Fig. 9 illustrates the change in the solvation shell of ions as they reach the interface for the salt concentrations of 2.5, 8.6 and 18.7 mol kg−1, the solid and dash lines represent the OPLS/ECC and OPLS ions, respectively. We calculated the average number of molecules, as function of the z position, within the first coordination shell of the ions in 2.5 Å bins starting from the centre of the slab. The Gibbs dividing plane is anchored at z = 0. We define the cut-off distance of the first solvation shell as the position of the first minimum in the radial distribution function for the ion pairs in the bulk solution. According to Fig. 3 and 4, we consider 5.10, 3.75 and 4.87 Å as the minimum values of the first solvation shells of Nn–Ow, Na–Ow and Nn–Na pairs, respectively. Fig. 9 features the decreasing number of water molecules around nitrogen atoms in nitrate and ammonium ions with the increasing salt concentration, approximately from 14.7 ± 0.1 to 7.6 ± 0.3 and 5.8 ± 0.2 to 3.0 ± 0.1, respectively. This behaviour arises because of ion pairing, which prompts the loss of water from the hydration shell. The value of the number of water molecules surrounding the nitrate anions (14.7 ± 0.1), as calculated in this study, compares well with the figure of 10 ± 1 from the work of Dang et al.87 and 12 from Xie et al.88 studies.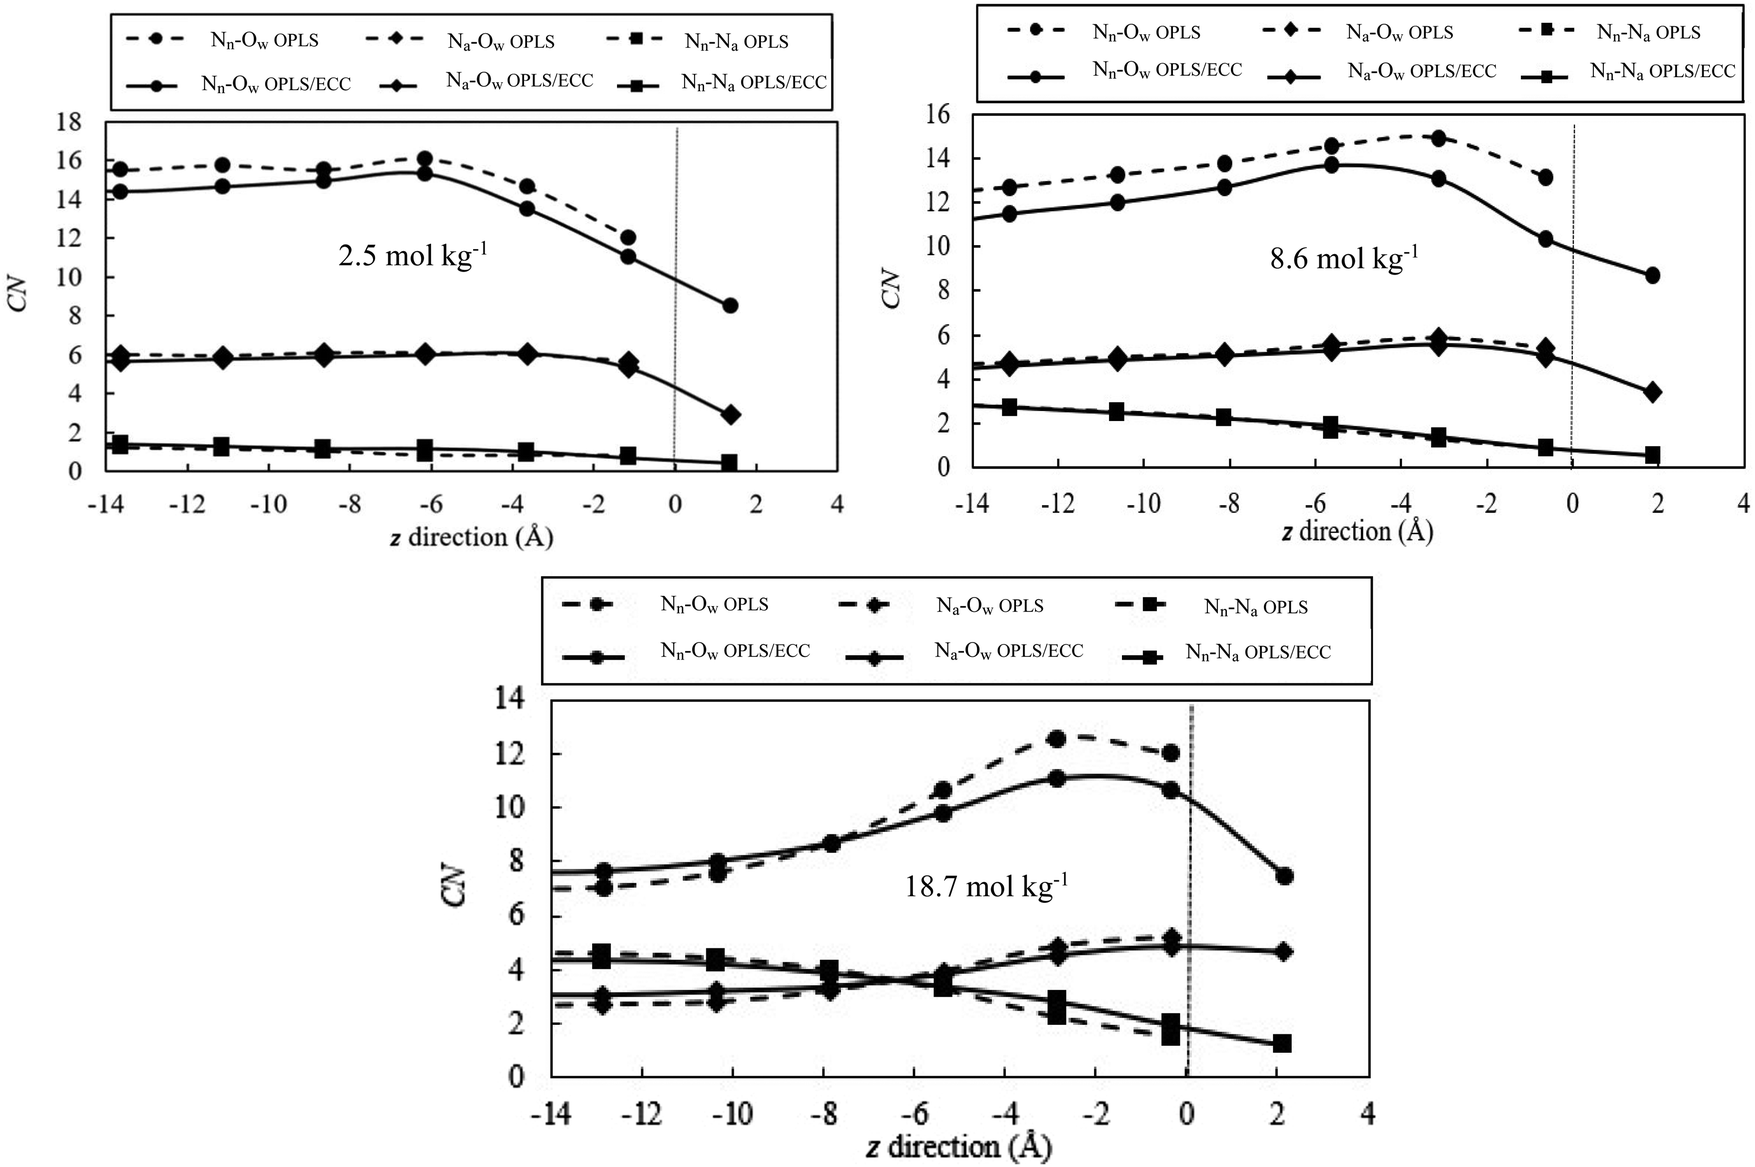 | ||
| Fig. 9 Variation in the number of water molecules coordinating anions and cations as a function of z position in 2.5 Å bins starting from the centre of the slab. Solid lines represent the results of calculations from the OPLS/ECC model, whereas dash lines represent those from the OPLS model. The vertical dash lines signify the Gibbs dividing plane, with the regions to the right of these lines corresponding to the vapour phase. | ||
For the low-concentration solution (<2.5 mol kg−1), ions maintain the same number of water molecules in the first hydration shell in the interior of the slab. However, the present calculations establish that, ions at the interface hydrate with fewer water molecules than those in the interior. This behaviour stems from the absence of water molecules in the vacuum regions above or below the slab. For the concentrated solutions (e.g., 8.6 and 18.7 mol kg−1), more water molecules exist in the first hydration shell that surrounds the ions. This behaviour arises in the region between −8 Å < z < −2 Å, compared with the interior due to the lower abundance of ions and a higher number density of water molecules in this region. The declining coordination number toward the surface reflects the decreasing number of water molecules present closer to the vacuum region.
In addition, Fig. 9 reveals higher probability of detecting unpaired ions at the interface compared with the interior region of the slabs. This is a surprising finding considering the behaviour of germane systems revealed in literature. Minofar et al.24 reported that, the ion pairing increases for Mg(OAc)2(aq) at the water/air interface compared to the bulk of the solution. According to the authors, the dominant reason for this behaviour is the intense attraction of acetate anions to the interface and, consequently, their pairing with magnesium cations present preferentially in the subsurface. This intense attraction induces powerful partitioning of ions away from the bulk into the interface that the authors described as the surfactant effect, as the phenomenon is associated with decreasing surface tension as function of the nominal concentration of the salt. More importantly, from the perspective of our results, Minofar et al. also concluded that, compared with Mg(OAc)2(aq), Mg(NO3)2(aq) behaves differently and displays less affinity for ion pairing (no detectable pairs at 1 M concentration), but still the number of ion pairs increases at the interface compared with the interior, for the solution concentration of 2 M, as illustrated in Fig. 7 and 8 of ref. 24. In contrast to these findings, our simulations indicate that, while increased salt concentration induces higher ion pairing in the bulk, there is always decrease of ion pairing at the interface in comparison to the bulk. For instance, for the molality of 18.7 mol kg−1, on average, every nitrate anion pairs with ∼4.3 and ∼1.3 ammonium cation in the interior and at the interface of the slab, respectively (see Fig. 9). The variation of ion pairing at the interface with respect to the bulk is dependent on the affinity of ions to the surface and the degree of cations and anions segregation in the interfacial layer. Moreover, the ion deficiency at the interface coincides with higher population of water molecules in the subsurface and in part of the interface layer, which prompts declining of ion pairing in that region (see Fig. 8).
Fig. 9 demonstrates that although NO3− has the affinity for the surface, this region is not completely depleted of the NH4+ cations. The results from the OPLS force field illustrate the same trend; albeit, for different average coordination numbers as discussed earlier. Also, the OPLS/ECC model yields the higher affinity of anions to the surface as compared with the OPLS force field. Lack of a plateau in the interior section of concentrated solution could be attributed to the non-homogenous distributions of ions in bulk (see Fig. 8).
From Fig. 9, one infers that larger ions (nitrate) show the greatest changes in the coordination number upon transfer into the vapour phase due to the elevated number of water molecules in the first solvation shell. Bauer et al.101 explained the reason for this comportment by weaker attraction of water to larger ions. We also found that, the general features of the RDFs remain similar from the interior and the interface region (see Fig. S5 of the ESI,† where we present the functions for the salt molality of 18.7 mol kg−1). This results in the propensity of the ions to maintain the hydration shell structure and molecular interactions even at the interface. Snapshots of hydration shells (defined as <5.1 Å) of the nitrate ion for the AN molality of 18.7 mol kg−1 in the bulk and at the interface illustrate the water depletion zone at the interface (Fig. S6, ESI†).
4. Conclusions
The present contribution computed the bulk and surface properties of solutions of ammonium nitrate (AN), over a broad range of concentrations using a non-polarisable and implicitly polarisable models for ions (OPLS and OPLS/ECC, in that order) and three non-polarisable models for water molecules (SPC/E, SPCE/F and TIP4P/2005). The OPLS model overestimates the density and the surface tension of AN solutions and is unable to reproduce the experimental values. However, a simple and computationally efficient correction to non-polarisable simulations demonstrate that, the amended model works well for the bulk and liquid–vapour interface of AN solutions.Three water models in conjunction with OPLS/ECC provide good predictions of the bulk properties (density and solvation structure) of solutions of ammonium nitrate. However, only TIP4P/2005 model yields correct trends in the surface tension and provides accurate estimates of the interfacial properties of the solutions in comparison to the experimental measurements. Density profiles reveal the repulsion of ions from the surface, as calculated from the OPLS model, while the OPLS/ECC model, similarly to polarisable models, induces the migration of anions toward the surface, and deficiency of negative charge in the sublayer of the surface. This behaviour generates an electric double layer that explains the increasing surface tension as the concentration of ammonium nitrate increases in the solution. This finding is of significant practical importance as it affords the calculation of the interfacial properties of supersaturated solutions of AN, with measurement of such properties presently outside the reach of the current experimental techniques. Yet, the aqueous (discontinuous) phase of AN emulsion explosives consist of supersaturated solutions of AN and knowledge of such properties is critical to improve the stability of emulsion explosives.
We evaluated the degree of ion pairing as function of concentration of ammonium nitrate. The hydration of ions by water molecules decreases, as the number density of nitrate and ammonium ions increases in the solution. While negligible at lower concentrations, ion pairing becomes significant as the concentration rises. However, we discovered that the ion pairing decreases at the interface in comparison to the bulk.
Conflicts of interest
There are no conflicts to declare.Acknowledgements
We are grateful to the Australian Research Council (ARC LP160101169) and Dyno Nobel Asia Pacific for funding this study. This work was supported by resources provided by the Pawsey Supercomputing Centre with funding from the Australian Government and the Government of Western Australia. We also thank Dr Baris Demir of the University of Queensland for insightful discussions.References
- Q. S. M. Kwok, P. Kruus and D. E. G. Jones, Wettability of ammonium nitrate prills, J. Energ. Mater., 2004, 22, 127–150 CrossRef CAS.
- C. S. Dutcher, A. S. Wexler and S. L. Clegg, Surface tensions of inorganic multicomponent aqueous electrolyte solutions and melts, J. Phys. Chem. A, 2010, 114, 12216–12230 CrossRef CAS.
- N. Matubayasi, K. Takayama and T. Ohata, Thermodynamic quantities of surface formation of aqueous electrolyte solutions: IX. Aqueous solutions of ammonium salts, J. Colloid Interface Sci., 2010, 344, 209–213 CrossRef CAS.
- Y. Yang-Xin, G. Guang-Hua and L. Yi-Gui, Surface tension for aqueous electrolyte solutions by the modified mean spherical approximation, Fluid Phase Equilib., 2000, 173, 23–38 CrossRef.
- M. Sadeghi, V. Taghikhani and C. Ghotbi, Measurement and correlation of surface tension for single aqueous electrolyte solutions, Int. J. Thermophys., 2010, 31, 852–859 CrossRef CAS.
- T. R. Underwood and H. C. Greenwell, The Water-Alkane Interface at Various NaCl Salt Concentrations: A Molecular Dynamics Study of the Readily Available Force Fields, Sci. Rep., 2018, 8, 352 CrossRef.
- D. Bhatt, J. Newman and C. J. Radke, Molecular dynamics simulations of surface tensions of aqueous electrolytic solutions, J. Phys. Chem. B, 2004, 108, 9077–9084 CrossRef CAS.
- J. L. Thomas, M. Roeselová, L. X. Dang and D. J. Tobias, Molecular dynamics simulations of the solution–air interface of aqueous sodium nitrate, J. Phys. Chem. A, 2007, 111, 3091–3098 CrossRef CAS.
- J. Zhao, G. Yao, S. B. Ramisetti, R. B. Hammond and D. Wen, Molecular dynamics simulation of the salinity effect on the n-decane/water/vapor interfacial equilibrium, Energy Fuels, 2018, 32, 11080–11092 CrossRef CAS.
- A. Ghoufi, P. Malfreyt and D. J. Tildesley, Computer modelling of the surface tension of the gas–liquid and liquid–liquid interface, Chem. Soc. Rev., 2016, 45, 1387–1409 RSC.
- J.-C. Neyt, A. Wender, V. Lachet, A. Ghoufi and P. Malfreyt, Prediction of the concentration dependence of the surface tension and density of salt solutions: atomistic simulations using drude oscillator polarizable and nonpolarizable models, Phys. Chem. Chem. Phys., 2013, 15, 11679–11690 RSC.
- G. A. Orozco, O. A. Moultos, H. Jiang, I. G. Economou and A. Z. Panagiotopoulos, Molecular simulation of thermodynamic and transport properties for the H2O + NaCl system, J. Chem. Phys., 2014, 141, 234507 CrossRef.
- Y. Feng and J. E. Penner, Global modeling of nitrate and ammonium: interaction of aerosols and tropospheric chemistry, J. Geophys. Res. Atmos, 2007, 112, D01304 CrossRef.
- P. Leroy, A. Lassin, M. Azaroual and L. André, Predicting the surface tension of aqueous 1:1 electrolyte solutions at high salinity, Geochim. Cosmochim. Acta, 2010, 74, 5427–5442 CrossRef CAS.
- R. D’Auria and D. J. Tobias, Relation between surface tension and ion adsorption at the air–water interface: a molecular dynamics simulation study, J. Phys. Chem. A, 2009, 113, 7286–7293 CrossRef.
- L. X. Dang, Computational study of ion binding to the liquid interface of water, J. Phys. Chem. B, 2002, 106, 10388–10394 CrossRef CAS.
- P. Jungwirth and D. J. Tobias, Surface effects on aqueous ionic solvation: a molecular dynamics simulation study of NaCl at the air/water interface from infinite dilution to saturation, J. Phys. Chem. B, 2000, 104, 7702–7706 CrossRef CAS.
- J. C. Neyt, A. Wender, V. Lachet, A. Szymczyk, A. Ghoufi and P. Malfreyt, How does the electronic continuum model perform in the prediction of the surface tension of salt solutions?, Chem. Phys. Lett., 2014, 595–596, 209–213 CrossRef CAS.
- J. Li and F. Wang, Surface penetration without enrichment: simulations show ion surface propensities consistent with both elevated surface tension and surface sensitive spectroscopy, J. Phys. Chem. B, 2019, 123, 7197–7203 CrossRef CAS.
- C. V. Nguyen, H. Nakahara, O. Shibata and C. M. Phan, Adsorption of sodium iodine at air/water interface, J. Mol. Liq., 2020, 298, 112076 CrossRef CAS.
- L. Vrbka, M. Mucha, B. Minofar, P. Jungwirth, E. C. Brown and D. J. Tobias, Propensity of soft ions for the air/water interface, Curr. Opin. Colloid Interface Sci., 2004, 9, 67–73 CrossRef CAS.
- D. E. Otten, P. B. Petersen and R. J. Saykally, Observation of nitrate ions at the air/water interface by UV-second harmonic generation, Chem. Phys. Lett., 2007, 449, 261–265 CrossRef CAS.
- L. M. Pegram and M. T. Record, Partitioning of atmospherically relevant ions between bulk water and the water/vapor interface, Proc. Natl. Acad. Sci. U. S. A., 2006, 103, 14278–14281 CrossRef CAS.
- B. Minofar, R. Vácha, A. Wahab, S. Mahiuddin, W. Kunz and P. Jungwirth, Propensity for the air/water interface and ion pairing in magnesium acetate vs magnesium nitrate solutions: molecular dynamics simulations and surface tension measurements, J. Phys. Chem. B, 2006, 110, 15939–15944 CrossRef CAS.
- P. K. Weissenborn and R. J. Pugh, Surface tension of aqueous solutions of electrolytes: relationship with ion hydration, oxygen solubility, and bubble coalescence, J. Colloid Interface Sci., 1996, 184, 550–563 CrossRef CAS.
- M. A. Brown, B. Winter, M. Faubel and J. C. Hemminger, Spatial distribution of nitrate and nitrite anions at the liquid/vapor interface of aqueous solutions, J. Am. Chem. Soc., 2009, 131, 8354–8355 CrossRef CAS.
- C. Tian, S. J. Byrnes, H.-L. Han and Y. R. Shen, Surface propensities of atmospherically relevant ions in salt solutions revealed by phase-sensitive sum frequency vibrational spectroscopy, J. Phys. Chem. Lett., 2011, 2, 1946–1949 CrossRef CAS.
- W. Hua, D. Verreault and H. C. Allen, Surface electric fields of aqueous solutions of NH4NO3, Mg(NO3)2, NaNO3, and LiNO3: implications for atmospheric aerosol chemistry, J. Phys. Chem. C, 2014, 118, 24941–24949 CrossRef CAS.
- E. Pluhařová, P. E. Mason and P. Jungwirth, Ion pairing in aqueous lithium salt solutions with monovalent and divalent counter-anions, J. Phys. Chem. A, 2013, 117, 11766–11773 CrossRef.
- E. Wernersson and P. Jungwirth, Effect of water polarizability on the properties of solutions of polyvalent ions: simulations of aqueous sodium sulfate with different force fields, J. Chem. Theory Comput., 2010, 6, 3233–3240 CrossRef CAS.
- A. A. Chen and R. V. Pappu, Parameters of monovalent ions in the AMBER-99 forcefield: assessment of inaccuracies and proposed improvements, J. Phys. Chem. B, 2007, 111, 11884–11887 CrossRef CAS.
- I. Leontyev and A. Stuchebrukhov, Accounting for electronic polarization in non-polarizable force fields, Phys. Chem. Chem. Phys., 2011, 13, 2613–2626 RSC.
- I. V. Leontyev and A. A. Stuchebrukhov, Dielectric relaxation of cytochrome C oxidase: comparison of the microscopic and continuum models, J. Chem. Phys., 2009, 130, 085103 CrossRef CAS.
- I. V. Leontyev and A. A. Stuchebrukhov, Electronic continuum model for molecular dynamics simulations of biological molecules, J. Chem. Theory Comput., 2010, 6, 1498–1508 CrossRef CAS.
- R. Car and M. Parrinello, Unified approach for molecular dynamics and density-functional theory, Phys. Rev. Lett., 1985, 55, 2471–2474 CrossRef CAS.
- G. Cassone, Nuclear quantum effects largely influence molecular dissociation and proton transfer in liquid water under an electric field, J. Phys. Chem. Lett., 2020, 8983–8988 CrossRef CAS.
- G. Cassone, G. Calogero, J. Sponer and F. Saija, Mobilities of iodide anions in aqueous solutions for applications in natural dye-sensitized solar cells, Phys. Chem. Chem. Phys., 2018, 20, 13038–13046 RSC.
- G. Cassone, F. Creazzo, P. V. Giaquinta, J. Sponer and F. Saija, Ionic diffusion and proton transfer in aqueous solutions of alkali metal salts, Phys. Chem. Chem. Phys., 2017, 19, 20420–20429 RSC.
- A. P. Gaiduk and G. Galli, Local and global effects of dissolved sodium chloride on the structure of water, J. Phys. Chem. Lett., 2017, 8, 1496–1502 CrossRef CAS.
- C. Schröder, Comparing reduced partial charge models with polarizable simulations of ionic liquids, Phys. Chem. Chem. Phys., 2012, 14, 3089–3102 RSC.
- M. Moosavi, N. Banazadeh and M. Torkzadeh, Structure and dynamics in amino acid choline-based ionic liquids: a combined QTAIM, NCI, DFT, and molecular dynamics study, J. Phys. Chem. B, 2019, 123, 4070–4084 CrossRef CAS.
- E. Sedghamiz, F. Khashei and M. Moosavi, Linear tricationic ionic liquids: insights into the structural features using DFT and molecular dynamics simulation, J. Mol. Liq., 2018, 271, 96–104 CrossRef CAS.
- S. Yue and A. Z. Panagiotopoulos, Dynamic properties of aqueous electrolyte solutions from non-polarisable, polarisable, and scaled-charge models, Mol. Phys., 2019, 117, 3538–3549 CrossRef CAS.
- S. Blazquez, I. M. Zeron, M. M. Conde, J. L. F. Abascal and C. Vega, Scaled charges at work: salting out and interfacial tension of methane with electrolyte solutions from computer simulations, Fluid Phase Equilib., 2020, 513, 112548 CrossRef CAS.
- E. E. Bruce and N. F. A. V. D. Vegt, Does an electronic continuum correction improve effective short-range ion-ion interactions in aqueous solution?, J. Chem. Phys., 2018, 148, 222816 CrossRef.
- P. E. Mason, E. Wernersson and P. Jungwirth, Accurate description of aqueous carbonate ions: an effective polarization model verified by neutron scattering, J. Phys. Chem. B, 2012, 116, 8145–8153 CrossRef CAS.
- M. Vazdar, P. Jungwirth and P. E. Mason, Aqueous guanidinium–carbonate interactions by molecular dynamics and neutron scattering: relevance to ion–protein interactions, J. Phys. Chem. B, 2013, 117, 1844–1848 CrossRef CAS.
- M. Kohagen, P. E. Mason and P. Jungwirth, Accounting for electronic polarization effects in aqueous sodium chloride via molecular dynamics aided by neutron scattering, J. Phys. Chem. B, 2016, 120, 1454–1460 CrossRef CAS.
- A. Nikitin and G. Del Frate, Development of nonbonded models for metal cations using the electronic continuum correction, J. Comput. Chem., 2019, 40, 2464–2472 CrossRef CAS.
- L. Pegado, O. Marsalek, P. Jungwirth and E. Wernersson, Solvation and ion-pairing properties of the aqueous sulfate anion: explicit versus effective electronic polarization, Phys. Chem. Chem. Phys., 2012, 14, 10248–10257 RSC.
- M. Vazdar, E. Pluhařová, P. E. Mason, R. Vácha and P. Jungwirth, Ions at hydrophobic aqueous interfaces: molecular dynamics with effective polarization, J. Phys. Chem. Lett., 2012, 3, 2087–2091 CrossRef CAS.
- D. E. Otten, P. R. Shaffer, P. L. Geissler and R. J. Saykally, Elucidating the mechanism of selective ion adsorption to the liquid water surface, Proc. Natl. Acad. Sci. U. S. A., 2012, 109, 701–705 CrossRef CAS.
- G. Le Breton and L. Joly, Molecular modeling of aqueous electrolytes at interfaces: effects of long-range dispersion forces and ionic charge rescaling, J. Chem. Phys., 2020, 152, 241102 CrossRef CAS.
- P. Patnaik, Handbook of inorganic chemicals, McGraw-Hill, 2002 Search PubMed.
- H. J. C. Berendsen, J. R. Grigera and T. P. Straatsma, The missing term in effective pair potentials, J. Phys. Chem., 1987, 91, 6269–6271 CrossRef CAS.
- J. Lopez-Lemus, G. A. Chapela and J. Alejandre, Effect of flexibility on surface tension and coexisting densities of water, J. Chem. Phys., 2008, 128, 174703 CrossRef.
- J. L. Abascal and C. Vega, A general purpose model for the condensed phases of water: TIP4P/2005, J. Chem. Phys., 2005, 123, 234505 CrossRef CAS.
- M. Sega and C. Dellago, Long-range dispersion effects on the water/vapor interface simulated using the most common models, J. Phys. Chem. B, 2017, 121, 3798–3803 CrossRef CAS.
- C. Vega and E. D. Miguel, Surface tension of the most popular models of water by using the test-area simulation method, J. Chem. Phys., 2007, 126, 154707 CrossRef CAS.
- J. López-Lemus, G. A. Chapela and J. Alejandre, Effect of flexibility on surface tension and coexisting densities of water, J. Chem. Phys., 2008, 128, 174703 CrossRef.
- P. K. Yuet and D. Blankschtein, Molecular dynamics simulation study of water surfaces: comparison of flexible water models, J. Phys. Chem. B, 2010, 114, 13786–13795 CrossRef CAS.
- A. Ghoufi and P. Malfreyt, Calculation of the surface tension of water: 40 years of molecular simulations, Mol. Simul., 2019, 45, 295–303 CrossRef CAS.
- P. Veld, A. E. Ismail and G. S. Grest, Application of Ewald summations to long-range dispersion forces, J. Chem. Phys., 2007, 127, 144711 CrossRef.
- M. F. Döpke, O. A. Moultos and R. Hartkamp, On the transferability of ion parameters to the TIP4P/2005 water model using molecular dynamics simulations, J. Chem. Phys., 2020, 152, 024501 CrossRef.
- C. Sanchez, H. Dominguez and O. Pizio, Molecular dynamics simulations of the properties of water–methanol mixtures. Effects of force fields, Condens. Matter Phys., 2019, 22, 13602 CrossRef.
- W. L. Jorgensen, D. S. Maxwell and J. Tirado-Rives, Development and testing of the OPLS all-atom force field on conformational energetics and properties of organic liquids, J. Am. Chem. Soc., 1996, 118, 11225–11236 CrossRef CAS.
- E. Marin-Rimoldi, J. K. Shah and E. J. Maginn, Monte Carlo simulations of water solubility in ionic liquids: a force field assessment, Fluid Phase Equilib., 2016, 407, 117–125 CrossRef CAS.
- S. V. Sambasivarao and O. Acevedo, Development of OPLS-AA force field parameters for 68 unique ionic liquids, J. Chem. Theory Comput., 2009, 5, 1038–1050 CrossRef CAS.
- B. Doherty, X. Zhong, S. Gathiaka, B. Li and O. Acevedo, Revisiting OPLS force field parameters for ionic liquid simulations, J. Chem. Theory Comput., 2017, 13, 6131–6145 CrossRef CAS.
- S. Plimpton, Fast parallel algorithms for short-range molecular dynamics, J. Comput. Phys., 1995, 117, 1–19 CrossRef CAS.
- R. E. Isele-Holder, W. Mitchell and A. E. Ismail, Development and application of a particle–particle particle–mesh ewald method for dispersion interactions, J. Chem. Phys., 2012, 137, 174107 CrossRef.
- V. Kräutler, W. F. van Gunsteren and P. H. Hünenberger, A fast SHAKE algorithm to solve distance constraint equations for small molecules in molecular dynamics simulations, J. Comput. Chem., 2001, 22, 501–508 CrossRef.
- L. Martínez, R. Andrade, E. G. Birgin and J. M. Martínez, PACKMOL: a package for building initial configurations for molecular dynamics simulations, J. Comput. Chem., 2009, 30, 2157–2164 CrossRef.
- E. Sedghamiz and M. Moosavi, Probing the tricationic ionic liquid/vacuum interface: insights from molecular dynamics simulations, Phys. Chem. Chem. Phys., 2018, 20, 14251–14263 RSC.
- D. W. Green and R. H. Perry, Perry's Chemical Engineers' Handbook, McGraw-Hill, 8th edn, 2008 Search PubMed.
- N. B. Vargaftik, B. N. Volkov and L. D. Voljak, International tables of the surface tension of water, J. Phys. Chem. Ref. Data, 1983, 12, 817–820 CrossRef CAS.
- D. K. Chattoraj and K. S. Birdi, Adsorption and the Gibbs Surface Excess, Springer US, New York (NY), 1984 Search PubMed.
- J. Škvor, J. Škvára, J. Jirsák and I. Nezbeda, A general method for determining molecular interfaces and layers, J. Mol. Graphics Modell., 2017, 76, 17–35 CrossRef.
- L. B. Pártay, G. Hantal, P. Jedlovszky, Á. Vincze and G. Horvai, A new method for determining the interfacial molecules and characterizing the surface roughness in computer simulations. application to the liquid–vapor interface of water, J. Comput. Chem., 2008, 29, 945–956 CrossRef.
- A. P. Willard and D. Chandler, Instantaneous liquid interfaces, J. Chem. Phys. B, 2010, 114, 1954–1958 CrossRef CAS.
- S. Patel, Y. Zhong, B. A. Bauer and J. E. Davis, Interfacial structure, thermodynamics, and electrostatics of aqueous methanol solutions via molecular dynamics simulations using charge equilibration models, J. Phys. Chem. B, 2009, 113, 9241–9254 CrossRef CAS.
- A. Wahab and S. Mahiuddin, Electrical conductivity, speeds of sound, and viscosity of aqueous ammonium nitrate solutions, Can. J. Chem., 2001, 79, 1207–1212 CrossRef CAS.
- Council, N. R., International critical tables of numerical data, physics, chemistry and technology, The National Academies Press, Washington, DC, 1930, p. 49 Search PubMed.
- J. L. Aragones, E. Sanz and C. Vega, Solubility of NaCl in water by molecular simulation revisited, J. Chem. Phys., 2012, 136, 244508 CrossRef CAS.
- M. M. Reif and P. H. Hünenberger, Computation of methodology-independent single-ion solvation properties from molecular simulations. IV. Optimized Lennard-Jones interaction parameter sets for the alkali and halide ions in water, J. Chem. Phys., 2011, 134, 144104 CrossRef.
- J. Chandrasekhar and W. L. Jorgensen, The nature of dilute solutions of sodium ion in water, methanol, and tetrahydrofuran, J. Chem. Phys., 1982, 77, 5080–5089 CrossRef CAS.
- L. X. Dang, T.-M. Chang, M. Roeselova, B. C. Garrett and D. J. Tobias, On NO3–H2O interactions in aqueous solutions and at interfaces, J. Chem. Phys., 2006, 124, 066101 CrossRef.
- W. J. Xie, Y. I. Yang and Y. Q. Gao, Dual reorientation relaxation routes of water molecules in oxyanion's hydration shell: a molecular geometry perspective, J. Chem. Phys., 2015, 143, 224504 CrossRef.
- P. Banerjee, S. Yashonath and B. Bagchi, Rotation driven translational diffusion of polyatomic ions in water: a novel mechanism for breakdown of Stokes–Einstein relation, J. Chem. Phys., 2017, 146, 164502 CrossRef.
- V. Vchirawongkwin, H. Sato and S. Sakaki, RISM-SCF-SEDD study on the symmetry breaking of carbonate and nitrate anions in aqueous solution, J. Phys. Chem. B, 2010, 114, 10513–10519 CrossRef CAS.
- K. Yasuo, S. Hiroki and U. Osamu, The hydration structure of NO3 in concentrated aqueous sodium nitrate solutions, Bull. Chem. Soc. Jpn., 1993, 66, 1919–1923 CrossRef.
- R. Caminiti, G. Licheri, G. Piccaluga and G. Pinna, On NO3–H2O interactions in aqueous solutions, J. Chem. Phys., 1978, 68, 1967–1970 CrossRef CAS.
- W. L. Jorgensen and J. Gao, Monte Carlo simulations of the hydration of ammonium and carboxylate ions, J. Phys. Chem., 1986, 90, 2174–2182 CrossRef CAS.
- S. Yadav and A. Chandra, Preferential solvation, ion pairing, and dynamics of concentrated aqueous solutions of divalent metal nitrate salts, J. Chem. Phys., 2017, 147, 244503 CrossRef.
- T. J. Yoon, L. A. Patel, M. J. Vigil, K. A. Maerzke, A. T. Findikoglu and R. P. Currier, Electrical conductivity, ion pairing, and ion self-diffusion in aqueous NaCl solutions at elevated temperatures and pressures, J. Phys. Chem., 2019, 151, 224504 CrossRef.
- G. F. Velardez, S. Alavi and D. L. Thompson, Molecular dynamics studies of melting and solid-state transitions of ammonium nitrate, J. Phys. Chem., 2004, 120, 9151–9159 CrossRef CAS.
- S. Chowdhuri and A. Chandra, Molecular dynamics simulations of aqueous NaCl and KCl solutions: effects of ion concentration on the single-particle, pair, and collective dynamical properties of ions and water molecules, J. Chem. Phys., 2001, 115, 3732–3741 CrossRef CAS.
- A. A. Abramzon and R. D. Gauberk, Surface tension of salt solutions, Russ. J. Appl. Chem., 1993, 66, 1474 Search PubMed.
- A. Khurshid, S. Anwar-ul-Haq Ali, S. Bilal and Azhar-ul-Haq, Thermodynamic parameters of surface formation of some aqueous salt solutions, Colloids Surf., A, 2008, 330, 28–34 CrossRef.
- Y. Levin, Polarizable ions at interfaces, Phys. Rev. Lett., 2009, 102, 147803 CrossRef.
- B. A. Bauer, S. Ou and S. Patel, Solvation structure and energetics of single ions at the aqueous liquid–vapor interface, Chem. Phys. Lett., 2012, 527, 22–26 CrossRef CAS.
Footnote |
| † Electronic supplementary information (ESI) available: The molecular parameters for the three water models (Section I); values of the surface tension, interfacial thickness and the orthobaric densities of water at a temperature range between 298.15–600 K (Section II); the calculated coordination numbers (CN) for the first minima in g(r) of Fig. 4 and comparison of the radial distribution functions for 18.7 mol kg−1 AN solution using the OPLS and OPLS/ECC models and the TIP4P/2005 force field for water at 298.15 K (Section III); experimental values of surface tension of AN solutions at two temperatures of 293.15 and 313.15 K (Section IV); RDF and snapshots of coordination shell around one nitrogen of nitrate in the bulk and at the interface of the slab (Section V); and LAMMPS code for calculating surface tension of AN solution using TIP4P/2005 + OPLS/ECC (Section VI). See DOI: 10.1039/d0cp04874g |
| This journal is © the Owner Societies 2020 |