
 Open Access Article
 This Open Access Article is licensed under a Creative Commons Attribution-Non Commercial 3.0 Unported Licence
On the SN2 reactions modified in vibrational strong coupling experiments: reaction mechanisms and vibrational mode assignments†
Clàudia
Climent
 * and
Johannes
Feist
* and
Johannes
Feist
Departamento de Física Teórica de la Materia Condensada and Condensed Matter Physics Center (IFIMAC), Universidad Autónoma de Madrid, E-28049 Madrid, Spain. E-mail: claudia.climent@uam.es
First published on 7th September 2020
Abstract
Recent experiments have reported modified chemical reactivity under vibrational strong coupling (VSC) in microfluidic Fabry–Pérot cavities. In particular, the reaction rate of nucleophilic substitution reactions at silicon centers (SN2@Si) has been altered when a vibrational mode of the reactant was coupled to a confined light mode in the strong coupling regime. In this situation, hybrid light–matter states known as polaritons are formed and seem to be responsible for the modified chemical kinetics. These results are very encouraging for future applications of polaritonic chemistry to catalyze chemical reactions, with the ability to manipulate chemical phenomena without any external excitation of the system. Still, there is no theory capable of explaining the mechanism behind these results. In this work we address two points that are crucial for the interpretation of these experiments. Firstly, by means of electronic structure calculations we report the reaction mechanism in normal conditions of the two recently modified SN2@Si reactions, obtaining in both cases a triple-well PES where the rate-determining step is due to the Si–C and Si–O bond cleavage. Secondly, we characterize in detail the normal modes of vibration of the reactants. In the VSC experiments, reaction rates were modified only when specific vibrations of the reactants were coupled to a cavity mode. We find that these vibrations are highly mixed among the different fragments of the reactants leading to a completely new assignment of the IR peaks coupled to cavity modes in the original experimental works. Our results are fundamental for the interpretation of the VSC experiments given that in the absence of a theory explaining these results, the current phenomenological understanding relies on the assignment of the character of the vibrational IR peaks.
Introduction
Bimolecular nucleophilic substitution (SN2) reactions at a carbon center are amongst the first reaction mechanisms taught in an organic chemistry course. The dependence of prototypical SN2 reactions on the nucleophile, substrate, leaving group, and solvent, as well as their stereochemistry and the role of electronic and steric effects have been thoroughly investigated by experimental and theoretical means.1,2 Despite the central atom playing a key role in determining the shape of the reaction profile, there are fewer works in the literature dealing with the mechanism of SN2 reactions involving other central atoms besides carbon, such as for instance, phosphorous or silicon.3–6 Interestingly, in a recent experiment, the rate of an SN2@Si reaction with a fluoride nucleophile was slowed down by coupling a Si–C(sp) vibration of the reactant with a confined light mode of a Fabry–Pérot microcavity.7 Moreover, site selective chemistry has been claimed to be possible for similar SN2@Si reactions also occurring under vibrational strong coupling (VSC), where the product branching ratio was modified in the cavity experiments.8 These two works highlight the potential of the field of polaritonic chemistry to modify thermal reactions by taking advantage of the presence of polaritons.9–13 These are the states formed when molecular transitions, such as those between vibrational states of the reactant in the case of these experiments, and confined light modes, such as those from Fabry–Pérot cavities, hybridize in the strong coupling regime. This vibrational strong coupling results in the splitting of the IR band of the coupled vibration. Note that in these experiments, thermal reaction rates have been modified without any external input of energy such as vibrational excitation with a laser. Therefore, all these experiments are of current general interest in chemistry, particularly due to recent works on the quest for chemical catalysis with electric fields.14–19Closely related to this subject is our recent work where we tackled the situation of vibrational strong coupling between plasmonic nanocavity modes and molecular vibrations.20,21 We found that in such a scenario, SN1 and SN2 reactions can be catalyzed through the interaction of permanent and fluctuating molecular dipole moments with plasmonic modes, and that this effect can also be used to modify the transition temperature of spin-crossover transition metal complexes.21 An important result of our investigation was that the formation of polaritons, however, is not a requisite to observe reaction rate modifications with plasmonic nanocavity modes.20 Therefore, our work retrieved the fundamental interactions between metal surfaces and molecules in heterogeneous catalysis. In line with our results, another recent theoretical work has found that cavity effects on reaction rates are not associated to a resonant interaction with the cavity mode.22 In contrast, in VSC experiments with Fabry–Pérot cavities, rates of SN2@Si reactions are only found to be modified when polaritons are formed, in particular, when a cavity mode is in resonance with a molecular vibration involved in the reaction coordinate.7,8
For the purposes of this work, we would like to highlight that at the present time, there is no clear physical explanation as to how vibrational strong coupling can slow down or accelerate thermal reactions in solution taking place inside Fabry–Pérot cavities,20,22–24 and that further theoretical work in this direction is highly desirable to rationalize the experimental observations. This being said, considering (i) the intricacies of SN2 reactions that will be discussed in the following lines, and (ii) that vibrational strong coupling experiments have reported modified rates of SN2@Si reactions, we believe that prior to deciphering how the reaction path is modified in the complex strong-coupling situation, the reaction mechanism under normal conditions should be fully understood. This is the aim of the first part of this work, where we propose the mechanism of the SN2@Si reactions shown in Scheme 1, which were the first ground-state reactions reported to be modified under vibrational strong coupling.7,8 By means of electronic structure calculations and taking into account previous experimental results regarding the kinetics of these reactions in normal conditions, we provide insight into their reaction mechanism and, more importantly, the rate-determining step. In the second part of this work we focus on the normal modes of vibration of the reactants with the aim to provide deeper insight on the nature of the molecular modes hybridized in strong coupling experiments. In particular we show that certain modes of both reactants, 1-phenyl-2-trimethylsilylacetylene (RI) and tert-butyldimethyl{[4-(trimethylsilyl)but-3-yn-1-yl]oxy}silane (RII) (see Scheme 1), are highly coupled among the different fragments, and thus one cannot simply think in terms of isolated stretching modes when performing VSC experiments. Moreover, we also show that taking this into account changes the assignment of several IR peaks compared to the original experimental works. Finally we discuss the possibility that the modified reaction rates observed in the first VSC experiment may be due to coupling of the cavity to the solvent, in line with recent experimental results.25
 | ||
| Scheme 1 Reactions I and II. | ||
Regarding the mechanism of SN2 reactions, they typically evolve through double-well potential energy surfaces (PES) in the gas phase, where reactant and product complexes (RC and PC) are connected via a transition state (TS) in the case of first-row central atoms such as C (Fig. 1a).2 For second row elements such as P and Si, the central species is usually no longer a transition state and becomes a stable intermediate transition complex (TC), leading to a single-well profile (Fig. 1b).3 It has also been shown that due to steric effects, the presence of bulky groups close to the central atom may lead to either a triple-well PES (Fig. 1c), where pre- and post-transition states appear in the vicinity of the central transition complex, or to a double-well PES, just like for SN2@C reactions.3,4 Moreover, the disappearance of reactant and product complexes when solvent effects are included, has been reported for certain SN2 reactions on C, Si, and P, leading to a unimodal reaction profile where a transition state connects reactants to products (Fig. 1d).4 All these peculiarities suggest that one cannot rely on the mechanism of other SN2 reactions for the SN2@Si reaction studied herein, especially due to the reaction profile dependence on the central atom and nearby substituents.2,26,27
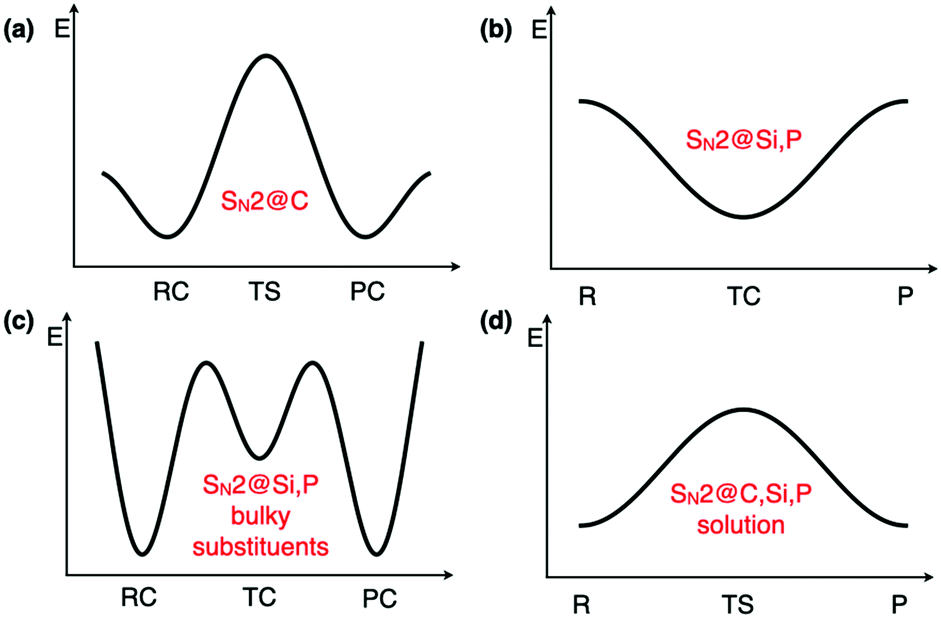 | ||
| Fig. 1 Typical SN2 reaction profiles. R: reactants, RC: reactant complex, P: products, PC: product complex, TS: transition state, TC: transition complex. | ||
Results and discussion
The reactions studied in this work consist of two different steps (Scheme 1), the first one being the SN2@Si reaction where the Si–F bond is formed and either a Si–C (reactions I and II) or Si–O bond (reaction II) is broken, and the second one dealing with the acetylide or alkoxide anion protonation by methanol. Note that TBAF is the quaternary ammonium salt providing the fluoride ions and the pKa values of alkyne and alcohol groups are compatible with the protonation step. Our calculations suggest that the global reaction rate is dictated by the SN2@Si reaction, given that we found a modest Gibbs free energy barrier (ΔG‡) of 3 kcal mol−1 for the protonation step of reaction I (Fig. S1 and Table S1, ESI†) and we will therefore focus on the rate-determining step in the following. In Fig. 2 we show a schematic diagram of the computed Gibbs free energy profile for the nucleophilic substitution of reactions I and II. We obtain a triple-well PES, in line with that previously reported for the Cl− + SiMe3Cl model reaction, where the appearance of pre- and post-TSs before and after the stable intermediate TC was attributed to the steric hindrance imposed by the methyl groups.3 For the studied reactions however we did not find any stable reactant nor product complexes, and so the three wells are associated with the separate reactants (RI, RII) and products (P, PO, PC), and the trigonal bipyramidal TC. As expected, the reaction profile is asymmetrical in all cases, but the inclusion of solvent effects in our calculations does not lead to a unimodal reaction profile as previously found for several SN2 reactions.4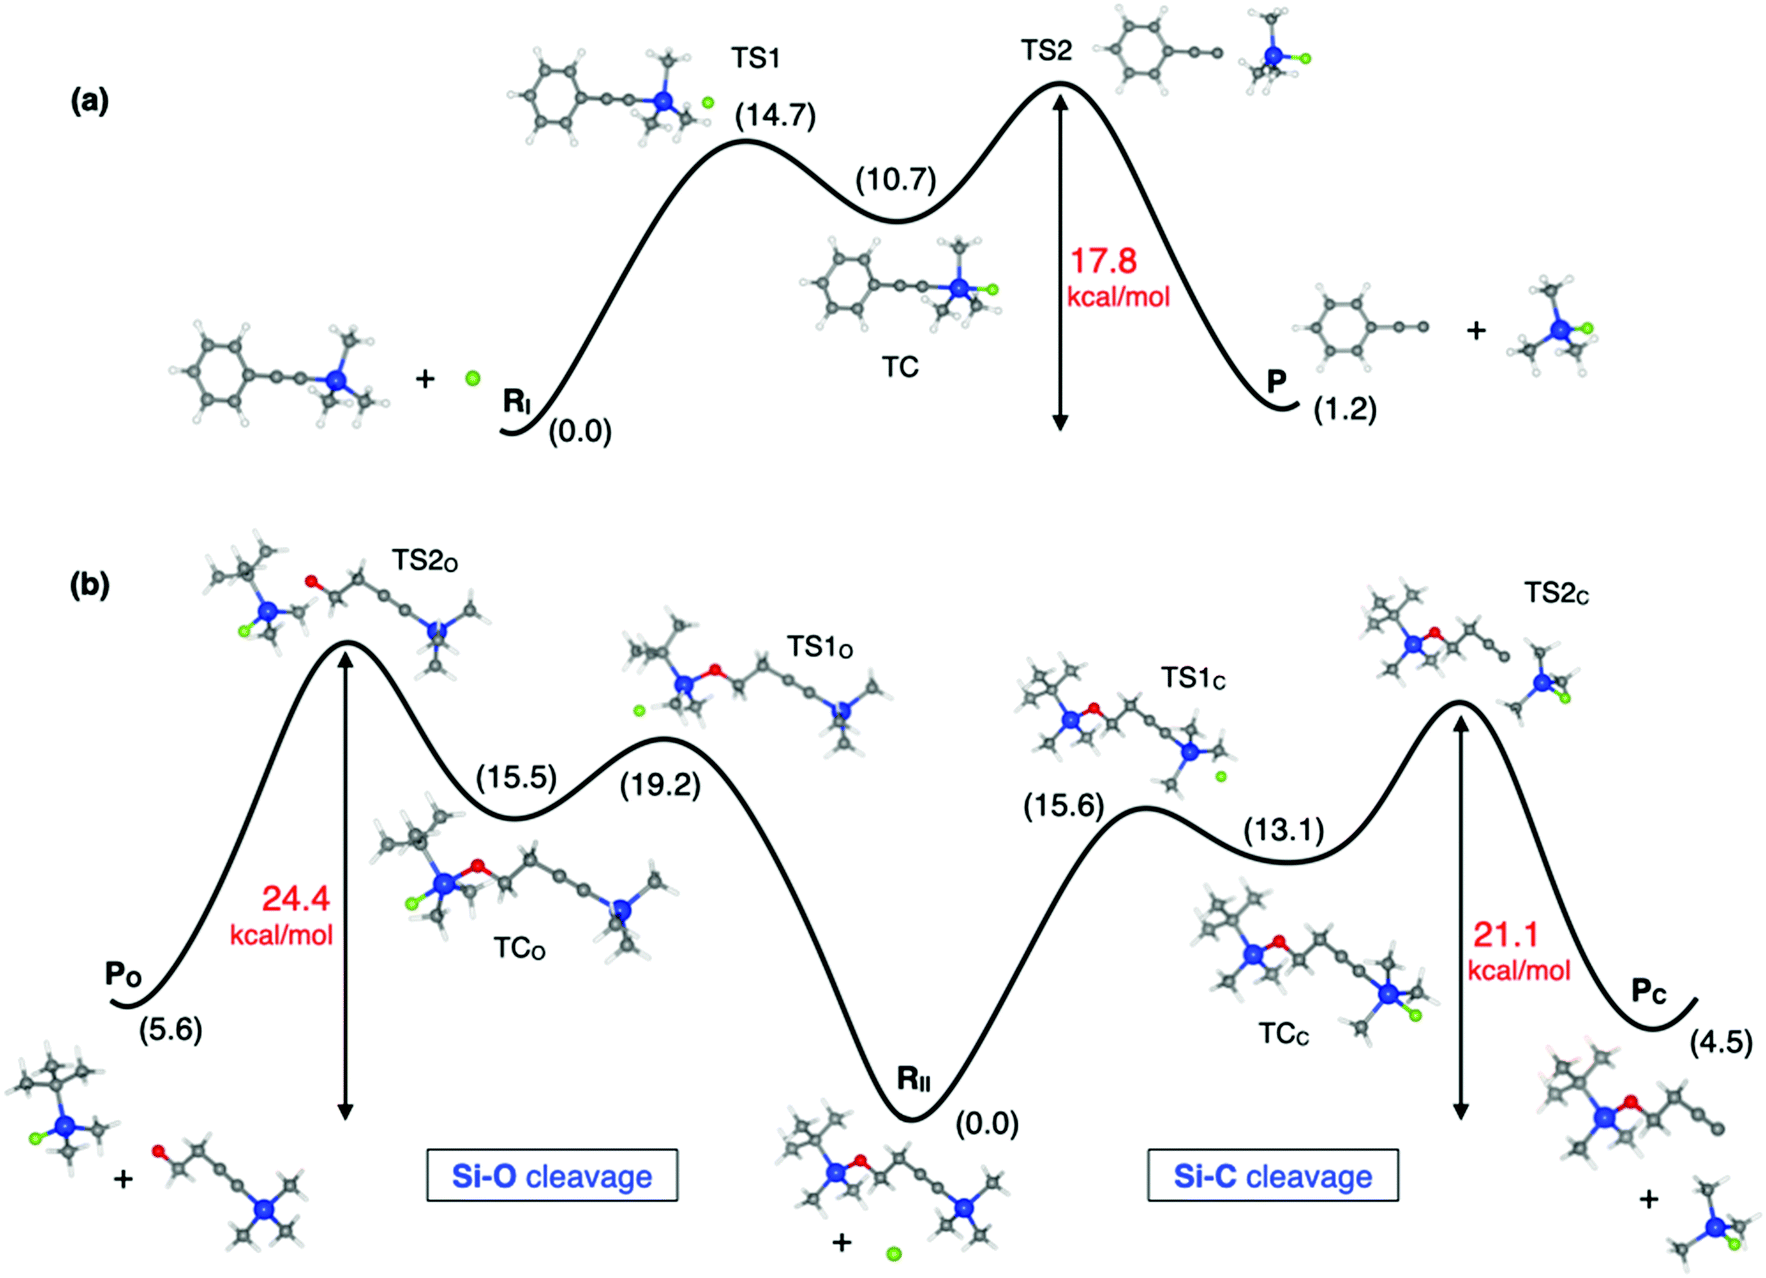 | ||
| Fig. 2 SN2@Si profile of (a) reaction I and (b) reaction II shown in Scheme 1. Relative Gibbs free energies in kcal mol−1 are shown in black and barriers of the rate-determining step in red. Computed at the B3LYP/6-31+G(d,p) level in methanol. Stationary points along the reaction profile are show to scale. Color code: carbon in grey, silicon in blue, oxygen in red and fluorine in green. | ||
Focusing on reaction I (Fig. 2a), according to our calculations, the Gibbs free energy barrier from reactants to the TC is 15 kcal mol−1 while that from the TC to products is 7 kcal mol−1 (Table S2, ESI†). Even though the second barrier is lower than the first one, the rate-determining step is the breaking of the Si–C bond. This is because the formation of the acetylide anion depends on the concentration of the intermediate TC, which will be a low-concentration species during the course of the reaction, given the relative energy barriers from the reactants to the TC and vice versa.28 If we label the forward and backward rates of the TS1 elementary step k1 and k−1, respectively, and k2 that involving the formation of products from TS2, then, since k−1 + k2 ≫ k1, the steady-state approximation can be applied, yielding an apparent pseudo-first order rate constant kapp = k2k1[RI]/k−1. This result is compatible with the experimentally observed first order kinetics.7 The effective Gibbs free energy barrier we obtain governing the rate of the reaction, ΔG‡ = GTS2 − GR = 17.8 kcal mol−1, is consistent with the experimentally determined barriers of 21.5 kcal mol−1 and 20.1 kcal mol−1 at room temperature.7,29 Comparison between the computed and experimental ΔH‡ and TΔS‡ values (Table S4, ESI†) as well as the rate equations can be found in the ESI.†
Moving to reaction II, in this case there are two competing pathways yielding either products PC or PO depending on the silicon center where the nucleophilic attack takes place. The computed reaction profile for both pathways is analogous to that of reaction I and therefore similar conclusions can be drawn regarding the kinetics and apparent rate constant observed in the experiments. In this respect, the rate-determining step in both pathways is also the breaking of the Si–C or Si–O bond in TS2, with ΔG‡ being 21.1 kcal mol−1 for the Si–C cleavage and 24.4 kcal mol−1 for the Si–O cleavage. However, the experimentally reported Gibbs free energy barriers for both pathways are very similar: 20.4 kcal mol−1 for the Si–C pathway vs. 20.7 kcal mol−1 for the Si–O one.8 Note that comparison between the calculated and experimental barriers should be taken with caution for reaction II since the activation barriers for each pathway were determined from the individual rate constants which were in turn estimated by combining the global apparent first-order rate constant and the product concentration ratio [PC]/[PO] determined from gas chromatography-mass spectrometry experiments.8 Nevertheless, it is quite surprising that very similar Gibbs free energies of activation were obtained in the experiments for the Si–C cleavage in reaction I (21.5 kcal mol−1 and 20.1 kcal mol−1)7,29 and Si–C (20.4 kcal mol−1) and Si–O (20.7 kcal mol−1) cleavages in reaction II,8 while our calculations suggest somewhat larger barriers for reaction II. Moreover, the experimental activation enthalpies reported for the Si–C cleavage are 9.3 and 7.2 kcal mol−1 for reaction I, very similar to the value reported for reaction II, 8.1 kcal mol−1, while for the Si–O cleavage the reported value is smaller, 5.5 kcal mol−1. This is quite unexpected since the Si–O bond is less reactive than the Si–C one, meaning that the Si–O bond is stronger,30 as reflected by the respective bond lengths in RII where Si–C is 1.850 Å and Si–O is 1.694 Å. Our calculations, in contrast, follow the expected trend, where the barriers for Si–O cleavage are larger than for Si–C scission. Another result that further supports the reaction profiles obtained in our calculations is the barrier to the first transition state TS1. We obtain a larger barrier for the nucleophilic attack of the Si–O cleavage pathway in reaction II (19.2 kcal mol−1) and very similar barriers for reaction I and the Si–C cleavage pathway of reaction II (14.7 vs. 15.6 kcal mol−1), which is reasonable given that there is a major steric hindrance posed by the tert-butyl substituent in the Si–O pathway.
The calculated reaction profile we have obtained for the reaction taking place in normal conditions outside the cavity lays the ground for future works trying to understand the more complex situation of how the reaction is modified in VSC experiments. Up to now, the only attempt to propose a reaction profile assigned either a more associative or dissociative-like mechanism to the bare and VSC cases based on the comparison of the relative magnitudes and signs of the experimentally determined ΔH‡ and TΔS‡ values.7,8,29
Having discussed the reaction profile for the non-cavity situation, we will now analyze the normal modes of vibration of the reactants RI and RII that were coupled to cavity modes in VSC experiments. On the one hand, we would like to point out that there are several works claiming that VSC modifies chemical reactions in a site-selective manner, meaning that reaction rates are only modified when a specific molecular vibration involved in the reaction coordinate is coupled to the cavity mode forming polaritons.7,8,29,31,32 On the other hand, since there is no theoretical explanation of the mechanism yet, it is not understood whether this is true.20,22–24 However, the phenomenological evidence for it relies on the correct identification of vibrational modes in the experimental IR spectra.
The first report on a reaction modified under VSC was for reaction I, which was slowed down by a factor of up to 5.5 when an intense IR double peak of RI at 860 cm−1 was coupled to a Fabry–Pérot cavity mode.7 This vibration was assigned to the reactant Si–C(sp) stretching bond, a bond that is broken during the course of the SN2 reaction. However, the IR bands of closely related molecules reported in the literature are inconsistent with this assignment. In particular, the IR spectrum of methylsilane (CH3SiH3) has the Si–C(sp3) stretching peak at 700 cm−1 and the CH3 rocking mode at 868 cm−1,33 while that of silylacetylene (SiH3CCH), where the silicon atom is directly bonded to an sp carbon atom, just like in RI, has the Si–C(sp) stretching at 659 cm−1.34 This data and other reference values reported in the literature suggest that the band at ∼860 cm−1 would therefore correspond to a rocking mode of the methyl groups in RI,35–37 a vibration unrelated to the bonds broken or formed along the SN2 reaction. To clarify this point we calculated the IR spectrum of RI shown in Fig. 3, which is in very good agreement with the experimental one where the intense double peak at ∼860 cm−1 is clearly visible. According to our calculations, CH3 rocking modes are mostly responsible for the intense double peak at ∼860 cm−1, in line with the IR spectrum of methylsilane.33 Note that the Si–C stretching mode is not trivial to characterize since there are examples in the literature where an originally assigned Si–C stretching vibration corresponds actually to a CH3 rocking mode.38
 | ||
| Fig. 3 (a) Calculated IR spectrum of RI at the B3LYP/6-31+G(d,p) level in methanol (inset highlighted in grey). (b) Relative normalized Cartesian displacements (ΔΔr in the text) between the silicon and sp carbon atoms in RI along the Si–C(sp) bond axis. | ||
While for simplicity, a unique character is often assigned to each normal mode of vibration of a given molecule, these can be highly mixed among different chemical groups, demanding a more detailed analysis.39,40 Accordingly, to quantify the Si–C(sp) stretching contribution in each mode we analyzed the relative normalized Cartesian displacements between the silicon and sp carbon atoms along the Si–C(sp) bond axis, ΔΔrij = |(Δri − Δrj)·![[r with combining circumflex]](https://www.rsc.org/images/entities/b_i_char_0072_0302.gif) ij with i = Si and j = C(sp), as shown in Fig. 3. In this expression, Δri refers to the Cartesian displacement vector normalized to unit distance of atom i for a given normal mode of vibration. In addition, ij is the unitary vector connecting atoms i and j, i.e. the two atoms whose relative displacement in each normal mode of vibration we wish to analyse. The mode with the largest relative displacement between the Si and C(sp) atoms corresponds to the C
ij with i = Si and j = C(sp), as shown in Fig. 3. In this expression, Δri refers to the Cartesian displacement vector normalized to unit distance of atom i for a given normal mode of vibration. In addition, ij is the unitary vector connecting atoms i and j, i.e. the two atoms whose relative displacement in each normal mode of vibration we wish to analyse. The mode with the largest relative displacement between the Si and C(sp) atoms corresponds to the C![[triple bond, length as m-dash]](https://www.rsc.org/images/entities/char_e002.gif) C stretching mode (9) calculated at 2240 cm−1, and therefore has no Si–C(sp) stretching contribution since such large relative displacement is due to the fact that the Si–CC fragment is linear, i.e. if the CC fragment vibrates, the Si–C relative distance is modified but not due to a Si–C stretching. However, combining the ΔΔr value with the visualization of the modes can provide very useful information (Table S5, ESI†). For instance, the fact that several modes (1–4, 7 & 8 in Fig. 4) have non-vanishing ΔΔr values indicates the highly mixed nature of RI's vibrations and that one cannot simply think in terms of a neat isolated Si–C(sp) stretching mode. The double peak at ∼860 cm−1 that we are particularly interested in is due to modes 5 & 6, both corresponding to CH3 rocking motions and therefore with null ΔΔr, and mode 7, which corresponds to CH3 rocking coupled to the Si–C(sp) stretching. Note however that this mode has the smallest ΔΔr value, while mode 3 located at 639 cm−1 has one of the largest ΔΔr values, together with mode 4, and matches very well the Si–C(sp) stretching reported for silylacetylene at 659 cm−1.34 From this analysis we can conclude that, despite the strong mixing between vibrations on different fragments of RI, the double peak at 860 cm−1 is mainly due to CH3 rocking modes with a minor Si–C(sp) stretching contribution, and therefore calls into question the simple picture that VSC experiments only modify chemical reactions when vibrations that are directly related to bond breaking processes of the reaction mechanism are strongly coupled to cavity modes.
C stretching mode (9) calculated at 2240 cm−1, and therefore has no Si–C(sp) stretching contribution since such large relative displacement is due to the fact that the Si–CC fragment is linear, i.e. if the CC fragment vibrates, the Si–C relative distance is modified but not due to a Si–C stretching. However, combining the ΔΔr value with the visualization of the modes can provide very useful information (Table S5, ESI†). For instance, the fact that several modes (1–4, 7 & 8 in Fig. 4) have non-vanishing ΔΔr values indicates the highly mixed nature of RI's vibrations and that one cannot simply think in terms of a neat isolated Si–C(sp) stretching mode. The double peak at ∼860 cm−1 that we are particularly interested in is due to modes 5 & 6, both corresponding to CH3 rocking motions and therefore with null ΔΔr, and mode 7, which corresponds to CH3 rocking coupled to the Si–C(sp) stretching. Note however that this mode has the smallest ΔΔr value, while mode 3 located at 639 cm−1 has one of the largest ΔΔr values, together with mode 4, and matches very well the Si–C(sp) stretching reported for silylacetylene at 659 cm−1.34 From this analysis we can conclude that, despite the strong mixing between vibrations on different fragments of RI, the double peak at 860 cm−1 is mainly due to CH3 rocking modes with a minor Si–C(sp) stretching contribution, and therefore calls into question the simple picture that VSC experiments only modify chemical reactions when vibrations that are directly related to bond breaking processes of the reaction mechanism are strongly coupled to cavity modes.
 | ||
| Fig. 4 Normal modes of vibration of RI with non-vanishing Si–C stretching contribution. All unit-normalized vectors have been scaled by a factor of five for visualization purposes. Color code: carbon in grey and silicon in wheat. | ||
The second work demonstrating modification of chemical reactions under VSC showed site selectivity for reaction II, in the sense that the ratio between two possible reaction products was modified.8 The experiments were carried out by coupling a Fabry–Pérot cavity mode to an IR peak of RII at either (i) 842 cm−1, assigned to Si–C stretching; (ii) 1110 cm−1, assigned to Si–O stretching; or (iii) 1250 cm−1, assigned to CH3 bending modes of Si(CH3)3. Interestingly, although RII can undergo two competing SN2 reactions corresponding to either Si–C or Si–O cleavage, the relative concentration of products PC or PO under VSC to either the Si–C or the Si–O stretching modes was the same. Specifically, the outcome of the experiments was that in normal conditions, i.e. non-cavity experiments, the [PC]/[PO] product concentration ratio was 1.5 while under VSC conditions to either of the IR peaks (i)–(iii) this ratio was inverted to 0.3.
In Fig. 5 we show the calculated IR spectrum of RII, which satisfactorily reproduces the experimental one.8 The broad peak in the 840–880 cm−1 region includes the IR peak (i) of the VSC experiments, while the intense peak at 1092 cm−1 (11) closely matches the experimental peak (ii) at 1110 cm−1. The peak centered at 1288 cm−1 (12–16) clearly corresponds to the experimental IR peak (iii) at 1250 cm−1 despite the slight blue-shift of the calculated value. To analyze the nature of the normal modes of vibration we also calculated the ΔΔr values for Si–C(sp), Si–O and C–O. The plot shown in Fig. 5b for Si–C(sp) is analogous to that obtained for RI in Fig. 3b. The CC stretching mode, now at 2256 cm−1, also appears in this case, and in the range 500–1000 cm−1 there are several modes (1–3 & 10) that appear to have a Si–C(sp) stretching contribution, just like for RI. However, only mode 9 at 871 cm−1 matches the 840–880 cm−1 band, with a quite small ΔΔrSi–C(sp) value (<0.1). From this analysis and the normal mode vectors (Table S6, ESI†) we can conclude that the band in the 840–880 cm−1 region has a negligible contribution from Si–C(sp) stretching and mainly corresponds to CH3 rocking modes, just like for RI. However, in this case the methyl rocking modes are coupled to the Si–O stretching as we will discuss in the following lines. Further analysis of the vibrations with significant ΔΔrSi–C(sp), namely modes 1–3 and 10, reveals that the Si–C(sp) stretching is mode 3 shown in Fig. 6, at 626 cm−1, in line with that calculated for RI at 639 cm−1 and the one reported in the literature for silylacetylene at 659 cm−1.34 Note that the RII modes at 862, 862 and 871 cm−1, labeled 7, 8, and 9, are analogous to those in the inset of Fig. 3a for RI at 863, 864, 875 cm−1 (modes 5–7), while the new modes 5 and 6 of RII appear due to the presence of the Si–O bond, and they both correspond to the Si–O stretching coupled to CH3 rocking from the SiMe2 fragment.
 | ||
| Fig. 5 (a) Calculated IR spectrum of RII at the B3LYP/6-31+G(d,p) level in methanol (inset highlighted in grey). (b–d) Relative normalized Cartesian displacements between the Si–C(sp), Si–O, and C–O pairs of atoms of RII along their respective bond axis. | ||
 | ||
| Fig. 6 Normal modes of vibration of RII corresponding to the Si–C, Si–O and C–O stretching. All unit-normalized vectors have been scaled by a factor of five. Color code: carbon in grey, silicon in wheat and oxygen in red. | ||
Regarding the sharp peak centered at ∼1100 cm−1, labelled as mode 11, our calculations suggest that it corresponds to the C–O stretching (Fig. 6), contrary to the experimental VSC work which assigned this peak to the Si–O stretching.8 Our designation is supported by the ΔΔrSi–O values shown in Fig. 5 and the vectors of modes 4, 5 (Fig. 6) and 6 that clearly show they correspond to the Si–O stretching coupled to CH3 rocking of the SiMe2 fragment. Note that the ΔΔrSi–O value of mode 11 is not due to an explicit Si–O contribution, but to the fact that when the oxygen atom moves along the C–O bond axis in the C–O stretching mode, it causes a non-vanishing ΔΔrSi–O. Our results are consistent with reference values reported in the literature for the Si–O–C fragment, where the presence of a very intense band in the IR spectrum at ∼1100 cm−1 is well established, together with varying intensity bands in the 620–840 cm−1 region. In the majority of the compounds, the former is attributed to the unsymmetric stretching of the Si–O–C group, with the C–O stretching being the main contribution, and the latter to the symmetric stretching of Si–O.41 We also calculated the IR spectrum of products PO and PC from the SN2@Si step, as well as their protonated counterparts which are the final products of reaction II, POH and PCH. For PC and PCH we found one mode that is clearly the Si–O stretching vibration and is located at ∼760 cm−1, in line with mode 4 of RII at 771 cm−1 which has the main Si–O stretching contribution. The calculated frequencies for the C–O stretching of the four products lie in the range 1040–1130 cm−1 (Table S7, ESI†). This is a further indication that the IR peak of RII at ∼1100 cm−1 is due to the C–O stretching, and given that POH does not have a Si–O bond, this could be readily verified experimentally.
Further VSC experiments were carried out for reaction II with the aim to couple to the C–O stretching mode of RII.8 Given that methanol and THF were used as solvents, the peak assigned to the C–O stretching mode of RII at 1045 cm−1 belonged to a broad IR band covering the 1020–1080 cm−1 region. As we have already discussed, according to our calculations, the C–O stretching mode of RII corresponds to the intense peak at 1100 cm−1 which was originally thought to be the Si–O stretching mode, and therefore, the VSC experiments performed at 1045 cm−1 were probably under VSC only with solvent molecules and not with RII. We have calculated the IR spectrum of the solvents employed in the experiments. The C–O stretching mode of methanol is found to be at 1028 cm−1 while in THF, this mode is split in two, the antisymmetric stretching peak of lower intensity at 922 cm−1 and a more intense symmetric stretching peak at 1080 cm−1. These values are in very good agreement with the experimental IR spectrum of the solvent given that the splitting of the peak in THF is clearly visible, with a broad less intense band just above 900 cm−1.8
To summarize our results, band (i) in the 840–880 cm−1 region, which was originally assigned to the Si–C stretching,8 corresponds in fact to the Si–O stretching coupled to CH3 rocking, with a small Si–C stretching contribution from mode 9. The main Si–C stretching is found to be mode 3 at 626 cm−1. Furthermore, the intense sharp peak (ii) at ∼1100 cm−1 which was originally assigned to the Si–O stretching8 corresponds to the C–O stretching, a mode that is unrelated to any bond-breaking process of reaction II. Despite the discrepancies between our calculations and the experimentally assigned nature of bands (i) and peak (ii), our calculations are in agreement with the original assignment of peak (iii) at ∼1300 cm−1 to bending modes of Si(CH3)3.8 In particular, this band arises from five modes corresponding to CH3 umbrella bending, three of which belong to those of the Si(CH3)3 fragment bonded to the sp carbon atom, and the other two correspond to the those of the Si(CH3)2 fragment bonded to the oxygen atom.
Our analysis shows that certain vibrations, e.g. Si–C and Si–O stretchings, are strongly mixed between different fragments in RI and RII, reflecting the well-known complexity of molecular vibrations when one moves away from simplified academic highly symmetrical molecules.39,40 Therefore, one must be cautious in VSC experiments when selecting an IR peak to couple to a cavity mode. We further mention that in typical experiments, it is highly probable that more than one molecular vibration is resonant with a cavity mode, given that Fabry–Pérot cavities possess several approximately equally spaced modes and that organic molecules display numerous intense IR peaks. This was the case for instance in the VSC experiments of reaction I, where higher-order cavity modes were also in resonance with other vibrations of RI as well as the solvent, leading to the possibility that the experiments were carried out under VSC to several molecular vibrations. The original paper already pointed out that there was a higher order cavity mode (the fifth) coupled to the CC stretching mode at 2160 cm−1.7 Additionally, an IR double peak of RI at ∼1290 cm−1 was also in resonance with the third cavity mode, and furthermore, a stretching band of methanol at ∼3000 cm−1 was exactly on resonance with the seventh cavity mode.7 Bearing in mind that in a recent work, the solvent, ethyl acetate, has been attributed to be responsible for the catalysis of an ester hydrolysis when its C![[double bond, length as m-dash]](https://www.rsc.org/images/entities/char_e001.gif) O stretching bond was under vibrational strong coupling,25 this suggests the possibility that the effects observed in the original VSC paper7 are due to coupling with the employed solvent, methanol, in particular, considering that: (i) the basic ester hydrolysis in this recent work proceeds in a similar manner to the reaction studied herein, initiated by a fluoride nucleophilic attack,25 and (ii) the solvent is a mere spectator in the ester hydrolysis but in reaction I, methanol is responsible for protonating the acetylide anion after the nucleophilic attack, thus playing a more active role in the reaction mechanism. Despite this recent work where the reaction was catalyzed by VSC to the solvent, experiments of reaction II under VSC to solvent C–O stretching modes however did not show any modification of the reaction rate nor [PC]/[PO] product ratio.8 To answer this apparent contradiction and assess the role of the solvent in reactions under VSC, further experiments are highly desired for the field to advance.
O stretching bond was under vibrational strong coupling,25 this suggests the possibility that the effects observed in the original VSC paper7 are due to coupling with the employed solvent, methanol, in particular, considering that: (i) the basic ester hydrolysis in this recent work proceeds in a similar manner to the reaction studied herein, initiated by a fluoride nucleophilic attack,25 and (ii) the solvent is a mere spectator in the ester hydrolysis but in reaction I, methanol is responsible for protonating the acetylide anion after the nucleophilic attack, thus playing a more active role in the reaction mechanism. Despite this recent work where the reaction was catalyzed by VSC to the solvent, experiments of reaction II under VSC to solvent C–O stretching modes however did not show any modification of the reaction rate nor [PC]/[PO] product ratio.8 To answer this apparent contradiction and assess the role of the solvent in reactions under VSC, further experiments are highly desired for the field to advance.
Conclusions
To conclude, we have calculated the mechanism of the SN2@Si reactions I and II modified in VSC experiments and found that in the normal situation, i.e. non-cavity, the breaking of the Si–C and Si–O bonds are the rate determining steps, with an effective Gibbs free energy barrier of 17.8 kcal mol−1 (reaction I), and 21.1 and 24.4 kcal mol−1 for the Si–C and Si–O cleavage pathways (reaction II), respectively. These values are consistent with the experimentally reported Gibbs free energy barriers.7,8,29 We have also analyzed the normal modes of vibration of RI and found that the Si–C(sp) bond stretching, originally assigned to the 860 cm−1 intense double peak of the IR spectrum,7 highly couples to other vibrations of the phenyl and CH3 modes. Our results as well as frequencies of closely related molecules suggest that the mode with the largest Si–C(sp) stretching contribution is located in the ∼650 cm−1 region. Analogous results are obtained for the Si–C(sp) stretching of RII. In particular, the Si–C(sp) stretching is “purer” in this molecule and can be clearly assigned mainly to one mode located at 626 cm−1. Moreover, we find that the strong intense IR peak of RII at ∼1100 cm−1 corresponds to the C–O stretching vibration and not to the Si–O one as assigned in the original experimental work.8 In turn, we find that the ∼840–880 cm−1 band assigned to the Si–C(sp) stretching in fact corresponds to Si–O stretching coupled to methyl rocking modes. Finally, our results also indicate that those experiments that aimed to be under VSC to the C–O stretching mode of RII and the solvents were presumably under VSC only with solvent molecules given that the C–O stretching vibration of RII was not properly assigned.The main conclusion of our work is that, in order to be able to manipulate, and especially, catalyze, chemical reactions with VSC in a controlled manner, the requisite of resonance effects on the modification of reaction rates must be addressed in detail, in particular, given that several vibrations of the reactant as well as the solvent were coupled to cavity modes in the original VSC experiments.7,8 Moreover, the role of the solvent needs to be specifically assessed considering the following inconclusive outcomes: (i) the rate of reaction I was modified when the experiments were carried out under VSC to the reactant, but simultaneously, a higher-order cavity mode was also in resonance with a stretching band of the solvent (methanol), something which has never been pointed out,7 (ii) the rate of reaction II was not modified when carried out under VSC with the solvent,8 (iii) there is a recent work where a similar organic reaction is catalyzed under VSC to the solvent.25 Our results demonstrate that there are several open questions about the possible mechanism of cavity-modified ground-state chemical reactions under vibrational strong coupling, and that additional experiments are necessary to begin answering these questions, especially in the absence of a theoretical explanation of the mechanism.
Conflicts of interest
There are no conflicts to declare.Acknowledgements
This work was funded by the European Research Council through Grant No. ERC-2016-StG-714870 and the Spanish Ministry for Science, Innovation, and Universities-Agencia Estatal de Investigación through Grant No. RTI2018-099737-B-I00, PCI2018-093145 (through the QuantERA program of the European Commission), and MDM-2014-0377 (through the María de Maeztu program for Units of Excellence in R&D).Notes and references
- S. S. Shaik, H. Bernhard Schlegel and S. Wolfe, Theoretical Aspects Of Physical Organic Chemistry: The SN2 Mechanism, Wiley, New York, 1992 Search PubMed.
- T. A. Hamlin, M. Swart and F. M. Bickelhaupt, ChemPhysChem, 2018, 19, 1315–1330 CrossRef CAS.
- A. P. Bento and F. M. Bickelhaupt, J. Org. Chem., 2007, 72, 2201–2207 CrossRef CAS.
- M. A. van Bochove and F. M. Bickelhaupt, Eur. J. Org. Chem., 2008, 649–654 CrossRef CAS.
- A. P. Bento and F. M. Bickelhaupt, Chem. – Asian J., 2008, 3, 1783–1792 CrossRef CAS.
- M. V. J. Rocha, N. W. G. Smits, L. P. Wolters, A. de Cózar, C. Fonseca Guerra, T. C. Ramalho and F. M. Bickelhaupt, Int. J. Mass Spectrom., 2017, 413, 85–91 CrossRef CAS.
- A. Thomas, J. George, A. Shalabney, M. Dryzhakov, S. J. Varma, J. Moran, T. Chervy, X. Zhong, E. Devaux, C. Genet, J. A. Hutchison and T. W. Ebbesen, Angew. Chem., Int. Ed., 2016, 55, 11462–11466 CrossRef CAS.
- A. Thomas, L. Lethuillier-Karl, K. Nagarajan, R. M. A. Vergauwe, J. George, T. Chervy, A. Shalabney, E. Devaux, C. Genet, J. Moran and T. W. Ebbesen, Science, 2019, 363, 615–619 CrossRef CAS.
- J. Feist, J. Galego and F. J. Garcia-Vidal, ACS Photonics, 2018, 5, 205–216 CrossRef CAS.
- R. F. Ribeiro, L. A. Martínez-Martínez, M. Du, J. Campos-Gonzalez-Angulo and J. Yuen-Zhou, Chem. Sci., 2018, 9, 6325–6339 RSC.
- M. Hertzog, M. Wang, J. Mony and K. Börjesson, Chem. Soc. Rev., 2019, 48, 937–961 RSC.
- F. Herrera and J. Owrutsky, J. Chem. Phys., 2020, 152, 100902 CrossRef CAS.
- J. Galego Pascual, Polaritonic Chemistry, Springer International Publishing, Cham, 2020 Search PubMed.
- A. C. Aragonès, N. L. Haworth, N. Darwish, S. Ciampi, N. J. Bloomfield, G. G. Wallace, I. Diez-Perez and M. L. Coote, Nature, 2016, 531, 88–91 CrossRef.
- S. Ciampi, N. Darwish, H. M. Aitken, I. Díez-Pérez and M. L. Coote, Chem. Soc. Rev., 2018, 47, 5146–5164 RSC.
- S. Shaik, R. Ramanan, D. Danovich and D. Mandal, Chem. Soc. Rev., 2018, 47, 5125–5145 RSC.
- S. Shaik, D. Danovich, J. Joy, Z. Wang and T. Stuyver, J. Am. Chem. Soc., 2020, 142, 12551–12562 CrossRef CAS.
- L. Xu, E. I. Izgorodina and M. L. Coote, J. Am. Chem. Soc., 2020, 142, 12826–12833 CrossRef CAS.
- K. Dutta Dubey, T. Stuyver, S. Kalita and S. Shaik, J. Am. Chem. Soc., 2020, 142, 9955–9965 CrossRef CAS.
- J. Galego, C. Climent, F. J. Garcia-Vidal and J. Feist, Phys. Rev. X, 2019, 9, 21057 CAS.
- C. Climent, J. Galego, F. J. Garcia-Vidal and J. Feist, Angew. Chem., Int. Ed., 2019, 58, 8698–8702 CrossRef CAS.
- T. E. Li, A. Nitzan and J. E. Subotnik, J. Chem. Phys., 2020, 152, 234107 CrossRef CAS.
- J. A. Campos-Gonzalez-Angulo and J. Yuen-Zhou, J. Chem. Phys., 2020, 152, 161101 CrossRef CAS.
- V. P. Zhdanov, Chem. Phys., 2020, 535, 110767 CrossRef CAS.
- J. Lather, P. Bhatt, A. Thomas, T. W. Ebbesen and J. George, Angew. Chem., Int. Ed., 2019, 58, 10635–10638 CrossRef CAS.
- I. Fernández, G. Frenking and E. Uggerud, Chem. – Eur. J., 2009, 15, 2166–2175 CrossRef.
- W.-J. van Zeist and F. M. Bickelhaupt, Chem. – Eur. J., 2010, 16, 5538–5541 CrossRef CAS.
- J. N. Harvey, Modeling of Molecular Properties, Wiley-VCH Verlag GmbH & Co. KGaA, Weinheim, Germany, 2011, pp. 17–28 Search PubMed.
- A. Thomas, A. Jayachandran, L. Lethuillier-Karl, R. M. A. Vergauwe, K. Nagarajan, E. Devaux, C. Genet, J. Moran and T. W. Ebbesen, Nanophotonics, 2020, 9, 249–255 CAS.
- Y. R. Luo, Handbook of bond dissociation energies in organic compounds, CRC Press, Boca Raton, 2002 Search PubMed.
- K. Hirai, R. Takeda, J. A. Hutchison and H. Uji-i, Angew. Chem., Int. Ed., 2020, 59, 5332–5335 CrossRef CAS.
- H. Hiura, A. Shalabney and J. George DOI:10.26434/chemrxiv.7234721.v4.
- T. Shimanouchi, J. Phys. Chem. Ref. Data, 1977, 6, 993–1102 CrossRef CAS.
- T. Shimanouchi, Tables of Molecular Vibrational Frequencies. Consolidated Vol. I, National Bureau of Standards, Washington, DC, 1972 Search PubMed.
- T. R. Crompton, Comprehensive Organometallic Analysis, Springer US, Boston, MA, 1987, pp. 283–343 Search PubMed.
- G. Socrates, Infrared and Raman Characteristic Group Frequencies: Tables and Charts, John Wiley & Sons, Ltd, 3rd edn, 2004 Search PubMed.
- L. J. Bellamy, The Infra-red Spectra of Complex Molecules, Springer, Netherlands, Dordrecht, 1975, pp. 374–384 Search PubMed.
- C. A. Canaria, I. N. Lees, A. W. Wun, G. M. Miskelly and M. J. Sailor, Inorg. Chem. Commun., 2002, 5, 560–564 CrossRef CAS.
- C. Herrmann, J. Neugebauer and M. Reiher, New J. Chem., 2007, 31, 818 RSC.
- M. Huix-Rotllant and N. Ferré, J. Chem. Theory Comput., 2016, 12, 4768–4777 CrossRef CAS.
- M. G. Voronkov, Pure Appl. Chem., 1966, 13, 35–60 CAS.
Footnote |
| † Electronic supplementary information (ESI) available: Methods, Fig. S1–S3, Tables S1–S7, xyz coordinates, vibrational modes GIF. See DOI: 10.1039/d0cp04154h |
| This journal is © the Owner Societies 2020 |