 Open Access Article
Creative Commons Attribution 3.0 Unported Licence
Tube to ribbon transition in a self-assembling model peptide system
Axel
Rüter
 *a,
Stefan
Kuczera
 a,
Joakim
Stenhammar
 a,
Thomas
Zinn
 b,
Theyencheri
Narayanan
 b and
Ulf
Olsson
 a
a
aDivision of Physical Chemistry, Lund University, SE-22100 Lund, Sweden. E-mail: axel.rueter@fkem1.lu.se
bEuropean Synchrotron Radiation Facility (ESRF), 38043 Grenoble, France
First published on 6th August 2020
Abstract
Peptides that self-assemble into β-sheet rich aggregates are known to form a large variety of supramolecular shapes, such as ribbons, tubes or sheets. However, the underlying thermodynamic driving forces for such different structures are still not fully understood, limiting their potential applications. In the AnK peptide system (A = alanine, K = lysine), a structural transition from tubes to ribbons has been shown to occur upon an increase of the peptide length, n, from 6 to 8. In this work we analyze this transition by means of a simple thermodynamic model. We consider three energy contributions to the total free energy: an interfacial tension, a penalty for deviating from the optimal β-sheet twist angle, and a hydrogen bond deformation when the β-sheets adopt a specific self-assembled structure. Whilst the first two contributions merely provide similar constant energy offsets, the hydrogen bond deformations differ depending on the studied structure. Consequently, the tube structure is thermodynamically favored for shorter AnK peptides, with a crossover at n ≈ 13. This qualitative agreement of the model with the experimental observations shows, that we have achieved a good understanding of the underlying thermodynamic features within the self-assembling AnK system.
1 Introduction
The use of short peptide molecules as building blocks in materials science has become increasingly popular during the last few decades and their various applications range from cell culture scaffolds or drug delivery systems to photonic crystals and computational devices.1–5 This is, partly, due to their intrinsic biocompatibility and their ability to self-assemble into various structures such as twisted or helical ribbons,6,7 hollow nanotubes8,9 or sheets.10,11 However, to fully utilize the spontaneous self-assembly process, the ability to control the final macromolecular structure by design of the individual building blocks is crucial.12,13 Systematic studies, where small alterations to peptide model systems are made, can be used to gain fundamental thermodynamic understanding of peptide self-assembly and the underlying mechanisms.14Peptide self-assembly is generally considered a complex process governed by a combination of non-covalent interactions,15,16 with the main driving force for aggregation being the hydrophobic interaction.16,17 Typically hydrogen bonding and electrostatic interactions between charged peptides further dictate the final internal ordering of the assemblies.18,19 The relative importance of the interactions will strongly depend on the peptide sequence as well as properties of the surrounding such as temperature, pH and ionic strength. For example, the formation of either twisted ribbons or tubes in various self-assembling peptide systems has been shown to be dependent on the solution pH.20–22 In other systems the same morphological difference was found to depend on solvent polarity23 or peptide sequence.24
The AnK model peptide system studied in this article consists of a chain of n hydrophobic alanine (A) amino acids flanked by a single lysine (K) residue as a head group. The uncapped peptide, therefore, shows a net positive charge at low pH. Its aggregation is mainly driven by hydrophobic interaction between the alanine amino acids.25 Studies varying n have revealed that shorter alanine chains (n = 6) assemble into hollow nanotubes, whereas n = 8, 10 peptides instead assemble into twisted ribbons.25–27 Although the macroscopic aggregate structures vary greatly, detailed analyses have shown that the arrangement of AnK peptides within the aggregates is consistent throughout the peptide family where laminated, antiparallel β-sheets pack in a two-dimensional (2D) oblique crystal lattice regardless of the peptide length.28,29 This high internal ordering is a result of the hydrogen bonds formed between amino acids of neighboring peptides.
In this article we present high quality small- and wide-angle X-ray scattering (SAXS and WAXS, respectively) data which allow us to significantly extend the structural understanding of the two observed morphologies in the AnK system. By identifying the different (free) energy contributions, we have developed an analytical model where we estimate the free energies for the two structures as a function of peptide length. The model takes into account the untwisting away from the optimal β-sheet twist, a surface tension term to account for the available hydrophobic surface area and the different hydrogen bond deformations that occur as the β-sheets adopt to the respective morphologies. These different deformations lead to different scaling behaviors of the total energy as a function of peptide length, resulting in the tube structure being energetically favorable for shorter peptides while the twisted ribbon structure is lower in free energy for longer peptides. The model shows qualitative agreement with experimental data which indicates that we likely have captured the main energy contributions within the AnK peptide system. A fundamental thermodynamic understanding of the free energies associated with the self-assembly process can help increase the success rate in the design of novel self-assembling peptides.
2 Results and discussion
2.1 Structure of peptide aggregates
In the AnK model peptide system the self-assembled structure is dependent on the number of alanine residues in the chain, n, resulting in assemblies of both tubes32,33 and twisted ribbons.25,27 To illustrate this difference, SAXS and WAXS profiles of A6K, A8K and A10K are presented in Fig. 1. The scattering profile of the shorter A6K peptide shows, as expected, the characteristic features from tubular structures.31 Unlike in previous scattering experiments the scattering setup enabled very precise background measurements and, hence, the precise determination of the tube wall thickness of 3.3 nm, corresponding roughly to the length of an extended peptide monomer, lp = 2.5 nm. This verifies, that the peptides stand perpendicularly against the tube surface in a monolayer of laminated β-sheets.34 The polydispersity was determined to be 4%.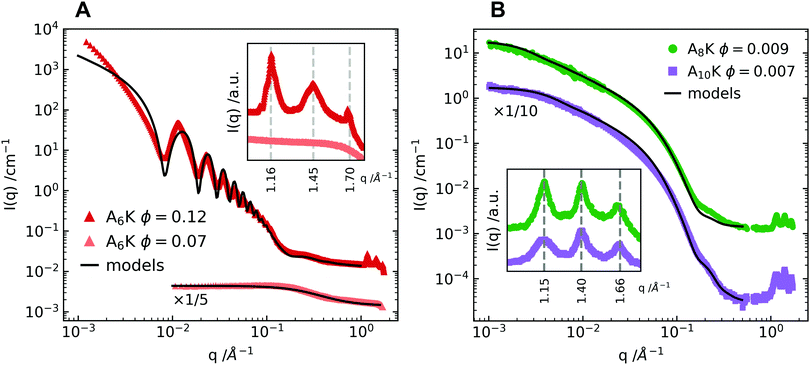 | ||
| Fig. 1 (A) SAXS and WAXS profiles of two concentrations of the A6K peptide above and below the peptide solubility limit. The lower concentration is compared to the theoretical scattering curve of a dispersion of monodisperse Gaussian polymer coils with a radius of gyration, RG = 0.55 nm.30 The higher concentration is compared to a linear combination of the above described polymer coil model and the theoretical scattering curve of hollow tubes with a tube wall thickness of 3.3 nm, a mean core radius of 27.5 nm and a radius polydispersity of 4%.31 The discrepancy between data and model at lower q values is ascribed to the structure factor contribution. (B) Shows SAXS and WAXS profiles of the peptides A8K and A10K. Here the pattern is compared to the theoretical scattering from rigid elliptical cylinders with mean semiaxes 1.8 nm and 3.6 nm for A8K and 2.1 nm and 4.2 nm for A10K. Corresponding polydispersity for the minor elliptical cylinder axis is 15% for both A8K and A10K. No contribution from the solubilized peptide fraction is considered as the solubilities for these peptides are significantly lower than the shorter A6K. In both panels the WAXS patterns are shown in inset, highlighting the striking similarity of the local peptide packing within the observed morphologies. | ||
The scattering data from A8K and A10K peptides are shown in Fig. 1B and are modeled as the scattering from elliptical cylinders.25,27,30 Again, the peptide monomers are organized as a single layer of laminated β-sheets, but with a limited lamination and, thus, a limited number of β-sheets, N ≈ 15. This monodispersity is the result of a trade-off in free energy between the hydrophobic lamination and a stretching deformation from the favorable β-sheet twist.27,35,36 Here we present data with a lower qmin than previous reports, where q is the magnitude of the scattering vector. This enabled a proper length determination of the A8K ribbons, which were found to be roughly twice the length of the ribbons formed from A10K peptides. Corresponding polydispersity of the minor elliptical cylinder axis is 15% for both A8K and A10K.
Much like the critical micellar concentration in a surfactant system, the self-assembly of the AnK peptides takes place above a certain soluble peptide volume fraction, ϕs. At a total peptide volume fraction, ϕtot > ϕs, the sample contains both assembled peptides and freely dissolved peptide monomers, ϕtot = ϕstruct + ϕs. For the longer peptides A8K and A10K, where the peptide solubility is low,25 the solubilized fraction can be neglected. For A6K, on the other hand, this is not possible. In Fig. 1A, the scattering curve for A6K at ϕ = 0.07 is shown together with the model curve for a dispersion of monodisperse Gaussian coils,37 indicating that ϕs ≥ 0.07. Due to this relatively high solubilized fraction, the theoretical model of the A6K tubes at ϕ = 0.12 includes a linear combination of the theoretical scattering from hollow tubes and a dispersion of monodisperse Gaussian polymer coils. This results in a good agreement between the scattering pattern of the tubes and the model in the intermediate to high q regime.
The first maximum of the A6K data shows a more distinguished tooth shape than P(q) for the tube. This suggests a contribution from the structure factor of the tubes, which is expected, as the effective volume fraction of tubes is significantly higher than the volume fraction of peptides in the tube walls. However, there is no indication of further ordered lyotropic structures, such as hexagonal packing: this would show up as a split of the second and third order maxima as has been seen for other hollow peptide tubes.38 The position of the structure factor peak together with the upturn of intensity at low q values with a power law I(q) ∼ q−3 suggests, that parallel oriented tubes are tightly packed in domains rather than homogeneously distributed due to insufficient repulsive stabilization.
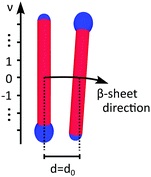
Although the self-assembled structures of the AnK peptides differ significantly, the local peptide packing within the different aggregates is strikingly similar, as seen in the WAXS insets in Fig. 1, where the positions of the Bragg reflections are essentially the same. Moreover, both the tubes and the ribbons have previously been shown to consist of laminated β-sheets.25,29 In a previous study, the Bragg reflections in the twisted ribbons were indexed to an oblique unit cell with the lattice parameters given in Fig. 2, where the β-sheet runs parallel to a.28 A schematic of this unit cell is shown in Fig. 2. The orientation of the β-sheets within the ribbon aggregates was found to be parallel to the ribbon axis as determined by analysis of 2D WAXS patterns from a flow aligned sample.28
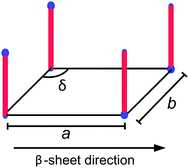 | ||
| Fig. 2 A schematic of the oblique lattice with lattice parameters a = 0.44 nm, b = 0.54 nm and δ = 100° proposed as the 2D crystal unit cell of the peptides in the A8K and A10K twisted ribbons.28 The hydrophobic alanine residues of the peptide are here represented by a red rod, whereas the charges of the N-terminal ammonium and the lysine side chain are represented by a smaller and a larger blue sphere, respectively. | ||
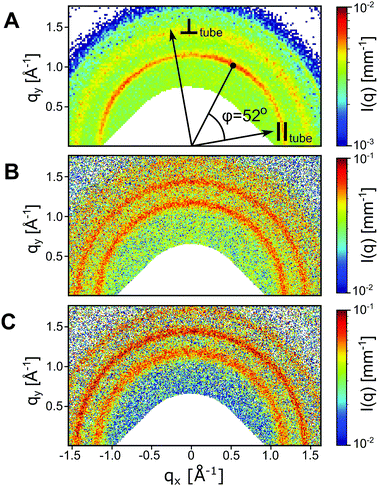
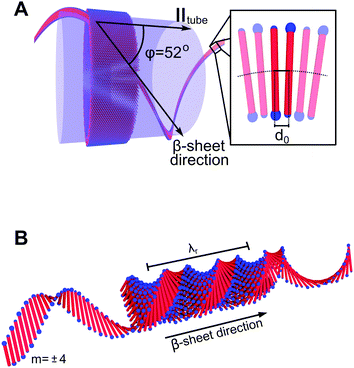
From the similarities between the WAXS patterns the local peptide packing in the tubes and that of the ribbons are assumed to be essentially the same, i.e., in a 2D oblique unit cell.28,29 2D WAXS patterns of all three studied peptide assemblies are shown in Fig. 3. From the alignment of the A6K tubes in the measurement cell, roughly along qx, we conclude that the β-sheets in the tubes must run along the tube surface on a helical path at the pitch angle φ = 52°. A schematic of this is shown in Fig. 4A, where a close-up of the β-sheet shows that this helical path imposes a bending deformation to the β-sheets. We note that this value of φ is different from what has been proposed based on solid state NMR (ssNMR) techniques.34 However, the choice of unit cell parameters in that study do not correspond to the real space distances observed in the WAXS patterns presented here (Fig. 2).
From the scattering curve of the tube system in Fig. 1A, it is evident that the tubes have strikingly uniform diameters, in accordance with previous results from cryo transmission electron microscopy.39 We note, that similar uniformity has also been reported for other systems where small self-assembled molecules form hollow nanotubes.38,40–42
In Fig. 4B we also show a schematic of the twisted ribbons formed from the A8K and A10K peptides, as have been characterized previously.25,27 The twisted peptide ribbons consist of N = (2M + 1) laminated β-sheets, propagating along the ribbon axis.25 Every sheet is indexed symmetrically around the central sheet m = 0 and M is the absolute value of the highest index m in the structure. The ribbons were experimentally found to show a twist pitch, λr = 16 nm, due to the intrinsic chirality of the peptide monomers.27 Whereas the midpoints of all peptides in the central β-sheet (m = 0) fall on a straight line, the outer sheets (m ≠ 0) follow a longer helical path due to the ribbon twist. This increase in path length results in an extensional deformation of the hydrogen bonds along the helical path. In Fig. 4B the outer most β-sheet, m = ±4, has been extended in both directions to highlight the helical path.
2.2 Peptide aggregate thermodynamic model
As shown above, the shorter AnK peptides prefer a hollow tube configuration while the longer instead self-assemble into twisted ribbons. Despite these macromolecular differences the local packing of peptides within the structures are strikingly similar. In the following, we will present a simple model which we use to compare the free energies of the two structures. Following the work of Nyrkova et al.,35,36 we consider three contributions of the free energy: an interfacial energy, a penalty for deviating from a preferred β-sheet twist angle, and a hydrogen bond deformation when the β-sheets adopt to the self-assembled structure.The main driving force for peptide self-assembly in water is generally considered to be the hydrophobic effect.16,17 This hydrophobic interaction drives the formation of β-sheets that aggregate further, forming laminated stacks, due to the hydrophobic interaction between the sheets. Both the A6K nanotubes and the ribbon aggregates of A8K and A10K can be viewed as such laminated β-sheets, as seen in Fig. 4, where the number of laminated β-sheets in the tubes, N, is practically infinite. The interfacial free energy of a β-sheet of length L can be approximated as Gint = γ2Llp, where γ is the water–peptide surface tension and lp is the peptide length, assumed equal to the β-sheet width. By laminating N equally long β-sheets, the number of β-sheet interfaces exposed to water is reduced by a factor N, which is the energetic driving force for the lamination. Using lp = (n + 1)dA, where dA = 0.36 nm is the length of an individual amino acid,43 this interfacial energy contribution to the peptide chemical potential can be written as
 | (1) |
In the final self-assembled structure, hydrogen bonds connect the peptides to form β-sheets.45,46 Depending on the aggregate morphology these hydrogen bonds will experience a deformation from their minimum free energy. For simplicity the angular dependence on the hydrogen bond energy is neglect and each hydrogen bond of the β-sheet is assumed to have a harmonic potential:
 | (2) |
β-Sheets are known to exhibit a left-handed twist looking along the direction of the hydrogen bonds,47,48 with an angle θ between adjacent β-strands. The twist of a long β-sheet can also be quantified by a pitch length, λr = 2πd/θ. Many computational studies have dealt specifically with the twist of β-sheets from polyalanine peptides,49–51 and although the driving force behind this twisting of β-sheets is not fully understood, the existence of a preferred angle, θ0, between adjacent β-strands is well-established. Assuming a harmonic potential, we write the contribution to the chemical potential, due to this twist deformation, as
 | (3) |
The total peptide chemical potential of the aggregates is the sum of the individual free energy contributions μtot = μint + μdef + μtwist. To compare the two structures formed from the AnK peptides we will now estimate the chemical potential in the two structures and how it depends on the peptide length.
Tubular structures can be considered as composed of an infinite number of laminated β-sheets, so that μint = 0, and μtube = μdef + μtwist. As discussed above, there is a bending deformation of the β-sheets as a result of the their helical path around the tube, with an angle φ, as shown in Fig. 4A, and a corresponding pitch length, λt. The β-sheets are bent with a curvature c = R/(R2 + λt2), where R is the tube radius. R and λt are also related to φ as tan![[thin space (1/6-em)]](https://www.rsc.org/images/entities/char_2009.gif) φ = 2πR/λt. The amino acids are labeled with the integer number ν that runs from −n/2 to n/2. In the bent β-sheet d varies with ν as
φ = 2πR/λt. The amino acids are labeled with the integer number ν that runs from −n/2 to n/2. In the bent β-sheet d varies with ν as
| d(ν) = d0(1 + νdAc) | (4) |
The twist angle, θ, is essentially zero in the tube so that μtwist ≈ 0.5ktwistθ02. With these considerations we arrive at
 | (5) |
We have recently analyzed the twisted ribbon aggregates of A8K and A10K.27 The ribbons were experimentally found to be rather monodisperse in width and consist of N ≈ 15 laminated β-sheets.27 The finite value of N can be understood as a compromise between the interfacial energy term, which favors infinite N, and the β-sheet deformation (stretching) term, due to the ribbons being twisted, that opposes lamination and instead favors N = 1.27,35,36 The fact that the ribbons are twisted implies that θ0 ≠ 0 and that ktwist is of significant magnitude compared to the thermal energy. The total chemical potential of the ribbons thus contains three contributions: μribbon = μdef + μint + μtwist.
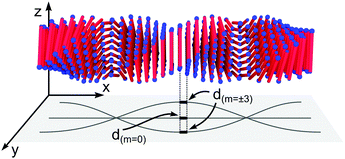
To obtain a simple expression for μdef, the β-sheets are labeled with the integer m that runs from −(N − 1)/2 to (N − 1)/2. Furthermore, the central β-sheet, corresponding to m = 0, is assumed to be undeformed so that d = d0. When m ≠ 0, on the other hand, the center of the β-sheet follows a helical path (Fig. 6), with the radius |m|dlam and the pitch length λr = 2πd0/θ. The pitch length is independent of m, but as the helical radius increases with |m|, so does the β-sheet contour length of a pitch, lc. For this contour length we have lc2 = (2πmdlam)2 + λr2. Thus, for m ≠ 0 the β-sheets are stretched, with a β-strand separation given by
 | (6) |
We then arrive at the following full expression for the peptide chemical potential in a ribbon aggregate
 | (7) |
In the first term, we multiply with (n + 1) because there is no bending, so that d(m) is independent of the position ν along the peptide molecule. We also divide with N, so that μdef is averaged over the different β-sheets in the ribbon.
Having now reached model expressions for μtube and μribbon their relative stability as a function of n can be compared. As can be seen from eqn (7), μribbon increases linearly with the peptide length (n + 1), with an offset given by μtwist. In the expression for μtube (eqn (5)), on the other hand, μdef has a stronger dependence to (n + 1). First of all (d(ν) − d0) = νdAc. This term is further squared and summed over the n + 1 values of ν, implying that μtube approximately scales as (n + 1)3 plus an offset given by μtwist. Comparing the linear scaling of μribbon with the cubic scaling for μtube we thus expect μtube < μribbon for small values of (n + 1) and the opposite to hold for larger values of (n + 1).
To reach a quantitative comparison, we fix the parameters previously presented. A summary of these parameters and their values are presented in Table 1. The values of d0, dlam and dA were determined experimentally, while the surface tension between peptide and water, γ, can be estimated with reasonable accuracy. However, for the parameters kdef, ktwist and θ0, we do not have any reliable estimates. In order to check the accuracy of our model, we do therefore not perform a global analysis, but rather seek the possibility for a set of parameters than can account for both the observed N ≈ 15, and for a tube to ribbon transition reasonably close to the observed n ≈ 7. In doing so, we have first considered the minimization of μribbon to obtain the optimum N and θ (or λr) for given values of γ, kdef, ktwist and θ0. In this procedure we choose θ0 = 11.5° and γ = 6kBT nm−2, and then vary kdef and ktwist to find a free energy minimum for N ≈ 15. There are of course many combinations of kdef and ktwist that satisfy N ≈ 15, but one such combination of values (Table 1), results in θ = 1.7° for the ribbon, corresponding to λr = 90 nm. This value of λr is significantly larger than the value 16 nm suggested from negatively stained TEM experiments.27 However, this experimental value implies an unphysical stretching compared to the ribbon width, in stark contrast to previous studies,52–55 and it is thus likely, that the value λr = 16 nm is underestimated due to the vacuum conditions of the TEM experiments. This is also in qualitative agreement with the computational studies, where longer β-sheets generally are associated with smaller values of θ0.50
| Parameter | Value | Unit | Description |
|---|---|---|---|
| d 0 | 0.4428 | nm | Equilibrium β-strand separation. |
| d lam | 0.5428 | nm | β-Sheet separation. |
| d A | 0.3643 | nm | Amino acid length. |
| l p | Peptide contour length determined by (n + 1)dA. | ||
| λ t | 135 | nm | Helical pitch length of the β-sheet in the tubes. |
| c | 1.4 × 10⁻³ | nm−1 | β-Sheet curvature in the tubes. |
| λ r | 90 | nm | Twist pitch of the β-sheets in the ribbons. |
| l c | β-Sheet contour length in the ribbon; varies across a ribbon. | ||
| N | 15 | Observed number of β-sheets in the ribbon. | |
| φ | 52 | deg | Helical pitch angle of the β-sheet in the tubes. |
| θ 0 | 11.5 | deg | Optimal β-sheet twist angle. |
| θ | 1.7 | deg | Twist angle of the β-sheets in the ribbons. θ ≈ 0 in the tubes. |
| γ | 6 | k B T nm−2 | Surface tension between peptide and water. |
| k def | 1500 | k B T nm−2 | Hydrogen bond spring constant. |
| k twist | 3.0 × 10⁻² | k B T deg−2 | Elastic constant of β-sheet untwisting. |
Using the presented values, we have calculated μribbon and μtube as a function of n, see Fig. 7. From this analysis, we find that μtube < μribbon for n < 13, i.e., a value roughly two times larger than the experimentally observed transition (between 6 and 8). While the parameters can be adjusted to yield a transition at a lower value of n, this semiquantitative agreement with experiments using realistic values of all parameters indicates that our thermodynamic model indeed captures the important ingredients behind the observed tube-to-ribbon transition. The fact that we reach this semiquantitative agreement without including a free energy contribution from electrostatic interactions, even though the peptides are known to exhibit a net positive charge, is interesting. A possible explanation for this could be a change of the protonation state of the peptide monomer upon inclusion in the aggregated structure,56 greatly reducing the charge density of the final aggregates.
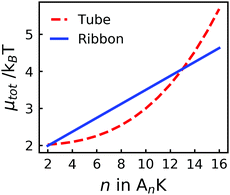 | ||
| Fig. 7 The total chemical potential, μtot, for tubes and ribbons respectively showing a cross-over for n ≈ 13. The parameters used for the calculations are presented in Table 1. | ||
We note that the tube-to-ribbon transition can be viewed as a topological transition from a helical tape to helicoids, which has been analyzed using the toolbox of differential geometry.57–59 In the tube, the β-sheet surface is bent into a cylinder with a mean curvature H = 1/(2R), but the Gaussian curvature K = 0. The helicoid, on the other hand, is a minimal surface and characterized by K < 0.
3 Conclusions
In this paper we have proposed a thermodynamic model for laminated β-sheet aggregates that predicts a transition from hollow tubes to twisted ribbons of finite width, as a function of increased peptide size. Such a transition has been observed experimentally with the alanine rich model peptides AnK.25 Within the model, the transition is associated with different β-sheet deformations, bending and stretching, in tubes and ribbons. The model prediction, that tube formation is favored for smaller peptides, is consistent with the general observation that peptide β-sheet nanotubes mainly form from shorter peptides,20,26,32,38,53,60 where an extreme example is the FF dipeptide.8 This indicates, that the presented thermodynamic model captures the general features of peptide self-assembly and could possibly be extended to deepen the thermodynamic insight into the self-assembled structures of molecules beyond peptide assemblies.4 Experimental section
4.1 Materials
AnK peptides were purchased as trifluoroacetate (tfa) stabilized salts with purities of 95% or higher from CPC Scientific Inc., and used without further purification. Samples were prepared by dissolution of the peptide powder in Milli-Q water. The peptide bulk densities have been previously determined, 1.45 g cm−3, 1.5 g cm−3 and 1.26 g cm−3 for A6K, A8K and A10K, respectively.25,334.2 Methods
SAXS and WAXS experiments were performed on the ID02 beamline at the European Synchrotron Radiation Facility (ESRF).61 The samples were contained in a flow-through capillary cell (diameter ∼2 mm) maintained at 25 °C, which also enabled accurate background measurements from the capillary filled with water as well as flow aligning of the nanotubes. The SAXS sample-to-detector distances were 8 m and 1.2 m and the WAXS detector was positioned at 0.12 m from the sample. The measured two-dimensional scattering patterns were normalized to an absolute intensity scale after applying different detector corrections and azimuthally averaged to obtain the one-dimensional profiles. After subtraction of the corresponding normalized background, one-dimensional profiles from different sample-to-detector distances were merged together to obtain the scattered intensity, I(q), as a function of the magnitude of the scattering vector q = (4π/λ)sin![[thin space (1/6-em)]](https://www.rsc.org/images/entities/char_2009.gif) ϑ/2, with λ the wavelength of the X-rays (≃1 Å) and ϑ the scattering angle. The SAXS data were analyzed using the SasView software.62
ϑ/2, with λ the wavelength of the X-rays (≃1 Å) and ϑ the scattering angle. The SAXS data were analyzed using the SasView software.62
Conflicts of interest
There are no conflicts to declare.Acknowledgements
The synchrotron experiments were performed on beamline ID02 at the European Synchrotron Radiation Facility (ESRF), Grenoble, France. This research is funded by the Knut and Alice Wallenberg Foundation, grant number KAW 2014.0052.Notes and references
- C. E. Semino, J. Dent. Res., 2008, 87, 606–616 CrossRef CAS PubMed
.
- R. G. Ellis-Behnke, Y.-X. Liang, S.-W. You, D. K. C. Tay, S. Zhang, K.-F. So and G. E. Schneider, Proc. Natl. Acad. Sci. U. S. A., 2006, 103, 5054–5059 CrossRef CAS PubMed
.
- K. Y. Lee and D. J. Mooney, Chem. Rev., 2001, 101, 1869–1880 CrossRef CAS PubMed
.
- O. Berger, E. Yoskovitz, L. Adler-Abramovich and E. Gazit, Adv. Mater., 2016, 28, 2195–2200 CrossRef CAS PubMed
.
- X. Zhao, F. Pan, H. Xu, M. Yaseen, H. Shan, C. A. E. Hauser, S. Zhang and J. R. Lu, Chem. Soc. Rev., 2010, 39, 3480–3498 RSC
.
- A. Aggeli, M. Bell, N. Boden, J. N. Keen, T. C. B. McLeish, I. Nyrkova, S. E. Radford and A. Semenov, J. Mater. Chem., 1997, 7, 1135–1145 RSC
.
- G. Wei, Z. Su, N. P. Reynolds, P. Arosio, I. W. Hamley, E. Gazit and R. Mezzenga, Chem. Soc. Rev., 2017, 46, 4661–4708 RSC
.
- M. Reches and E. Gazit, Science, 2003, 300, 625–627 CrossRef CAS PubMed
.
- H. Xu, Y. Wang, X. Ge, S. Han, S. Wang, P. Zhou, H. Shan, X. Zhao and J. R. Lu, Chem. Mater., 2010, 22, 5165–5173 CrossRef CAS
.
- H. Rapaport, G. Möller, C. M. Knobler, T. R. Jensen, K. Kjaer, L. Leiserowitz and D. A. Tirrell, J. Am. Chem. Soc., 2002, 124, 9342–9343 CrossRef CAS PubMed
.
- S. Colfer, J. W. Kelly and E. T. Powers, Langmuir, 2003, 19, 1312–1318 CrossRef CAS
.
- K. Rajagopal and J. P. Schneider, Curr. Opin. Struct. Biol., 2004, 14, 480–486 CrossRef CAS PubMed
.
- G. M. Whitesides and B. Grzybowski, Science, 2002, 295, 2418–2421 CrossRef CAS PubMed
.
- Y. Zhao, W. Yang, C. Chen, J. Wang, L. Zhang and H. Xu, Curr. Opin. Colloid Interface Sci., 2018, 35, 112–123 CrossRef CAS
.
- J. Adamcik and R. Mezzenga, Angew. Chem., Int. Ed., 2018, 57, 8370–8382 CrossRef CAS PubMed
.
- K. A. Dill, Biochemistry, 1990, 29, 7133–7155 CrossRef CAS PubMed
.
- Y. Harano and M. Kinoshita, Chem. Phys. Lett., 2004, 399, 342–348 CrossRef CAS
.
- C. N. Pace, J. M. Scholtz and G. R. Grimsley, FEBS Lett., 2014, 588, 2177–2184 CrossRef PubMed
.
- J. Adamcik and R. Mezzenga, Angew. Chem., Int. Ed., 2018, 57, 8370–8382 CrossRef CAS PubMed
.
- K. Lu, J. Jacob, P. Thiyagarajan, V. P. Conticello and D. G. Lynn, J. Am. Chem. Soc., 2003, 125, 6391–6393 CrossRef CAS PubMed
.
- A. K. Mehta, K. Lu, W. S. Childers, Y. Liang, S. N. Dublin, J. Dong, J. P. Snyder, S. V. Pingali, P. Thiyagarajan and D. G. Lynn, J. Am. Chem. Soc., 2008, 130, 9829–9835 CrossRef CAS PubMed
.
- M. L. Mason, R. F. Lalisse, T. J. Finnegan, C. M. Hadad, D. A. Modarelli and J. R. Parquette, Langmuir, 2019, 35, 12460–12462 CrossRef CAS PubMed
.
- Y. Zhao, L. Deng, J. Wang, H. Xu and J. R. Lu, Langmuir, 2015, 31, 12975–12983 CrossRef CAS PubMed
.
- Y. Zhao, J. Wang, L. Deng, P. Zhou, S. Wang, Y. Wang, H. Xu and J. R. Lu, Langmuir, 2013, 29, 13457–13464 CrossRef CAS PubMed
.
- Ç. Ç. Cenker, S. Bucak and U. Olsson, Langmuir, 2014, 30, 10072–10079 CrossRef PubMed
.
- I. W. Hamley, Angew. Chem., Int. Ed., 2014, 53, 6866–6881 CrossRef CAS PubMed
.
- A. Rüter, S. Kuczera, D. J. Pochan and U. Olsson, Langmuir, 2019, 35, 5802–5808 CrossRef PubMed
.
- S. Kuczera, A. Rüter, K. Roger and U. Olsson, ChemPhysChem, 2020, 21, 1519–1523 CrossRef CAS PubMed
.
- V. Castelletto, D. R. Nutt, I. W. Hamley, S. Bucak, Ç. Cenker and U. Olsson, Chem. Commun., 2010, 46, 6270–6272 RSC
.
- J. S. Pedersen, Adv. Colloid Interface Sci., 1997, 70, 171–210 CrossRef CAS
.
- S. R. Kline, J. Appl. Crystallogr., 2006, 39, 895–900 CrossRef CAS
.
- S. Bucak, C. Cenker, I. Nasir, U. Olsson and M. Zackrisson, Langmuir, 2009, 25, 4262–4265 CrossRef CAS PubMed
.
- Ç. Ç. Cenker, S. Bucak and U. Olsson, Soft Matter, 2011, 7, 4868–4875 RSC
.
- D. A. Middleton, J. Madine, V. Castelletto and I. W. Hamley, Angew. Chem., Int. Ed., 2013, 52, 10537–10540 CrossRef CAS PubMed
.
- I. A. Nyrkova, A. N. Semenov, A. Aggeli and N. Boden, Eur. Phys. J. B, 2000, 17, 481–497 CrossRef CAS
.
- A. Aggeli, I. A. Nyrkova, M. Bell, R. Harding, L. Carrick, T. C. B. McLeish, A. N. Semenov and N. Boden, Proc. Natl. Acad. Sci. U. S. A., 2001, 98, 11857–11862 CrossRef CAS PubMed
.
- P. Debye, J. Phys. Colloid Chem., 1947, 51, 18–32 CrossRef CAS PubMed
.
- C. Valéry, M. Paternostre, B. Robert, T. Gulik-Krzywicki, T. Narayanan, J.-C. Dedieu, G. Keller, M.-L. Torres, R. Cherif-Cheikh, P. Calvo and F. Artzner, Proc. Natl. Acad. Sci. U. S. A., 2003, 100, 10258–10262 CrossRef PubMed
.
- Ç. Ç. Cenker, S. Bucak and U. Olsson, Soft Matter, 2011, 7, 4868–4875 RSC
.
- M. Gubitosi, L. Travaglini, M. C. di Gregorio, N. V. Pavel, J. Vázquez Tato, S. Sennato, U. Olsson, K. Schillén and L. Galantini, Angew. Chem., Int. Ed., 2015, 54, 7018–7021 CrossRef CAS PubMed
.
- R. Mizuta, J. M. Devos, J. Webster, W. L. Ling, T. Narayanan, A. Round, D. Munnur, E. Mossou, A. A. Farahat, D. W. Boykin, W. D. Wilson, S. Neidle, R. Schweins, P. Rannou, M. Haertlein, V. T. Forsyth and E. P. Mitchell, Nanoscale, 2018, 10, 5550–5558 RSC
.
- J. Landman, S. Ouhajji, S. Prévost, T. Narayanan, J. Groenewold, A. P. Philipse, W. K. Kegel and A. V. Petukhov, Sci. Adv., 2018, 4, eaat1817 CrossRef PubMed
.
-
G. E. Schulz and R. H. Schirmer, in Principles of Protein Structure, ed. C. R. Cantor, Springer-Verlag, 1979, ch. 5, pp. 65–107 Search PubMed
.
- S. Zeppieri, J. Rodríguez and A. L. López de Ramos, J. Chem. Eng. Data, 2001, 46, 1086–1088 CrossRef CAS
.
- T. P. Knowles, A. W. Fitzpatrick, S. Meehan, H. R. Mott, M. Vendruscolo, C. M. Dobson and M. E. Welland, Science, 2007, 318, 1900–1903 CrossRef CAS PubMed
.
- G. Lamour, R. Nassar, P. H. Chan, G. Bozkurt, J. Li, J. M. Bui, C. K. Yip, T. Mayor, H. Li, H. Wu and J. A. Gsponer, Biophys. J., 2017, 112, 584–594 CrossRef CAS PubMed
.
- C. Chothia, J. Mol. Biol., 1973, 75, 295–302 CrossRef CAS PubMed
.
- D. W. Weatherford and F. R. Salemme, Proc. Natl. Acad. Sci. U. S. A., 1979, 76, 19–23 CrossRef CAS PubMed
.
- K.-C. Chou, M. Pottle, G. Némethy, Y. Ueda and H. A. Scheraga, J. Mol. Biol., 1982, 162, 89–112 CrossRef CAS PubMed
.
- A.-S. Yang and B. Honig, J. Mol. Biol., 1995, 252, 366–376 CrossRef CAS PubMed
.
- L. Wang, T. O'Connell, A. Tropsha and J. Hermans, J. Mol. Biol., 1996, 262, 283–293 CrossRef CAS PubMed
.
- V. Castelletto, I. Hamley, C. Cenker and U. Olsson, J. Phys. Chem. B, 2010, 114, 8002–8008 CrossRef CAS PubMed
.
- V. Castelletto, I. W. Hamley, P. J. F. Harris, U. Olsson and N. Spencer, J. Phys. Chem. B, 2009, 113, 9978–9987 CrossRef CAS PubMed
.
- V. Castelletto, I. W. Hamley, Ç. Cenker, U. Olsson, J. Adamcik, R. Mezzenga, J. F. Miravet, B. Escuder and F. Rodriguez-Llansola, J. Phys. Chem. B, 2011, 115, 2107–2116 CrossRef CAS PubMed
.
- S.-T. Wang, Y. Lin, R. K. Spencer, M. R. Thomas, A. I. Nguyen, N. Amdursky, E. T. Pashuck, S. C. Skaalure, C. Y. Song, P. A. Parmar, R. M. Morgan, P. Ercius, S. Aloni, R. N. Zuckermann and M. M. Stevens, ACS Nano, 2017, 11, 8579–8589 CrossRef CAS PubMed
.
- M. D. Jeppesen, P. Westh and D. E. Otzen, FEBS Lett., 2010, 584, 780–784 CrossRef CAS PubMed
.
- I. A. Nyrkova and A. N. Semenov, Soft Matter, 2010, 6, 501–516 RSC
.
- R. Ghafouri and R. Bruinsma, Phys. Rev. Lett., 2005, 94, 138101 CrossRef PubMed
.
- J. V. Selinger, M. S. Spector and J. M. Schnur, J. Phys. Chem. B, 2001, 105, 7157–7169 CrossRef CAS
.
- C. Valéry, F. Artzner and M. Paternostre, Soft Matter, 2011, 7, 9583–9594 RSC
.
-
T. Narayanan, Small-Angle Scattering, in Structure from Diffraction Methods, ed. D. W. Bruce, D. O'Hare and R. I. Walton, Wiley Online Library, 2014, pp. 259–324 Search PubMed
.
-
M. Doucet, et al., SasView Version 4.1.2, Zenodo DOI:10.5281/zenodo.825675
.
| This journal is © the Owner Societies 2020 |

