
 Open Access Article
 This Open Access Article is licensed under a Creative Commons Attribution-Non Commercial 3.0 Unported Licence
Visualising electrochemical reaction layers: mediated vs. direct oxidation†
Junling
Ma
,
Minjun
Yang
 ,
Christopher
Batchelor-McAuley
and
Richard G.
Compton
*
,
Christopher
Batchelor-McAuley
and
Richard G.
Compton
*
Department of Chemistry, Physical and Theoretical Chemistry Laboratory, University of Oxford, South Parks Road, Oxford OX1 3QZ, UK. E-mail: richard.compton@chem.ox.ac.uk; Tel: +44(0)1865 275957
First published on 22nd May 2020
Abstract
Electrochemical treatments are widely used for ‘clean up’ in which toxic metals and organic compounds are removed using direct or mediated electrolysis. Herein we report novel studies offering proof of concept that spectrofluorometric electrochemistry can provide important mechanistic detail into these processes. A thin layer opto-electrochemical cell, with a carbon fibre (radius 3.5 μm) working electrode, is used to visualise the optical responses of the oxidative destruction of a fluorophore either directly, on an electrode, or via the indirect reaction of the analyte with an electrochemically formed species which ‘mediates’ the destruction. The optical responses of these two reaction mechanisms are first predicted by numerical simulation followed by experimental validation of each using two fluorescent probes, a redox inactive (in the electrochemical window) 1,3,6,8-pyrenetetrasulfonic acid and the redox-active derivative 8-hydroxypyrene-1,3,6-trisulfonic acid. In the vicinity of a carbon electrode held at different oxidative potentials, the contrast between indirect electro-destruction, chlorination, and direct oxidation is very obvious. Excellent agreement is seen between the numerically predicted fluorescence intensity profiles and experiment.
Introduction
In a voltammetric experiment, the current is measured as a function of an applied electrode potential and is used to provide insight and information into the operative electrochemical mechanism. However, the measured current results from the sum of all the operative electrode processes; this can be problematic when a multiplicity of these processes occur in parallel.1 For example, at highly reductive or oxidative potentials outside of the electrochemical window it is possible to electrochemically reduce or oxidise the solvent and/or the electrolyte in addition to any analyte.2,3 Both the solvent and electrolyte are often present in a large excess as compared to the latter. Moreover, oxidation or reduction of the solvent and/or electrolyte can possibly lead to the formation of products that are able to chemically react further either in the solution phase or with the electrode itself.4 However, under such solvent ‘breakdown’ conditions it is often not feasible to delineate the contribution to the current from different electrochemical processes and hence any significant analytically useful information is often not directly attainable from the magnitude of the measured current.In chloride (saline) containing media and at high electrode potentials the oxygen evolution reaction (OER) and chlorine evolution reaction (CER) are both thermodynamically and kinetically favourable.5,6 Under acidic conditions the oxidation of the solvent (water), if it goes to completion, is a four-electron process:7,8
| 2H2O ⇌ O2 + 4H+ + 4e− |
| 2Cl− ⇌ Cl2 + 2e− |
For the oxygen evolution reaction (OER) if the process does not proceed to completion it is possible for other reactive oxygen species to be formed.9 Similarly, for chlorine formation at higher pH the reaction to form hypochlorite becomes competitive.10,11 Overall, which process (OER vs. CER) is dominant is highly sensitive to the experimental conditions, notably the electrode material used, the applied potential, the solution pH and the chloride concentration among other factors.12,13 Both of these reactions are of major industrial value; the OER is at the heart of (photo)electrochemical water splitting14–16 whereas the electrolysis of brines to form chlorine and hydroxide is basis of the chlor-alkali process underpinning the ‘heavy’ chemical industry.17,18 The formation of active chlorine species also has application in electrochemical waste water treatment.19,20 The electrochemical reactor cells used in these industrial processes typically contain stacks of 10–100 cylindrical electrodes to maximise efficiency.20
Due to both the OER and CER reactions occurring in parallel, analytical methods for determining which process is dominant have been developed, including the use of mass spectrometry to analytically assess the concentration of chlorine or oxygen in the vicinity of the electrode. Although successful, the coupling of mass-spectrometry with electrochemistry is not without its complications and often has poor temporal resolution. This recently led Koper et al. to apply the classical rotating ring disc method of Frumkin, Levich et al.21,22 to enable the local chlorine concentration to be analysed,23,24 and so to delineate the conditions under which the OER is favourable over the CER on carbon based electrodes. Similarly scanning electrochemical microscopy (SECM) in sample generation-tip collection (SG-TC) or the redox competition (RC) modes can be used for the visualization of the catalytic activity of materials for chlorine evolution.25
Over recent years there has been renewed interest in the use of optical microscopy techniques26 for studying interfacial electrochemical processes. This work has encompassed, in part, the use of plasmonic imaging, confocal microscopy27 and fluorescence microscopy.28–34 One potential advantage of fluorescence based techniques is that a host of different fluorophores are available and have been developed for use in diverse biological contexts to report on a variety of physical and chemical factors.35–37 Furthermore, molecular fluorophores often comprise large extended aromatic systems and hence tend to be redox active themselves.38 Moreover, recent work by Molina et al. has focused on the theoretical study of electrochemically driven solution phase reactions.39,40
In this paper we provide new physical insights to the two heavily industrialised generic electrochemical mechanisms – direct and mediated oxidation via proof-of-concept for mechanistic visualization using spectrofluorometric electrochemistry to probe the contrasting spatial distributions associated with the two mechanisms. We first report simulation results considering a thin-layer cell consisting of a cylindrical electrode, as commonly deployed experimentally. The simulation result shows distinctively and qualitatively different concentration profiles for the two oxidative mechanisms in operation. The results are validated experimentally using fluorescent dyes to provide in situ optical visualisation for the different electrochemical processes – with excellent agreement with the simulation results. Herein, the simulation results are generalised and may find applications to a wide range of industrial ‘clean-up’ including applications such as wastewater treatments, electro-chlorination and removal of toxic metals.
Experimental section
Chemicals
All chemicals used were purchased from Sigma-Aldrich and used without any further purification. Aqueous solutions were made using deionised water (Millipore, resistivity 18.2 MΩ cm at 25 °C). pH 7 phosphate buffer solutions contained 58 mM Na2HPO4 and 42 mM NaH2PO4. Nitrogen gas (99.998%, BOC Gases plc, Guildford, U.K.) was used to deoxygenate the analyte for ca. 15 minutes until the redox signal arising from dissolved oxygen became negligible, prior to the electrochemical measurements being made.Electrochemical equipment
A glassy carbon (GC) working electrode (radius = 1.5 mm, CH Instruments, TX) and a saturated calomel reference electrode (SCE, +0.242 V vs. SHE, ALS Co. Ltd, Tokyo, Japan) were used for macro-electrode experiments using a computer controlled Autolab potentiostat 30 (Metrohm Auotlab B.V., Utecht, The Netherlands) using the General Purpose Electrochemical System (GPES). A graphite counter electrode was used to complete the three-electrode cell configuration. Prior to experiments, the GC working electrode was polished using alumina of decreasing order of size (1.0, 0.3, 0.05 μm, Buehler, IL, U.K.), washed with ultrapure water and dried with nitrogen.The structure of the thin-layer (ca. 60 μm) cell used for the opto-electrical measurements is shown in the ESI† (Section S1). The thin-layer cell consists of a three-electrode configuration; both working and counter electrodes were carbon fibre wires (radius = 3.5 μm, the length of the carbon fibre working electrode was 0.7 cm, Goodfellow Cambridge Ltd). Another carbon fibre coated with a thin-layer of silver epoxy (RS Components Ltd, U.K.) was used as a pseudo reference electrode. The working and reference electrodes reside in a separate compartment to the counter electrode (see ESI,† Fig. S1) to minimise convection caused by bubble formation at the counter electrode as was found to occur at high electrode potentials. An in-house built potentiostat, described in detail elsewhere, was used to control the electrochemical system and provide synchronization with the microscope camera.41
Microscope and imaging analysis
Fluorescence excitation light source was provided by an EL Series Ultraviolet Hand Lamp with wavelength of 365 nm (UVLS-24, Ultra-Violet Products Ltd, Upland, C.A., U.S.A.). The excitation light source was turned on for (at least) 20 seconds prior to electrochemical experimentation, no photobleaching was observed over the course of this initial illumination or subsequently during the electrochemical experiment. Optical measurements were made on a Zeiss Axio Examiner, A1 Epifluorescence microscope (Carl Zeiss Ltd, Cambridge, U.K.) using a 20× air objective (NA = 0.5, EC Plan Neofluar). The emission filters used were products MF445-45 and MF530-43 (Thorlabs, Ely, U.K.) for PYTS and HPTS experiments respectively. Image acquisition was achieved using a Hamamatsu ORCA-Flash 4.0 digital CMOS camera (Hamamatsu, Japan), providing 16-bit images with 4-megapixel resolution. Images were acquired with an exposure time of 80.00 ms and at 10 frames per second. Zen 2 pro was used for image processing and intensity extraction. See ESI,† Sections S1 and S2 for the schematics of the experimental opto-electrochemical cell and the microscope setup.Simulation
The diffusion equations with coupled homogenous kinetics were solved for the cell geometry using a 2D implicit finite difference method. The simulation program was written in Python and the sparse matrix solver package UMFPACK (as provided as part of SuiteSparse) was used to solve the required equation set.42 Due to the inclusion of second order homogeneous reaction kinetics the problem is weakly non-linear, and the simulation script used a simple iterative Newton–Raphson method43 to solve the numerical problem. The convergence limit of the Newton–Raphson iterations was set as being when the average absolute dimensionless concentration changed by a value of less than 1 × 10⁻⁸ from the previous iteration. This Python script was used for modelling the direct and indirect oxidative mechanisms. The simulated optical responses were visualised using the Matplotlib library. Full simulation times were between 3–5 minutes.Theory
In the following we outline the theory used to describe the mass-transport in the thin-layer opto/electrical cell. Fig. 1(a) depicts a graphic illustration of the opto-electrochemical cell as idealised for the theoretical simulation showing the carbon fibre working electrode supported on a glass substrate. Here the electrode itself has been modelled as hemi-cylinder on a surface. The counter and reference electrodes are remote from the working electrode, outside the field of the imaging and as such are not explicitly considered further. | ||
| Fig. 1 Schematic of (a) opto-electrochemical cell and (b) an example concentration profile surrounding the electrode where the electrode geometry is approximated as a hemi-cylinder with a radius of 3.5 μm. | ||
Assuming the electrode is sufficiently long and extends outside of the field of view then the concentration profile does not vary significantly along the y-axis. Consequently, we only need to consider the concentration profile in the z and x directions as shown in Fig. 1. The whole cell height was considered during the simulation and for the presented simulation results the concentrations are averaged over the z direction. One of the key features of this cell geometry is that near the electrode surface the mass-transport regime, and hence concentration profile, will be radial, however at distances greater than the height of the cell the concentration profile will change to being essentially linear, reflecting the thin-layer nature of the cell. This transition in the concentration profile is observable in the illustrative data shown in Fig. 1. Accordingly, to model this electrochemical cell structure two overlapping concentration grids were used in the numerical simulation. In the vicinity of the electrode, a Ln-Tan-cylinder coordinate system44 was used. The ESI† Section S3 plots this coordinate system and gives further details on the used expanding grid. At distances further away from the electrode (x > twice the cell height) a Cartesian grid system was employed. These two 2D grids were solved independently and fully implicitly. The data transfer across the two overlapping grids, in terms of concentrations, was performed explicitly and sequentially after each grid was solved.
The choice to model the electrode as a hemi-cylinder as opposed to a cylinder arises from the choice to use the Ln-tan cylinder coordinate system for the concentration grid near the electrode surface. The approximation made by assuming the electrode to be a hemi-cylindrical and not cylindrical is only minimal under these conditions, as the diffusion length is in this case generally orders of magnitude greater than the electrode radius for the timescales studied. Consequently, the current and hence the resulting concentration profile is not overly sensitive to the electrode geometry. This fact is easiest exemplified through consideration of the variation of the electrochemical response for an isolated microcylinder electrode, where the current under these conditions is expected to be proportional to the electrode radius to the power of 0.15.45,46 (see ESI,† Section S5 and Fig. S7c). Further details on this simulation procedure are provided in the ESI,† Section S3, including the full details of the used dimensionless parameters.
The redox/chemical reactions for the two oxidative mechanisms under consideration, namely direct and indirect oxidation, are shown below
 | (1) |
 | (2) |
 | (3) |
The interfacial electron transfer kinetics are described using a Butler–Volmer model. Hence the flux j at the interface, is given by
| j = −DO∇cO,0 | (4) |
= −k0![[thin space (1/6-em)]](https://www.rsc.org/images/entities/char_2009.gif) exp(−αθ)cO,0 + k0exp((1 − α)θ)cR,0 exp(−αθ)cO,0 + k0exp((1 − α)θ)cR,0 | (5) |
| ∇c = 0 | (6) |
Note however that since two fully implicit simulation grids are employed in this model that the positions where the grids overlap a Dirichlet boundary condition was employed. At these boundaries, internal to the simulation model, the concentrations were provided by the other grid. This simulation model was used to compare how the concentration profiles of the species differ when the analyte is either oxidised directly at the electrode surface or indirectly by virtue of a product formed by an electrochemical reaction.
Results and discussion
In this section, the simulation results are first discussed demonstrating a distinctive difference in the concentration profiles of a fluorophore (species A in the two reaction mechanisms provided in the previous section) surrounding the electrode depending on which of the two mechanism is operative and so providing insights into how the mechanisms, direct and indirect, may be optically differentiated. Second, experimental mechanistic distinction is validated using two structurally similar fluorophores but of contrasting reactivity. These two fluorophores differ in their reactivity towards chlorine and hence can been used to evidence the presence of this electrode product. Good agreement is seen with the simulation results, thus validating the advantages of the general approach.Simulation results
Most commonly in the electrochemical field the experimentally measured current is used to infer information regarding the thermodynamics and kinetics of the interfacial reaction. However, first, when other interfacial processes occur in parallel, such as is the case during solvent breakdown, it is not necessarily feasible to delineate the current of interest from the other sources. Second, even in the situation where the process of interest is solely occurring at the interface, when a chemical reaction occurs after the electrochemical rate determining step then the measured current will not be sensitive to the occurrence or kinetics of any follow up chemistry. Consequently, it is not uncommon that the experimentalist is essentially ‘blind’ to the chemical processes occurring in the diffusion layer surrounding the electrode. Nevertheless, as will be shown, mechanistic insights can be obtained by studying the concentration profiles of the species. Such concentration profiles are experimentally readily accessible when one or more of the species involved are fluorescent.The aim of this section is first to discriminate between the cases where the species of interest, A, is either oxidised directly at the electrode or indirectly in the solution phase, where the process is mediated and occurs via reaction with a product formed at the electrochemical interface. In the following we assume that species A is fluorescent and can be imaged whereas its oxidation product B is assumed to be not fluorescently active. Dimensionless simulation results are depicted in Section S3 (ESI†); however, in the following to aid comparison to the experiments reported later the data are presented with dimensional values and correspond to the cell used experimentally.
Direct oxidative destruction of fluorophore
We first consider the one electron transfer direct oxidative reaction (eqn (1)), where species A is the fluorescent fluorophore initially present in solution and B is the non-fluorescent oxidative product. This oxidation process is assumed to only occur directly at the electrode surface. At the start of the simulation, the bulk concentration of species A and B are set to 1 mM and zero respectively (DA = 3.85 × 10⁻⁶ cm2 s−1 and DB = 1 × 10⁻⁵ cm2 s−1). The standard electrochemical rate constant, k0, is set to be 104 cm s−1 to ensure electrochemical reversibility; when t > 0, an over-potential (η = 0.5 V) is applied such that the oxidative reaction is mass-transport limited. An example simulated concentration profile of the fluorophore A, as a function of the position in the cell is shown in Fig. 2(a), where a colour map is used to indicate the species concentration as a function of position in the z, x plane. Near the electrode the species A is depleted and moving further away from the electrochemical interface its concentration increases to its bulk value of 1 mM. From this 2D concentration profile, the average concentration of the fluorophore in the z-direction is calculated. Here a value of unity indicates the fluorophore concentration is unaltered from that in the bulk and a value of zero indicates that all of the fluorescently active species has been consumed in the z-axis. The data is presented as these normalised concentration profiles so as to be comparable to the fluorescence intensity profiles, as will be experimentally reported in the second part of the article. The accuracy of this model, averaging the concentration profiles across z direction versus the depth of field of the objective in practice, is discussed in ESI,† Section S4. Full quantitative fitting of the optical data to that of the simulated results would require the microscope's limited depth of field to be accounted for, in the present work the simulation results primarily evidence the marked difference in the concentration profiles arising from the two different chemical mechanisms. | ||
| Fig. 2 Simulated optical response for the direct oxidation mechanism with an applied over-potential (η = 0.5 V) from t = 0. Variation of the normalized concentration of 1 mM species A as a function of distance perpendicular to the electrode. (a) Plot of the variation in the profile as a function of time t = 0 (red), 0.1 (blue), 1 (yellow), 3 (green), 5 (purple) s. Other parameters: DA = 3.85 × 10⁻⁶ cm2 s−1, DB = 1 × 10⁻⁵ cm2 s−1. Inlay depicts the simulated concentration profile of species A at t = 10 s. (b) The normalized concentration profile at 10 s as a function of the fluorophore diffusion coefficient DA = 3.85 × 10⁻⁶ cm2 s−1 (red), 3.1 × 10⁻⁶ cm2 s−1 (blue), 2.8 × 10⁻⁶ cm2 s−1 (yellow) and 2.0 × 10⁻⁶ cm2 s−1 (green); inlay, plot of full-width half minimum of the concentration profile at t = 0 to 10 s. | ||
As shown in Fig. 2(a) for this direct oxidation process, initially at time equals zero the concentration in the cell is uniform. Upon application of a high over-potential the species A becomes depleted at the electrode surface resulting in a decrease in the simulated fluorescence intensity near the electrode surface. As time increases the depth of the minimum in the fluorescence profile increases; however, even after 10 seconds the intensity only decreases to 60% of its original intensity at the position of the electrode (x = 0). The inlay of Fig. 2(a) depicts the concentration profile mapped onto the cell geometry at t = 10 s showing that this non-zero intensity at x = 0 μm reflects the fact that species A is only consumed at the electrode surface. The electrode radius (3.5 μm) is significantly smaller than the thickness of the cell (60 μm) hence the depletion of the reagent A only occurs in the near vicinity of the electrode and above the electrode (in the z-direction) the fluorophore concentration is higher.
The distance over which the fluorophore is consumed is sensitive to the diffusion coefficient of the fluorophore. Fig. 2(b) depicts the variation of the simulated concentration profiles as a function of the diffusion coefficients of the fluorophore A in the range of 2.00–3.85 × 10⁻⁶ cm2 s−1. Also presented in the inlay of Fig. 2(b) is a plot of the full-width half minimum (FWHM) of the minimum in concentration around the electrode as a function of time, giving a measure of the distance over which the material has been consumed.47
It is evident that when the fluorophore is only consumed by a direct electrode redox process, even with the use of a thin-layer cell due to the relative magnitude of the micro-sized wire to the height of the cell, the concentration minima peaks around the centre of the electrode does not reach zero intensity over a very long period of time (even after 10 minutes chronoamperometry the minima is still not predicted to reach zero). This situation arises as a fluorescence intensity of zero would require the complete depletion of fluorophore above the electrode (height of the cell = 60 μm) which is being prevented by the mass transport from the semi-infinite bulk solution in the x axis. Furthermore, the shape of this profile is independent of the concentration of the used fluorophore (see ESI,† Fig. S7a). In addition to the diffusion coefficient as seen in Fig. 2(b), extra factors that affects the concentration of species A (cell thickness, concentration and diameter of electrode) are discussed in ESI,† Section S5.
Mediated destruction of the fluorophore
We next consider the indirect oxidative destruction of the fluorophore A as shown in eqn (2) and (3). In this case, Y and Z are redox active but non-fluorescent; only species Y and A are initially present before the onset of the electrochemical current. Similar to the direct oxidation mechanism, the standard electrochemical rate constant (k0) for the eqn (2) is set to 104 cm s−1 to ensure electrochemical reversibility; similarly, when t > 0, an over-potential (η = 0.5 V) is applied for the oxidative process of (Y–e− → Z) ensuring the process is fully driven and diffusion controlled.The electro-generated product Z can react irreversibly with the fluorescent probe species A in solution to form the non-fluorescent species B. The chemical irreversibility for the homogeneous reaction is ensured by using a very large value of Keq (1010 M−1 was used in the simulation reported below). Fig. 3(a) depicts the variation of the predicted fluorescence profile where the initial concentration of Y is equal to 1.0 mM and the initial concentration of A is varied in the range of 0.25 mM–2.5 μM. As the initial concentration of the electrochemical reagent A is decreased, the ratio of the concentrations of species Y and A, [Y]:[A], is increased. Comparing with species A, the concentration profile of the electrochemical product Z extends further into solution, consequently shifting the reaction front; hence, the fluorescence response arising from the destruction of fluorophore A is significantly altered from that expected for the direct electrochemical reaction, as shown in Fig. 3(a) in effect the species Z ‘titrates’ and fully depletes species A from the electrode vicinity. Notably the depth and width of the fluorescence intensity minimum increases. This occurs as the fluorophore A is consumed not at the electrode surface but rather over a larger volume that extends into the solution away from the electrode. The formation of the redox active reagent Z creates an “exclusion zone” (aka ‘reaction layer’) in the vicinity of the electrode where the occurrence of the homogeneous reaction leads to the concentration of A becoming essentially zero over a large volume in the vicinity of the electrode.
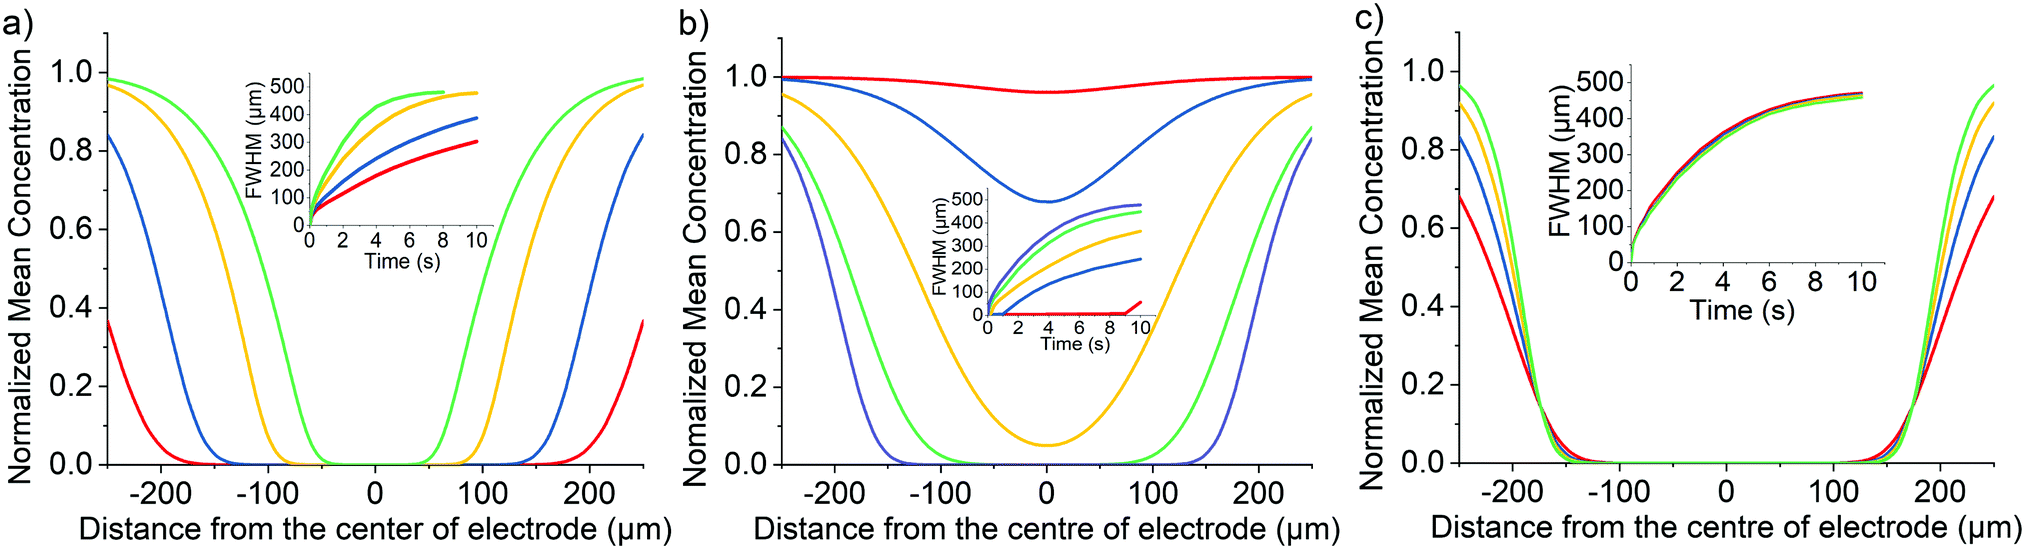 | ||
| Fig. 3 Simulated optical responses for the mediated oxidation mechanism (EC2). Variation of the normalized concentration of species A as a function of distance perpendicular to the electrode. (a) Plot of the variation in the profile at t = 5 s with initial concentration of A, [A]bulk, equals to 0.25 mM (red), 0.13 mM (blue), 25 μM (yellow) and 2.5 μM (green); [Y]bulk = 1 mM, DA = 1 × 10⁻⁵ cm2 s−1 and kf = 1 × 10⁴ L mol−1 s−1; Inlay, plot of full-width half minimum of the concentration profile at t = 0 to 10 s. (b) Plot of the variation in the profile at t = 5 s with formation rate constant, kf, varies from 1 to 1 × 10⁴ L mol−1 s−1. [Y]bulk = 1 mM, [A]bulk = 25 μM and DA = 1 × 10⁻⁵ cm2 s−1; inlay, plot of full-width half minimum of the concentration profile at t = 0 to 10 s. (c) Plot of the variation in the profile at t = 5 s with diffusion coefficient of A, DA, equals to 2 × 10⁻⁵ cm2 s−1 (red), 1 × 10⁻⁵ cm2 s−1 (blue), 6 × 10⁻⁶ cm2 s−1 (yellow) and 3.85 × 10⁻⁶ cm2 s−1 (green); [Y]bulk = 1 mM, [A]bulk = 25 μM and kf = 1 × 10⁴ L mol−1 s−1; inlay, plot of full-width half minimum of the concentration profile at t = 0 to 10 s. Other parameters: DY = DZ = DB = 1 × 10⁻⁵ cm2 s−1, Keq = 1 × 10¹⁰ M−1, k0 = 1 × 104 cm s−1. | ||
The homogeneous reaction between the electrochemical product Z and the fluorophore A leads to the depletion in the simulated fluorescent signal adjacent to the electrode. Consequently, other than the concentration of the reagents, as discussed above, and their mass-transport properties, the rate constant of the reaction between A and Z also influences the shape of the concentration profile. Fig. 3(b) depicts the influence of the homogeneous bimolecular rate constant, kf, on the resulting concentration profile. The dominant effect is that as the homogeneous rate constant is decreased, the consumption of fluorophore A is reduced leading to the magnitude of the minimum in the concentration profile to be smaller. Due to the simulated cell geometry being that of a thin-layer cell, the simulated fluorescence intensity reaches zero in the proximity of the wire electrode providing kf is bigger than ∼250 L mol−1 s−1, reflecting the extent of the reaction layer exclusion zone mentioned above. However, although the depth of the minimum is decreased, the distance over which the reaction occurs is less sensitive to the kf parameter. As can be seen from Fig. 3(b) when the reaction rate constant is greater than approximately 100 M−1 s−1 the depletion of the fluorophore occurs over a distance of ±200 μm of the electrode wire within 5 seconds in a cell with cell height equals 60 μm. To a first approximation the depth of the minimum is controlled by the homogeneous rate constant. However, the distance over which the reaction occurs – the reaction front – predominantly reflects the mass-transport of the reagents and their relative concentrations.
For comparison to the direct process, Fig. 3(c) depicts a series of the simulated concentration profiles as a function of the diffusion coefficients of the fluorophore A in the range of 3.85 × 10⁻⁶–2 × 10⁻⁵ cm2 s−1. Although a slower depletion was observed when lower the diffusion coefficient of A, the mediated oxidation is not as sensitive to the diffusion coefficient of the fluorophore as the direct oxidation case. When the concentration of Y is much greater than the concentration of A, species Z generated is in excess which can then quickly diffuse away from the electrode surface and form an “exclusion zone”. Species A can then react with Z directly in this “exclusion zone” instead of diffusing to the electrode interface.
From the above results it can be seen that the two different electrochemical reaction mechanisms, (i) direct and (ii) mediated, lead to distinctly different concentration profiles and are hence expected to have markedly different fluorescence responses. The sensitivity of the fluorescence response towards the relative and absolute concentration of the fluorophore and the electrochemical product Z (as in these examples reflected in the change in the initial concentration of the starting reagent Y) and the observation of an extended exclusion zone surrounding the electrode is indicative of a mediated reaction mechanism being operative.
Opto-electrochemical experiments: fluorescent dyes
The above simulation investigated how the concentration and hence fluorescence profile is expected to behave in the contrasting situations where the fluorophore is either directly or indirectly consumed by the occurrence of the electrochemical reaction. This article now turns to experimentally validated the contrast and focuses on the study of two structurally related fluorophores shown in Fig. 4(a); 8-hydroxypyrene-1,3,6-trisulfonate (HPTS) and 1,3,6,8-pyrenetetrasulfonate (PYTS). The primary difference between these two molecules is the presence of the hydroxyl group (pKa = 7.2) on the pyrene structure of the HPTS. This hydroxyl group alters both the electrochemical and optical properties of the fluorophore. Both of these molecules are strongly fluorescent; however, the emission wavelengths of the HPTS in water (pH 7.0) are shifted to 512 nm48 as compared to 404 nm49 for the PYTS. Section S6 (ESI) presents the absorbance and fluorescence spectra for these two fluorescent probes. A more marked difference between these two molecules is reflected in their voltammetric behaviour. Fig. 4(b) depicts the voltammetric response of HPTS and PYTS in a pH 7 buffer containing 0.1 M KCl. PYTS is not electrochemically active within the electrochemical window (as shown in Fig. 4b right hand side); in comparison HPTS exhibits two clear voltammetric peaks at 0.46 V and 0.92 V (vs. SCE). The first voltammetric peak at 0.46 V corresponds to the reversible one-electron oxidation of the (HPTS) pyrene, from an overall charge of −3, to the deprotonated radical with an overall charge of −3.50,51 The second peak at 0.92 V is result of a further electron transfer to leading to the formation of a cation, with overall charge of −2, which is proposed to undergo rapid hydrolysis to form a catechol moiety resulting in a third reductive peak near 0.0 V.52 The oxidation is HPTS that of the phenol moiety, not the direct oxidation of the pyrene ring system. Accordingly, no oxidation is seen for PYTS in the electrochemical window (i.e. prior to solvent breakdown). | ||
| Fig. 4 (a) Chemical structure of 8-hydroxypyrene-1,3,6-trisulfonate (HPTS, left) and 1,3,6,8-pyrenetetrasulfonate (PYTS, right) and (b) the corresponding cyclic voltammograms of 1.0 mM HPTS and PYTS are displayed under the chemical structure. Recorded at an unmodified glassy carbon electrode with the scan rate of 50 mV s−1. Both of the analyte solution was degassed, buffered with pH 7 phosphate buffer solution and supported with 0.1 M KCl electrolyte. | ||
Next, we explore the possible chemical reactivity of the PYTS and HPTS fluorophores under homogenous chemical reaction conditions seeking to mimic the OER and CER. Specifically, two reagents were explored: Fenton's reagent (which is known to produce hydroxyl radicals) and chlorine gases which were separately directly added to solutions of each fluorophore and the reaction observed both visually and via UV-Vis spectroscopy.
Fenton's reagent is a solution of hydrogen peroxide (H2O2) with ferrous iron (FeSO4) as a catalyst to generate hydroxyl radicals which might oxidise the fluorophores of interest as follows
| Fe3+ + H2O2 → Fe3+ + HO˙ + OH− | (7) |
| Fe3+ + H2O2 → Fe2+ + HOO˙ + H+ | (8) |
| 2H2O2 → HO˙ + HOO˙ + H2O | (9) |
According to literature, pH 3.0 is the most effective value for the oxidation taking place in the treatment,53 and an excess of H2O2 over phenol a ratio of ca. 8 was used to test the reaction can take place under this ratio.54
Fig. 5 shows the UV-Vis spectra observed after the addition of Fenton's reagents to either PYTS or HPTS for a period of two minutes. No significant changes were observed suggesting that no reaction takes place on the timescales of interest between the selected fluorophores and the radicals (OH and OOH) produced by Fenton's reagent.
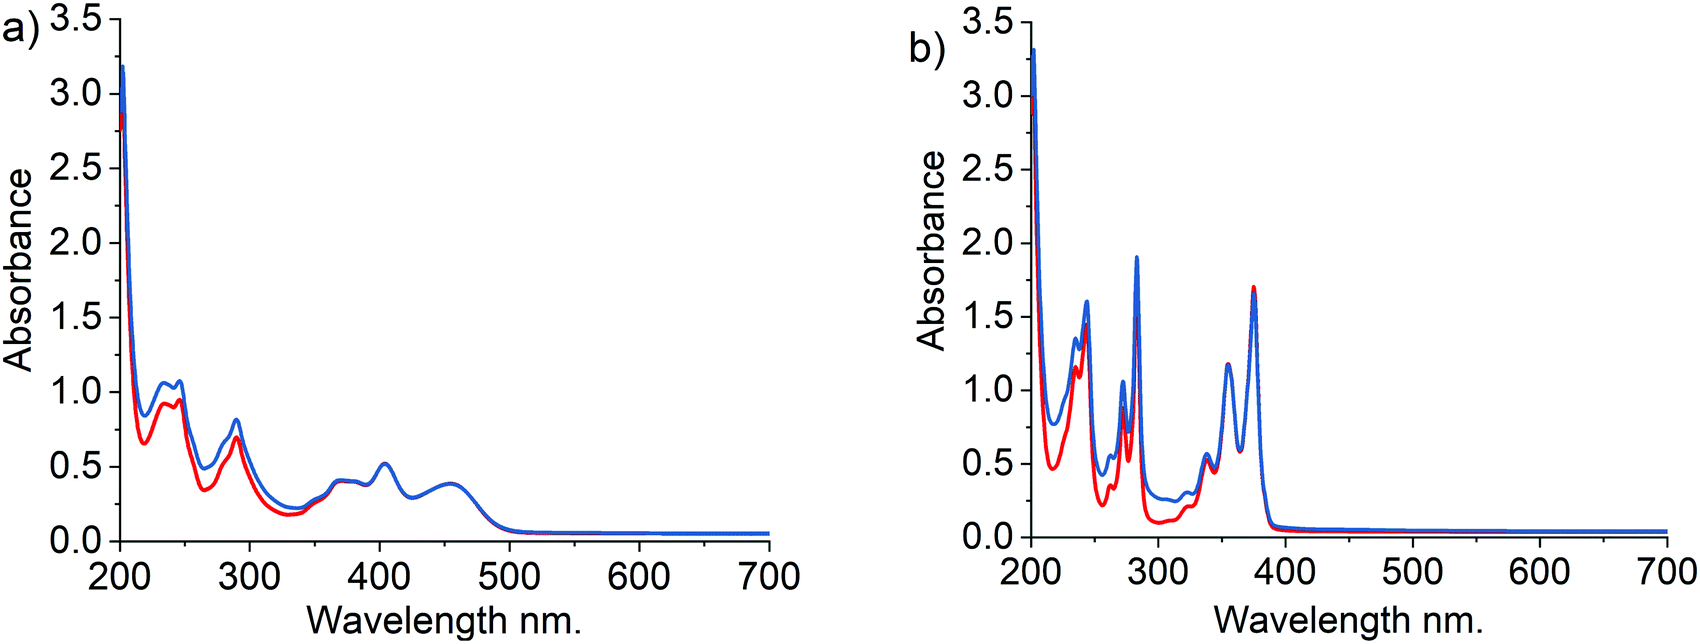 | ||
| Fig. 5 UV-Vis absorbance spectra obtained in 0.1 M KCl pH 3.0 citrate buffered solutions. (a) red line – 31.25 μM of HPTS; blue line – 31.25 μM of HPTS + 0.25 mM H2O2 and 1.11 μM FeSO4. (b) blue line – 31.25 μM of PYTS; blue line – 31.25 μM of PYTS + 0.25 mM H2O2 and 1.11 μM FeSO4. | ||
Chlorine was prepared by dripping concentrated hydrochloric acid on potassium permanganate crystals:55
| 2KMnO4 + 16HCl → 2MnCl2 + 2KCl + 8H2O + 5Cl2 | (10) |
The gas was bubbled through separate solutions of the fluorophores of interest, note that chlorine adsorbs strongly in the near-UV region of the spectrum hence limiting the analytically useful wavelength range. In the case of HPTS, a clear colour change was observed from fluorescent yellow-green to dark brown after the addition of chlorine gas. No changes were seen in the case of PYTS. Fig. 6 shows the corresponding UV-vis spectra measured after two minutes of bubbling. The addition of a similar volume of chlorine gas, measured by glass syringe, to the solutions containing HPTS and PYTS had a dramatically different effect; no spectroscopic peaks of HPTS remained after the addition of chlorine gas (50 mL) where as that of PYTS was unchanged. The two fluorophores, HPTS and PYTS, thus show markedly contrasting reactivity towards chlorine gas. We speculate that the presence of the ring OH group in HPTS activate the molecule towards reaction with chlorine.
 | ||
| Fig. 6 UV-Vis absorbance spectra obtained in 0.1 M KCl pH 7.0 PBS buffered solutions. Background is subtracted from all data. (a) blue line – 31.25 μM of HPTS; yellow line – 31.25 μM of HPTS + 25 mL chlorine gas; green line – 31.25 μM of HPTS + 50 mL chlorine gas; red line – 50 mL chlorine gas. (b) Blue line – 31.25 μM of PYTS; yellow line – 31.25 μM of PYTS + 50 mL chlorine gas; green line – 31.25 μM of PYTS + 100 mL chlorine gas; red line – 50 mL chlorine gas. | ||
The above observation shows that OH and OOH radicals are not capable of destroying either fluorophore whilst chlorine reacts selectively with the HPTS. In the following we explore the response of the fluorophores in the presence of an electrode in aqueous solution held at strongly oxidising potentials under conditions where OH, OOH and Cl2, along with other oxidising species can be expected to be generated. The following two sections experimentally evidence the behaviour of these fluorescent probes in a thin-layer opto-electrochemical cell under oxidising conditions. The cell configuration reflects that used within the theoretical section presented above.
PYTS: direct oxidation
The fluorescence imaging of PYTS was achieved using a fluorescence microscope with a thin-layered cell consisting a cylindrical electrode (r = 3.5 μm) with a cell depth of approximately 60 μm (see ESI,† Sections S1 and S2 for cell and microscope set-up). The imaging conditions are λex = 365 nm and λem = 445 ± 45 nm. Experimentally at t = 0, the potential applied to the working carbon fibre electrode was stepped from 0.0 V to +1.4 V for over a period of 5 seconds. In the second experiment, a higher oxidative potential of +2.3 V was applied to PYTS for 20 seconds. A series of images were taken. A quantitative assessment of the relative concentration profile can be obtained from the microscope image by the measurement of the fluorescence intensity profile across wire. In the present work, the normalized fluorescence intensity profile is used for comparison. To calculate this normalised fluorescence intensity, the fluorescence intensity of the background was subtracted from the raw intensity and then divided by the initial intensity measured before the onset of the reaction. The initial fluorescence intensity was also background corrected.At +1.4 V, no alteration in the fluorescence intensity of the PYTS was optically observed, see Fig. S11 (ESI†), which agrees with the lack of faradaic signal in the voltammetric experiments shown in Fig. 4b even at the potentials near to solvent breakdown (+1.5 V vs. SCE).
At a higher oxidative potential of +2.3 V, however, the PYTS can be seen to be electrochemically oxidised, as evidenced via the changes in the fluorescence intensity shown in Fig. 7. Note that the peak at x = 0 μm is due to the opaque carbon fibre electrode. This oxidation process occurs outside of the solvent voltammetric window; consequently, it is not possible to use the measured current (as would conventionally be done with exclusively voltammetric studies) to infer any information regarding nature of the electrochemical reaction or fate of the fluorophore. In contrast the fluorescence profile is able to directly evidence that, although other processes such as CER are likely occurring in parallel at the electrode surface, the oxidation of the PYTS occurs via a direct oxidation process. This can be concluded on the basis of the fluorescence profile shape and its essential insensitivity to the concentration profile of the fluorophore as shown in Fig. 7 on the basis of the simulations presented above. It was observed that the electrochemical consumption of PYTS only occurs at potentials more positive than approximately +2.0 V. More plots of the variation of the fluorescence intensity profiles as a function of time and the fluorescence microscope images of PYTS are provided in ESI,† Section S7. Next, we conduct comparable experiments to investigate the opto-electrochemical behaviour of the hydroxylated pyrene derivative (HPTS) towards CER.
 | ||
| Fig. 7 Relative intensity profile recorded at t = 5.0 s in a chronoamperometric experiment with a step potential 2.3 V vs. pseudo Ag wire reference electrode, at different concentrations of 0.1 mM (black), 1 mM (red) and 10 mM (blue) of PYTS with pH 7 phosphate buffer solution and 0.1 M KCl as supporting electrolyte. | ||
HPTS: direct versus mediated reactions
Despite HPTS being structurally similar to PYTS, the cyclic voltammetry experiments shown in Fig. 4a demonstrates that HPTS undergoes an overall two-electron direct oxidation at the electrode with the first oxidative peak at +0.46 V and the second at +0.92 V vs. SCE. Fluorescence imaging of HPTS was achieved as above in a microscope setup (λex = 365 nm and λem = 530 ± 43 nm). Experimentally, the potential applied to the working carbon fibre electrode was stepped from 0.0 to +1.2 V to fully drive the direct 2-electron oxidation destruction of HPTS at the electrode. Fig. 8 shows a series of images depicting the change in fluorescence intensity with time. | ||
| Fig. 8 Relative intensity profile recorded at t = 5.0 s in a chronoamperometric experiment with a step potential of 1.2 V (dotted) and 2.3 V (solid lines) vs. pseudo Ag wire reference electrode, at different concentrations of 0.1 mM (black), 1 mM (red) and 10 mM (blue) of HPTS with pH 7 phosphate buffer solution and 0.1 M KCl as supporting electrolyte. | ||
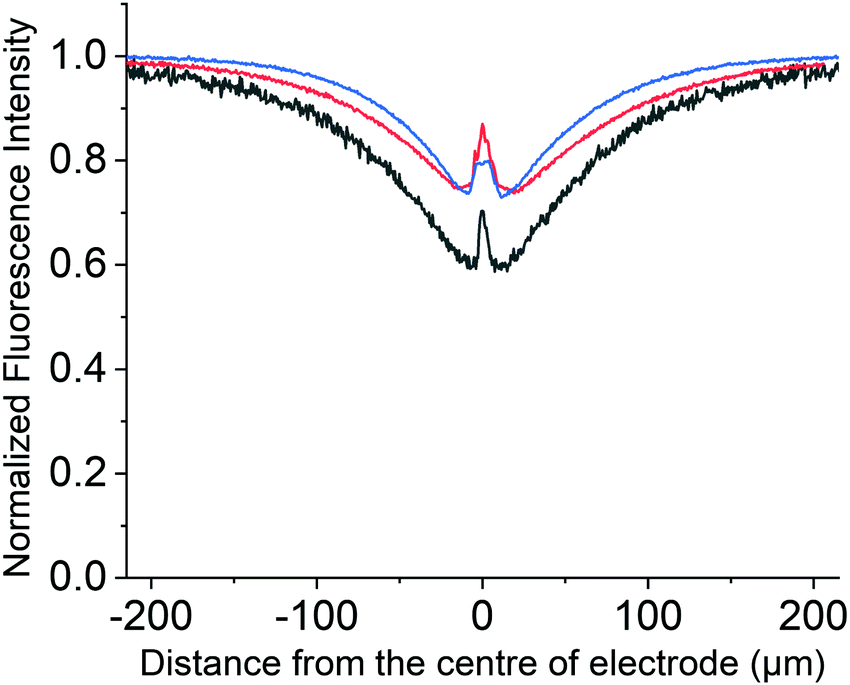
No new fluorescence signals were seen whilst the fluorescence of the fluorophore decreased in the vicinity of the electrode. The fluorescence intensity profiles measured at this lower potential (+1.2 V) as recorded across the wire are shown as dotted lines in Fig. 8. The fluorescence intensity profile in Fig. 8 at t = 5.0 s is shown for three different concentrations: 0.1 (black), 1.0 (red) and 10 mM (blue). Note the peak at x = 0 μm is a result of the finite sized opaque carbon fibre electrode. At +1.2 V the measured electrochemical current is of the order of 1 × 10⁻⁶ A (for a 1 mM solution of the fluorophore), where the cylindrical electrode is approximately 1 cm in length. At this potential the fluorescence profiles are essentially insensitive to the used concentration of the fluorophore, with the small discrepancies reflecting the reproducibility of the experiment.56 Also notable is the fact that the minimum in the fluorescence profile is between 20-40% less than the signal obtained prior to the onset of the oxidising potential. These results are fully consistent with a direct oxidation process, where the electrochemical oxidation exclusively occurs at the electrode interface. At a higher oxidative potential of +2.3 V, however, the fluorescent behaviour of HPTS is markedly different (solid lines Fig. 8), first the depth of the minimum is far greater and second the fluorescence profile is sensitive to the concentration of the fluorophore. Fig. 8 (solid line) demonstrates how decreasing the concentration of the fluorophore markedly increases the distance over which it is consumed. Plots of the variation of the fluorescence intensity profiles as a function of time with different concentrations and the related fluorescence microscope images are provided in the ESI,† Section S8 (Fig. S12 and S13 for experiments at +1.2 V, Fig. S14 and S15 for those at +2.3 V respectively, ESI†). At such high potentials (+2.3 V) the currents at the electrode are large (ca. 6 × 10⁻⁵ A for a 1 mM solution of the fluorophore) and correspond not only to the direct oxidation of the fluorophore but also the solvent and in this case the electrolyte – chloride. Thus, the dramatic change in the obtained fluorescence profiles between +1.2 V and +2.3 V directly evidence that, at the latter potentials, the fluorophore is additionally oxidised indirectly by the products of the solvent break down; a mediated oxidation occurs. Although local H+ would be generated during the reaction, HPTS, is a ‘photoacid’ as such the protonated and deprotonated forms fluorescence at the same wavelength. Moreover, the protonated form has a higher extinction coefficient at 365 nm (as used experimentally) as such if there was a significant change in pH during the course of the experiment one would anticipate and increase in the fluorescence intensity51 as opposed to the observed decrease. Consequently, the formation of H+ is not likely relevant in the present situation where the buffer is expected to be sufficient to control the interfacial pH. In the above work the chemical reactivity of HPTS towards chlorine, Cl2, was noted. The experiments reported in Fig. 8 were conducted in the presence of 0.1 M chloride. Accordingly, analogous experiments were repeated in the absence of chloride, and the data can be found in ESI,† Fig. S16. For the case in absence of Cl−, an optical response corresponding to the direct oxidation at the electrode was again observed even at a high oxidative potential (+2.3 V), strongly evidencing that chlorine is the operative species causing the oxidative destruction of the fluorophore at distances away from the electrode. We conclude that the electrochemical process occurring at the electrode responsible for the mediated oxidation of HPTS at +2.3 V is predominantly CER rather than OER.
To summarise, at high oxidative potentials the electrochemical processes occurring at the electrode, OER vs. CER, are highly sensitive to the experimental conditions. We have demonstrated that the in situ opto-electrochemical response of HPTS can provide evidence for the operation of the CER despite the voltammetric signatures being completely masked by solvent decomposition.
Conclusions
The simulation model shows distinctly different concentration profiles and thus optical responses for the destruction of a fluorophore by a direct oxidative at the electrode in comparison with a homogeneous reaction with an electrochemically generated product, that is mediated oxidation. With the direct oxidation of the fluorophore the optical response near the vicinity of the electrode does not deplete to zero within tens of seconds of the applied potential; under the same time scale and in contrast, the formation of a highly reactive electrochemical product – via solvent breakdown or electro-chlorination – is shown to “titrate” all the fluorophore near the vicinity of the electrode.The fluorescence response of two structurally similar fluorescent probes, HPTS and PYTS, were investigated in a thin-layered opto-electrochemical cell. At a low oxidative potential of +1.2 V vs. pseudo Ag wire, the fluorescence response of HPTS is fully consistent with direct oxidation at the electrode as confirmed by its voltammetric signal. However, at a higher oxidative potential of +2.3 V, the fluorescence responses of HPTS is in-line with the indirect destruction process (EC2) via reaction with a reactive electrogenerated product arising from solvent breakdown and/or electro-chlorination. The UV-Vis spectra evidences that reaction with chlorine is the likely dominant reaction with HPTS at higher oxidative potential. In contrast PYTS is only oxidised at a high potential of +2.3 V with the fluorescence response in agreement with direct oxidation at the electrode.
We have shown that, in situ optical imaging synchronised with electrochemistry provides insights to the reaction mechanism when the current obtained electrochemically is dominated and obscured by the solvent and/or breakdown of electrolyte.
Conflicts of interest
The authors declare no competing financial interests.Acknowledgements
M. Y. acknowledges funding via an EPSRC Industrial CASE award (EP/N509711/1).References
- R. G. Compton and C. E. Banks, Understanding Voltammetry, World Scientific, 2011 Search PubMed.
- F. M'Halla, J. Pinson and J. M. Savéant, The Solvent as Hydrogen-Atom Donor in Organic Electrochemical Reactions. Reduction of Aromatic Halides, J. Am. Chem. Soc., 1980, 102, 4120–4127 CrossRef.
- J. Wu, H. Yu, L. Fan, G. Luo, J. Lin and M. Huang, A Simple and High-Effective Electrolyte Mediated with P-Phenylenediamine for Supercapacitor, J. Mater. Chem., 2012, 22, 19025–19030 RSC.
- I. M. Aldous and L. J. Hardwick, Solvent-Mediated Control of the Electrochemical Discharge Products of Non-Aqueous Sodium–Oxygen Electrochemistry, Angew. Chem., Int. Ed., 2016, 55, 8254–8257 CrossRef CAS PubMed.
- H. K. Abdel-Aal, S. M. Sultan and I. A. Hussein, Parametric Study for Saline Water Electrolysis: Part Ii—Chlorine Evolution, Selectivity and Determination, Int. J. Hydrogen Energy, 1993, 18, 545–551 CrossRef CAS.
- S. Trasatti, Electrocatalysis in the Anodic Evolution of Oxygen and Chlorine, Electrochim. Acta, 1984, 29, 1503–1512 CrossRef CAS.
- X. Liu and F. Wang, Transition Metal Complexes That Catalyze Oxygen Formation from Water: 1979–2010, Coord. Chem. Rev., 2012, 256, 1115–1136 CrossRef CAS.
- G. Mattioli, P. Giannozzi, A. Amore Bonapasta and L. Guidoni, Reaction Pathways for Oxygen Evolution Promoted by Cobalt Catalyst, J. Am. Chem. Soc., 2013, 135, 15353–15363 CrossRef CAS PubMed.
- S. H. Chang, J. G. Connell, N. Danilovic, R. Subbaraman, K.-C. Chang, V. R. Stamenkovic and N. M. Markovic, Activity–Stability Relationship in the Surface Electrochemistry of the Oxygen Evolution Reaction, Faraday Discuss., 2015, 176, 125–133 RSC.
- V. Consonni, S. Trasatti, F. Pollak and W. E. O'Grady, Mechanism of Chlorine Evolution on Oxide Anodes Study of Ph Effects, J. Electroanal. Chem. Interfacial Electrochem., 1987, 228, 393–406 CrossRef CAS.
- C. H. Yang, C. C. Lee and T. C. Wen, Hypochlorite Generation on Ru–Pt Binary Oxide for Treatment of Dye Wastewater, J. Appl. Electrochem., 2000, 30, 1043–1051 CrossRef CAS.
- C. C. Hu, C. H. Lee and T. C. Wen, Oxygen Evolution and Hypochlorite Production on Ru-Pt Binary Oxides, J. Appl. Electrochem., 1996, 26, 72–82 CrossRef CAS.
- V. Petrykin, K. Macounova, O. A. Shlyakhtin and P. Krtil, Tailoring the Selectivity for Electrocatalytic Oxygen Evolution on Ruthenium Oxides by Zinc Substitution, Angew. Chem., Int. Ed., 2010, 49, 4813–4815 CrossRef CAS PubMed.
- M. G. Walter, E. L. Warren, J. R. McKone, S. W. Boettcher, Q. Mi, E. A. Santori and N. S. Lewis, Solar Water Splitting Cells, Chem. Rev., 2010, 110, 6446–6473 CrossRef CAS PubMed.
- M. Shao, Q. Chang, J.-P. Dodelet and R. Chenitz, Recent Advances in Electrocatalysts for Oxygen Reduction Reaction, Chem. Rev., 2016, 116, 3594–3657 CrossRef CAS PubMed.
- S. Anantharaj, S. R. Ede, K. Sakthikumar, K. Karthick, S. Mishra and S. Kundu, Recent Trends and Perspectives in Electrochemical Water Splitting with an Emphasis on Sulfide, Selenide, and Phosphide Catalysts of Fe, Co, and Ni: A Review, ACS Catal., 2016, 6, 8069–8097 CrossRef CAS.
- S. Trasatti, Progress in the Understanding of the Mechanism of Chlorine Evolution at Oxide Electrodes, Electrochim. Acta, 1987, 32, 369–382 CrossRef CAS.
- R. K. B. Karlsson and A. Cornell, Selectivity between Oxygen and Chlorine Evolution in the Chlor-Alkali and Chlorate Processes, Chem. Rev., 2016, 116, 2982–3028 CrossRef CAS PubMed.
- C. A. Martinez-Huitle and S. Ferro, Electrochemical Oxidation of Organic Pollutants for the Wastewater Treatment: Direct and Indirect Processes, Chem. Soc. Rev., 2006, 35, 1324–1340 RSC.
- G. Chen, Electrochemical Technologies in Wastewater Treatment, Sep. Purif. Technol., 2004, 38, 11–41 CrossRef CAS.
- A. Frumkin, L. Nekrasov, B. Levich and J. Ivanov, Die Anwendung Der Rotierenden Scheibenelektrode Mit Einem Ringe Zur Untersuchung Von Zwischenprodukten Elektrochemischer Reaktionen, J. Electroanal. Chem., 1959, 1, 84–90 Search PubMed.
- A. N. Frumkin and L. N. Nekrasov, On the Ring-Disk Electrode, Dok. Akad. Nauk SSSR, 1959, 126, 115 Search PubMed.
- J. G. Vos and M. T. M. Koper, Measurement of Competition between Oxygen Evolution and Chlorine Evolution Using Rotating Ring-Disk Electrode Voltammetry, J. Electroanal. Chem., 2018, 819, 260–268 CrossRef CAS.
- J. G. Vos, Z. Liu, F. D. Speck, N. Perini, W. Fu, S. Cherevko and M. T. M. Koper, Selectivity Trends between Oxygen Evolution and Chlorine Evolution on Iridium-Based Double Perovskites in Acidic Media, ACS Catal., 2019, 9, 8561–8574 CrossRef CAS.
- T. C. Nagaiah, A. Maljusch, X. Chen, M. Bron and W. Schuhmann, Visualization of the Local Catalytic Activity of Electrodeposited Pt–Ag Catalysts for Oxygen Reduction by Means of Secm, ChemPhysChem, 2009, 10, 2711–2718 CrossRef CAS PubMed.
- W. Wang, Imaging the Chemical Activity of Single Nanoparticles with Optical Microscopy, Chem. Soc. Rev., 2018, 47, 2485–2508 RSC.
- C. Amatore, F. Bonhomme, J.-L. Bruneel, L. Servant and L. Thouin, Mapping Concentration Profiles within the Diffusion Layer of an Electrode: Part I. Confocal Resonance Raman Microscopy, Electrochem. Commun., 2000, 2, 235–239 CrossRef CAS.
- Y. Wang, X. Shan and N. Tao, Emerging Tools for Studying Single Entity Electrochemistry, Faraday Discuss., 2016, 193, 9–39 RSC.
- C. Amatore, A. Chovin, P. Garrigue, L. Servant, N. Sojic, S. Szunerits and L. Thouin, Remote Fluorescence Imaging of Dynamic Concentration Profiles with Micrometer Resolution Using a Coherent Optical Fiber Bundle, Anal. Chem., 2004, 76, 7202–7210 CrossRef CAS PubMed.
- L. Guerret-Legras, J. F. Audibert, G. V. Dubacheva and F. Miomandre, Combined Scanning Electrochemical and Fluorescence Microscopies Using a Tetrazine as a Single Redox and Luminescent (Electrofluorochromic) Probe, Chem. Sci., 2018, 9, 5897–5905 RSC.
- P. Audebert and F. Miomandre, Electrofluorochromism: From Molecular Systems to Set-up and Display, Chem. Sci., 2013, 4, 575–584 RSC.
- L. Bouffier, T. Doneux, B. Goudeau and A. Kuhn, Imaging Redox Activity at Bipolar Electrodes by Indirect Fluorescence Modulation, Anal. Chem., 2014, 86, 3708–3711 CrossRef CAS PubMed.
- T. Doneux, L. Bouffier, B. Goudeau and S. Arbault, Coupling Electrochemistry with Fluorescence Confocal Microscopy to Investigate Electrochemical Reactivity: A Case Study with the Resazurin-Resorufin Fluorogenic Couple, Anal. Chem., 2016, 88, 6292–6300 CrossRef CAS PubMed.
- C. Cannes, F. Kanoufi and A. J. Bard, Cyclic Voltammetry and Scanning Electrochemical Microscopy of Ferrocenemethanol at Monolayer and Bilayer-Modified Gold Electrodes, J. Electroanal. Chem., 2003, 547, 83–91 CrossRef CAS.
- C. Li, A. G. Tebo and A. Gautier, Fluorogenic Labeling Strategies for Biological Imaging, Int. J. Mol. Sci., 2017, 18, 1473 CrossRef PubMed.
- L. Jullien and A. Gautier, Fluorogen-Based Reporters for Fluorescence Imaging: A Review, Methods Appl. Fluoresc., 2015, 3, 042007 CrossRef PubMed.
- M. Schäferling, The Art of Fluorescence Imaging with Chemical Sensors, Angew. Chem., Int. Ed., 2012, 51, 3532–3554 CrossRef PubMed.
- R. T. Williams and J. W. Bridges, Fluorescence of Solutions: A Review, J. Clin. Pathol., 1964, 17, 371 CrossRef CAS PubMed.
- A. Molina, E. Laborda, J. M. Gómez-Gil, F. Martínez-Ortiz and R. G. Compton, Analytical Solutions for the Study of Homogeneous First-Order Chemical Kinetics Via Uv–Vis Spectroelectrochemistry, J. Electroanal. Chem., 2018, 819, 202–213 CrossRef CAS.
- E. Laborda, J. M. Gómez-Gil, A. Molina and R. G. Compton, Spectroscopy Takes Electrochemistry Beyond the Interface: A Compact Analytical Solution for the Reversible First-Order Catalytic Mechanism, Electrochim. Acta, 2018, 284, 721–732 CrossRef CAS.
- C. Batchelor-McAuley, C. A. Little, S. V. Sokolov, E. Kätelhön, G. Zampardi and R. G. Compton, Fluorescence Monitored Voltammetry of Single Attoliter Droplets, Anal. Chem., 2016, 88, 11213–11221 CrossRef CAS PubMed.
- T. A. Davis, Algorithm 832: Umfpack V4.3—an Unsymmetric-Pattern Multifrontal Method, ACM Trans. Math. Softw, 2004, 30, 196–199 CrossRef.
- R. G. Compton, E. Laborda and K. R. Ward, Understanding Voltammetry: Simulation of Electrode Processes, World Scientific, 2014 Search PubMed.
- P. Moon and D. E. Spencer, Field Theory Handbook: Including Coordinate Systems, Differential Equations and Their Solutions, Springer, 2012 Search PubMed.
- K. Aoki, K. Honda, K. Tokuda and H. Matsuda, Voltammetry at Microcylinder Electrodes: Part I. Linear Sweep Voltammetry, J. Electroanal. Chem. Interfacial Electrochem., 1985, 182, 267–279 CrossRef CAS.
- D. Li, C. Batchelor-McAuley, L. Chen and R. G. Compton, Band Electrodes in Sensing Applications: Response Characteristics and Band Fabrication Methods, ACS Sens., 2019, 4, 2250–2266 CrossRef CAS PubMed.
- P. Xia, P. M. Bungay, C. C. Gibson, O. N. Kovbasnjuk and K. R. Spring, Diffusion Coefficients in the Lateral Intercellular Spaces of Madin-Darby Canine Kidney Cell Epithelium Determined with Caged Compounds, Biophys. J., 1998, 74, 3302–3312 CrossRef CAS.
- S. Liu, C. Hu, J. Huang and Y. Yan, Fluorescent Polyion Complex for the Detection of Sodium Dodecylbenzenesulfonate, Polymers, 2018, 10, 657 CrossRef PubMed.
- T. Y. Sergeeva, R. K. Mukhitova, I. R. Nizameev, M. K. Kadirov, P. D. Klypina, A. Y. Ziganshina and A. I. Konovalov, Closed Polymer Containers Based on Phenylboronic Esters of Resorcinarenes, Beilstein J. Nanotechnol., 2018, 9, 1594–1601 CrossRef CAS PubMed.
- C. Aliaga, A. Arenas, A. Aspée, C. López-Alarcón and E. A. Lissi, Generation, Spectroscopic Characterization by Epr, and Decay of a Pyranine-Derived Radical, Helv. Chim. Acta, 2007, 90, 2009–2016 CrossRef CAS.
- M. Yang, C. Batchelor-McAuley, E. Kätelhön and R. G. Compton, Reaction Layer Imaging Using Fluorescence Electrochemical Microscopy, Anal. Chem., 2017, 89, 6870–6877 CrossRef CAS PubMed.
- T. A. Enache and A. M. Oliveira-Brett, Phenol and Para-Substituted Phenols Electrochemical Oxidation Pathways, J. Electroanal. Chem., 2011, 655, 9–16 CrossRef CAS.
- Y. S. Jung, W. T. Lim, J. Y. Park and Y. H. Kim, Effect of Ph on Fenton and Fenton-Like Oxidation, Environ. Technol., 2009, 30, 183–190 CrossRef CAS PubMed.
- F. Mijangos, F. Varona and N. Villota, Changes in Solution Color During Phenol Oxidation by Fenton Reagent, Environ. Sci. Technol., 2006, 40, 5538–5543 CrossRef CAS PubMed.
- F. P. Venable and D. H. Jackson, The Reaction between Hydrochloric Acid and Potassium Permanganate, J. Am. Chem. Soc., 1920, 42, 237–239 CrossRef CAS.
- D. Rajkumar, J. Guk Kim and K. Palanivelu, Indirect Electrochemical Oxidation of Phenol in the Presence of Chloride for Wastewater Treatment, Chem. Eng. Technol., 2005, 28, 98–105 CrossRef CAS.
Footnote |
| † Electronic supplementary information (ESI) available. See DOI: 10.1039/d0cp01904f |
| This journal is © the Owner Societies 2020 |