
 Open Access Article
 This Open Access Article is licensed under a
 Creative Commons Attribution 3.0 Unported Licence
VUV photoionization dynamics of the C60 buckminsterfullerene: 2D-matrix photoelectron spectroscopy in an astrophysical context†
Helgi Rafn
Hrodmarsson
 *ab,
Gustavo A.
Garcia
a,
Harold
Linnartz
b and
Laurent
Nahon
a
*ab,
Gustavo A.
Garcia
a,
Harold
Linnartz
b and
Laurent
Nahon
a
aSynchrotron SOLEIL, L’Orme des Merisiers, St Aubin, BP 48, Gif sur Yvette, France. E-mail: hrodmarsson@strw.leidenuniv.nl; hr.hrodmarsson@gmail.com; Tel: +31 6 29 41 35 69
bLaboratory for Astrophysics, Leiden Observatory, Leiden University, PO Box 9513, NL-2300 RA Leiden, The Netherlands
First published on 23rd April 2020
Abstract
We present the photoionization dynamics of the C60 buckminsterfullerene from threshold up to 14.0 eV recorded with VUV synchrotron radiation at the DESIRS beamline at the SOLEIL synchrotron. The recorded data is obtained using a double-imaging photoelectron photoion coincidence spectrometer and is presented as a two-dimensional photoelectron matrix which contains a wealth of spectroscopic data. We present these data in an astrophysical context which relates to (i) the threshold photoelectron spectrum which is compared to data relevant to the diffuse interstellar bands (DIBs), (ii) the kinetic photoelectron distribution at the Lyman-α line which is relevant to the dominant heating source in the ISM, and (iii) the absolute photoionization cross section of C60 up to approx. 10.5 eV. The photoelectron spectrum implies that the symmetry of the ground state is different than previous theoretical models have predicted, and this result is discussed in context of recent experimental and theoretical findings. Also presented are partial photoionization cross sections of the first two photoelectron bands and their anisotropy parameters. These data are compared with previous theoretical values and discussed where appropriate.
1. Introduction
The discovery of the buckminsterfullerene C601 was in sorts a prescient affair. The experimental conditions under which C60 was formed, were devised in order to understand the formation mechanisms of long-chain carbon molecules whose presence had been confirmed in various interstellar regions in the preceding years.2–5 It was predicted that C60 should be as abundant in space as well, but it took over three decades before C60 could be unambiguously identified; first in various types of nebulae,6–8 and later on in H II regions,9 circumstellar shells,10 post-asymptotic giant-branch (post-AGB) objects,11 and various other Photon Dominated Regions (PDRs).12 Furthermore, with the identification of its cation, C60+, as the carrier of initially two and later four diffuse interstellar bands (DIBs) in the near-infrared of the diffuse interstellar medium (ISM),13–15 research into this molecule is forcing us to reevaluate our understanding of interstellar molecular complexity. For a long time C3 was the largest pure carbon species identified in diffuse clouds16,17 and thus, the detection of C60+ substantially stretches the size-limit for carbon-containing molecules in the diffuse ISM which could hold the key to unravelling the rest of the DIB mystery which has remained unsolved for almost a century at the time of writing.18–21The question of how C60 forms in interstellar space has given rise to some convincing hypotheses,22 especially in light of the apparent inverse relationship between the abundance of polycyclic aromatic hydrocarbons (PAHs) and C60 at decreasing distances towards stars.23 Among the formation mechanisms for interstellar fullerenes that have gained much traction are (i) dehydrogenation of hydrogenated amorphous carbon nanoparticles24 and (ii) the formation of graphene through photo-stripping H-atoms off larger PAHs. In the second scenario the bare carbon skeleton then undergoes further photo-excitation via VUV photons and self-stabilizes via IR photon emission or carbon loss leading to pentagonal defects; a prerequisite for the sheet to fold into a fullerene.23 Indeed, mass-resolved laboratory data have shown that upon UV irradiation, PAHs undergo H-stripping to reveal bare carbon skeletons which form stable cluster ions, indicative of fullerene formation.25 For this reason, several recent studies have been focusing on PAH pentagon formation schemes, to further exploit bowling mechanisms under interstellar conditions.26,27
With the tenuous connection between PAHs and fullerenes in space, it is worth noting that fullerenes may contribute to the ionization balance of the ISM and the photoelectric heating of PDRs in a similar way as PAHs have been found to be.28 In and of itself C60 has been proposed as a diagnostic tool to estimate the temperature and/or UV flux inside molecular clouds29 but such data is dependent on measurements of solid C60 rather than gas-phase measurements as those relative to DIBs studies.13–15
The ground state electronic structure of neutral C60 possesses an icosahedral Ih symmetry. The highest occupied molecular orbital (HOMO) is fully occupied which results in a closed-shell ground state that is both fully symmetric and nondegenerate with ten valence electrons in an electronic quintet level labelled 6hu. The relevant portion of the valence electronic configuration of the first three photoelectron bands of C60 are:30,31
Upon ionization the icosahedral symmetry is broken and a hole in the HOMO results in the cation possessing a hu symmetric fivefold degenerate ground state which is Jahn–Teller (JT) active.32 The electron density relevant to the JT-active modes is akin to a band along an imaginary waistline of the C60 structure33 and when spontaneous symmetry breaking takes place upon ionization, the electron density around the molecule is best described by an oblate spheroid. Thus, a singly charged C60+ ion possesses a 2Hu ground state and 2Hg and 2Gg low-lying excited states which are all capable of JT-distortions along hg and gg normal coordinates.34
For C60+, one can discern JT-active modes from the Ih character table.35 These are Hg, Gg, and Ag. Though the Ag mode does not reduce the symmetry, it does shift the total energy of the molecule. The Hg and Gg modes, however, break the Ih symmetry and produce a multisheet adiabatic potential energy surface with a conical intersection in the symmetric geometry and extrema in configurations of D5d and D3d lowered symmetry.8 While matrix isolation studies of C60+ have favored D5d symmetry from interpretation of the results,36–38 evidence has been found that free gas-phase C60+ molecules display D3d symmetry in their ground state.39 The theoretical community seems to currently favor the results of the matrix isolation studies40–42 and the application of a D5d symmetric ground state has been used to speculate on the origins of the DIBs relative to C60+.43
Despite all this recent progress, several elemental physical chemical questions concerning C60 and C60+ remain. One is linked to the intensity ratios of the astronomically recorded C60+ transitions that are not yet fully understood and that is possibly related to our present understanding of the symmetry of ground state C60+ ions in the gas phase.44,45 Another question is that in the diffuse interstellar medium, only C60+ signals have been found and no neutral precursor signals. The present work, which focuses on the photoionization dynamics of C60 (in)directly addresses these questions.
The use of photoelectron spectroscopy in tandem with synchrotron radiation has been somewhat of a hallmark in the history of spectroscopic investigations of C60,39,46–52 but so far, the threshold photoelectron spectrum (TPES) has still eluded closer inspection. By utilizing the double-imaging photoelectron photoion coincidence (i2PEPICO) technique, a wealth of information besides the TPES can be retrieved regarding the electronic structure and properties of C60 and here we will present a 2D photoelectron dynamics matrix, from which are extracted the first measured TPES of C60, the electron kinetic energy distributions, an estimation of the absolute photoionization cross section, and partial photoionization yields from threshold and above the Lyman-α limit (up to 14 eV), and discuss them within the context of the presence of C60 and C60+ in space.
2. Experimental
Experiments were performed at the DESIRS VUV beamline53 at the Synchrotron SOLEIL facility. Horizontally polarized radiation in the photon energy range 7–14 eV was generated by an undulator (OPHELIE2)54 whose higher harmonics are subsequently suppressed by four to five orders of magnitude with a gas filter filled with Krypton which is transparent in the aforementioned photon energy range.55 The purified photon beam was then dispersed by a 6.65 normal incidence monochromator equipped with a 200 grooves per mm grating. The photon flux delivered was between 1012 and 1013 photons per s and was calibrated with an AXUV100, IRD Si photodiode. For the slit width used for the experiments, the photon energy resolution scales from 6 meV at 7.3 eV to 23 meV at 14.0 eV. Downstream the monochromator, the photon beam intersected a supersonic molecular beam at a right angle inside the double imaging DELICIOUS III spectrometer56 of the permanent end-station SAPHIRS.57 Inside DELICIOUS III, photoions and photoelectrons were accelerated in opposite directions with a DC electric field and then detected in coincidence with delay line anode-based position sensitive detectors (PSDs). The electrons passed through a velocity map imaging spectrometer and the ions went through a modified Wiley McLaren time-of-flight (WM-TOF) 3D momentum imaging spectrometer. The PEPICO scheme allows mass-tagging the electron images allowing to discard any spurious/background compounds. Further filtering was also achieved by using the ion imaging capability of the set-up (see below).C60 was obtained commercially (Sigma-Aldrich ≥99% purity) and was sublimated in an in-vacuum temperature-controlled oven heated up to 600 °C. The oven was placed inside the differentially pumped SAPHIRS chamber which is connected to the DELICIOUS III ionization chamber via a two-stage differential pumping.57 Argon was used as a carrier gas with a backing pressure of 1.0 bar. Exiting the oven, the sample expanded supersonically through a 200 μm nozzle. Between the oven and the first skimmer (ϕ = 1.0 mm) leading to the differential chamber, a cold trap utilizing the flow of chilled ethylene glycol (set to −20 °C) was placed to attract any thermalized C60 that was not engulfed in the molecular beam. Passing through the first skimmer onward through the differential pumping chamber, the molecular beam encountered a second skimmer (ϕ = 2.0 mm) that led to the ionization chamber. Under these relatively mild expansion conditions we expect no aggregation processes and indeed no masses heavier than 720 amu were observed.
Once the components of the molecular beam were ionized inside the DELICIOUS III chamber, the charged particles were accelerated with an electric field of 88 V cm−1. To ensure the detection of all the C60 ions passing through the modified WM-TOF setup, an additional electrostatic deflection was applied along the molecular beam axis so that no high-mass particles would miss the PSD because of their initial velocity. Visually, this shifting effect is akin to pulling the thermal background ions towards one side of the ionization chamber, being stretched to the visible “D-shaped” pattern, while “pulling” the supersonic part of the molecular beam, i.e. the region of interest which contains the heaviest species, further towards the center of the PSD (Fig. 1).
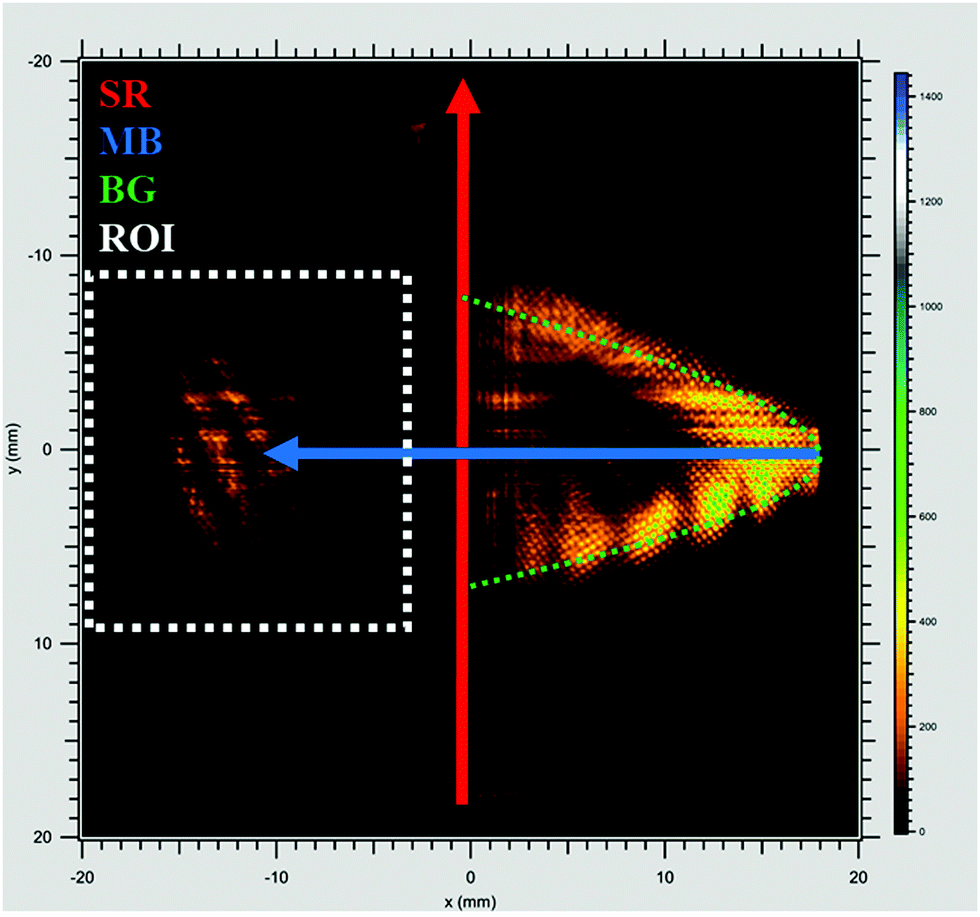 | ||
| Fig. 1 An example of the ion image with the deflection voltage applied. The red arrow shows the direction of the synchrotron radiation (SR) beam, the blue arrow shows the direction of the molecular beam (MB) and the green dashed line shows the background signals that were ionized by the SR. The deflection voltage causes the generated ions to travel further towards the right side of the PSD instead of travelling directly through the mass spectrometer. Hence, the background appears like a stretched rubber band instead of being aligned with the SR. The blue arrow points to the heaviest contents of the MB, namely the signals pertaining to ionized C60. The white dashed rectangle indicates the region of interest (ROI). The background is filtered away by removing all coincidence signals outside of the chosen ROI, leaving only coincidence signals pertaining to the contents of the molecular beam. | ||
Energy calibration was achieved using various ionization energies of background contaminants such as O2 (12.07 eV), H2O (12.62 eV) and the residual second harmonic ionization of argon (7.88 eV). This results in a 5 meV accuracy of the energy scale, or approximately half the scan step. Such energy calibrations using higher harmonic ionizations of the contents of the molecular beam have been performed previously and discussed in detail elsewhere.58,59 In order to correct for possible drifts in the C60 neutral density, i.e. the relative intensities of the bands between the scans, a “fast” scan was performed over the entire energy range with 0.1 eV step sizes with the same acquisition time per point as in the aforementioned scans which had significantly smaller step sizes. Thus, when plotted together, the intensities of the individual scans could be scaled to the intensities from the fast scan. Subsequently, the absolute intensity was normalized for the photon flux with measurements obtained from the photodiode to give a flat photon flux response.
Electron images were Abel inverted using the pBasex algorithm.60 Following inversion of the mass-filtered electron images pertaining to the ROI in Fig. 1, the ionization intensities can be plotted in matrix form as a function of the electron kinetic energy and photon energy. By integrating the pixel intensities along the electron signals in the matrix, from KEmax = 0 up to a fairly small value (50 meV in this work), the threshold photoelectron spectrum is obtained. A more detailed description of the TPES abstraction from the 2D-matrix has been given elsewhere.59
The 50 meV integration window is chosen as the best compromise between signal and resolution. The total energy resolution is in fact a convolution of the electron bandwidth that is used to obtain the TPES and the photon resolution. This issue has been discussed previously58,59 and we have found that the 50 meV electron bandwidth translates into a resolution of 13 meV. Due to spectral congestion, the width of the peaks in the TPES well exceed the total energy resolution which is the convoluted value of the electron resolution and photon resolution.
3. Results and discussion
3.1 TOF-MS
Fig. 2 shows the accumulated time-of-flight mass spectrum (TOFMS) for the 7.3–10.0 eV photon energy scan, zoomed-in around the mass of C60. The inset shows the full mass spectrum with and without the subtraction of the background signals outside the ROI. In the background there is a signal at 40 amu that corresponds to the second harmonic ionization of Argon which was used to calibrate the energy scale (see above). The broad peaks visible in the m/z 150–650 range are due to spurious compounds present as thermal gas in the chamber.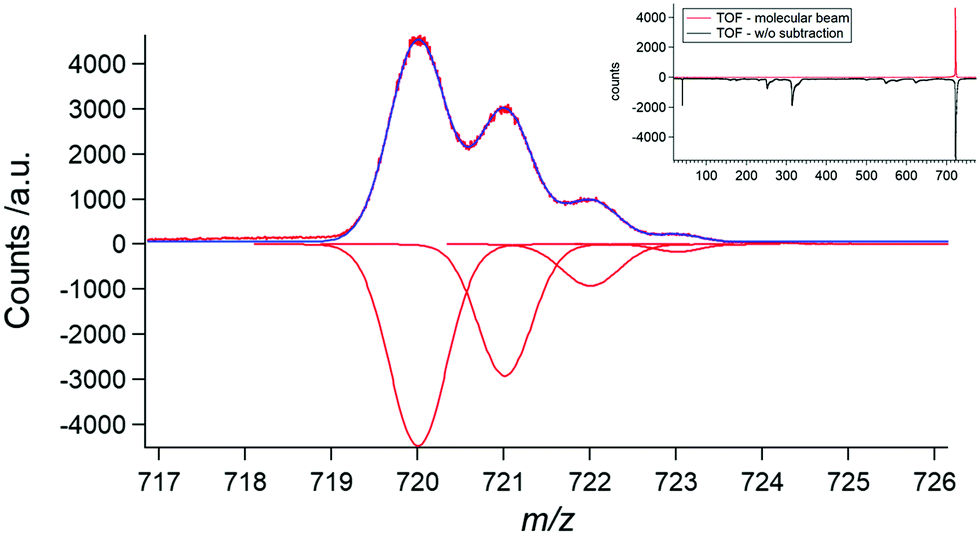 | ||
| Fig. 2 Zoomed in figure of the portion of the signal pertaining to C60 and its isotopologues in the time-of-flight mass spectrum (TOFMS) obtained by integrating all signals in the ion image of the energy scan from 7.3 eV up to 10.0 eV. Presented in blue is the combined fit from Gaussian curves for each mass peak from 720 amu to 723 amu, which are individually presented in the mirrored mass spectrum. On the inset in the right corner, the entirety of the TOFMS is presented up to 1050 amu, with (red curve) and without correction (black curve) by the ion ROI. | ||
From a molecule containing sixty carbon atoms, a significant amount of the sample contains one or more 13C isotopes. The expected natural abundances of 13C12C59, 13C212C58, 13C312C57 are, respectively, 64.9%, 20.7%, and 4.3% out of the natural abundance of 12C60. These are well reproduced as the abundances observed for the 721 amu, 722 amu, and 723 amu signals are 65.2%, 20.5% and 2.7%, respectively.
It has been shown that isotopic distribution within the molecule is truly random61 but more importantly, the mass perturbation does not affect the electronic structure of C60 so force constants are unchanged.62 To capitalize on this observation, we integrate over the entire visible isotopic pattern (720–723 amu) to obtain the best possible signal to noise ratio in our PES signals.
3.2 2D-Photoelectron matrix
The two-dimensional coincident signal as a function of electron and photon energy for C60, i.e. the ROI and mass-filtered signal pertaining to the C60 isotopologues is shown in Fig. 3. There are three strong bands visible with onsets at 7.58 eV, 8.82 eV and 10.58 eV. Above the third band (around 12.20 eV) there seem to be other bands, but these are not as well resolved as the first three bands and appear very diffuse. As has been discussed previously, the second photoelectron band is expected to arise from the ionization of two states, namely 6gg (2Gg) and 10hg (2Hg). The third band is expected to include four different electronic states and the fourth band eight (see Table 1).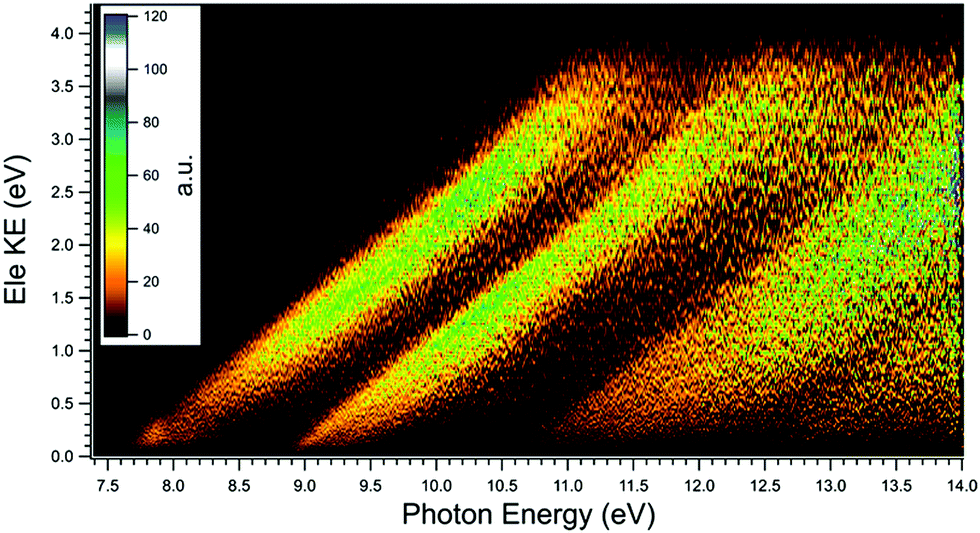 | ||
| Fig. 3 Photoelectron intensity matrix of C60. The colors represent the electron signal as a function of the electron kinetic energy (Ele KE) and photon energy in eV. Energy steps below 10 eV are 8 meV and above 10 eV they are 10 meV. | ||
| Band | Band positions (this work)/eV | Calculated IEv (Colavita et al.30)/eV | Calculated IEv (Zakrzewski et al.64)/eV | Calculated IEv (Ponzi et al.65)/eV | Label | Symmetry |
|---|---|---|---|---|---|---|
| 1 | 0 (7.65) | 0 | 0 | 0 | 6hu | π |
| 2 | 1.31 (8.96) | 1.13 | 1.56 | 1.11 | 6gg | π |
| 1.24 | 1.53 | 1.21 | 10hg | π | ||
| 3 | 3.07 (10.72) | 2.80 | 3.48 | 2.72 | 6gu | π |
| 3.10 | 4.08 | 2.32 | 5hu | σ | ||
| 3.30 | 4.21 | 3.24 | 6t2u | π | ||
| 3.39 | 4.24 | 2.62 | 9hg | σ | ||
| 4 | 4.69 (12.34) | 4.42 | 5.65 | 3.58 | 5gu | σ |
| 4.58 | 5.88 | 4.49 | 8hg | π | ||
| 4.89 | 6.38 | 4.15 | 2t2g | σ | ||
| 5.16 | 7.19 | 4.36 | 5gg | σ | ||
| 5.53 | 4.74 | 7hg | σ | |||
| 5.65 | 5.57 | 6t1u | π | |||
| 6.01 | 5.29 | 4gu | σ | |||
| 6.20 | 6.10 | 4ag | π | |||
The theoretical results that are presented in Table 1 for comparisons used different methodologies to arrive at their respective ionization energies. Colavita et al. used a local density correlation approximation (VWN TS) to calculate the ionization energies and their orbital energies are presented relative to that of the calculated ground state. Ponzi et al. did the same with their DFT & TD-DFT results. Zakrzewski et al. employed electron propagator methods which gave a perfect comparison of the absolute energies of the ground state, but this methodology is ill-suited to finding ionization energies beyond the third photoelectron band.
Several literature values for the adiabatic ionization potential (IEad) of C60 – all determined from total ion yield measurements – can be found, e.g. 7.58+0.04−0.02,50 7.54 ± 0.04 eV,48 and 7.57 ± 0.01 eV.63 Our measurement allows us to determine both a vertical and adiabatic value of the IP, namely IEv = 7.648 ± 0.010 eV and IEad = 7.511 ± 0.010 eV. The adiabatic value was obtained from the total ion yield as the first point where the ion signal surpasses the noise level. However, obtaining the adiabatic IE using this method is imprecise and must be viewed as an approximation since hot bands and other temperature effects such as conformer population, will affect the signal onset. Adiabatic IEs are more precisely obtained from the TPES by comparison with simulations that account for the Franck–Condon factors, but as mentioned further down the text, this is not possible with the current experimental resolution and the vibronic congestion on the first band. For the higher electronic bands, our results compare well with previous computations.30,64,65
3.3 Threshold photoelectron spectrum (TPES)
Diagonal integration along the 2D-matrix in Fig. 3 up to KEmax = 50 meV yields the TPES of C60 (see Fig. 4) according to a procedure documented previously.66 The TPES allows comparisons with the theoretical valence vertical ionization potentials of all the electronic states in the first four bands as well as theoretically simulated PES. Our results compare relatively well for the first two bands but less so for the third and fourth bands. Between 12.0 and 14.0 eV, eight electronic states are expected from theory but in this region, we are unable to obtain a good S/N ratio to decipher anything regarding these states. It is also noteworthy that there are discrepancies between the theoretical works of Colavita et al.30 and Gao et al.67 in this region. Note that comparing the branching ratios between different electronic states intensities between this work and the simulated PES at 14 eV of Gao et al. is not straightforward because of the kinetic energy effect on the partial cross sections and the possible presence of autoionization resonances in the TPES. Lastly, a comparison with the measured PES from Korica et al.68 is presented which was collected at 50 eV and compares reasonably well with our TPES in terms of shape and energies although the lower resolution of this spectrum precludes a more precise comparison. For instance, the first band of Korica et al. is noticeably shifted to the red by about 400 meV which could either be a resolution effect or due to other experimental issues.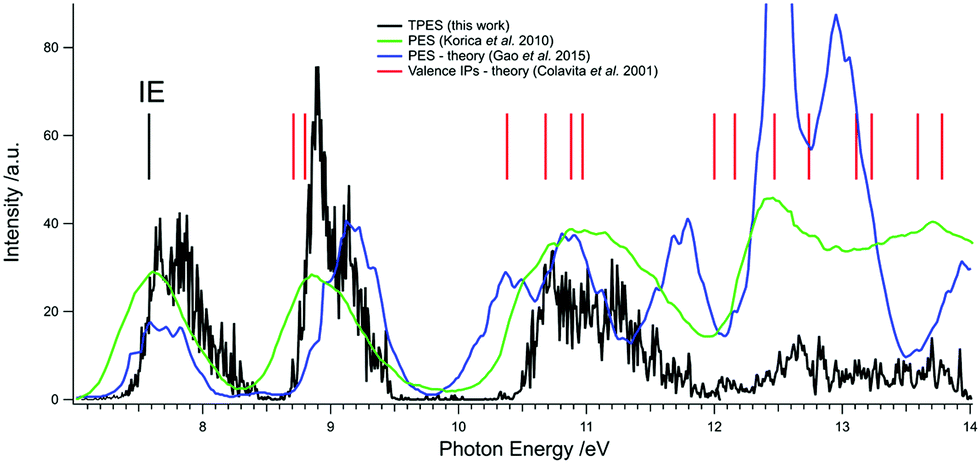 | ||
| Fig. 4 Threshold photoelectron spectrum (TPES) of C60 from threshold up to 14.0 eV (black). Superimposed is the PES of C60 at 50 eV from ref. 68 (green) and the theoretically simulated PES of C60 at 14 eV from ref. 67 (blue). The ionization potential is indicated with a black vertical stick and the red vertical sticks are the valence ionization potentials calculated by Colavita et al.30 | ||
From past experiments on the infrared spectra of C60+ cations, there are up to twelve active vibrational bands expected in the ground state alone which vary in their fundamental frequencies between 350 cm−1 (43 meV) and 1550 cm−1 (192 meV).37 It has furthermore been shown that sublimated C60 molecules embedded in a supersonic expansion do not efficiently cool vibrationally.69 With step sizes ranging from 8 meV up to 10 meV covering an energy range that includes a dozen different vibrational modes it is thus impossible to resolve any of the vibrational structure from the electronic bands we observe in the TPES. However, the bands themselves display some interesting structures on which we will elaborate.
The first electronic band we observe resembles the convolution of three distinct peaks which is very similar to that observed in the PES from Canton et al.39 As mentioned in the introduction, they showed evidence in the shape of the photoelectron spectrum of the first electronic band that suggests that the C60+ ion portrays D3d symmetry in the gas phase but not D5d, as has been derived from matrix experiments backed up by theoretical calculations.36–38 The problem with media such as noble gas matrices is that they can be quite perturbative and previous electronic and IR spectra of C60+ from such media displayed features that had to be attributed to another unidentified geometry.70 The D3d symmetry claim was called into question71 where it was argued that the three-way splitting of the tunneling states observed in the photoelectron spectrum was too large to be due to tunneling states. This was counterargued as large spacings between vibronic states is not an uncommon occurrence in free ions.72 Indeed it has been stipulated more recently that symmetries of C60 anions and cations are lower than Ih and D5d73 and it has also been shown with scanning tunneling spectroscopy that the fundamental frequencies of C60+ are insufficient to explain the complete appearance of the PES of C6074 bringing further validity to the idea of a split C60+ ground state.
In relation to C60+, the theory developed by Moate et al.34 in which the ground electronic state 2Hu is JT-active, the symmetries of the vibrations capable of coupling with it are determined from the symmetrized direct product, [Hu⊗Hu] = Ag⊕Gg⊕2Hg. As ag modes do not inflict symmetry changes, the linearly JT active modes form a basis of the Gg and Hg irreducible representations in the Ih point group which leads to a H⊗(g + 2h) JT problem comprising eight hg and six gg modes which could in principle give rise to multimode coupling. For an in-depth discussion of the theoretical treatment, see ref. 34, 75 and 76. The theory predicts that the tunneling splitting between A and H states in the D3d geometry ranges from 0 to 2ħω for the multimode H⊗(g + 2h) system (ħω is the frequency of the JT active mode) and this is what was reported,39,72 with the relative intensities of the Hu, Gu, and Au states being 5![[thin space (1/6-em)]](https://www.rsc.org/images/entities/char_2009.gif) :4:1 in their experiment which compares well with the 4:3:1 ratio of contributing JT active modes of hg, gg, and ag, respectively.76
:4:1 in their experiment which compares well with the 4:3:1 ratio of contributing JT active modes of hg, gg, and ag, respectively.76
A close-up of our measured TPES of the first two bands is presented in Fig. 5. The bands are fitted internally with Gaussians for the Hu and Gu states whereas the best fit was obtained by employing a modified Gaussian to the Au states, similar to the methodology of Canton et al.39 The observed spectral structures appear very noisy with typical widths of the noise being around 8–12 meV. An energy scan with a step size of 4 meV revealed the same structures but the noise between scans was not reproducible which made rovibrational assignments impossible.
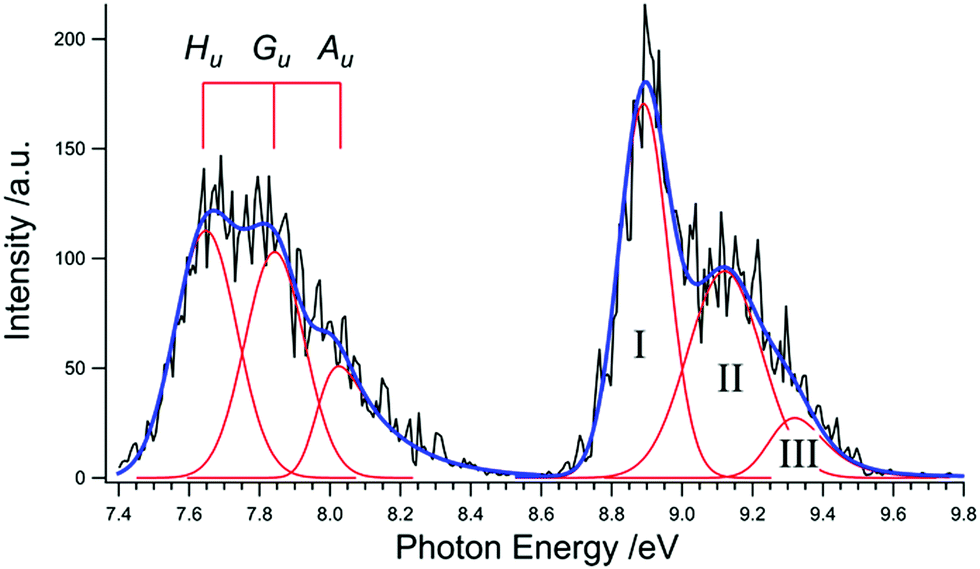 | ||
| Fig. 5 Close-up of the first two electronic bands observed in the TPES of C60. Each band is fitted with two Gaussians (for the Hu and Gu states in the first band and structures I and II in the second band) and one modified asymmetric Gaussian (for the Au state in the first band and the structure III in the second band) and are presented in red. The convoluted fit is presented in blue. | ||
When our results for the first band are analyzed in terms of the Hu, Gu, Au splitting, our TPES shows the same basic structure as Canton et al. from their PES recorded at 50 eV, with reasonably similar energy positioning considering our S/N, and with slightly dissimilar ratios between the peak intensities. The numerical results and the comparisons with the work of Canton et al. are presented in Table 2. As previously mentioned, the results favor a D3d interpretation of the ground state whereas in D5d symmetry the ground state would be split into two bands with a 5:1 intensity ratio.34 As the participating modes include eight hg, six gg modes and two ag modes, the expected ratios are 4:3:1 in a D3d symmetric ground state. Direct comparison shows that in our TPES, the Hu state appears weaker than in the PES39 while a greater contribution is observed in the Au state. The differences in intensities are interesting nonetheless as they can be indicators of differences in the possible contributions of autoionizing states converging to the different states. Besides this, we do not expect any photon energy dependence in the branching ratio since the JT-induced splitting occurs in the final cation state.
Regarding the second band, previous experiments from the early 1990's actually alluded to this sort of three way split structure as two distinct peaks at electron binding energies of 8.89 and 9.12 eV and an obscure peak at roughly 9.3 eV were seen.77 Furthermore, it has been suggested that these three peaks are closely related to peaks at 7.87, 8.12, and 8.29 eV in the absorption spectrum of C60 because the spacing between the peaks are quite similar.78 It is therefore entirely reasonable that the absorption measurements evidence a Feshbach resonance involving superexcited states originating from inner valence-excited Rydberg states of C60 converging to the two split excited states of the cation.
Assigning the second electronic band specifically is not straight-forward, however. To simplify our analysis, we fit the second band in the same manner as that of the first band – with three different peaks – to extract information about the states from the relative intensities of the fitted peaks. The results are presented in Table 3.
| E b | ΔEb | I rel | |
|---|---|---|---|
| I | 8.891 | 0 | 0.583 |
| II | 9.121 | 0.23 | 0.321 |
| III | 9.270 | 0.379 | 0.096 |
Within the second band there are two electronic states anticipated which are labeled 6gg and 10hg.30,64,65 Depending on the theory, it is not clear whether the 6gg state or the 10hg state is higher in energy. While Zakrzewski et al. predict the 10hg state to be 30 meV lower in energy than 6gg, Colavita et al. predict the 10hg state to be 110 meV higher than the 6gg state. Meanwhile, gas-phase research into the C60+ DIBs (Campbell et al. 2015; Kuhn et al. 2016) shows a splitting of 60 cm−1 (7.4 meV) between the two strongest DIBs assigned to transitions from the ground state of C60+ to its excited states. Assignment of this second band is of capital interest to the astronomical community as several of the elusive diffuse interstellar bands have recently been assigned to transitions from the electronic ground state of C60+. Thus, ascribing an accurate assignment to the electronic states of the C60+ ion might become helpful in assigning even more of the recorded DIBs.
If we, for a moment, assume that both of the electronic states in the second band are split into three tunneling states like the ground state (i.e. they are both D3d symmetric), we would expect the same basic convoluted structure of three peaks of decreasing intensity. While we observe what could be construed as a three-way splitting, the first peak is significantly stronger than that of the ground state. Between the first band and the second band, the relative intensity of the first peak increases from 0.423 to 0.583. Meanwhile, the relative intensities of the second and third peaks decrease from 0.386 to 0.321 and 0.191 to 0.096, respectively. These differences call for a different approach to explain the structure of this band.
Some significant progress has been made recently in assigning the electronic transitions that give rise to the DIBs. In their theoretical approach, Lykhin et al.43 employed electronic structure methods to describe a pseudo-JT effect in C60+ through the interaction with low-lying excited states.79 Lykhin et al. found the D5d to be energetically the most favorable ground state symmetry in accordance with prior calculations. Applying a pseudo-JT distortion to this configuration lifts the degeneracy of the first (bright) excited state giving rise to two symmetry-allowed transitions: 2Au → 2Ag and 2Au → 2Bg. This is made possible via a distortion along the lowest e1g vibrational mode pertaining to D5d symmetry. According to the epikernel principle,80 this distortion lifts the degeneracy of the excited state and distorts the D5d fullerene cage toward the C2h minima.
Since our TPES results show evidence of a D3d symmetric ground state of C60+, the question arises what impact it has on these findings. The answer is none at all. The epikernel principle dictates that a distortion of both D3d and D5d symmetries lead to C2h minima with the only difference being that from D3d symmetry, the ground state is “softened” by mixing the eg vibrational mode pertaining to D3d symmetry, rather than the lowest-lying e1g vibrational mode for D5d symmetry.
Analogous situations involving pseudo-JT distortions have been described previously.79e.g. A similar pseudo-JT effect was employed to resolve the issue of the ground state symmetry of CO3 where the ground state exhibits D3h symmetry which undergoes distortion along the e′ coordinate towards a C2v geometry which is observed in the first excited state/s.81
In terms of an exact assignment of the features of the second photoelectron band, however, the more relaxed rules of direct ionization add a level of complication since more transitions from the ground neutral state to both JT split electronic states are possible, as compared to the limited number of two bright states.43 With the added congestion from possible vibrational progressions and our current energy resolution, we can only note that the predicted JT splitting is too small to account for the peak separation in Table 3, so that most likely, and based on the calculated ionization energies, the first two bands can be attributed to direct ionization to the 6gg and 10hg states. Thus, the third band might represent vibrational progression on the cation, as already postulated.77 Confirmation of this would need FC simulations on excited states, which is a challenging theoretical task and out of the scope of the present paper.
In terms of astrophysical implications, these speculations may imply that DIBs higher in energy corresponding to excitations from the ground state to either higher vibrational progressions of the Ag and Bg states, or from the ground state to either the hg or gg excited states, are possible in principle, but in astronomical settings – particularly as cold as the diffuse ISM – these may be too weak for detection.
Exact vibrational assignments within the second band are troublesome for the same reasons as in the ground state. The vibrational structure is difficult to reproduce because a supersonic expansion does not vibrationally cool the molecule.69 As a result the intensities of the bands are not indicative of interstellar conditions (with very low temperature) and we can see in Fig. 6 that the strongest DIB transitions (9633 Å = 1.287 eV) do not exactly converge to the difference between our measured values of the vertical IP (7.648 eV) and the maximum of band I (8.891 eV) which equals 9975 Å (1.243 eV).
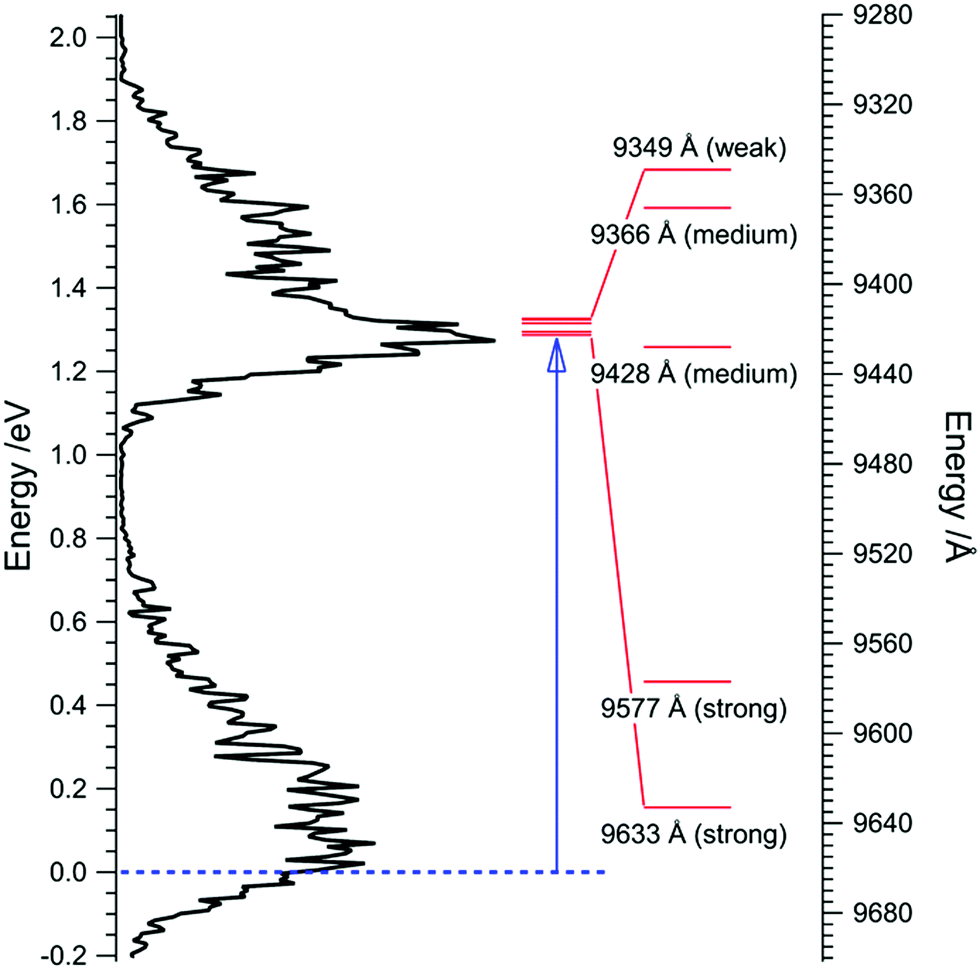 | ||
| Fig. 6 (left axis) The first two bands observed in the TPES are plotted vertically with the energy scale calibrated to zero around the IPv value of the Hu state. The blue arrow is representative of the excitations to the strongest feature in the second PES band which reflects the transitions behind the DIBs. Although the energy level correspondence between the ground state and the maximum of the second photoelectron band is good, it is not perfect as the intensities from the experiment may not be reflective of interstellar conditions. | ||
While there is definitely some observable structure in the third electronic band, no effort was made to disentangle it as the number of electronic states is double that of the states within the second band. It is noteworthy that the third band seems to be similarly structured as the ground state (i.e. split into tunneling states) and with similar intensities so an invocation of D3d symmetric states might be appropriate but a confirmation would require more work, and is beyond the scope of this paper. There are also some severe discrepancies between its appearance and that of simulated PES,67 indicating that there is still ground to be made up in the convergence of experiment and theory to the photoelectron spectrum of C60.
In effort to extract more information about the nature of these states several fixed photon energy i2PEPICO acquisitions at different energies (from 8.5 eV to 13.5 eV) were performed to measure the anisotropy parameter β of these bands. The results are presented in the ESI† and compared (where applicable) to theoretically obtained values.65,82 The recent results from Ponzi et al.65 predict a much more negative value of β for the HOMO 6hu band for slow photoelectrons (KE < 4 eV), while the agreement for faster photoelectrons is more reasonable. As for the second band, the calculations predict negative anisotropy values ranging from −0.7 to −0.1 for both 6gg and 10hg states in our photon energy range, while our experimental values start at −0.5 at 10.5 eV and progress towards slightly positive values at 13.5 eV. All in all the agreement is good considering the theoretical approximations and our experimental error bars (±0.2), but the fact that the calculated anisotropies of both 6gg and 10hg states are very similar does not allow further progress in the assignment of the second photoelectron band.
4. Further astrophysical implications
4.1 Photoionization around the Lyman-α limit
The 2D-matrix presented in Fig. 3 holds a lot of information. Relevant to the presence of C60 in photodissociation regions where Lyman-α radiation dominates, we can extract the photoelectron energy distribution, i.e. the PES corresponding to photoionization by the Lyman-α line (10.2 eV). This is achieved by taking a vertical cut of the matrix intensities at 10.2 eV (see Fig. 7). The PES shown in Fig. 7, is to our knowledge the first ever measured at this astrophysically-relevant photon energy.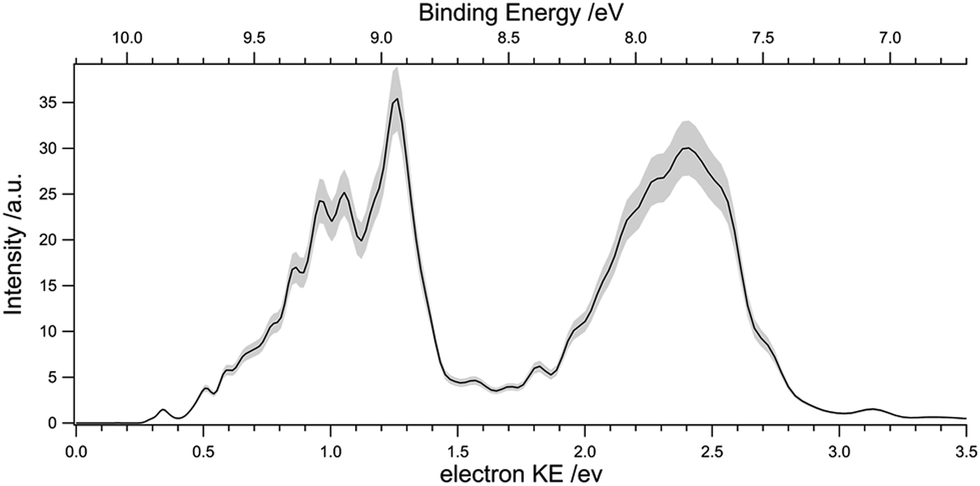 | ||
| Fig. 7 Photoelectron spectrum recorded at the Lyman-α line (10.2 eV), showing the electron energy distribution produced at this energy. The curve is obtained by vertical cut of the 2D intensity matrix in Fig. 3 at 10.2 eV which has been smoothed with a three-point smoothing. The shaded region is representative of the error bars. | ||
When the C60 photoelectron distribution for a Lyman-α like radiation is inspected more closely, two structures arise, corresponding to ionization to the ground and first two electronically excited states of C60+. The two bands have now similar intensities, unlike the case of the TPES in Fig. 5. These discrepancies are due to kinetic energy effects in the photoionization cross sections, but the overall vibrational envelope of each electronic state is quite similar, although the PES offers a lower resolution.
The UV/VUV interstellar radiation field processes the entire ISM and either electronically excites PAHs and fullerenes or ionizes them. This photoelectric effect is thought to be the dominant heating source of the ISM where the photoelectrons may carry additional kinetic energy leftover from the photoionization process, and this kinetic energy heats up the ISM.83 This is especially important for big systems, such as C60, where absolute cross-sections are expected to be relatively large (see below). The kinetic energy of the photoelectrons has been roughly evaluated by models84,85 which include some experimental information,86 but this information is still in need of an update and it requires checking whether more PAHs and fullerenes exhibit the same behavior as has been used in these models. Thus, we present here the photoelectron kinetic energy distribution of the ionization of C60 for the Lyman-α limit, which can be directly utilized by astrochemical models dealing with photoelectric emission processes from isolated carbon grains.
4.2 Absolute photoionization cross section around the Lyman-α limit
The total absolute absorption cross section of C60 in this energy range has been recorded previously,78 from which a photoionization quantum yield was deduced. The measurements were subsequently used to obtain the absolute photoionization cross section of C60 from 25 eV up to 120 eV.87 Recently, the total photoionization cross section of C60+ was measured and calculated and it was found that the absorption cross sections of neutral C60 and its cation are nearly identical, and differ from a simple 60 carbon atoms sum rule.88 This raises the question of whether the photoionization cross sections of neutral C60 and its cation display the same level of similarity as their absorption cross sections.Here, we present the cross section from threshold up to approximately 10.5 eV (Fig. 8). The reason is that above 10.5 eV, the collection of the produced photoelectrons is not 100% as the extraction field was not set high enough to collect electrons with kinetic energy release above approximately 3.5 eV (see Fig. 3). Firstly, we directly compare our results with those of Yasumatsu et al.78 by taking their absolute photoabsorption cross section multiplied with its photoionization quantum yield to obtain the absolute photoionization cross section. This is presented on the left y-axis. Secondly, we plot the absolute photoionization cross section of C60+ from Douix et al.,88 shifted down in energy (by approximately 3 eV) to coincide with the ionization onset of neutral C60. This is plotted on the right y-axis.
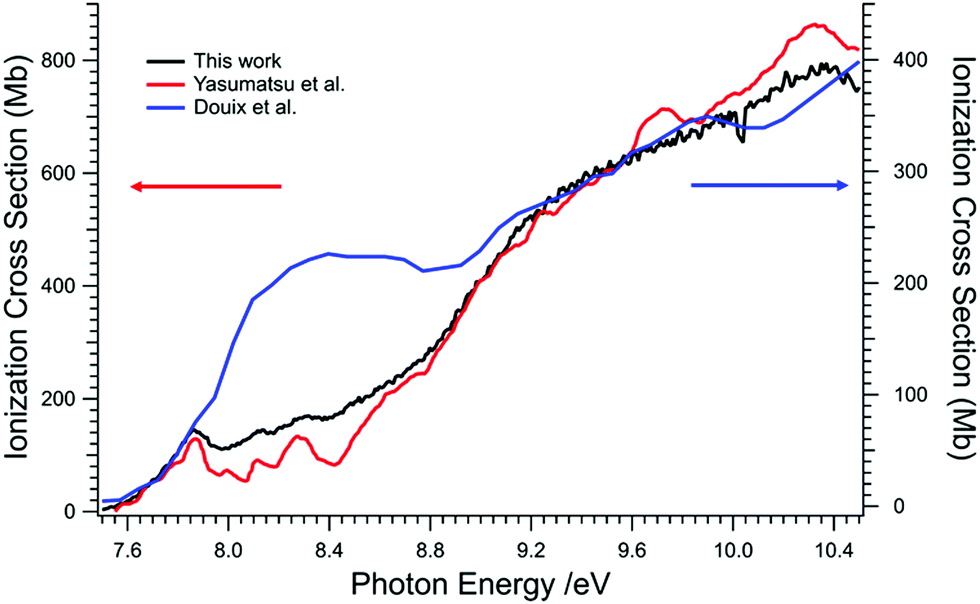 | ||
| Fig. 8 The absolute photoionization cross section from the results from Yasumatsu et al. are presented in red and is plotted on the left y-axis, as indicated with the red arrow. In blue, the absolute photoionization cross section from Douix et al. is plotted on the right y-axis, as indicated with the blue arrow. Meanwhile the total ion yield from this work is plotted in black and is scaled to match the general shapes of the two curves. | ||
There are some discrepancies between the two comparisons. The cross section obtained from Yasumatsu et al. is approximately two times larger than the one from Douix et al. It is likely that the results from Yasumatsu et al. are overestimated but they indicate an approximate 100% uncertainty value in their absolute absorption cross section. Since the calculated absorption cross-sections of neutral and cationic C60 are very similar,88 the difference seen in Fig. 8 should arise from the different ionization quantum yields. However, measuring experimental absolute ionization cross-sections is extremely challenging so that the typical error bars do not leave room for further discussion.
The total ion yield (TIY) from this work is set on an absolute scale in the VUV, calibrated at around 9 eV to the curve of Yasumatsu et al. As compared to previous work, such as the TIY of Hertel et al.48 or the absorption spectrum of Yasumatsu et al., we also observe a peak at 7.87 eV attributed to the autoionization of Rydberg series converging to the ionization limits of the first excited states of the cation. This feature is slightly visible on the 2D matrix presented in Fig. 3 on which a brighter spot is discernible at the beginning of the diagonal line corresponding to the ground state. They also assigned a vibrational progression that is associated with the peak around 8.12 eV and they attributed the slight dip at 8.45 eV to a Feshbach–Fano antiresonance due to the interaction of a superexcited state with an ionization continuum. Overall the shape of our TIY is in very good agreement with the one previously derived data.78
There is also an interesting difference in the cross sections of C60 and C60+ around a photon energy of 8.3 eV, where there seems to be a resonance present in the cross section of C60+. Undeniably the shape of our TIY compares very well with the results of Douix et al.88 apart from this region. We can only speculate on the origins of this broad resonance. It is possible that shape or confinement resonances, which have been calculated to be present in the continuum,65 are stronger in the cation due to the increased attractiveness of the potential as felt by the departing electron.
Further manipulation of the 2D photoelectron matrix can also reveal the partial photoionization cross sections of the first two bands up to 3.3 eV KE (i.e. ∼10.8 eV). Integrating along the diagonal lines (constant ionic state lines) provides the partial photoionization yield of the two bands (see Fig. 9) as a function of the electron KE. Both bands suggest the presence of shape resonances above the ionization threshold, around 1–3 eV KE.65,82 The partial cross sections of the first two bands have been previously calculated by Colavita et al.30 and more recently by Ponzi et al.65 The shapes differ quite significantly (see Fig. 9) and they, furthermore, do not account for all the shape resonances that are evident in our measurement. There are also significant differences in the DFT and TDDFT results from Ponzi et al. in this region which are due to autoionizing resonances being included in the TDDFT treatment and according to our findings it seems that these autoionizing resonances are greatly exaggerated in the TDDFT treatment where the calculations predict a value of 900 Mb at 8.7 eV (or 1.3 eV on the KE scale in Fig. 9). These exaggerations stem from the frozen core approximation where nuclear motion is not considered, and the strong geometry dependence of the resonances.
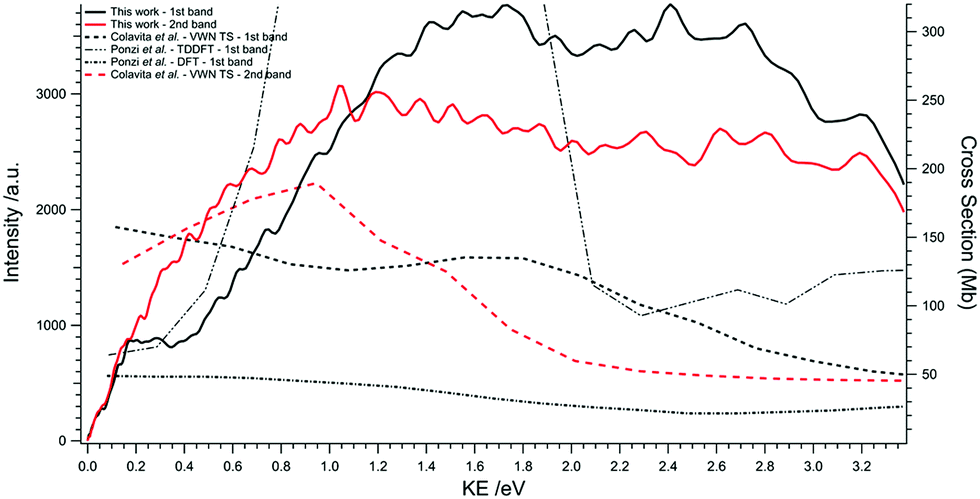 | ||
| Fig. 9 Partial photoionization yields of the first two electronic bands plotted in arbitrary units (left y-axis). Drawn in comparison are the calculated partial absolute photoionization cross sections by Colavita et al. and Ponzi et al. (right y-axis). | ||
5. Conclusions
By utilizing the i2PEPICO spectroscopic method in tandem with synchrotron radiation in the VUV range, we have uncovered a wealth of information regarding the photoionization dynamics of C60. This method provided us with a 2D-photoelectron matrix from which by horizontal, vertical, and diagonal projections/cuts of different regions of the matrix, we could obtain information relevant to the TPES, the total ion yield (normalized on an absolute scale in the VUV range), the electron kinetic energy distribution at various photon energies, and the partial photoionization cross sections of individual electronic bands.The information we have presented here on the C60 buckminsterfullerene has direct and indirect applications to ongoing astrochemical work related to DIBs and astrochemical models that include C60 photoionization and photoelectric heating with photoelectrons from PAHs and fullerenes alike, as well as addressing some fundamental questions about the symmetry of the ground state of C60+.
The results of our TPES of C60 imply a different symmetry of the ground state ion than calculations seem to favor, which is in line with some other previous experimental findings.39,74 Although this work implies that the ground state of the C60+ ion belongs to the D3d symmetry group rather than the D5d symmetry group, the recent theoretical progress43 in assigning the transitions at the heart of the DIBs that have been assigned to C60+, are not diminished – on the contrary – as both D5d and D3d symmetry groups undergo the same pseudo-JT distortion to give rise to C2h symmetry and, moreover, there does seem to be a connection between the DIBs assigned to C60+ and the most intense structure we observe in the second photoelectron band in our recorded TPES. This does not tell the whole story, however, as the energetics of the 6gg and 10hg excited states have not been definitively accounted for and it is likely that their structure in the second photoelectron band is due to photoionization converging to unresolvable vibrational modes of these states. This brings to light the temperature issue in our experiment which we expect to be higher than in a typical diffuse interstellar cloud. Next generation photoionization experiments should aim at circumventing the hot vibrational temperature issue using cryogenic methods to cool C60 molecules, as has been successfully achieved for IR spectroscopy.89
Finally, although scarce, the results on the electron continuum suggest differences between calculated and experimental cross sections and anisotropy values, which in turn highlight the difficulties of calculating continuum properties in large systems and could be used as benchmarks for further theoretical advancements.
Conflicts of interest
There are no conflicts of interest to declare.Acknowledgements
We are grateful to the whole SOLEIL for provision of synchrotron radiation under proposal number 20180297, as well as to J.-F. Gil for his technical assistance on the SAPHIRS endstation. H. R. H. is grateful for support from the Marie Sklodowska Curie Actions, proposal ID: 838372.References
- H. Kroto, J. Heath, S. Obrien, R. Curl and R. Smalley, C60 Buckminsterfullerene, Nature, 1985, 318, 162–163 CrossRef CAS.
- H. Kroto, C. Kirby, D. Walton, L. Avery, N. Broten, J. Macleod and T. Oka, Detection of Cyanohexatriyne, H(C
![[double bond, length as m-dash]](https://www.rsc.org/images/entities/char_e001.gif) C)3CN, in Heiles Cloud 2, Astrophys. J., 1978, 219, L133–L137 CrossRef CAS.
C)3CN, in Heiles Cloud 2, Astrophys. J., 1978, 219, L133–L137 CrossRef CAS. - N. Broten, T. Oka, L. Avery, J. Macleod and H. Kroto, Detection of HC9N in Interstellar Space, Astrophys. J., 1978, 223, L105–L107 CrossRef CAS.
- G. Winnewisser and C. Walmsley, Detection of HC5N and HC7N in IRC + 10216, Astron. Astrophys., 1978, 70, L37–L39 CAS.
- L. Little, G. Macdonald, P. Riley and D. Matheson, Observations of Interstellar HC5N and HC7N in Dark Dust Clouds, Mon. Not. R. Astron. Soc., 1978, 183, P45–P50 CrossRef.
- K. Sellgren, M. W. Werner, J. G. Ingalls, J. D. T. Smith, T. M. Carleton and C. Joblin, C60 in Reflection Nebulae, Astrophys. J., Lett., 2010, 722, L54–L57 CrossRef CAS.
- J. Cami, J. Bernard-Salas, E. Peeters and S. E. Malek, Detection of C60 and C70 in a Young Planetary Nebula, Science, 2010, 329, 1180–1182 CrossRef CAS PubMed.
- O. Berne, G. Mulas and C. Joblin, Interstellar C60+, Astron. Astrophys., 2013, 550, L4, DOI:10.1051/0004-6361/201220730.
- C. Boersma, R. H. Rubin and L. J. Allamandola, Spatial Analysis of the Polycyclic Aromatic Hydrocarbon Features Southeast of the Orion Bar, Astrophys. J., 2012, 753(2), 168, DOI:10.1088/0004-637X/753/2/168.
- D. A. Garcia-Hernandez, N. K. Rao and D. L. Lambert, Are C60 Molecules Detectable in Circumstellar Shells of R Coronae Borealis Stars?, Astrophys. J., 2011, 729(2), 126, DOI:10.1088/0004-637X/729/2/126.
- C. Gielen, J. Cami, J. Bouwman, E. Peeters and M. Min, Carbonaceous Molecules in the Oxygen-Rich Circumstellar Environment of Binary Post-AGB Stars – C60 Fullerenes and Polycyclic Aromatic Hydrocarbons, Astron. Astrophys., 2011, 536, A54, DOI:10.1051/0004-6361/201117961.
- P. Castellanos, O. Berne, Y. Sheffer, M. G. Wolfire and A. G. G. M. Tielens, C60 in Photodissociation Regions, Astrophys. J., 2014, 794(1), 83, DOI:10.1088/0004-637X/794/1/83.
- E. K. Campbell, M. Holz, D. Gerlich and J. P. Maier, Laboratory Confirmation of C60+ as the Carrier of Two Diffuse Interstellar Bands, Nature, 2015, 523, 322 CrossRef CAS PubMed.
- M. Kuhn, M. Renzler, J. Postler, S. Ralser, S. Spieler, M. Simpson, H. Linnartz, A. G. G. M. Tielens, J. Cami, A. Mauracher, Y. Wang, M. Alcami, F. Martin, M. K. Beyer, R. Wester, A. Lindinger and P. Scheier, Atomically Resolved Phase Transition of Fullerene Cations Solvated in Helium Droplets, Nat. Commun., 2016, 7, 13550, DOI:10.1038/ncomms13550.
- M. A. Cordiner, H. Linnartz, N. L. J. Cox, J. Cami, F. Najarro, C. R. Proffitt, R. Lallement, P. Ehrenfreund, B. H. Foing, T. R. Gull, P. J. Sarre and S. B. Charnley, Confirming Interstellar C60+ Using the Hubble Space Telescope, Astrophys. J., 2019, 875, L28 CrossRef CAS.
- J. Maier, N. Lakin, G. Walker and D. Bohlender, Detection of C3 in Diffuse Interstellar Clouds, Astrophys. J., 2001, 553, 267–273 CrossRef CAS.
- M. R. Schmidt, J. Krelowski, G. A. Galazutdinov, D. Zhao, M. A. Haddad, W. Ubachs and H. Linnartz, Detection of Vibronic Bands of C3 in a Translucent Cloud Towards HD 169454, Mon. Not. R. Astron. Soc., 2014, 441, 1134–1146 CrossRef CAS.
- G. Herbig, The Diffuse Interstellar Bands, Annu. Rev. Astron. Astrophys., 1995, 33, 19–73 CrossRef CAS.
- P. J. Sarre, The Diffuse Interstellar Bands: A Major Problem in Astronomical Spectroscopy, J. Mol. Spectrosc., 2006, 238, 1–10 CrossRef CAS.
- N. L. J. Cox, J. Cami, L. Kaper, P. Ehrenfreund, B. H. Foing, B. B. Ochsendorf, S. H. M. van Hooff and F. Salama, VLT/X-Shooter Survey of Near-Infrared Diffuse Interstellar Bands, Astron. Astrophys., 2014, 569, A117, DOI:10.1051/0004-6361/201323061.
- H. Linnartz, J. Cami, M. Cordiner, N. L. J. Cox, P. Ehrenfreund, B. Foing, M. Gatchell and P. Scheier, C60+ as a Diffuse Interstellar Band Carrier; A Spectroscopic Story in 6 Acts, J. Mol. Spectrosc., 2020, 367, 111243 CrossRef CAS.
- A. G. G. M. Tielens, The Molecular Universe, Rev. Mod. Phys., 2013, 85, 1021–1081 CrossRef CAS.
- O. Berne and A. G. G. M. Tielens, Formation of Buckminsterfullerene (C60) in Interstellar Space, Proc. Natl. Acad. Sci. U. S. A., 2012, 109, 401–406 CrossRef CAS PubMed.
- W. W. Duley and A. Hu, Fullerenes and Proto-Fullerenes in Interstellar Carbon Dust, Astrophys. J., Lett., 2012, 745(1), L11, DOI:10.1088/2041-8205/745/1/L11.
- J. Zhen, P. Castellanos, D. M. Paardekooper, H. Linnartz and A. G. G. M. Tielens, Laboratory Formation of Fullerenes from PAHS: Top-Down Interstellar Chemistry, Astrophys. J., Lett., 2014, 797(2), L30, DOI:10.1088/2041-8205/797/2/L30.
- T. Chen, J. Zhen, Y. Wang, H. Linnartz and A. G. G. M. Tielens, From Planes to Bowls: Photodissociation of the Bisanthenequinone Cation, Chem. Phys. Lett., 2018, 692, 298–303 CrossRef CAS.
- W. Zhang, Y. Si, J. Zhen, T. Chen, H. Linnartz and A. G. G. M. Tielens, Laboratory Photochemistry of Covalently Bonded Fluorene Clusters: Observation of an Interesting PAH Bowl-forming Mechanism, Astrophys. J., 2019, 872, 38 CrossRef CAS.
- A. G. G. M. Tielens, Interstellar Polycyclic Aromatic Hydrocarbon Molecules, Annu. Rev. Astron. Astrophys., 2008, 46, 289–337 CrossRef CAS.
- A. C. Brieva, R. Gredel, C. Jaeger, F. Huisken and T. Henning, C60 as a Probe for Astrophysical Environments, Astrophys. J., 2016, 826(2), 112, DOI:10.3847/0004-637X/826/2/122.
- P. Colavita, G. De Alti, G. Fronzoni, M. Stener and P. Decleva, Theoretical Study of the Valence and Core Photoemission Spectra of C60, Phys. Chem. Chem. Phys., 2001, 3, 4481–4487 RSC.
- D. Toffoli, M. Stener, G. Fronzoni and P. Decleva, Computational Characterization of the HOMO-2 Photoemission Intensity Oscillations in C60, Chem. Phys. Lett., 2011, 516, 154–157 CrossRef CAS.
- C. C. Chancey and M. C. M. O’Brien, The Jahn–Teller Effect in C60 and Other Icosahedral Complexes, Princeton University Press, Princeton, N.J., 1997 Search PubMed.
- N. Manini, A. Dal Corso, M. Fabrizio and E. Tosatti, Electron-Vibration Coupling Constants in Positively Charged Fullerene, Philos. Mag. B, 2001, 81, 793–812 CrossRef CAS.
- C. Moate, J. Dunn, C. Bates and Y. Liu, An Analytical Model for the H⊗(h⊕g) Jahn–Teller System, J. Phys.: Condens. Matter, 1997, 9, 6049–6060 CrossRef CAS.
- G. Dresselhaus, M. Dresselhaus and P. Eklund, Symmetry for Lattice Modes in C60 and Alkali-Metal-Doped C60, Phys. Rev. B: Condens. Matter Mater. Phys., 1992, 45, 6923–6930 CrossRef CAS PubMed.
- J. Fulara, M. Jakobi and J. Maier, Electronic and Infrared-Spectra of C60+ and C60− in Neon and Argon Matrices, Chem. Phys. Lett., 1993, 211, 227–234 CrossRef CAS.
- B. Kern, D. Strelnikov, P. Weis, A. Boettcher and M. M. Kappes, IR Absorptions of C60+ and C60− in Neon Matrixes, J. Phys. Chem. A, 2013, 117, 8251–8255 CrossRef CAS PubMed.
- D. Strelnikov, B. Kern and M. M. Kappes, On Observing C60+ and C602+ in Laboratory and Space, Astron. Astrophys., 2015, 584, A55, DOI:10.1051/0004-6361/201527234.
- S. Canton, A. Yencha, E. Kukk, J. Bozek, M. Lopes, G. Snell and N. Berrah, Experimental Evidence of a Dynamic Jahn–Teller Effect in C60+, Phys. Rev. Lett., 2002, 89(4), 045502, DOI:10.1103/PhysRevLett.89.045502.
- R. Bendale, J. Stanton and M. Zerner, Investigation of the Electronic-Structure and Spectroscopy of Jahn–Teller Distorted C60+, Chem. Phys. Lett., 1992, 194, 467–471 CrossRef CAS.
- M. Luders, N. Manini, P. Gattari and E. Tosatti, Hund's Rule Magnetism in C60 Ions?, Eur. Phys. J. B, 2003, 35, 57–68 CrossRef.
- I. D. Hands, L. M. Sindi, J. L. Dunn and C. A. Bates, Theoretical Treatment of Pseudorotation in the Jahn–Teller C60+ Ion, Phys. Rev. B: Condens. Matter Mater. Phys., 2006, 74(11), 115410, DOI:10.1103/PhysRevB.74.115410.
- A. O. Lykhin, S. Ahmadvand and S. A. Varganov, Electronic Transitions Responsible for C60+ Diffuse Interstellar Bands, J. Phys. Chem. Lett., 2019, 10, 115–120 CrossRef CAS PubMed.
- G. A. Galazutdinov, V. V. Shimansky, A. Bondar, G. Valyavin and J. Krelowski, C60+ – Looking for the Bucky-Ball in Interstellar Space, Mon. Not. R. Astron. Soc., 2017, 465, 3956–3964 CrossRef CAS.
- R. Lallement, N. L. J. Cox, J. Cami, J. Smoker, A. Fahrang, M. Elyajouri, M. A. Cordiner, H. Linnartz, K. T. Smith, P. Ehrenfreund and B. H. Foing, The EDIBLES Survey II. The Detectability of C60+ Bands, Astron. Astrophys., 2018, 614, A28 CrossRef.
- P. Benning, D. Poirier, N. Troullier, J. Martins, J. Weaver, R. Haufler, L. Chibante and R. Smalley, Electronic States of Solid C60 – Symmetries and Photoionization Cross-Sections, Phys. Rev. B: Condens. Matter Mater. Phys., 1991, 44, 1962–1965 CrossRef CAS PubMed.
- J. Weaver, J. Martins, T. Komeda, Y. Chen, T. Ohno, G. Kroll, N. Troullier, R. Haufler and R. Smalley, Electronic-Structure of Solid C60 – Experiment and Theory, Phys. Rev. Lett., 1991, 66, 1741–1744 CrossRef CAS PubMed.
- I. Hertel, H. Steger, J. De Vries, B. Weisser, C. Menzel, B. Kamke and W. Kamke, Giant Plasmon Excitation in Free C60 and C70 Molecules Studied by Photoionization, Phys. Rev. Lett., 1992, 68, 784–787 CrossRef CAS PubMed.
- H. Steger, J. De Vries, B. Kamke, W. Kamke and T. Drewello, Direct Double Ionization of C60 and C70 Fullerenes Using Synchrotron Radiation, Chem. Phys. Lett., 1992, 194, 452–456 CrossRef CAS.
- J. De Vries, H. Steger, B. Kamke, C. Menzel, B. Weisser, W. Kamke and I. Hertel, Single-Photon Ionization of C60-Fullerene and C70-Fullerene with Synchrotron Radiation – Determination of the Ionization-Potential of C60, Chem. Phys. Lett., 1992, 188, 159–162 CrossRef CAS.
- T. Liebsch, O. Plotzke, F. Heiser, U. Hergenhahn, O. Hemmers, R. Wehlitz, J. Viefhaus, B. Langer, S. Whitfield and U. Becker, Angle-Resolved Photoelectron-Spectroscopy of C60, Phys. Rev. A: At., Mol., Opt. Phys., 1995, 52, 457–464 CrossRef CAS PubMed.
- K. Hansen, R. Richter, M. Alagia, S. Stranges, L. Schio, P. Salen, V. Yatsyna, R. Feifel and V. Zhaunerchyk, Single Photon Thermal Ionization of C60, Phys. Rev. Lett., 2017, 118(10), 103001, DOI:10.1103/PhysRevLett.118.103001.
- L. Nahon, N. de Oliveira, G. A. Garcia, J.-F. Gil, B. Pilette, O. Marcouille, B. Lagarde and F. Polack, DESIRS: A State-of-the-Art VUV Beamline Featuring High Resolution and Variable Polarization for Spectroscopy and Dichroism at SOLEIL, J. Synchrotron Radiat., 2012, 19, 508–520 CrossRef CAS PubMed.
- O. Marcouille, P. Brunelle, O. Chubar, F. Marteau, M. Massal, L. Nahon, K. Tavakoli, J. Veteran and J.-M. Filhol, in Synchrotron Radiation Instrumentation Pts 1 & 2, ed. J. Y. Choi and S. Rah, AMER Inst. Physics, 2 Huntington Quadrangle, Ste 1NO1, Melville, NY 11747-4501 USA, 2007, vol. 879, pp. 311–314 Search PubMed.
- B. Mercier, M. Compin, C. Prevost, G. Bellec, R. Thissen, O. Dutuit and L. Nahon, Experimental and Theoretical Study of a Differentially Pumped Absorption Gas Cell Used as a Low Energy-Pass Filter in the Vacuum Ultraviolet Photon Energy Range, J. Vac. Sci. Technol., A, 2000, 18, 2533–2541 CrossRef CAS.
- G. A. Garcia, B. K. C. de Miranda, M. Tia, S. Daly and L. Nahon, DELICIOUS III: A Multipurpose Double Imaging Particle Coincidence Spectrometer for Gas Phase Vacuum Ultraviolet Photodynamics Studies, Rev. Sci. Instrum., 2013, 84(5), 053112, DOI:10.1063/1.4807751.
- X. Tang, G. A. Garcia, J.-F. Gil and L. Nahon, Vacuum Upgrade and Enhanced Performances of the Double Imaging Electron/Ion Coincidence End-station at the Vacuum Ultraviolet Beamline DESIRS, Rev. Sci. Instrum., 2015, 86(12), 123108, DOI:10.1063/1.4937624.
- H. R. Hrodmarsson, J.-C. Loison, U. Jacovella, D. M. P. Holland, S. Boye-Peronne, B. Gans, G. A. Garcia, L. Nahon and S. T. Pratt, Valence-Shell Photoionization of C4H5: The 2-Butyn-1-yl Radical, J. Phys. Chem. A, 2019, 123, 1521–1528 CrossRef CAS PubMed.
- H. R. Hrodmarsson, G. A. Garcia, L. Nahon, B. Gans and J.-C. Loison, Threshold Photoelectron Spectrum of the Anilino Radical, J. Phys. Chem. A, 2019, 123, 9193–9198 CrossRef CAS PubMed.
- G. Garcia, L. Nahon and I. Powis, Two-Dimensional Charged Particle Image Inversion Using a Polar Basis Function Expansion, Rev. Sci. Instrum., 2004, 75, 4989–4996 CrossRef CAS.
- J. Hawkins, A. Meyer, S. Loren and R. Nunlist, Statistical Incorporation of C-13(2) Units into C60, J. Am. Chem. Soc., 1991, 113, 9394–9395 CrossRef CAS.
- J. Menendez and J. Page, Light Scattering in Solids VIII, Springer-Verlag Berlin, Heidelberger Platz 3, D-14197 Berlin, Germany, 2000, vol. 76, pp. 27–95 Search PubMed.
- R. Yoo, B. Ruscic and J. Berkowitz, Vacuum Ultraviolet Photoionization Mass-Spectrometric Study of C60, J. Chem. Phys., 1992, 96, 911–918 CrossRef CAS.
- V. G. Zakrzewski, O. Dolgounitcheva and J. V. Ortiza, Electron Propagator Calculations on C60 and C70 Photoelectron Spectra, J. Chem. Phys., 2008, 129, 104306 CrossRef CAS PubMed.
- A. Ponzi, S. T. Manson and P. Decleva, Photoionization of C60: Effects of Correlation on Cross Sections and Angular Distributions of Valence Subshells, J. Phys. Chem. A, 2020, 124, 108–125 CrossRef CAS PubMed.
- J. C. Poully, J. P. Schermann, N. Nieuwjaer, F. Lecomte, G. Gregoire, C. Desfrancois, G. A. Garcia, L. Nahon, D. Nandi, L. Poisson and M. Hochlaf, Photoionization of 2-pyridone and 2-hydroxypyridine, Phys. Chem. Chem. Phys., 2010, 12, 3566–3572 RSC.
- C.-Z. Gao, P. Wopperer, P. M. Dinh, E. Suraud and P.-G. Reinhard, On the Dynamics of Photo-Electrons in C60, J. Phys. B: At., Mol. Opt. Phys., 2015, 48(10), 105102, DOI:10.1088/0953-4075/48/10/105102.
- S. Korica, A. Reinkoester, M. Braune, J. Viefhaus, D. Rolles, B. Langer, G. Fronzoni, D. Toffoli, M. Stener, P. Decleva, O. M. Al-Dossary and U. Becker, Partial Photoionization Cross Sections of C60 and C70: A Gas versus Adsorbed Phase Comparison, Surf. Sci., 2010, 604, 1940–1944 CrossRef CAS.
- J. T. Stewart, B. E. Brumfeld, B. M. Gibson and B. J. McCall, Inefficient Vibrational Cooling of C60 in a Supersonic Expansion, ISRN Phys. Chem., 2013, 2013, 675138 Search PubMed.
- Z. Gasyna, L. Andrews and P. Schatz, Near-Infrared Absorption-Spectra of C60 Radical Cations and Anions Prepared Simultaneously in Solid Argon, J. Phys. Chem., 1992, 96, 1525–1527 CrossRef CAS.
- N. Manini and E. Tosatti, Comment on “Experimental Evidence of a Dynamic Jahn–Teller Effect in C60+”, Phys. Rev. Lett., 2003, 90(24), 249601, DOI:10.1103/PhysRevLett.90.249601.
- S. Canton, A. Yencha, E. Kukk, J. Bozek, M. Lopes, G. Snell and N. Berrah, Comment of “Experimental Evidence of a Dynamic Jahn–Teller Effect in C60+”, Phys. Rev. Lett., 2003, 90(24), 249602, DOI:10.1103/PhysRevLett.90.249602.
- J. Tamuliene, Electronic and Vibrational Spectra of C60 and Its Ions, Fullerenes, Nanotubes, Carbon Nanostruct., 2015, 23, 187–195 CrossRef CAS.
- T. Frederiksen, K. J. Franke, A. Arnau, G. Schulze, J. I. Pascual and N. Lorente, Dynamic Jahn–Teller Effect in Electronic Transport through Single C60 Molecules, Phys. Rev. B: Condens. Matter Mater. Phys., 2008, 78(23), 233401, DOI:10.1103/PhysRevB.78.233401.
- A. Ceulemams and P. Fowler, The Jahn–Teller Instability of Fivefold Degenerate States in Icosahedral Molecules, J. Chem. Phys., 1990, 93, 1221–1234 CrossRef.
- H. Ramanantoanina, M. Zlatar, P. Garcia-Fernandez, C. Daul and M. Gruden-Pavlovic, General Treatment of the Multimode Jahn–Teller Effect: Study of Fullerene Cations, Phys. Chem. Chem. Phys., 2013, 15, 1252–1259 RSC.
- D. Lichtenberger, K. Nebesny, C. Ray, D. Huffman and L. Lamb, Valence and Core Photoelectron-Spectroscopy of C60, Buckminsterfullerene, Chem. Phys. Lett., 1991, 176, 203–208 CrossRef CAS.
- H. Yasumatsu, T. Kondow, H. Kitagawa, K. Tabayashi and K. Shobatake, Absorption Spectrum of C60 in the Gas Phase: Autoionization via Core-Excited Rydberg States, J. Chem. Phys., 1996, 104, 899–902 CrossRef CAS.
- I. B. Bersuker, Pseudo-Jahn–Teller Effect—A Two-State Paradigm in Formation, Deformation, and Transformation of Molecular Systems and Solids, Chem. Rev., 2013, 113, 1351–1390 CrossRef CAS PubMed.
- A. Ceulemans and L. G. Vanquickenborne, Stereochemistry and Bonding, Springer Berlin Heidelberg, Berlin, Heidelberg, 1989, vol. 71, pp. 125–159 Search PubMed.
- D. A. Hrovat, G.-L. Hou, B. Chen, X.-B. Wang and W. T. Borden, Negative Ion Photoelectron Spectroscopy Confirms the Prediction that D3h Carbon Trioxide (CO3) has a Singlet Ground State, Chem. Sci., 2016, 7, 1142–1150 RSC.
- M. Venuti, M. Stener, G. De Alti and P. Decleva, Photoionization of C60 by Large Scale One-Center Density Functional Explicit Continuum Wave-Function, J. Chem. Phys., 1999, 111, 4589–4597 CrossRef CAS.
- E. Bakes and A. Tielens, The Photoelectric Heating Mechanism for Very Small Graphitic Grains and Polycyclic Aromatic-Hydrocarbons, Astrophys. J., 1994, 427, 822–838 CrossRef CAS.
- E. Habart, L. Verstraete, F. Boulanger, G. P. des Forets, F. Le Peintre and J. P. Bernard, Photoelectric Effect on Dust Grains across the L1721 Cloud in the Rho Ophiuchi Molecular Complex, Astron. Astrophys., 2001, 373, 702–713 CrossRef CAS.
- J. C. Weingartner and B. T. Draine, Photoelectric Emission from Interstellar Dust: Grain Charging and Gas Heating, Astrophys. J., 2001, 134(Suppl. Ser), 263–281 CAS.
- L. Verstraete, A. Leger, L. Dhendecourt, O. Dutuit and D. Defourneau, Ionization Cross-Section Measurements for 2 PAH Molecules – Implications for the Heating of Diffuse Interstellar Gas, Astron. Astrophys., 1990, 237, 436–444 CAS.
- B. P. Kafle, H. Katayanagi, Md. S. I. Prodhan, H. Yagi, C. Huang and K. Mitsuke, Absolute Total Photoionization Cross Section of C60 in the Range of 25–120 eV: Revisited, J. Phys. Soc. Jpn., 2008, 77(1), 014302, DOI:10.1143/JPSJ.77.014302.
- S. Douix, D. Duflot, D. Cubaynes, J.-M. Bizau and A. Giuliani, Photoionization of the Buckminsterfullerene Cation, J. Phys. Chem. Lett., 2017, 8, 7–12 CrossRef CAS PubMed.
- P. B. Changala, M. L. Weichman, K. F. Lee, M. E. Fermann and J. Ye, Rovibrational Quantum State Resolution of the C60 Fullerene, Science, 2019, 363, 49–54 CrossRef CAS PubMed.
Footnote |
| † Electronic supplementary information (ESI) available. See DOI: 10.1039/d0cp01210f |
| This journal is © the Owner Societies 2020 |