 Open Access Article
Electronic conductivity of polymer electrolytes: electronic charge transport properties of LiTFSI-doped PEO†
Mikael
Unge
 *ab,
Harish
Gudla
b,
Chao
Zhang
 b and
Daniel
Brandell
 *b
*b
aABB Corporate Research, SE 72178, Västerås, Sweden. E-mail: mikael.unge@se.abb.com; daniel.brandell@kemi.uu.se
bDepartment of Chemistry - Ångström Laboratory, Uppsala Universitet, SE 75121 Uppsala, Sweden
First published on 27th March 2020
Abstract
The electronic structure of poly(ethyleneoxide) with and without a common electrolyte lithium bis(trifluoromethane)sulfonimide salt is calculated from first principles. Introducing the salt into the polymer electrolyte significantly reduces the band gap, down to 0.6 eV. Thus, this will have a significant impact on the leakage currents in polymer electrolytes used in all-solid-state batteries.
While recent years have seen a tremendous increase in the interest for solid (solvent-free) polymer electrolytes (SPEs) due to their potential ability to realize all-solid-state batteries, the main challenge for this category of materials is still the comparatively low room temperature ionic conductivity.1,2 Despite several different approaches3–5 it has been shown to be difficult to achieve ionic transport properties of the same order of magnitude necessary for most battery applications. A common argument in this context, however, is that the polymer electrolyte can be fabricated extremely thin: which would limit the problems associated with poor ionic conductivity,6 and contribute to a much higher energy density.7
It is in this context often neglected in literature that while a very thin electrolytes will generate a low ionic resistance, it will also generate a low electronic resistance – which likewise scales linearly with thickness. High electronic resistivity of the electrolyte system is vital in battery applications to avoid internal short-circuits and self-discharge of the cells.8,9 Very few studies of polymer electrolytes include any appropriate determination of electronic conductive properties except that it is occasionally measured chronoamperiometrically through Wagner's polarization method as the electronic fraction of the total current.10 In such studies, the electronic contribution is often determined to ca. 1%, which is then deemed satisfactorily.11 1% could, however, well correspond to conductivities in the order 10−7–10−9 S cm−1. This is not a negligible electronic leakage current if the electrolyte is scaled down to the micrometer range. Studies of thin-film batteries12 and 3D-microbatteries13 have sometimes addressed this issue, where electronic conductivities around 10−15 S cm−1 rather have been targeted.14 At the same time, it is well-known from the field of electric insulators that polymeric materials very rarely display resistivities higher than 1017 Ω cm.15,16
Electronic conduction in polymeric systems normally occurs through thermally activated processes both in conducting polymers17 and non-conducting polymers.18 The charge transfer process occurs via localized electronic states that could have weak or strong coupling to phonons where the latter forms polarons.19 In the context of amorphous polymers, the localization of the electronic states is typically reduced to segments of the polymer and small polarons formed,20 which is described by reorganization energies in the Marcus theory of electron transfer.21 However, even though the electronic states closest to the band edges are localized, there exist delocalized states further away from the band edges. This location is known as the mobility edge for electron and holes. Thus, it is important to know where in the band the mobility edge is in order to understand how transport will occur. Band gap and density of states are additional important properties for understanding the electronic charge carrier transport properties. Moreover, it can be expected that the relatively high concentration of salt has a significant impact on percolation related properties such as electron/hole mobility and mobility edge location. It is thus of high importance to get a better fundamental understanding of the electronic properties of SPEs, and not only the conventionally studied ionic conduction.
The above-mentioned properties are in principle accessible computationally through ab initio or density functional theory (DFT) methodologies. However, a hurdle for using conventional DFT for amorphous polymers is the system size, due to the cubic scaling with the number of electrons in the system. The linear scaling DFT (LS-DFT) method as implemented in the ONETEP code is therefore useful and has previously been applied to polymer systems.18,22–25
The electronic properties of SPEs have so far primarily been addressed through estimations of the reactivity and chemical stability in bulk or at surfaces of primarily molecular model system.26–28 In this study, we focus on the electronic structure properties that have a direct impact on the electronic conduction calculated of the full amorphous polymer electrolyte. Through application of LS-DFT, we determined band gap, density of states (DOS) and mobility edges which impact e.g. charge injection barriers and transport mechanism. Moreover, we explored the effects of temperature and salt concentration, thereby rendering it possible to distinguish how the charge transport properties are impacted by these ambient and system dependent conditions.
Poly(ethyleneoxide) (PEO) is the most investigated polymer host for SPE materials and therefore selected for the present study. Several different structures are considered, crystal structure of PEO,29 and amorphous PEO at different temperatures and doped with the lithium bis-(trifluoromethane)sulfonimide (LiTFSI)30 salt at different concentrations. Details on structure preparation are included in the ESI.†
Calculation of the electronic structure of the crystalline PEO was performed through standard dispersion corrected DFT, for details see ESI.† Investigation of the orbitals show that the conduction states are interchain states. Using PBE-TS, the obtained band gaps are 5.25 eV and 5.27 eV with standard DFT and LS-DFT, respectively, which is in agreement with recently published results.31 Instead, the hybrid functional PBE0-TS gives a band gap of 7.67 eV. This discrepancy is not surprising in the view of band gap calculation of other dielectric polymers.18,32 However, experimental values of the PEO band gap has been determined via optical absorption measurements to 4.4–5.1 eV and 4.5–5.8 eV for indirect and direct band gaps, respectively.33–35 It is worth noting that the measurements were done at room temperature, and the samples thus contain both crystalline and amorphous phases of PEO.36 Hence, the measured band gap may origin primarily from the amorphous phase of PEO; this is investigated below.
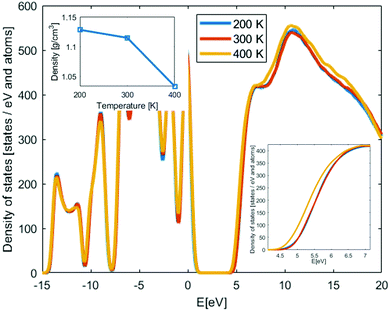
Amorphous PEO structures were generated and relaxed using MD simulations as described in the ESI† for different temperatures to cover both room temperature conditions and above and below the glass transition temperature (Tg ∼ 210 K37,38); i.e. 200 K, 300 K and 400 K. Three structures per temperature are used to get initial statistical variance of the properties. In the inset of Fig. 1, the mass density of the amorphous PEO structures is shown as function of temperature. The mass density is about the same at 200 K and 300 K, but at 400 K the mass density is much lower since this is clearly above the glass transition temperature; see ESI.† Due to that the conduction band states are interchain states, the mass density change above Tg is expected to impact the density of states (DOS). In Fig. 1, the DOS of PEO from LS-DFT calculations for the amorphous structures at different temperatures are shown. The results have been aligned around the core state peak at −9 eV and then averaged from three different structures. The band gap, determined from the individual band edge states, is about 4.2 eV at 200 K and 300 K, while at 400 K the band gap is 3.9 eV. This can be understood from the interchain nature of the conduction states; at lower density the conduction states relax in the larger free volume pockets compared to the free volume pockets in the structures below Tg. Both above and below Tg the band gap is significantly smaller compared to the crystalline structure, while the comparison with experimentally predicted band gap is rather good, displaying only 0.2–0.3 eV difference between 200–300 K values and direct band gaps. Hence, it is likely that the experimental band gap values of PEO is determined by the amorphous phase of PEO.
As mentioned before, the localization behaviour of the orbitals is important for the charge transport mechanism. In extreme cases, the states are fully delocalized and the band transport model is the most appropriate for describing the charge transport. In contrast, if these states are localized, different hopping models should be used instead. First, we visually investigated the band edge states; in Fig. 2 four different orbitals are shown in an amorphous PEO structure. It is clear that the HOMO is localized along the polymer backbone of PEO and that the conduction states are localized in free volume pockets in the structure. Hence, as for the crystalline phase, the LUMO+n are interchain states.
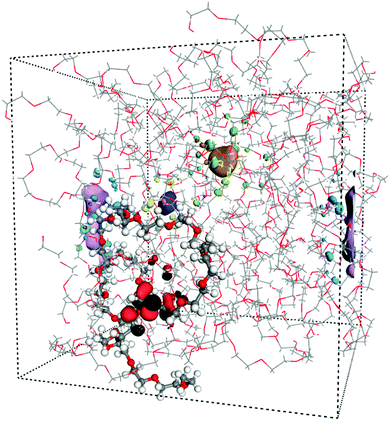 | ||
| Fig. 2 Amorphous PEO at 300 K including four orbitals. HOMO (black-red) is localized along the highlighted PEO chain while LUMO, LUMO+1, LUMO+2 are localized in free volume pockets. | ||
It is also important to know the location of the mobility edge, which is the energy position for the transition from localized to delocalized orbitals. If the difference between the band edge and the mobility edge, considered as activation energy, is significantly larger than the thermal energy, the hopping conduction will dominate since thermal energy then cannot excite electrons/holes to the delocalized states. If the activation energy on the other hand is small, band transport, likely trap limited, will be the dominating electronic charge transport mechanism.
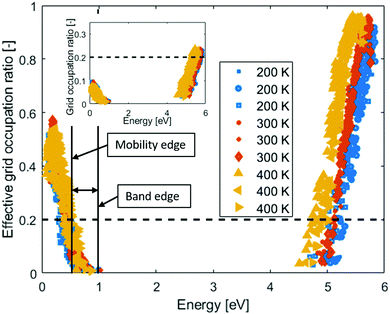
In order to determine the location of the mobility edge, the volume that the orbital occupy needs to be calculated, which can be done by following the Grid Occupation ratio method (see ESI† for a short review).24,25 In this method, a percolation threshold of the orbitals needs to be determined based on their geometrical shapes. Since percolation is highly dependent on the geometrical shape in particular aspect ratios, these can be used to estimate the mobility edge of the matrix. The localization of the HOMO and the states closest to band edge in polymers can be correlated to the Kuhn length of the polymer,39,40 which in PEO is 8 Å.41 Thus, if 8 Å is used as the average length of the orbitals and a width of ∼2–3 Å (equivalent to the hydrogen distance between two adjacent CH2 groups) is used, a percolation threshold of 0.2 can be estimated from the percolation threshold of prolate ellipsoids with aspect ratio 4![[thin space (1/6-em)]](https://www.rsc.org/images/entities/char_2009.gif) :
:![[thin space (1/6-em)]](https://www.rsc.org/images/entities/char_2009.gif) 1.42 The same threshold is used for the conduction states, motivated by that the orbitals tend to occupy several free volume pockets, see Fig. 2.
1.42 The same threshold is used for the conduction states, motivated by that the orbitals tend to occupy several free volume pockets, see Fig. 2.
In the inset of Fig. 3, the Grid Occupation ratio for 115 electronic states per band in amorphous PEO at different temperatures are shown. All valence states are clearly far from percolating the system, but in the conduction band the states percolate ∼1 eV from the band edge. In other words, electronic band conduction through amorphous PEO is not likely. However, many of the states are almost degenerate, and in the event of charge transport these would all be accessible within a normal thermal energy window. When calculating the effective grid occupation ration, which includes all states within an energy window corresponding to the thermal energy, percolation is seen both for states in the valence and conduction bands, respectively, see Fig. 3. The activation energies are 0.4–0.5 eV for holes and 0.2–0.3 eV for electrons if the 0.2 percolation criterion is used. Thus, the activation energies are significantly larger than the thermal energy, which means that both hole and electron mobility will be based on a hopping process.
We continue by adding the LiTFSI salt to the structures in different concentrations in the 400 K structures; one structure per concentration level. Since new chemical species are included in the system, new states may appear in the PEO-based SPE band gap. In Fig. 4, the DOS of PEO with 0 wt%, 12 wt%, 25 wt% and 50 wt% LiTFSI are shown. Typical salt concentrations in SPE are 10–40 wt%.3 With increasing LiTFSI concentration the band gap is significantly reduced; down to 0.6 eV at the highest investigated concentration. The reduction of the band gap is in agreement with experimental studies of other PEO salt composites,33–35 but for the other salts the reduction of the band gap are not as large as for the LiTFSI-doped system. This large reduction will have a significant impact on charge injection into the electrolyte, in particular for electrons rather than holes since the band gap reduction is primarily originating from a lowering of the conduction band edge. We also calculate the Local-DOS where the systems are divided in three categories: PEO atoms, TFSI atoms and Li atoms, with DOS calculated for each category.43 The Local-DOS is displayed in Fig. 4, which show that the reduction of the band gap can be fully attributed to the TFSI molecular anions, in particular the unoccupied states that appear in the PEO-band gap. A “HOMO–LUMO” gap of the TFSI orbitals from these calculations is about 2 eV at the lowest concentration, this is significantly lower compared to TFSI band gap from ionic liquids results.44 However, visually categories the TFSI valence states in the SPE show that none of the states are fully associated to the TFSI molecular anion. This indicate potential interaction between the TFSI and PEO or limitation of the method to separate the results in Local-DOS, which both explain uncertainty of the TFSI “HOMO–LUMO” gap. Additional investigations are needed to fully understand this.
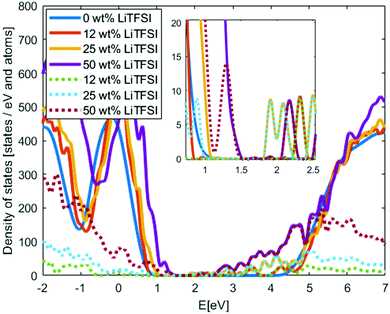 | ||
| Fig. 4 Density of states of PEO with different concentration of LiTFSI. Solid lines show the total DOS and dotted lines the Local-DOS of only the TFSI anions. Inset: Zoom in of the band gap. | ||
In Fig. 5, the effective grid occupation ratio of the PEO-LiTFSI systems are compared with the pristine PEO systems at 400 K. There is no significant difference, compared to pristine PEO, on where in energy the percolation occurs (estimated from the 0.2 effective grid occupation ratio). However, the activation energy for electrons to reach the delocalized states above the mobility edge become very large (∼3 eV) since the excess electrons would be in the TFSI states. The hole activation energy is similar to that of pristine PEO, ∼0.5 eV. Hence, hopping conduction will be the dominating charge transfer mechanism for both holes and electrons. For the electrons, the mobility will be highly dependent on the TFSI anions and how they distribute in the electrolyte, due to that all the new states in the band gap origin from them.
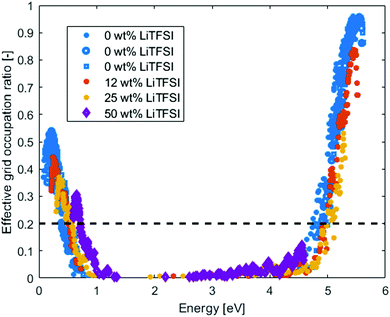 | ||
| Fig. 5 Effective Grid occupation ratio for amorphous PEO at different LiTFSI concentration at 400 K. The dashed line indicates the estimated percolation ratio. | ||
Conclusions
We have calculated the electronic structure of crystalline PEO and amorphous PEO at different temperatures and with different concentrations of LiTFSI. It is seen that the conduction states are interchain states, in agreement with other electrically insulating polymers. Below Tg the band gap is 4.2 eV and 3.9 eV above. This is explained by the reduced density above Tg and the interchain nature of the conduction states in PEO. Significant reduction of the band gap is seen when LiTFSI is introduced, down to 0.6 eV at 50 wt% LiTFSI. The band gap reduction is fully related to states of the TFSI molecules. Mobility edges for both holes and electrons are far from the band edges leading to activation energies significantly larger compared to thermal energy, so hopping conduction is expected to be the dominant charge transport mechanism in these systems. Thereby, the selection of salt seems to be of significant importance to limit leakage currents in SPE batteries. A wise selection of salt can minimize the band gap reduction and moreover significantly decrease the electron charge injection.Conflicts of interest
The authors declare no competing financial interests.Acknowledgements
This work has been financed through the ERC, grant no. 771777 FUN POLYSTORE. M. U. gratefully acknowledges financial support from the Swedish Foundation for Strategic Research, project SM18-0036.References
- J. Lopez, D. G. Mackanic, Y. Cui and Z. Bao, Nat. Rev. Mater., 2019, 4, 312–330 CrossRef CAS.
- D. Bresser, S. Lyonnard, C. Iojoiu, L. Picard and S. Passerini, Mol. Syst. Des. Eng., 2019, 4, 779–792 RSC.
- J. Mindemark, M. J. Lacey, T. Bowden and D. Brandell, Prog. Polym. Sci., 2018, 81, 114–143 CrossRef CAS.
- J. Popovic, D. Höfler, J. P. Melchior, A. Münchinger, B. List and J. Maier, J. Phys. Chem. Lett., 2018, 9, 5116–5120 CrossRef CAS PubMed.
- W. Yao, Q. Zhang, F. Qi, J. Zhang, K. Liu, J. Li, W. Chen, Y. Du, Y. Jin, Y. Liang and N. Liu, Electrochim. Acta, 2019, 318, 302–313 CrossRef CAS.
- H. Shen, E. Yi, L. Cheng, M. Amores, G. Chen, S. W. Sofie and M. M. Doeff, Sustainable Energy Fuels, 2019, 3, 1647–1659 RSC.
- F. Zheng, M. Kotobuki, S. Song, M. O. Lai and L. Lu, J. Power Sources, 2018, 389, 198–213 CrossRef CAS.
- R. Guo, L. Lu, M. Ouyang and X. Feng, Sci. Rep., 2016, 6, 30248 CrossRef CAS PubMed.
- S. D. Jones, J. R. Akridge and F. K. Shokoohi, Solid State Ionics, 1994, 69, 357–368 CrossRef CAS.
- J. B. Wagner and C. Wagner, J. Chem. Phys., 1957, 26, 1597–1601 CrossRef CAS.
- T. K. Lee, N. F. M. Zaini, N. N. Mobarak, N. H. Hassan, S. A. M. Noor, S. Mamat, K. S. Loh, K. H. KuBulat, M. S. Su'ait and A. Ahmad, Electrochim. Acta, 2019, 316, 283–291 CrossRef CAS.
- H. Xia, H. L. Wang, W. Xiao, M. O. Lai and L. Lu, Int. J. Surf. Sci. Eng., 2009, 3, 23–43 CrossRef CAS.
- D. Ruzmetov, V. P. Oleshko, P. M. Haney, H. J. Lezec, K. Karki, K. H. Baloch, A. K. Agrawal, A. V. Davydov, S. Krylyuk, Y. Liu, J. Huang, M. Tanase, J. Cumings and A. A. Talin, Nano Lett., 2012, 12, 505–511 CrossRef CAS PubMed.
- B. Sun, H. D. Asfaw, D. Rehnlund, J. Mindemark, L. Nyholm, K. Edström and D. Brandell, ACS Appl. Mater. Interfaces, 2018, 10, 2407–2413 CrossRef CAS PubMed.
- L. K. H. Pallon, A. T. Hoang, A. M. Pourrahimi, M. S. Hedenqvist, F. Nilsson, S. Gubanski, U. W. Gedde and R. T. Olsson, J. Mater. Chem. A, 2016, 4, 8590–8601 RSC.
- S. J. Laihonen and H. Greijer, Influence of degree of crystallinity on DC-conduction of polypropylene Tampere, Finland, 2019 Search PubMed.
- S. D. Kang and G. J. Snyder, Nat. Mater., 2017, 16, 252–257 CrossRef PubMed.
- A. Moyassari, M. Unge, M. S. Hedenqvist, U. W. Gedde and F. Nilsson, J. Chem. Phys., 2017, 146, 204901 CrossRef CAS PubMed.
- S. Stafström, Chem. Soc. Rev., 2010, 39, 2484–2499 RSC.
- T. Holstein, Ann. Phys., 1959, 8, 325–342 CAS.
- R. A. Marcus, Rev. Mod. Phys., 1993, 65, 599–610 CrossRef CAS.
- C.-K. Skylaris, P. D. Haynes, A. A. Mostofi and M. C. Payne, J. Chem. Phys., 2005, 122, 084119 CrossRef PubMed.
- M. Unge, T. Christen and C. Törnkvist, Electronic structure of polyethylene - Crystalline and amorphous phases of pure polyethylene and their interfaces, Montreal, Canada, 2012 Search PubMed.
- M. Unge and T. Christen, Chem. Phys. Lett., 2014, 613, 15–18 CrossRef CAS.
- M. Unge, Electron mobility edge in amorphous polyethylene, Montpellier, France, 2016 Search PubMed.
- P. Johansson, Electrochim. Acta, 2015, 175, 42–46 CrossRef CAS.
- M. Ebadi, C. Marchiori, J. Mindemark, D. Brandell and C. M. Araujo, J. Mater. Chem. A, 2019, 7, 8394–8404 RSC.
- A. Mirsakiyeva, M. Ebadi, C. M. Araujo, D. Brandell, P. Broqvist and J. Kullgren, J. Phys. Chem. C, 2019, 123, 22851–22857 CrossRef CAS.
- Y. Takahashi and H. Tadokoro, Macromolecules, 1973, 6, 672–675 CrossRef CAS.
- L. J. Krause, W. Lamanna, J. Summerfield, M. Engle, G. Korba, R. Loch and R. Atanasoski, J. Power Sources, 1997, 68, 320–325 CrossRef CAS.
- L. Chen, S. Venkatram, C. Kim, R. Batra, A. Chandrasekaran and R. Ramprasad, Chem. Mater., 2019, 31, 4598–4604 CrossRef CAS.
- T. D. Huan, A. Mannodi-Kanakkithodi, C. Kim, V. Sharma, G. Pilania and R. Ramprasad, Sci. Data, 2016, 3, 160012 CrossRef CAS PubMed.
- S. Chapi, S. Raghu, K. Subramanya, K. Archana, V. Mini and H. Devendrappa, AIP Conf. Proc., 2014, 1591, 1275–1277 CrossRef CAS.
- V. M. Mohan, V. Raja, P. B. Bhargav, A. K. Sharma and V. V. R. N. Rao, J. Polym. Res., 2007, 14, 283–290 CrossRef CAS.
- U. T. Sasikala, P. N. Kumar, M. A. Rao and A. K. Sharma, Int. J. Eng. Sci. Adv. Technol., 2012, 2, 722–730 Search PubMed.
- M. S. Lisowski, Q. Liu, J. Cho, J. Runt, F. Yeh and B. S. Hsiao, Macromolecules, 2000, 33, 4842–4849 CrossRef CAS.
- D. Devaux, R. Bouchet, D. Glé and R. Denoyel, Solid State Ionics, 2012, 227, 119–127 CrossRef CAS.
- K. Hayamizu, E. Akiba, T. Bando and Y. Aihara, J. Chem. Phys., 2002, 117, 5929–5939 CrossRef CAS.
- M. Sato, A. Kumada and K. Hidaka, Phys. Chem. Chem. Phys., 2019, 21, 1812–1819 RSC.
- M. Sato, A. Kumada and K. Hidaka, First-principles study of electron and hole transfer properties in various polymers, Budapest, Hungary, 2018 Search PubMed.
- V. García Sakai, J. K. Maranas, Z. Chowdhuri, I. Peral and J. R. D. Copley, J. Polym. Sci., Part B: Polym. Phys., 2005, 43, 2914–2923 CrossRef.
- E. J. Garboczi, K. A. Snyder, J. F. Douglas and M. F. Thorpe, Phys. Rev. E: Stat. Phys., Plasmas, Fluids, Relat. Interdiscip. Top., 1995, 52, 819–828 CrossRef CAS.
- N. D. M. Hine, P. W. Avraam, P. Tangney and P. D. Haynes, J. Phys.: Conf. Ser., 2012, 367, 012002 CrossRef.
- S. P. Ong, O. Andreussi, Y. Wu, N. Marzari and G. Ceder, Chem. Mater., 2011, 23, 2979–2986 CrossRef CAS.
Footnote |
| † Electronic supplementary information (ESI) available: Computational details and description of grid occupation ratio method and details of structure preparation. See DOI: 10.1039/d0cp01130d |
| This journal is © the Owner Societies 2020 |

