
 Open Access Article
 This Open Access Article is licensed under a Creative Commons Attribution-Non Commercial 3.0 Unported Licence
Structural and thermodynamic study of Ca A- or Co B-site substituted SrFeO3−δ perovskites for low temperature chemical looping applications†
Giancarlo
Luongo
,
Felix
Donat
 and
Christoph R.
Müller
*
and
Christoph R.
Müller
*
Department of Mechanical and Process Engineering, ETH Zürich, 8092, Zürich, Switzerland. E-mail: muelchri@ethz.ch
First published on 8th April 2020
Abstract
Perovskite-structured materials, owing to their chemical–physical properties and tuneable composition, have extended their range of applications to chemical looping processes, in which lattice oxygen provides the oxygen needed for chemical reactions omitting the use of co-fed gaseous oxidants. To optimise their oxygen donating behaviour to the specific application a fundamental understanding of the reduction/oxidation characteristics of perovskite structured oxides and their manipulation through the introduction of dopants is key. In this study, we investigate the structural and oxygen desorption/sorption properties of Sr1−xCaxFeO3−δ and SrFe1−xCoxO3−δ (0 ≤ x ≤ 1) to guide the design of more effective oxygen carriers for chemical looping applications at low temperatures (i.e. 400–600 °C). Ca A- or Co B-site substituted SrFeO3−δ show an increased reducibility, resulting in a higher oxygen capacity at T ≤ 600 °C when compared to the unsubstituted sample. The quantitative assessment of the thermodynamic properties (partial molar enthalpy and entropy of vacancy formation) confirms a reduced enthalpy of vacancy formation upon substitution in this temperature range (i.e. 400–600 °C). Among the examined samples, Sr0.8Ca0.2FeO3−δ exhibited the highest oxygen storage capacity (2.15 wt%) at 500 °C, complemented by excellent redox and structural stability over 100 cycles. The thermodynamic assessment, supported by in situ XRD measurements, revealed that the oxygen release occurs with a phase transition perovskite-brownmillerite below 770 °C, while the perovskite structure remains stable above 770 °C.
1. Introduction
The increasing concern about climate change, primarily triggered by anthropogenic carbon dioxide (CO2) emissions into the atmosphere, has stimulated research into finding solutions for reducing such emissions.1–3 Approaches to reduce the human CO2 footprint include improving the energy efficiency of processes, transitioning to sustainable energy carriers and carbon dioxide capture and storage (CCS) processes. With regard to CCS processes, oxy-fuel combustion has received considerable attention in recent years.4 Here, a fuel is combusted in pure oxygen (O2) (or mixtures of O2 and CO2) instead of air. The combustion product is a mixture of CO2 and water, which can be readily separated. Owing to the absence of nitrogen (N2) in the combustion process, also the formation of NOx is largely eliminated.5 The main drawback of the conventional oxy-fuel processes is the high energy penalty associated with the production of pure O2, typically via cryogenic air separation (CAS).6Although CAS is a very mature technology for the production of O2,7–9 techno-economic studies of oxy-fuel combustion estimate that conventional CAS (specific power consumption of 0.24 kW h kgO2−1) consumes ∼10% of the net oxy-fuel thermal power plant output and represents in addition ∼40% of the total equipment costs.10–13 A potentially more cost-efficient method to produce pure O2 is chemical looping air separation (CLAS), which dates back to the original Brin process.14 The CLAS process utilises metal oxides (referred to as oxygen carriers, OCs) capable of releasing gas phase O2 at elevated temperatures (up to 1000 °C).9,15,16 The CLAS process consists of two steps that occur in a cyclic fashion: first, O2 is released (uncoupling, reaction (1) by the metal oxide. Each metal oxide, MexOy, possesses an equilibrium O2 partial pressure (pO2,eq) for a given temperature at which the transition to a lower oxidation state, MexOy−2, occurs. Gaseous O2 is thus released when the O2 partial pressure (pO2) in the given environment is lower than the respective thermodynamic equilibrium value (i.e. pO2,eq). The metal oxide is regenerated (reaction 2) at lower temperatures and/or higher pO2 (typically using air).
| MexOy(s) → MexOy−2(s) + O2(g) | (1) |
| MexOy−2(s) + O2(g) → MexOy(s) | (2) |
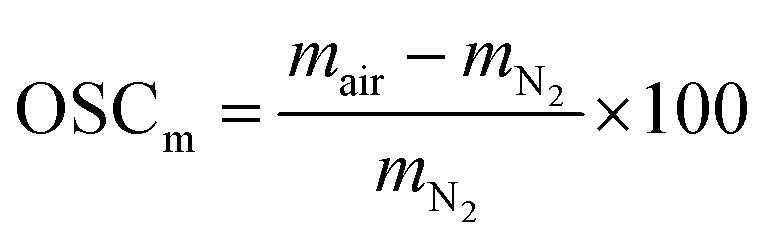
A key challenge for CLAS is finding OCs with suitable thermodynamic properties. The pO2,eq, the reaction enthalpy of a given OC and its oxygen storage capacity (OSC) largely determine its suitability for CLAS.19 For example, low values (<1 wt%) of the OSC (defined as the mass of redox-active lattice O2 of an OC divided by the total mass of the OC) imply that an OC would have to be regenerated (eqn (2)) more frequently in a given time compared to an OC with a high OSC. Further, the OC should have a stable reactivity over multiple redox cycles, besides being low cost and environmentally friendly. Typical OCs that have been demonstrated to be conceptually suitable for CLAS are based on the monometallic transition metal oxides CuO, Co3O4 or Mn2O3.20–23 Transition metal oxides often require high temperatures (up to 1000 °C) to release gaseous O2. Under operation, metal oxides may thus reach temperatures close to their melting points, leading to sintering and in turn a decline in their redox activity and stability. To mitigate sintering, the metal oxide is often stabilized by an inert support, e.g. calcium aluminate.24
To lower the energy costs of the CLAS processes further, it is desirable to identify metal oxides with suitable thermodynamic properties (reaction enthalpy and pO2,eq) that are capable of releasing O2 at lower temperatures than typical CLOU temperatures, i.e. in the range 400–600 °C. However, operation at such temperatures may reduce the rates of the redox reactions, implying larger system volumes (and in increased capital costs) of the CLAS process. An interesting class of materials that has the potential to release O2 at temperatures <600 °C at a fast rate are perovskites.25 Perovskites, with the general formula ABO3−δ (where the A cation is typically a rare earth metal or alkaline earth metal, the B cation is a transition metal and delta is the oxygen non-stoichiometry), are non-stoichiometric compounds, with a non-stoichiometry δ that depends on temperature and pO2. Fast redox kinetics have been observed even at temperatures <500 °C26 due to high rates of lattice oxygen diffusion.27 Perovskites can expand significantly the design space of OCs for chemical looping applications owing to their versatile composition and the ability to accommodate various A- and B-site cations.25 This compositional flexibility allows the optimisation of their chemical–physical properties (i.e. thermodynamics, melting temperature, OSC). In fact, perovskite-type materials have been studied intensively in the past years for a wide range of applications, including thermochemical water splitting, SOFC and high temperature pressure swing adsorption (HT-PSA).27–31 The basic crystal structure of perovskites is cubic (Pm![[3 with combining macron]](https://www.rsc.org/images/entities/char_0033_0304.gif) m), although deviations in their composition (e.g. by cation substitution) can generate distortions of the ideal cubic lattice structure. While monometallic transition metal oxides donate lattice oxygen via a phase transition, in perovskites the release of gaseous O2 can occur without any phase transition and results in a change of the oxygen non-stoichiometry δ:
m), although deviations in their composition (e.g. by cation substitution) can generate distortions of the ideal cubic lattice structure. While monometallic transition metal oxides donate lattice oxygen via a phase transition, in perovskites the release of gaseous O2 can occur without any phase transition and results in a change of the oxygen non-stoichiometry δ:
 | (3) |
Density functional theory (DFT) calculations have shown that the variations in A- and B-site cations may induce a change in the oxidation state of the B-site transition metal and enhance the O2 donation properties of the material, by reducing the energy of formation of oxygen vacancies.29,32 For example, Mishra et al.33 performed DFT studies on the effect of dopants such as Sr and Fe in CaMnO3 and found that the dopants enhance the O2 donation properties of the material through a distortion of the lattice structure and changes in the oxygen coordination.
From an application point of view, OCs must possess excellent structural stability and reactivity. CaMnO3, for example, is one of the most extensively investigated perovskites25 but in spite of a reasonably high OSC of ∼1 wt%34 it undergoes an irreversible phase transformation to Ca2MnO4 and CaMn2O4 when exposed to repeated cycles of air and N2 at high temperatures (i.e. T = 1170 °C), as these two latter phases are thermodynamically more stable than the parent CaMnO3 under the given operating conditions.35 The phase transition from perovskite to spinel is accompanied by a gradual decrease of the OSC, which makes such compositions unattractive for industrial applications.
Among the large number of possible non-stoichiometric oxides, strontium and iron-based perovskites have been identified as suitable OCs for low-temperature applications.19,36,37 For example, Miura et al. found that A-site substitution of the SrFeO3 system by Ca improves the OSC when operating cyclically between 5% O2 and air, identifying Sr0.76Ca0.24FeO3−δ with an OSC of 1.1 wt% at 550 °C as an attractive OC (the OSC of the undoped SrFeO3−δ was only 0.6 wt%).28 In addition, substitution of the B-site of SrFeO3 with Co was investigated by Ikeda et al. and they found that the substitution of 85% of Fe with Co allows the release of O2 at temperatures as low as 300 °C instead of 600 °C for the unsubstituted SrFeO3−δ.29 Dou et al.38 recently showed that the A- and B-site co-substitution in SrFeO3 of Sr and Fe by Ca and Co, respectively, lowers the activation energy of oxygen diffusion and surface oxygen exchange i.e. faster redox kinetics compared to the unsubstituted perovskite. In particular, they found that Sr0.8Ca0.2Fe0.4Co0.6O3 releases 1.2 wt% at 400 °C, even under when the pO2 was relatively high (i.e. 0.05 atm).
As outlined above, the thermodynamic properties of the OC play an important role in the design of the CLAS process and the identification of the optimal working conditions.19 Although Sr1−xCaxFeO3−δ and SrFe1−xCoxO3−δ perovskites have been shown to possess promising chemical–physical properties, thermodynamic data for such materials is scarce or non-existent albeit critical for process modelling and further material optimisation.
Motivated by the promising results reported by Miura et al.28 and Ikeda et al.,29 we focused in our study on the thermodynamic and structural analysis of Ca A-site or Co B-site substituted SrFeO3 (Sr1−xCaxFeO3−δ and SrFe1−xCoxO3−δ, 0 ≤ x ≤ 1) aiming at elucidating changes in the chemical–physical properties (i.e. OSC, thermodynamics, structural stability) upon substitution. This work shall provide guidelines for the design of more effective OCs for chemical looping applications at low temperatures (i.e. 400 to 600 °C). The structure of the substituted perovskites was characterised by X-ray powder diffraction (XRD) and their OSC and redox activity using a thermogravimetric analyser (TGA) under a wide range of oxygen partial pressures, pO2, and temperatures, T, allowing us to calculate thermodynamic properties such as the molar enthalpy and entropy of vacancy formation. Finally, the long-term reactivity and chemical stability of the OC was investigated over multiple redox cycles via thermogravimetric, fixed bed and in situ XRD measurements.
In general, the OSC and reducibility vary distinctly with the composition. Among the Ca-substituted perovskites, Sr0.8Ca0.2FeO3−δ had the highest OSC (2.15 wt%) at temperatures as low as 500 °C, while among the Co-substituted perovskites, SrFe0.2Co0.8O3−δ was individuated as the most promising OC for CLAS application due to its ability to release a high amount of O2 (OSC of 1.1 wt%) at 500 °C in atmospheres containing as much as 5% O2.
2. Experimental methods
Synthesis of the oxygen carriers
Sr1−xCaxFeO3−δ and SrFe1−xCoxO3−δ (0 ≤ x ≤ 1) materials were synthesised by dissolving stoichiometric amounts of Sr(NO3)2 (Sigma Aldrich, ACS reagent, 99.9%), Fe(NO3)3·9H2O (Sigma Aldrich, ACS reagent, ≥98%) and Ca(NO3)2·4H2O (Sigma Aldrich, 99%) or Co(NO3)2·6H2O (Sigma Aldrich, 99%) in deionised water together with citric acid (3![[thin space (1/6-em)]](https://www.rsc.org/images/entities/char_2009.gif) :1 molar ratio of citric acid to metal ions) and ethylene glycol (1.2:1 molar ratio of ethylene glycol to citric acid). The solution was heated to 80 °C and held at this temperature until a gel formed. The gel was dried at 130 °C for 10 h in an oven and subsequently crushed to a fine powder. The powder was calcined in air in two steps: the first calcination step was performed with a heating rate of 3 °C min−1 and holding at 500 °C for 7 h. The second calcination step was performed with a heating rate of 5 °C min−1 and holding at 1000 °C (for Sr1−xCaxFeO3−δ) or 1200 °C (for SrFe1−xCoxO3−δ) for 10 h. Calcination temperatures higher than the selected ones resulted in partially molten samples.
:1 molar ratio of citric acid to metal ions) and ethylene glycol (1.2:1 molar ratio of ethylene glycol to citric acid). The solution was heated to 80 °C and held at this temperature until a gel formed. The gel was dried at 130 °C for 10 h in an oven and subsequently crushed to a fine powder. The powder was calcined in air in two steps: the first calcination step was performed with a heating rate of 3 °C min−1 and holding at 500 °C for 7 h. The second calcination step was performed with a heating rate of 5 °C min−1 and holding at 1000 °C (for Sr1−xCaxFeO3−δ) or 1200 °C (for SrFe1−xCoxO3−δ) for 10 h. Calcination temperatures higher than the selected ones resulted in partially molten samples.
Characterisation
All gases used in this study were provided by Carbagas from cylinders (grade 5.0) and thus contained small quantities of impurities, such as ∼10 ppm O2 in N2. The flow rates of gas were measured and controlled at normal temperature and pressure (NTP) using mass flow controllers (Bronkhorst EL-Flow).Each titration was repeated at least twice and the values reported represent an average of the individual measurements. All reagents used were of analytical grade.
To determine the thermodynamic properties of the OCs, a high pressure thermobalance (LINSEIS L81PT High Pressure TGA-DTA/DSC) was used. Blank experiments were performed before the analysis of the material to correct for the effect of buoyancy on the balance. About 300 mg of sample, placed in an alumina crucible (500 μL), was used in each experiment. The sample sat on top of a layer of quartz wool to reduce the depth of the crucible and to minimise gas diffusion effects. First the sample was heated to 125 °C under a flow of synthetic air at a total flow rate of 1 L min−1 and held for 30 min to remove adsorbed water. The temperature program of each experiment consisted of four consecutive temperature segments: 800, 700, 600 and 500 °C. At each temperature, the gas environment was varied to obtain seven different pO2. At the beginning and at the end of each temperature segment, the pO2 was identical to assess whether irreversible structural changes occurred. For each sample, experiments were performed at an absolute pressure of 1, 5 or 7 bar, covering a wide range of pO2 (i.e. from 7.09 × 10⁻⁵ to 1.4 bar). Additionally, a constant N2 flow of 1.5 L min−1 was used to purge the balance. The change in oxygen non-stoichiometry Δδ was calculated from the recorded weight changes as:
 | (4) |
The standard partial molar Gibbs free energy change for reduction (eqn (3)) is defined as:
 | (5) |
 can be related to the standard partial molar enthalpy (
 ) and entropy change (
 ):
): | (6) |
 and
and  are expressed as a function of pO2 and temperature, for a constant oxygen non-stoichiometry δ:
 | (7) |
 and intercept
  .
.
 | (8) |
3. Results and discussion
Characterisation of the oxygen carriers
Fig. 1 shows the XRD patterns of as-prepared SrFe1−xCoxO3−δ and Sr1−xCaxFeO3−δ at ambient temperature. The diffraction patterns of the samples with composition SrFe1−xCoxO3−δ (0 ≤ x ≤ 0.8) and Sr1−xCaxFeO3−δ showed good agreement with the reference perovskite cubic structure (PDF 39-0954) (0 ≤ x ≤ 0.25), and no impurity phases were detected. For Co B-site substitution and x = 1, additional diffraction peaks were observed corresponding to hexagonal SrCoO2.52 (PDF 40-1018), in agreement with other works.29,39 | ||
| Fig. 1 XRD patterns of as-prepared (a) SrFe1−xCoxO3−δ (x = 0, 0.2, 0.4, 0.6, 0.8, 1) and (b) Sr1−xCaxFeO3−δ (x = 0.1, 0.2, 0.25, 0.4, 0.6, 0.8, 1). HAADF images and elemental composition of (c) Sr0.8Ca0.2FeO3−δ and (d) Sr0.2Ca0.8FeO3−δ. | ||
In the case of Ca A-site substitution, the samples with a composition 0.3 ≤ x ≤ 1 revealed reflections due to further oxide phases that were identified as CaO (PDF 38-5590) and the brownmillerite phase Ca1.5Sr0.5Fe2O5 (PDF 46-0480). In an attempt to enhance the purity of the perovskites with Ca substitutions in the range 0.3 ≤ x ≤ 1, higher calcination temperatures (i.e. 1100 °C or 1200 °C, for 10 h) were used, yet the same extent of impurity phases was observed, in agreement with previous reports.28
High signal-to-noise X-ray diffractograms of some of the samples (Fig. S1, ESI†) were collected also at the ID31 beamline of the European Synchrotron Radiation Facility (ESRF), confirming the formation of a phase-pure perovskite structure only in the range 0 ≤ x ≤ 0.8 for SrFe1−xCoxO3−δ and 0 ≤ x ≤ 0.25 for Sr1−xCaxFeO3−δ. For each sample in this range of substitution, the actual ratio of the single elements was determined by ICP-OES analysis. The values obtained are in good agreement with the expected values based on the amount of nitrates used in the preparation method, confirming the successful synthesis of phase-pure materials (Table S1 of the ESI†).
The microscopic distribution of the elements composing the OCs was probed by energy dispersive X-ray spectroscopy (EDS) coupled with scanning transmission electron microscopy (STEM). Fig. 1(c) shows a high-angle annular dark-field (HAADF) image and the corresponding EDS maps of Fe, Ca and Sr, confirming a homogeneous dispersion of all elements. Agglomerates or impurity phases were not observed. For compositions that, according to XRD, do not yield a phase-pure perovskite phase (Sr0.2Ca0.8FeO3−δ, Fig. 2(d)), a non-homogenous distribution of the elements was observed, due to the formation of additional (segregated) mixed oxide phases.
 | ||
| Fig. 2 Oxygen storage capacity as a function of composition in the temperature range 500–900 °C and differential mass as a function of temperature for (a and c) SrFe1−xCoxO3−δ and (b and d) Sr1−xCaxFeO3−δ. | ||
The following investigations consider phase-pure perovskites only to exclude the influence of the impurity phases on the observed reduction/oxidation behaviour.
Oxygen desorption properties
When heating from ambient temperature to the set point temperature in a flow of air, all samples exhibited a significant weight loss that suggests their pO2,eq increases with temperature (Fig. S2, ESI†). The effect of the composition of the perovskite on their pO2,eq and thermodynamic properties is discussed in more detail in the next section.Thermogravimetric analysis revealed a strong influence of the perovskite composition (for both A- and B-site substitution) on the amount of desorbed/sorbed O2 in the temperature range 400–900 °C.
The measured oxygen storage capacity (OSCm) for each temperature was evaluated as the weight change at equilibrium (eqn (9)) after changing the atmosphere from air (pO2 = 2.09 × 10⁻¹ bar) to N2 (pO2 = 7.09 × 10⁻⁵ bar), and is reported in Fig. 2(a) and (b) for SrFe1−xCoxO3−δ (x = 0, 0.2, 0.4, 0.6, 0.8) and Sr1−xCaxFeO3−δ (x = 0.1, 0.2, 0.25), respectively.
 | (9) |
The variation in the OSC with the composition of the perovskites was more evident in the temperature range 500–700 °C, showing that the substitution of A or B-site cations promotes the release of O2 at low temperatures. Fe B-site substitution by Co by 20% increased the observed OSC from 0.8 wt% (when x = 0) to 1.25 wt% at 500 °C. Increasing the amount of Co further resulted in an even higher OSC, reaching a maximum of the OSC = 1.42 wt% for x = 0.6 at 500 °C. In the case of Sr A-site substitution by Ca, the highest OSC of 2.15 wt% was observed for x = 0.2 at 500 °C. The substitution of Sr by Ca did not yield an increased OSC at high temperatures (700–900 °C), likely due to the high pO2,eq in this temperature range.
The dependence of the composition of the perovskite on the amount of O2 released as a function of temperature was assessed further by temperature programmed reduction (TPR).
For samples of composition SrFe1−xCoxO3−δ (0 ≤ x ≤ 0.8), a mass loss due to the release of O2 occurred at temperatures as low as 330 °C (Fig. 2(c)). Importantly, an increased substitution of Fe by Co resulted in an increased rate of mass loss (with a maximum rate for x = 0.6), i.e. an increased reducibility of the metal oxide at low temperature. To summarise, B-site substitution of Fe by Co represents a possibility to release O2 at relatively low temperatures compared to the original material. In the case of Ca (A-site) substituted perovskites (Sr1−xCaxFeO3−δ, 0 ≤ x ≤ 0.25), reported in Fig. 2(d), an increasing quantity of Ca in the perovskite increased the rate of reduction in N2 compared to the original SrFeO3−δ.
Similar to the case of Co B-site substitution, the range of temperatures in which the materials released the entire quantity of O2 decreased from 330–750 °C (SrFeO3) to 330–550 °C.
The cyclic redox stability of the OCs Sr0.8Ca0.2FeO3−δ and SrFe0.2Co0.8O3−δ, i.e. the two most promising materials of the Ca- or Co-substituted materials, respectively, was studied using both a TGA and a fixed bed reactor. Fig. 3 plots the oxygen capacity of Sr0.8Ca0.2FeO3−δ over 30 cycles (TGA at 500 °C). There was no measurable loss in the performance of Sr0.8Ca0.2FeO3−δ and the cyclic OSC was ∼2.1 wt% in all cycles but the first two, in which the OSC was ∼2 wt%. Similarly, the morphology of the material remained unaltered during the cyclic test, as observed by SEM (Fig. 3).
 | ||
| Fig. 3 Cyclic redox stability of Sr0.8Ca0.2FeO3−δ over 30 cycles at 500 °C and SEM micrographs of Ca0.2Sr0.8FeO3−δ before and after 30 redox cycles at 500 °C. | ||
XRD patterns collected before and after the cycling experiment did not show any substantial difference (Fig. S3(a), ESI†), in particular no phase separation was observed. Rietveld full pattern refinement confirmed an unchanged cell parameter (Fig. S3(b), ESI†). The cyclic redox stability of SrFe0.2Co0.8O3−δ was also investigated in the TGA at 500 °C over 30 redox cycles (Fig. S4, ESI†). For SrFe0.2Co0.8O3−δ we observed an activation period over the first 10 cycles during which the amount of O2 absorbed by the OC increased with cycle number. This activation period was followed by a stable reactivity with no loss in performance with cycle number. Similar to Sr0.8Ca0.2FeO3−δ, when comparing the XRD patterns of SrFe0.2Co0.8O3−δ before and after the cycling experiment no apparent change in the structure of the OC was observed (Fig. S5(a), ESI†). The Rietveld refinement of the full XRD pattern of the OC collected after the cyclic experiment confirmed its unchanged crystal structure (Fig. S5(b), ESI†). This suggests that the observed activation of the OC was not related to a chemical phenomenon, but possibly a physical phenomenon, such as an improved mass transport within the material. Indeed, a slight increase in the pore volume and porosity of the OC SrFe0.2Co0.8O3−δ (but not Sr0.8Ca0.2FeO3−δ) was observed upon cycling (Table S2, ESI†), which may explain the observed activation period for this material.
In the fixed bed experiments, the number of redox cycles was increased to 100. Fig. 4, plots the pO2 for the OC Sr0.8Ca0.2FeO3−δ, as a function of time over 100 redox cycles performed at 500 °C. For comparison, the pO2 of the blank experiment (reactor filled with SiC of the same volume as in the experiment with OC) is given by empty circles. Sr0.8Ca0.2FeO3−δ, shows no significant difference in the measured pO2 between cycle 1 (red) and cycle 100 (black), confirming the stable cyclic performance of the material, observed in the previous TGA experiments. The area between the pO2 profiles obtained from the OC and the blank experiment using SiC allows to calculate the total amount of O2 released by the OC over 40 min and was determined as ∼640 μmol gOC−1, which is ∼97% of the total O2 that could be released based on the TGA-determined OSC (OSCm = 2.15 wt%). Fig. 4 also plots the evolution of the oxygen non-stoichiometry Δδ (dashed lines) for cycle numbers 1 and 100; no apparent difference between the two cycle numbers is observed.
 | ||
| Fig. 4 pO2 measured at the outlet of the fixed bed reactor for cycle 1 (red) and cycle 100 (black) with the respective evolution of Δδ (dashed lines) for Sr0.8Ca0.2FeO3−δ at 500 °C. | ||
The same type of cyclic experiment was performed also for SrFe0.2Co0.8O3−δ (Fig. S6, ESI†). In agreement with what has been observed in the TGA, the pO2 profiles for cycle 1 (green) and cycle 100 (black) were different. The amount of O2 released by SrFe0.2Co0.8O3−δ increased from cycle 1 to 10 from ∼67% to ∼96% of the total O2 that could be released based on the TGA-determined OSC (OSCm = 1.2 wt% or ∼370 μmol O2 gOC−1). The activation phase (first 10 cycles) of the O2 release was followed by a stable reactivity for the remaining 90 cycles. Fig. S7 (ESI†) compares the pO2 profiles of the 100th cycle for SrFe0.2Co0.8O3−δ and Sr0.8Ca0.2FeO3−δ. In both materials, the O2 release was rapid initially and slowed down as the maximal value of Δδ was approached. In contrast to monometallic oxides that undergo a phase transition at constant pO2 (such as the redox pair CuO/Cu2O), the flow of O2 released by the perovskite decreases with time because the pO2,eq depends on δ. This effect has consequences for the design of chemical looping applications, requiring e.g. semi-batch reactors or operation in counter-current flow if a steady stream of O2 is to be obtained.
Thermodynamic assessment
A thermodynamic analysis was performed on SrFe1−xCoxO3−δ and Sr1−xCaxFeO3−δ to assess the suitability of the investigated oxides for CLAS. Fig. S8 (ESI†) shows an overview of the thermogravimetric measurements (weight change as a function of time, temperature and pO2) acquired for SrFe1−xCoxO3−δ, with x ranging from 0 to 0.8. It was observed that upon heating from ambient temperature to 800 °C the materials with a higher degree of substitution of Fe by Co (Fig. S8, ESI†) released a lower amount of O2 than unsubstituted SrFeO3−δ. This suggests that the pO2,eq of the substituted samples decreased with increasing x. In addition, the amount of O2 released was fully recovered (i.e. the material could be fully reoxidised) at each temperature. Interestingly, the sample with the composition SrFe0.2Co0.8O3−δ showed a very different behaviour compared to all the other samples in the temperature range 500–700 °C. The sample weight of this material did not change in the pO2 range 9 × 10⁻⁴–1 × 10⁻¹ bar, which implies that it is not required to employ an atmosphere of extremely low pO2 to extract a significant amount of O2 from the OC. For example, when switching the gas atmosphere from air (pO2 = 2.09 × 10⁻¹ bar) to N2 (pO2 = 7.09 × 10⁻⁵ bar), the OSC of SrFe0.2Co0.8O3−δ was 1.21 wt% at 500 °C, while the OSC reduced only marginally to 1.1 wt% when operating between air and 5% O2 (pO2 = 5 × 10⁻² bar). For comparison, the OSC of unsubstituted SrFeO3−δ at 500 °C decreased from 0.8 wt% (when switching the gas atmosphere between air and N2) to 0.1 wt% (when switching between air and 5% O2). From a practical standpoint, SrFe0.2Co0.8O3−δ represents a good candidate for CLAS due to its ability to release and take up O2 at relatively low temperatures (i.e. <600 °C) even in “oxygen-rich” environments (for example for pO2 between 0.1 and 0.2 bar). In contrast, other compositions and the unsubstituted SrFeO3−δ require very low – and practically difficult to realise – pO2 to release a large quantity of O2, which would lower the economic attractiveness of CLAS.The initial oxygen non-stoichiometry δ0 of all samples was determined by iodometric titration at ambient temperature and is reported in Table S2 (ESI†). The substitution of the B-site cation Fe by Co (up to 60% substitution) yielded only a slight change in the initial δ0 (δ0 ≈ 0.22), while in the case of 80% substitution, δ0 ≈ 0.32. On the other hand, substitution of A-site Sr by Ca strongly increased the available amount of O2 (i.e. δ0 ≈ 0.15) compared to the original SrFeO3−δ (δ0 ≈ 0.22). The increased amount of available redox-active lattice oxygen compared to the original SrFeO3−δ when partially substituting the A- or B-site of the perovskite is reflected by the overall higher OSC of the substitute material, as shown in Fig. 2.
Fig. 5(a) shows exemplarily the evolution of the oxygen non-stoichiometry (symbols) of SrFe1−xCoxO3−δ (0 ≤ x ≤ 0.8) as a function of pO2 at 500 °C (the dotted lines represent qualitative guidelines). The initial value of δ of each sample at 500 °C was higher than that measured at ambient temperature due to the increase of pO2,eq with temperature; i.e. there was a release of O2 upon heating the sample. Generally, all Co-substituted samples showed a similar behaviour, except for the case of x = 0.8, for which the oxygen non-stoichiometry decreased sharply at relatively high oxygen partial pressures (i.e. pO2 = 1 × 10⁻¹ bar). Importantly, the value of 3 − δ was found to be ∼2.5 at low pO2 (i.e. pO2 = 7.09 × 10⁻⁵ bar, pure N2) for all materials at 500 °C. This suggests that the perovskite structure was completely reduced to its defect-order variant brownmillerite (ABO2.5). In the absence of a strongly reducing gas (e.g. H2) that would thermodynamically enable a further reduction, the O2 released from the perovskite structure corresponds to the maximal amount of lattice oxygen that can be released for this class of materials. Overall, the trend of the oxygen non-stoichiometry as a function of pO2 recorded at 600 °C and 700 °C (Fig. S9(a) and (b), ESI†) was qualitatively similar to the behaviour at 500 °C. Increasing the temperature further to 800 °C (Fig. S9(c), ESI†), no significant difference in the evolution of 3 − δ with pO2 could be observed between each sample. Moreover, at 800 °C, the measured values of 3 − δ were always greater than 2.5 (i.e. ∼2.54) for the lowest oxygen partial pressure studied (i.e. pO2 = 7.09 × 10⁻⁵ bar), suggesting that a phase change to brownmillerite did not occur at this temperature. In situ XRD measurements confirmed that at 800 °C the release of O2 occurred without any phase transition (this is discussed in detail in the following section).40
 | ||
| Fig. 5 (a) Oxygen non-stoichiometry as a function of pO2 for SrFe1−xCoxO3−δ at 500 °C (b) Arrhenius plot of SrFe0.8Co0.2O3−δ. | ||
The respective thermogravimetric experiment for Sr1−xCaxFeO3−δ, in which the A-site Sr was substituted by Ca, is reported in Fig. S10 (ESI†) while the measured 3 − δ values as a function of pO2 for Sr1−xCaxFeO3−δ (x = 0, 0.1, 0.2, 0.25) are reported in Fig. S11(a)–(d) (ESI†). Generally, the evolution of 3 − δ with pO2 for the A-site substituted materials was found to be similar to the B-site substituted materials. All the A-site substituted perovskites gave 3 − δ = 2.5 at the lowest pO2 studied (i.e. 7.09 × 10⁻⁵ bar, pure N2) at 500 °C, 600 °C and 700 °C, suggesting the transition to brownmillerite at this oxygen partial pressure. Increasing the temperature to 800 °C, a value of 3 − δ = 2.5 was observed only in the case of Sr0.8Ca0.2FeO3 − δ at the lowest pO2 studied (i.e. 7.09 × 10⁻⁵ bar, pure N2), while the measured values of 3 − δ for the other samples were ∼2.57 at this pO2, suggesting that a phase change to brownmillerite did not occur at this temperature.
To extract the partial molar enthalpy and entropy of vacancy formation from the TGA measurements of the substituted perovskites, the negative natural logarithm of pO2 was plotted as a function of the inverse absolute temperature (Arrhenius plot) for constant Δδ.Fig. 5(b)) exemplarily shows the Arrhenius plot for SrCo0.8Fe0.2O3−δ. The Arrhenius plot of all the other Co-substituted samples can be found in the ESI† (Fig. S12(a)–(d)). As we increase the temperature range compared to related works (albeit on different materials)35,41–43 we observe two distinct regimes, both of which can be approximated by a linear relationship. Similar observations were made also for Ca-substituted materials. For all samples investigated in this work, the transition temperature between the two regimes (linked to a structural change of the bulk perovskite phase) was ∼770 °C. Similarly, for SrCo0.8Fe0.2O3−δ Liu et al.44 identified also 770 °C as the temperature above which the O2 release occurs without a phase transition from perovskite to brownmillerite, known as order–disorder transition.40 From the Arrhenius plot, the thermodynamic properties of the OCs (i.e. the standard partial molar enthalpy and entropy of vacancy formation) were determined as a function of the change in the oxygen non-stoichiometry Δδ. The partial molar enthalpy of formation as a function of Δδ for SrFe1−xCoxO3−δ (0 ≤ x ≤ 0.8) is shown in Fig. 6(a) and (b), for the low (T < 770 °C) and high (770–900 °C) temperature range, respectively. Generally, the samples in which Fe was substituted by Co showed smaller partial molar enthalpy of formation compared to the unsubstituted SrFeO3−δ, when T < 770 °C. Additionally, in the same range (i.e. T < 770 °C), an increase in the oxygen non-stoichiometry yielded an increase in  for SrFe1−xCoxO3−δ with x = 0, 0.2, 0.4, 0.6, 0.8, consistent with what has been found in thermodynamic studies performed on perovskites such as La1−x(Ca,Sr)xMn1−yAlyO3.41 The unsubstituted sample SrFeO3−δ gave the highest partial molar enthalpy of formation of ∼40 kJ mol−1, when Δδ = 0.09. The smaller values of the partial molar enthalpy of formation of the Co-substituted samples compared to the original SrFeO3−δ explain their increased reducibility at low temperatures (T < 770 °C). The partial molar entropy of vacancy formation was generally constant (∼7 J mol−1 K−1) with increasing Δδ when at T < 770 °C (Fig. 6(c)). In the high temperature range (770–900 °C), the partial molar enthalpy of vacancy formation decreased with increasing Δδ for all the Co-substituted samples, a result also reported for lanthanum manganites in the context of solar thermochemical water splitting.42,43 Overall, in the temperature range 770–900 °C, higher values of
  compared to the unsubstituted SrFeO3−δ were found for each Δδ, translating into a decreased reducibility of the substituted samples in this temperature range. In the same temperature range, an increase in the oxygen non-stoichiometry yielded an increase in The partial molar entropy of vacancy formation (Fig. 6(d)) showed generally increasing values with increasing Δδ. Interestingly, the Co-substituted samples show higher
  compared to the unsubstituted sample.
 | ||
Fig. 6 Evolution of the partial molar enthalpy ( ) and entropy ( ) and entropy ( ) of formation of vacancies as a function of the change in the oxygen non-stoichiometry Δδ in (a) and (c) the low temperature (T < 770 °C) and (b) and (d) the high temperature regime (T > 770 °C), respectively, for SrFe1−xCoxO3−δ. Gibbs free energy change of vacancy formation ( ) of formation of vacancies as a function of the change in the oxygen non-stoichiometry Δδ in (a) and (c) the low temperature (T < 770 °C) and (b) and (d) the high temperature regime (T > 770 °C), respectively, for SrFe1−xCoxO3−δ. Gibbs free energy change of vacancy formation ( ) as a function of temperature in the (e) low temperature (T < 770 °C) and (f) high temperature regime (T > 770 °C), respectively. The Gibbs free energy change in (e) and (f) was plotted for Δδ = 0.025 with the error bounds representing two standard deviations due to the errors associated with ) as a function of temperature in the (e) low temperature (T < 770 °C) and (f) high temperature regime (T > 770 °C), respectively. The Gibbs free energy change in (e) and (f) was plotted for Δδ = 0.025 with the error bounds representing two standard deviations due to the errors associated with  and and  . . | ||
The Arrhenius plots and the thermodynamic properties (partial molar entropy and enthalpy of formation of vacancies) obtained for Sr1−xCaxFeO3−δ are given in Fig. S13 and S14 (ESI†). In the low temperature range (i.e. T < 770 °C), the partial molar enthalpy of formation was relatively constant (∼20 kJ mol−1) with increasing Δδ for all substituted samples. Dou et al.38 found similar values (i.e. ∼25 kJ mol−1) for Sr0.8Ca0.2FeO3−δ. Similarly, to the case of substitution of Fe by Co, smaller values of  compared to unsubstituted SrFeO3−δ confirmed an increased reducibility induced by the substitution of Sr by Ca. In the temperature range 700–900 °C, higher values of
  compared to unsubstituted SrFeO3−δ were found for each Δδ. Table S3 in ESI† summarises the extrapolated partial molar enthalpy and entropy of vacancy formation for all samples.
Fig. 6(e) and (f) exemplary show the resulting partial molar Gibbs free energy change of vacancy formation  when Δδ = 0.025. It was found that
  was always smaller for all substituted samples compared than the unsubstituted SrFeO3−δ when T < 770 °C. Note that this is consistent with the increased reducibility of all substituted samples observed in this temperature range compared to the unsubstituted SrFeO3−δ. In the high temperature range (i.e. 770–900 °C),
  of the substituted samples was always smaller than SrFeO3−δ.
In situ XRD measurements
In situ XRD was performed for all the substituted perovskites (and the reference, unsubstituted perovskite) to probe the evolution of the crystal structure as a function of temperature. The measurements were performed isothermally at different temperatures in pure N2 (pO2 = 7.09 × 10⁻⁵ bar). Fig. 7(a) shows an exemplary result of the evolution of the structure of SrFe0.8Co0.2O3−δ with scan number under a flow of pure N2 (pO2 = 7.09 × 10⁻⁵ bar) at 600 °C. With scan number (i.e. with the progress of O2 release) the main peak of the perovskite phase (110) shifted towards lower diffraction angles (indicating an increase in the perovskite unit cell parameter) due to the release of O2. When all the O2 was released from the perovskite, a phase transition to brownmillerite occurred at this temperature (i.e. 600 °C). The same experiment, performed at 900 °C (Fig. 7(b)), shows that only the position of main perovskite peak (110) changed as O2 was being released, but no separate reflections corresponding to brownmillerite were observed (in agreement with TG experiments). When reducing SrFe0.8Co0.2O3−δ under N2 at different temperatures, the in situ XRD measurements showed that for temperatures ≤750 °C the release of O2 occurred through a phase transition from perovskite to brownmillerite, while for temperatures >750 °C only the perovskite peak was observed, implying that no brownmillerite phase was formed. | ||
| Fig. 7 In situ XRD showing the evolution of the structure of SrFe0.8Co0.2O3−δ when exposed to N2 (a) at T = 600 °C and (b) T = 900 °C. The scan time of one diffractogram over the 2θ range of 31–35° was ∼75 s. | ||
Bulk phase transitions during reduction (and oxidation) are often an undesired characteristic in chemical looping applications (i.e. CLAS) as they may induce abrupt volume changes in the materials affecting negatively their mechanical stability. For large scale processes where, for example, fluidised beds may be used, a poor mechanical stability can result in attrition and loss of material. The change in the molar volume upon phase transition from the perovskite structure to brownmillerite is <1.5% and hence mechanical stresses within the particles may be less of a concern.
Turning back to SrFe1−xCoxO3−δ (x = 0, 0.4, 0.6, 0.8) and Sr1−xCaxFeO3−δ (x = 0.1, 0.25), Fig. S14 (EIS), the formation of a brownmillerite phase when releasing O2 (in N2) was observed for all samples at T < 750 °C, while the perovskite structure remained stable for T > 750 °C. Only in the case of 20% substitution of Sr by Ca a phase transition from perovskite to brownmillerite was observed also at T > 750 °C (Fig. 8(a) and (b)), consistent with the measured 3 − δ = 2.5 for this sample (Fig. S10(d), ESI†). For both substituted and unsubstituted perovskites, the regeneration of the perovskite structure was possible only in air (pO2 = 2.09 × 10⁻¹ bar).
 | ||
| Fig. 8 In situ XRD patterns of Sr0.8Ca0.2FeO3−δ when exposed consecutively to (i) pure N2, (ii) pO2 = 7.9 × 10⁻³ bar, (iii) pO2 = 8.6 × 10⁻³ bar and (iv) pO2 = 2.09 × 10⁻¹ bar (a) at T = 600 °C and (b) T = 900 °C; (c) and (d) represent the collected diffractograms of figure (a) and (b), respectively. The scan time of one diffractogram over the 2θ range of 31–35° was ∼75 s. | ||
4. Conclusions
We have studied the influence of Ca A- or Co B-site substitution of SrFeO3 on the materials’ chemical–physical properties at temperatures ranging from 400 to 900 °C, relevant for chemical looping applications. We have shown that phase pure materials can be obtained when limiting the substitution of A- or B-site cations to the range of 0 ≤ x ≤ 0.8 or 0 ≤ x ≤ 0.25 for Co B-site or Ca A-site substitution, respectively. Thermogravimetric analysis revealed that the chemical–physical properties (quantity of oxygen released, desorption/sorption rate and reducibility) of the materials are altered by the partial substitution of their A- or B-site cations. In particular, it was found that the substitution of Fe by Co increased the reducibility of the metal oxide in the low temperature regime (i.e. T = 400–600 °C) when compared to the unsubstituted SrFeO3−δ. Our quantitative thermodynamic assessment confirmed a decreased partial molar enthalpy of formation of SrFe1−xCoxO3−δ in this temperature range. Among the Co-substituted samples, SrFe0.2Co0.8FeO3−δ showed a high OSC ∼1.1 wt% when operating between air and 5% O2 at 500 °C. The ability to effectively release and take up O2 at relatively low temperatures (i.e. <600 °C) without the need for gas atmospheres of extremely low pO2 makes this material a good candidate for CLAS.Sr A-site substitution by Ca improved the OSC and among all the materials investigated, Sr0.8Ca0.2FeO3−δ exhibited the highest OSC (2.15 wt%) at 500 °C when operating between air and N2. The redox cyclic stability of SrFe0.2Co0.8FeO3−δ and Sr0.8Ca0.2FeO3−δ was investigated over up to 100 redox cycles in a fixed bed reactor and no apparent alteration in the crystalline structure nor loss in activity was observed.
When probing the evolution of the oxygen non-stoichiometry as a function of temperature and pO2, two regimes were observed for the substituted perovskites. The transition temperature between the two regimes is ∼770 °C. For T < 770 °C the O2 release in N2 (pO2 = 7.09 × 10⁻⁵ bar) was accompanied by a phase transition from a perovskite to a brownmillerite phase, while the perovskite structure remained stable for T > 770 °C, as confirmed by in situ XRD measurements. The only exception was Sr0.8Ca0.2FeO3−δ that showed a phase transition during the reduction in N2 over the entire temperature range studied (500–900 °C).
Lastly, our results show that in spite of the high OSC of the perovskite materials studied, the challenge to obtain a constant flow of O2 released remains as the O2 release varies with the oxygen non-stoichiometry δ. This intrinsic feature of non-stoichiometric materials would require engineering solutions (e.g. moving bed reactor design in a counter-current flow configuration) to control the variation in the oxygen non-stoichiometry and, therefore, ensure a constant flow of O2 at the outlet of the reactor if demanded by the chemical looping process.
Conflicts of interest
There are no conflicts to declare.Acknowledgements
The authors would like to acknowledge the Swiss Federal Office of Energy (BFE, SI/501590-01) for financial support. We also thank the Scientific Centre for Optical and Electron Microscopy (ScopeM) at ETH Zürich for providing training and access to scanning electron micro-scopes. The authors are grateful to the beamline scientist Dr Agnieszka Poulain of ID31 at the European Synchrotron Facility (ESRF) for the provided support. Dr Paula M. Abdala is acknowledged for assisting with the analysis of the in situ XRD measurements. Dr Agnieszka Kierzkowska is acknowledged for performing SEM and EDX measurements.Notes and references
- M. Bui, C. S. Adjiman, A. Bardow, E. J. Anthony, A. Boston, S. Brown, P. S. Fennell, S. Fuss, A. Galindo, L. A. Hackett, J. P. Hallett, H. J. Herzog, G. Jackson, J. Kemper, S. Krevor, G. C. Maitland, M. Matuszewski, I. S. Metcalfe, C. Petit, G. Puxty, J. Reimer, D. M. Reiner, E. S. Rubin, S. A. Scott, N. Shah, B. Smit, J. P. M. Trusler, P. Webley, J. Wilcox and N. Mac Dowell, Energy Environ. Sci., 2018, 11(5), 1062–1176 RSC.
- S. Fuss, W. F. Lamb, M. W. Callaghan, J. Hilaire, F. Creutzig, T. Amann, T. Beringer, W. De Oliveira Garcia, J. Hartmann, T. Khanna, G. Luderer, G. F. Nemet, J. Rogelj, P. Smith, J. L. Vicente, J. Wilcox, M. Del Mar Zamora Dominguez and J. C. Minx, Environ. Res. Lett., 2018, 13(6), 063002 CrossRef.
- J. C. Minx, W. F. Lamb, M. W. Callaghan, S. Fuss, J. Hilaire, F. Creutzig, T. Amann, T. Beringer, W. De Oliveira Garcia, J. Hartmann, T. Khanna, D. Lenzi, G. Luderer, G. F. Nemet, J. Rogelj, P. Smith, J. L. Vicente, J. Wilcox and M. Del Mar Zamora Dominguez,, Environ. Res. Lett., 2018, 13(6), 063001 CrossRef.
- B. Mckee, Solutions for the 21st century, zero emissions technologies for fossil fuels, Technology status report, Energy, DOI:10.1016/B978-0-12-802748-6.01001-9.
- H. I. Mathekga, B. O. Oboirien and B. C. North, Int. J. Energy Res., 2016, 40(7), 878–902 CrossRef CAS.
- C. Fu and T. Gundersen, Energy, 2012, 44(1), 60–68 CrossRef CAS.
- F. G. Kerry, Industrial Gas Handbook: Gas Separation and Purification, CRC Press, Boca Raton, 2007 Search PubMed.
- H.-W. Häring, Ind. Gases Process., Wiley-VCH Verlag GmbH & Co. KGaA, 2007, pp. 9–109 Search PubMed.
- W. F. Castle, Int. J. Refrig., 2002, 25, 158–172 CrossRef CAS.
- B. Moghtaderi, Energy Fuels, 2010, 24, 190–198 CrossRef CAS.
- K. Shah, B. Moghtaderi, J. Zanganeh and T. Wall, Fuel, 2013, 107, 356–370 CrossRef CAS.
- P. N. Dyer, R. E. Richards, S. L. Russek and D. M. Taylor, Solid State Ionics, 2000, 134(1–2), 21–33 CrossRef CAS.
- I. Pfaff and A. Kather, Energy Procedia, 2009, 1(1), 495–502 CrossRef CAS.
- S. Haider, A. Lindbråthen, J. A. Lie and M. B. Hägg, Sep. Purif. Technol., 2018, 205, 251–262 CrossRef CAS.
- W. B. Jensen, J. Chem. Educ., 2009, 86, 1266–1267 CrossRef CAS.
- H. Song, K. Shah, E. Doroodchi and B. Moghtaderi, Energy Fuels, 2014, 28, 163–172 CrossRef CAS.
- C. Zhou, K. Shah and B. Moghtaderi, Energy Fuels, 2015, 29(4), 2074–2088 CrossRef CAS.
- K. Shah, B. Moghtaderi and T. Wall, Energy Fuels, 2012, 26(4), 2038–2045 CrossRef CAS.
- R. H. Görke, W. Hu, M. T. Dunstan, J. S. Dennis and S. A. Scott, Appl. Energy, 2018, 212, 478–488 CrossRef.
- K. Wang, Q. Yu and Q. Qin, J. Therm. Anal. Calorim., 2013, 112, 747–753 CrossRef CAS.
- K. Wang, Q. Yu, Q. Qin and W. Duan, Chem. Eng. Technol., 2014, 37, 1500–1506 CrossRef CAS.
- G. Azimi, H. Leion, T. Mattisson and A. Lyngfelt Proc. 10th Int. Conf. Greenhouse Gas Technology (GHGT-10), Amsterdam, The Netherlands, 2010.
- K. J. Whitty, J. S. Lighty and T. Mattisson, Handb. Chem. Looping Technol., 2018, 93–122 Search PubMed.
- F. Donat, W. Hu, S. A. Scott and J. S. Dennis, Ind. Eng. Chem. Res., 2015, 54(26), 6713–6723 CrossRef CAS.
- X. Zhu, K. Li, L. Neal and F. Li, ACS Catal., 2018, 8, 8213–8236 CrossRef CAS.
- B. Bulfin, J. Vieten, D. E. Starr, A. Azarpira, C. Zachäus, M. Hävecker, K. Skorupska, M. Schmücker, M. Roeb and C. Sattler, J. Mater. Chem. A, 2017, 5, 7912–7919 RSC.
- J. Vieten, B. Bulfin, P. Huck, M. Horton, D. Guban, L. Zhu, Y. Lu, K. A. Persson, M. Roeb and C. Sattler, Energy Environ. Sci., 2019, 12, 1369–1384 RSC.
- N. Miura, H. Ikeda and A. Tsuchida, Ind. Eng. Chem. Res., 2016, 55, 3091–3096 CrossRef CAS.
- H. Ikeda, A. Tsuchida, J. Morita and N. Miura, Ind. Eng. Chem. Res., 2016, 55, 6501–6505 CrossRef CAS.
- M. Kubicek, A. H. Bork and J. L. M. Rupp, J. Mater. Chem. A, 2017, 5(24), 11983–12000 RSC.
- X. Zhu, Q. Imtiaz, F. Donat, C. R. Müller and F. Li, Energy Environ. Sci., 2020, 13, 772–804 RSC.
- T. Motohashi, T. Ueda, Y. Masubuchi and S. Kikkawa, J. Phys. Chem. C, 2013, 117, 12560–12566 CrossRef CAS.
- A. Mishra, T. Li, F. Li and E. E. Santiso, Chem. Mater., 2019, 31, 689–698 CrossRef CAS.
- E. I. Leonidova, I. A. Leonidov, M. V. Patrakeev and V. L. Kozhevnikov, J. Solid State Electrochem., 2011, 15(5), 1071–1075 CrossRef CAS.
- E. Bakken, T. Norby and S. Stølen, Solid State Ionics, 2015, 176(1-2), 217–223 CrossRef.
- C. Y. Lau, M. T. Dunstan, W. Hu, C. P. Grey and S. A. Scott, Energy Environ. Sci., 2017, 10(3), 818–831 RSC.
- R. H. Görke, E. J. Marek, F. Donat and S. A. Scott, Int. J. Greenhouse Gas Control, 2020, 94, 102891 CrossRef.
- J. Dou, E. Krzystowczyk, X. Wang, T. Robbins, L. Ma, X. Liu and F. Li, ChemSusChem, 2020, 13, 385–393 CrossRef CAS PubMed.
- E. J. Popczun, D. N. Tafen, S. Natesakhawat, C. M. Marin, T.-D. Nguyen-Phan, Y. Zhou, D. Alfonso and J. W. Lekse, J. Mater. Chem. A, 2020, 8(5), 2602–2612 RSC.
- Y. Tomura, I. Oikawa and H. Takamura, Phys. Rev. Mater., 2019, 3, 125802 CrossRef CAS.
- M. Ezbiri, M. Takacs, D. Theiler, R. Michalsky and A. Steinfeld, J. Mater. Chem. A, 2017, 5, 4172–4182 RSC.
- A. H. Bork, E. Povoden-Karadeniz, A. J. Carrillo and J. L. M. Rupp, Acta Mater., 2019, 178, 163–172 CrossRef CAS.
- M. Takacs, M. Hoes, M. Caduff, T. Cooper, J. R. Scheffe and A. Steinfeld, Acta Mater., 2016, 103, 700–710 CrossRef CAS.
- L. M. Liu, T. H. Lee, L. Qiu, Y. L. Yang and A. J. Jacobson, SrCo0.8Fe0.2O3−δ, Mater. Res. Bull., 1996, 31, 29–35 CrossRef CAS.
Footnote |
| † Electronic supplementary information (ESI) available. See DOI: 10.1039/d0cp01049a |
| This journal is © the Owner Societies 2020 |