Optimal background treatment in dipolar spectroscopy†
Received
11th November 2019
, Accepted 18th December 2019
First published on 20th December 2019
Abstract
Treatment of the background in dipolar EPR spectroscopy signals is a critical processing step for the recovery of the underlying distance distributions. Here we present new mathematical considerations that show pitfalls of background subtraction and division. In order to overcome these problems we propose an improved background treatment approach. We show, empirically, that this new method outperforms the established ones and analyze the established practice of post-correction signal truncation, as well as the influence of moderate background-fit errors, on accuracy of distance distributions.
1 Introduction
The study of proteins, protein complexes, and synthetic macromolecules is facilitated by the lower nanometer range distances being encoded into the magnetic dipole–dipole interactions between pairs of paramagnetic centers.1,2 Measurement of these interactions through pulsed EPR spectroscopy is enabled by a broad family of time-domain techniques called dipolar EPR spectroscopy. Four main techniques exist: double electron–electron resonance (DEER),3–6 also called pulsed electron double resonance (PELDOR), double-quantum coherence (DQC)7 measurements, single frequency technique for refocusing (SIFTER),8 and relaxation induced dipolar modulation enhancement (RIDME).9,10 All these techniques provide a time-domain signal that contains a sum of modulations introduced by the dipolar interaction, which encodes a distance r by its proportionality to r−3. Macromolecule backbones and spin-labels can adopt many conformations leading to a distribution of distances. Through inversion, it is possible to retrieve the underlying distance distribution from the dipolar time-domain data,11 thus providing unique insight into the width of the conformation ensemble of proteins.12
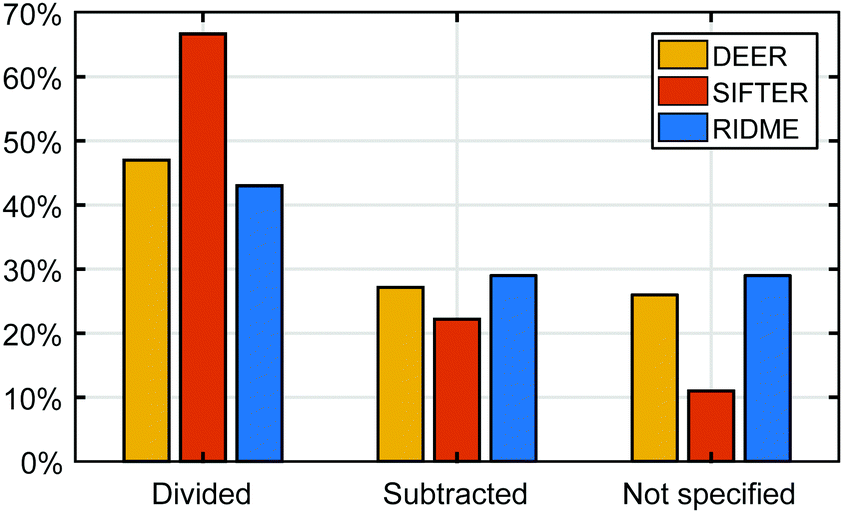
To achieve this inversion of the time-domain data and recover the distance distribution, the intra-molecular contribution is often be isolated from the inter-molecular contributions; the latter being more commonly referred to as background. All dipolar experiments contain these contributions. The background of the DEER experiment has been considered, analyzed and modelled for many years.3,11,13,14 Recently this issue has received more attention for RIDME and SIFTER experiments.15,16 In the following, we do not consider DQC measurements, which are influenced by inter-molecular interactions, but not in a way amenable to background treatment. Two approaches have been established to deal with the background in the analysis of dipolar spectroscopy data. The first approach relies on a one-step analysis based on the simultaneous fitting of the background and pair distribution and is often employed along the multi-Gauss parametric models.6,17,18 The other approach relies on a two-step analysis, where, in order to obtain the pair distance distribution, the background is fitted on the primary dipolar data, removed, and then the background corrected data is processed by some inversion method (such as regularization) to obtain the pair distribution.13,19 In this work we will focus on the latter approach, where two methods have been established: background-correction either by division or subtraction of the background function. While only the division approach is correct given the structure of the signal, subtraction has still been widely applied. We surveyed one hundred different publications in the field of dipolar spectroscopy to assess how the background correction is realized for the different experiments of the dipolar spectroscopy family. The results of this survey in Fig. 1 show that there is no broadly established approach to background correction since both approaches seem to be employed in DEER, SIFTER and RIDME, or not reported at all. The preference for background-division can be attributed to the widespread use of the DeerAnalysis13 processing software, which solely employs background-division.
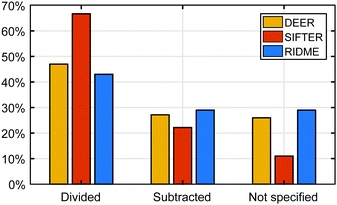 |
| | Fig. 1 Results of a survey conducted on 100 online journal articles in the field of dipolar EPR spectroscopy randomly sampled from the Web of Science Core Collection by searching for the topics: DEER, PELDOR, RIDME, SIFTER and PDS. The articles (79 on DEER, 25 on RIDME and 9 on SIFTER) were classified according to how background-correction was reported and shown as percentages for the individual techniques. The bars are color-coded corresponding to each dipolar spectroscopy experiment: DEER (orange), SIFTER (red) and RIDME (blue). | |
In this work, we present a new formalism of background treatment in dipolar spectroscopy and show that the current background correction approaches, when coupled to Tikhonov regularization or any approach based on least-squares fitting, are sub-optimal as they may lead to introduction of considerable errors in the distance distributions. Instead, we propose a new approach to background handling, which aims to solve the problem by a redefinition of the dipolar kernel incorporating the background function. We also present a statistical benchmark analysis similar to previous works20,21 of the different approaches to background handling as empirical support for of our theoretical results. Finally, we discuss the current practice of data truncation after background correction and the influence of moderate background fit errors on the results.
2 Theory
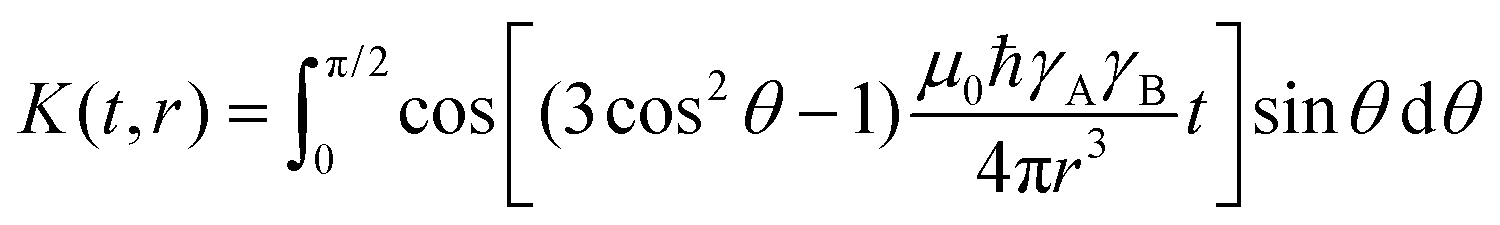
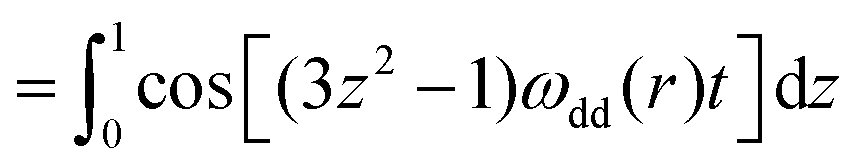
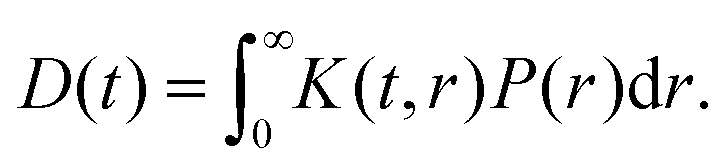
In pulsed dipolar spectroscopy the echo intensity is modulated by the dipolar interaction between a pair of spins A and B in the system, which directly depends on the distance r between both spins. Due to the presence of many different conformers in the sample, this modulation does not depend on a single distance but a distribution P(r) of distances in the sample. This distribution leads to a particular signal called the dipolar evolution function D(t), which contains the dipolar modulations. The relation between the distance distribution and the dipolar evolution function is described by the kernel K(t,r) which includes a powder average over all relative orientations θ of the interspin vector with respect to the external magnetic field. The dipolar kernel is defined as| |  | (1) |
| |  | (2) |
where ωdd(r) is the dipolar modulation frequency, μ0 the permittivity of vacuum, ħ the reduced Planck constant and γA/B are the gyromagnetic ratios of spin A and B, respectively. The dipolar evolution function can then be computed via a Fredholm integral of the first kind| |  | (3) |
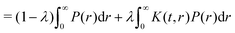
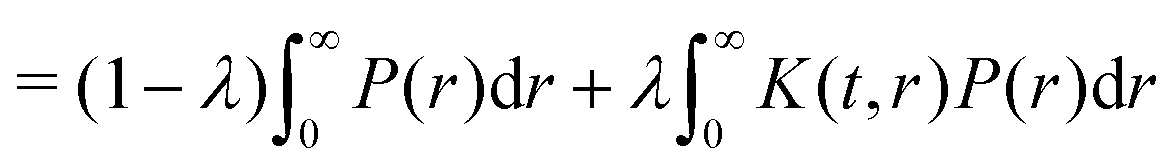
The detected primary signal contains an inter-cluster contribution: the so-called form factor F(t) from which, for a given modulation depth λ, the dipolar evolution function can be inferred| | | F(t) = (1 − λ) + λD(t). | (4) |
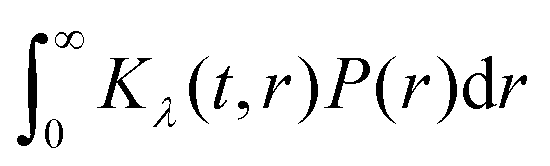
The kernel definition can, however, be straightforwardly modified to directly relate the distance distribution and form factor via(3). This kernel is defined as| | | Kλ(t,r) = (1 − λ) + λK(t,r) | (5) |
such that| |  | (6) |
| |  | (7) |
| | | = (1 − λ) + λD(t) = F(t) | (8) |
since the integral of the distance distribution P(r) is normalized to unity. For the rest of this work, we will employ the kernel definition in (5) and, for the sake of simplicity, will use the notation K(t,r) = Kλ(t,r).
Inter-molecular interactions contribute to a background factor B(t), which has been modelled for DEER3–6 as a stretched exponential function
where
k is the decay rate constant of the background and
d is the so-called fractal dimension of the background. Both of these parameters are typically fitted to the experimental data in order to identify the background and the form factor. If the objects are known to be distributed homogeneously in three-dimensional space,
d can be set to 3 and fixed.
For RIDME the background function has been derived by Keller et al.15 as follows
| | | B(t) = e−Δω1/2(αt+βt2) | (10) |
where Δ
ω1/2 is the average dipolar frequency between the spin pair and
α and
β are coefficients which depend on the inter-pulse delays of the RIDME experiment and the longitudinal relaxation time of the spins. It has been shown that, in practice, the background can be fitted by a generalized stretched exponential function such as
(10).
15
The experimental signal consists of the form factor multiplied by the background. However, the set of electronics, which enable its detection, as well as pulse imperfections, such as shot-to-shot variations in the probe and pump pulses, introduce random fluctuations. These fluctuations result in noise δ(t) detected in the signal V(t), which can be modelled as
| | | V(t) = F(t)B(t) + δ(t). | (11) |
Further on we will assume a stretched-exponential background model for all dipolar spectroscopy experiments. We are aware that this may be an approximation of unknown quality for some experiments (
e.g. SIFTER) where the background model is still not completely understood. Nonetheless, as long as the multiplicative background model
(11) holds with any function
B(
t), all further derivations will still hold.
2.1 The inverse problem
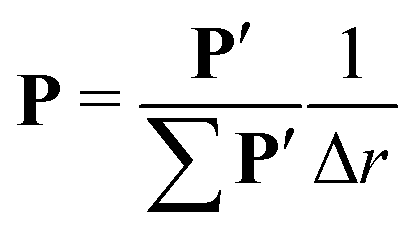
When considering discrete measurements, the distance distribution P and form factor F can be described as vectors of length n and the kernel function as a matrix K of size n × n. Selecting equal numbers of points in both dimensions is plausible in order to avoid overfitting or unnecessary loss of information, although it cannot be strictly proved that it is the optimal choice. The normalization of P is now given by| |  | (12) |
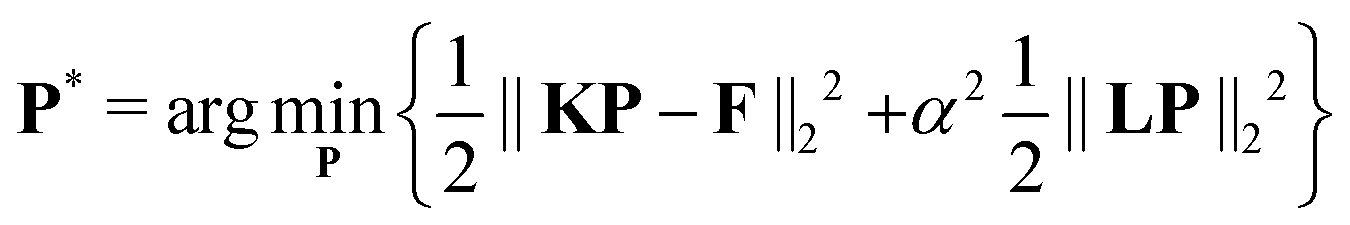
where Δr is the resolution of the distance axis r. The discrete Fredholm integral (3) now readsFor the sake of simplicity we introduce K = KΔr such thatThe discrete detected signal V readswhere ∘ represents the Hadamard multiplication (i.e. element-wise multiplication), B the background vector and δ the noise vector. Now, inferring the underlying distance distributions from the experimental form factor formally requires inversion of the kernelbut due to extreme ill-conditioning of K, this inverse problem is ill-posed and the results obtained by (16) are highly unstable and erratic. To solve the inversion problem in (14), regularization approaches are required, where an additional penalty is introduced into a least-squares minimization functional to stabilize the results. In the widely applied Tikhonov regularization, a smoothness penalty is applied and balanced by a regularization parameter α. The regularized distance distribution P* is thus obtained by minimization of the problem| |  | (17) |
where L is a differential operator matrix. This regularization can be performed unconstrained or under a non-negativity constraint on the resulting distance distribution. While the unconstrained case is analytically solvable, the non-negativity property applies strictly to probability density distributions and, hence, provides a way of further stabilizing the solution without making an uncertain assumption.
2.2 Background correction
In order to invert (14)via the regularization approach given in (17), the most common approach in dipolar spectroscopy data processing is to remove the background in the experimental signal V prior to regularization. There are two approaches to background correction: background division and background subtraction.
In the background-division approach, the (fitted) background is divided from the experimental signal (15)
where ⊘ represents the Hadamard division,
i.e. element-wise division. Hence, the corrected signal now has the form
where the form factor is obtained as desired, but the term
δ⊘
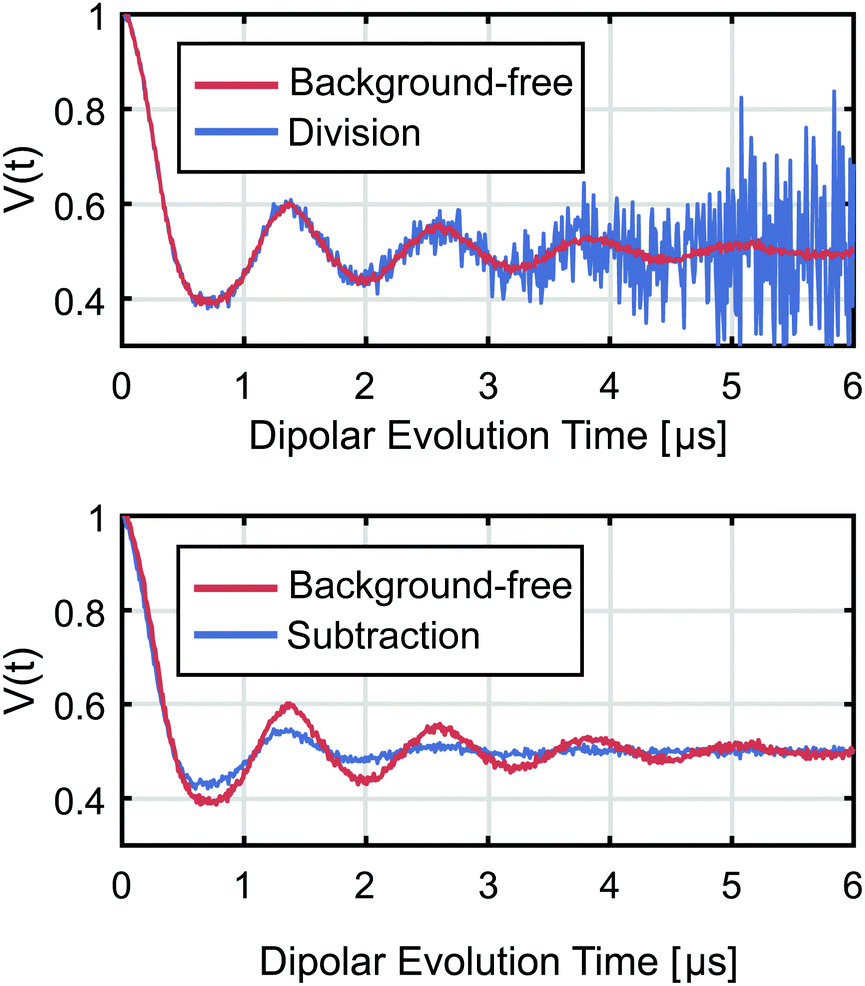
B represents noise, whose amplitude increases exponentially with time. For strongly decaying background, as it is often observed in RIDME and cannot always be avoided in DEER, this term leads to the so-called noise explosion (see
Fig. 2). This can be devastating for measurements containing short distances (approx. <5 nm), whose oscillations decay fast, but is less of an issue for longer distances, where the oscillations are more pronounced at longer times. A common workaround is to truncate the signal subjectively at the point where the noise seems to drown the oscillation. Not only is there no optimal criterion on how to select this truncation time, but the approach also sacrifices measured data that may still contain some information. We will address this issue later on.
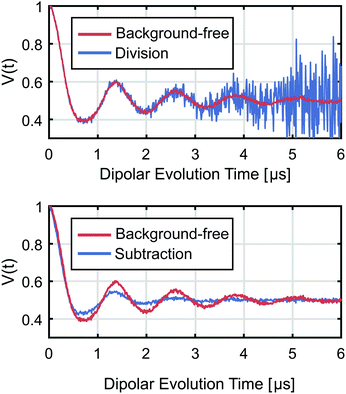 |
| | Fig. 2 Effects of background correction on the dipolar signal. The blue signals are the results of correcting a strongly decaying background via either division, leading to noise-explosion, (upper) or subtraction, leading to oscillation-damping (lower). The background-free signal is given in red as a reference. | |
For the background-subtraction approach, the (fitted) background is subtracted from the experimental signal (15)
| | | V′ = V − (1 − λ)(B − 1) | (20) |
which now has the form
| | | V′ = FB − (1 − λ)(B − 1) + δ. | (21) |
Here the form factor is still damped by the background but no noise explosion occurs (see
Fig. 2). For a strongly decaying background, this damping of the form factor can still be very damaging to measurements of long distances (approx. >5 nm) corresponding to very slowly decaying oscillations which will be suppressed by the multiplicative background function as well as for very narrowly distributed distances. Both background division and subtraction work well if the background decays by only a small fraction within the total observation time. In other cases, improved background treatment has the potential to substantially improve the quality of the computed distance distributions.
2.3 Impact on constrained Tikhonov regularization
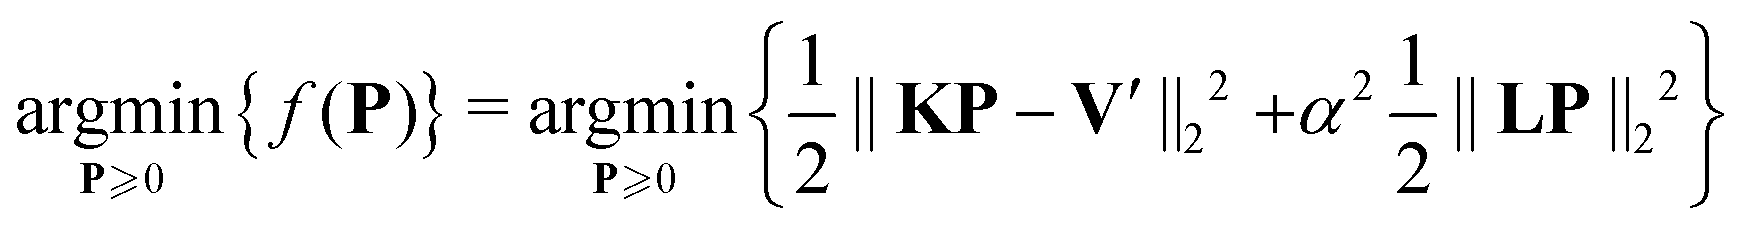
Now, we consider the effects of the two background correction approaches on the results obtained by non-negative constrained Tikhonov regularization, where the functional| |  | (22) |
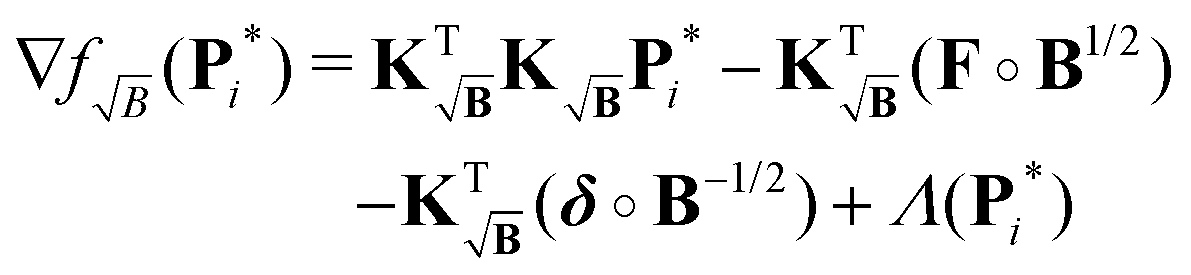
is to be optimized. This yields an optimal strictly non-negative distance distribution P. In this case there is no closed-form expression for the solution. However, still considerations can be made on the convergence and optimality criteria of the numerical methods employed to reach the solution. For this work we studied the solution of (22) by treating it as a non-negative least squares (NNLS) problem22 (e.g. algorithms implemented in MATLAB as lsqnonneg or as fnnls for the fast non-negative least squares23). The NNLS problem seeks to solve (22) by finding a P, which minimizes (22) and fulfills the Karush–Kuhn–Tucker24,25 (KKT) conditions:where ∇f(P) is the gradient of the Tikhonov functional f(P) in (22)| | | ∇f(P) = KTKP + α2LTLP − KTV′. | (26) |
This problem is equivalent to the corresponding linear complementary problem (LCP), which can be solved by setting the KKT conditions for quadratic programming.26 The problem thus reduces to finding a non-negative P, which satisfies| |  | (27) |
while still satisfying the rest of the KKT conditions. In any case, the optimality condition of the NNLS problem is determined by the gradient ∇f(P) and so does the evolution of the solution P during the search. If one considers first the background-free case, the gradient is given by| | | ∇f(P) = KTKP + Λ(P) − KTF − KTδ, | (28) |
where we have introduced the abbreviation Λ(P) = α2LTLP. In the following we will assume an optimal distance distribution solution P* for the background-free Tikhonov problem (and its time-domain counterpart F* = KP*) obtained for some optimal regularization parameter αopt, which minimizes (22), is unique, and fulfills the KKT conditions (29)–(31) when substituting P* for P.
The gradient at the optimal solution of the background-free problem ∇f(P*) now reads
| | | ∇f(P*) = KTΔF + Λ(P*) − KTδ | (29) |
where we have introduced the auxiliary time-domain residual vector
which contains the difference between the fitted and experimental noiseless form factors.
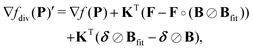
Now let's consider the case of background division, where the gradient (see Appendix) at the optimal solution of the background-free case P* reads
| | | ∇fdiv(P*) = ∇f(P*) + KT(δ − δ⊘B). | (31) |
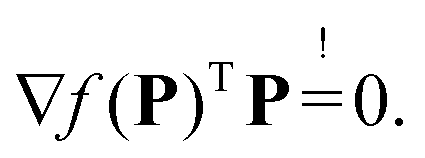
If the KKT condition
(25) is considered for this gradient we obtain
| | | ∇fdiv(P*)TP* = (∇f(P*) + KT(δ − δ⊘B))TP* ≠ 0 | (32) |
meaning that
(25) cannot be fulfilled by the gradient of the background-divided case and the solution is perturbed by the need to compensate for the additional
KT(
δ −
δ⊘
B) term in the gradient. Hence, for the case of background correction by division the exact background-free solution is not obtained as the term
KT(
δ −
δ⊘
B) does only vanish for
B → 1. Truncation of the signal may reduce the effect of this term on the solution, but the reduced amount of points will change the optimal solution
P* even for the background-free case (see later).
Next we consider background subtraction, where the gradient (see Appendix) at the optimal solution of the background-free case P* reads
| | | ∇fsub(P*) = ∇f(P*) + KT(F − F∘B + (1 − λ)(B − 1)). | (33) |
Again, if we consider the KKT condition
(25) for this gradient at the background-free solution we obtain
| | | ∇fsub(P*)TP* = (∇f(P*) + KT(F − F∘B(1 − λ)(B − 1)))TP* ≠ 0 | (34) |
meaning that
(25) is not fulfilled by the gradient of the background-subtracted case. Therefore,
P* is not the solution obtained for a background-subtracted signal. In this case, the solution is perturbed to account for the
KT(
F −
F∘
B(1 −
λ)(
B − 1)) term in the gradient, which does also only vanish for
B → 1.
In conclusion, performing background correction, either by subtraction or division, will lead to a regularization solution which will always be a worse approximation of the background-free solution, and hence of the ground truth. Division is particularly damaging for poor signal-to-noise ratio, whereas subtraction is particularly damaging if the background function decays faster than the oscillations in the form factor.
2.4 Model-based processing
Having shown that background correction by either division or subtraction fails to recover the optimal solution, the following question needs to be answered: Why do we need background correction? The need for a background removal arises from the inability of the kernel to transform the distance distribution to a background-containing form factor| | | KP = (1 − λ) +λD ≠ [(1 − λ) + λD]B | (35) |
which means that during evaluation of the LSQ term of the Tikhonov functional| | | ‖KP − (F∘B + δ)‖ ≠ ‖δ‖. | (36) |
a large error will arise due to this discrepancy. The background correction aims to remove this discrepancy, yet at the cost of introducing other errors terms, as shown.
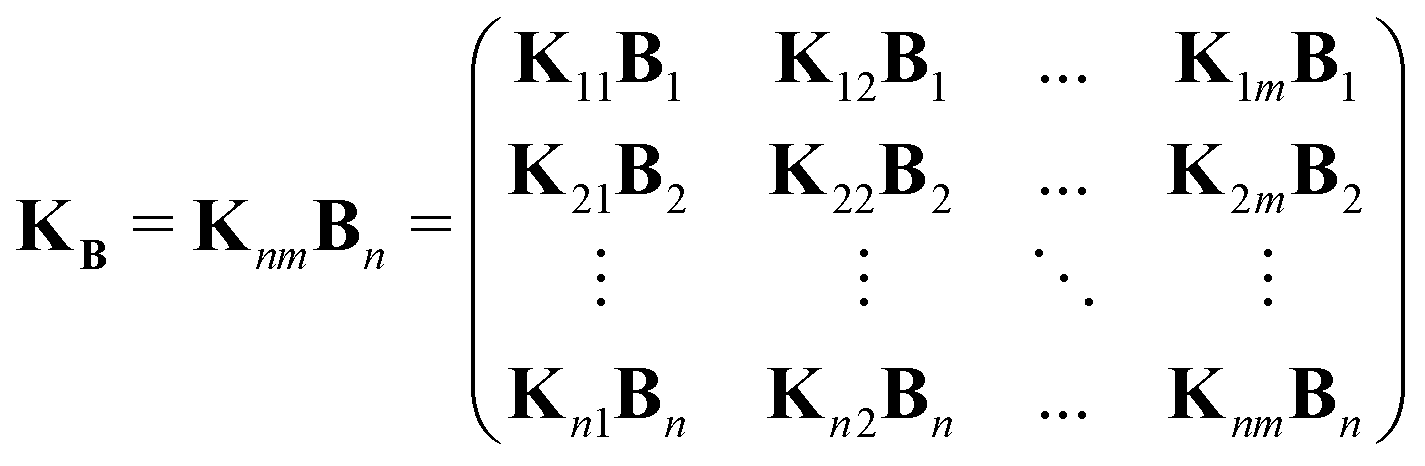
We want to emphasize that the dipolar kernel K acts as an operator containing the features and properties of the signal (as long as the signal can be described as the linear operation KP = F). Therefore, if the kernel cannot account for a feature in the signal because the kernel model is inaccurate, then it is better to modify the model instead of “correcting” the signal. We propose, thus, a new kernel KB which accounts for the background in the signal and fulfills
The new kernel
KB is constructed by simple multiplication of the background along the time-dimension of the kernel
| | 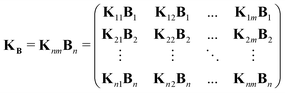 | (38) |
where the definition of the kernel
K remains the same as in
(5).
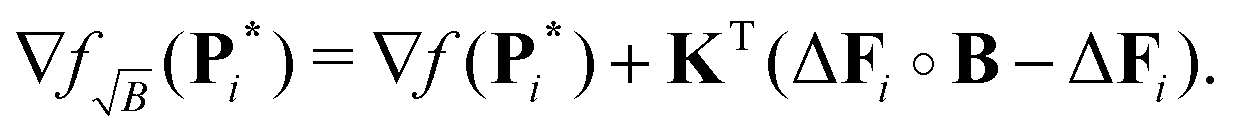
As shown previously, it is important to analyze how the gradient of the Tikhonov functional (22) for the NNLS problem is affected by the introduction of this new kernel. Nonetheless, instead of considering the optimal solution of the background-free case P* as before, we will now consider the intermediate solution of the background-free case Pi* at any given iteration i. Therefore, when employing the new kernel KB at a given iteration i, the gradient (see Appendix) is given by
| | | ∇fB(Pi*) = ∇f(Pi*) + KT(ΔFi∘B2 − ΔFi) + KT(δ − δ∘B) | (39) |
where we now see that two additional terms appear in the gradient with respect to the background-free case. The term
KT(
δ −
δ∘
B) behaves similarly to the terms which appeared in the background division and subtraction cases, where the term only vanishes for
B → 1, but since this term only includes the difference between the noise and its background-damped counterpart, its influence will be relatively smaller than the others encountered this far. However, a new term
KT(Δ
Fi∘
B2 − Δ
Fi) appears also in the gradient
(39), which exhibits a much more interesting behaviour. In contrast to all the other terms encountered this far, due to its dependence on the time-domain residual vector Δ
Fi, this term will now evolve as the iterations
i proceed. As the number of iterations increases and the fitted signal becomes better, Δ
Fi will decrease and, therefore, reduce the influence of the term
KT(Δ
Fi∘
B2 − Δ
Fi), allowing a better approach to the background-free solution. Still, even at the ideal case Δ
Fi → 0 the remaining term
KT(
δ −
δ∘
B) will not allow the method to reach the background-free solution. This term, though, does reduce the influence of noise on the gradient due to the damping, which may potentially lad to even better results than the background-free case for strong background decays in highly noisy signals.
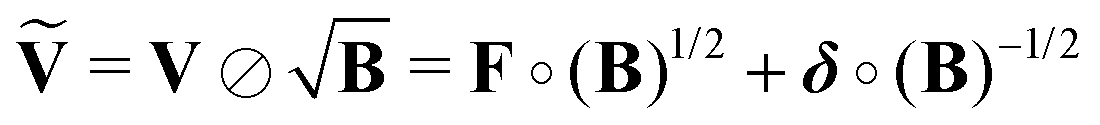
Next we want to study a way to even further approach the background-free gradient and its solution. An issue that can be observed in (39), is that multiplication by KTB introduces a second multiplication by B leading to the constant term KT(δ − δ∘B) and KT(ΔFi∘B2 − ΔFi).
To prevent this we propose yet another modification to the kernel. We design a new kernel  to fulfill the condition
| |  | (40) |
The kernel, which satisfies this, is constructed by multiplication of the square-root of the background along the time-dimension of the kernel
| | 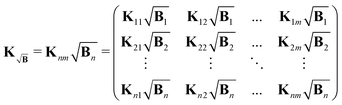 | (41) |
where again the definition of the kernel
K remains the same as in
(5). However, the gradient associated with new kernel reads
| |  | (42) |
where the problem arises that the terms of the experimental signal are multiplied by a factor
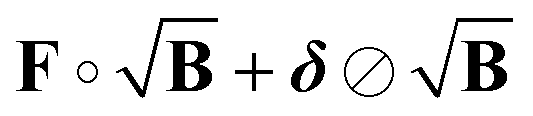
B1/2. This is easily corrected by a “partial background correction” of the experimental signal
| | 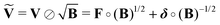 | (43) |
such that introducing this into the previous expressions yields the expected gradient (see Appendix)
| |  | (44) |
When compared to the gradient ∇
fB(
Pi*) in
(39), one can see that with this new kernel definition we can get rid of the constant term in
(39) as designed. The gradient now only contains one additional term with respect to the background-free case. This term
KT(Δ
Fi∘
B − Δ
Fi) represents an improvement upon the one in
(39) as
| | | ‖KT(ΔFi∘B − ΔFi)‖ < ‖KT(ΔFi∘B2 − ΔFi)‖ | (45) |
for any Δ
Fi ≠ 0, thus the term
KT(Δ
Fi∘
B − Δ
Fi) is able to reach smaller values allowing for a better approximation the background-free gradient. As before, and now decisively, as it is the only additional term, its influence decreases as the fit of the time-domain signal gets better, such that in the ideal case Δ
Fi → 0 the background-free gradient is obtained. Therefore, the background-free solution
Pi* can (in theory) be a solution of this method. In practice, the condition Δ
Fi = 0 is not reached due to the inversion problem being ill-posed. Nonetheless, the condition Δ
Fi ≈ 0 can still be well enough approached such that the solution obtained by this method is much closer to the background-free solution than for the previously established background correction approaches.
2.5 Finding the optimal regularization parameter
In order to achieve the background-free solution, its optimal regularization parameter αopt must be found. The search for the optimal regularization parameter can be performed with the routine employed in other works20,21 and applications, e.g. in DeerAnalysis.13 This routine involves the computation of many (un)constrained distance distribution by means of the pseudoinverse and/or solution of the NNLS problem for a set of different trial regularization parameters. For this set of distributions the corresponding residual and penalty terms of the Tikhonov functional are computed, which then are evaluated according to some given selection criterion method, e.g. AIC,27 GCV,28–30 L-curve,13,31 GML.32–34 In this section, we want to quickly point out a detail which, if left untreated, may become a pitfall for the new kernel methods.
As discussed, the search for the optimal regularization parameter begins with the computation of a set of distance distributions. By employing the kernel definition in (41) according to (44), all generated distributions will correspond to the best approximations to the background-free solutions at the different α values. However, a problem arises when explicitly computing the residual term of the Tikhonov functional before applying the selection criterion of choice. In the derivation of the kernel  in (41) and input signal Ṽ in (43), we did not analyze the expression for the residual, which has the form
| |  | (46) |
which now contains a square-root background-enhanced noise term which no longer corresponds to the background-free case. For the optimization of the Tikhonov problem, this is not a problem, since the algorithms for solving NNLS problems employ the gradient and never compute the residual explicitly. Still, since the explicit computation of the residual is required for the optimal regularization parameter selection, another approach must be found. This problem can be easily solved by employing the kernel
KB in
(38) instead of

along with the experimental signal
V in
(15) so that the expected residual term
| | | ‖KBP − V‖22 = ‖Ffit∘B − F∘B − δ‖22. | (47) |
is obtained, allowing for an optimal search of the optimal regularization parameter
αopt. Again, due to the inverse problem being ill-posed, the background-free gradient cannot be exactly reached and by extension one will not find the same optimal regularization parameter. Sill, as mentioned above, the

kernel method can achieve a very good approximation of the background-free gradient. It is to be expected that, from all methods discussed this far, the

kernel method finds the regularization parameter value closest to
αopt for the background-free case.
3 Empirical analysis
While large parts of our theory are exact, ill-possedness of the problem prevents us from strictly proving that our new approach to background correction is optimal or at least better than both established approaches for all conceivable cases. Therefore, in order to test and analyze the performance of the background-treatment approaches discussed during our theoretical derivation (see Table 1 for a summary of the results), we used the synthetic DEER data from the large library generated by Edwards and Stoll from a crystal structure of T4 lysozyme (PDB ID 2LZM).35 The library is based on 5622 different distance distributions generated by MMM36 from which 62![[thin space (1/6-em)]](https://www.rsc.org/images/entities/char_2009.gif) 103 noise-free dipolar evolution functions were generated with different time steps dt and trace lengths tmax. The distance distributions in the library cover a range of mean distances approximately in the range 2 nm to nm. Since this library was designed for representing DEER data, tmax are limited to the range 0.4–6.4 μs and dt to the range 5–200 ns. However, the combination of modern high-sensitivity spectrometers with optimized samples, longer dipolar evolution traces can be achieved. Thus, in order to have more representative examples of all of the dipolar spectroscopy experiments, the noise-free dipolar evolution functions were recomputed from the distance distributions according to (14) with extended tmax in the range 1–16 μs and dt in the range 5–200 ns with a fixed modulation depth of λ = 0.50.
103 noise-free dipolar evolution functions were generated with different time steps dt and trace lengths tmax. The distance distributions in the library cover a range of mean distances approximately in the range 2 nm to nm. Since this library was designed for representing DEER data, tmax are limited to the range 0.4–6.4 μs and dt to the range 5–200 ns. However, the combination of modern high-sensitivity spectrometers with optimized samples, longer dipolar evolution traces can be achieved. Thus, in order to have more representative examples of all of the dipolar spectroscopy experiments, the noise-free dipolar evolution functions were recomputed from the distance distributions according to (14) with extended tmax in the range 1–16 μs and dt in the range 5–200 ns with a fixed modulation depth of λ = 0.50.
Table 1 Summary of the theoretical results for the background-treatment approaches discussed in this work: the experimental signal employed as an input of the regularization, the kernels employed for the NNLS algorithm and for the optimal regularization parameter search, and the theoretical gradient of the Tikhonov functional
| Approach |
Input signal V |
Kernel for NNLS |
Kernel for αopt |
Gradient |
| Free |
F + δ |
K
|
K
|
∇f(P*) |
| Division |
F + δ⊘B |
K
|
K
|
∇f(P*) + KT(δ − δ⊘B) |
| Subtraction |
F∘B + δ − (1 − λ)(B − 1) |
K
|
K
|
∇f(P*) + KT(F − F∘B+ (1 − λ)(B − 1)) |
| Kernel KB |
F∘B + δ |
K
B
|
K
B
|
∇f(Pi*) + KT(ΔFi∘B2 − ΔFi) + KT(δ − δ∘B) |
Kernel  |
|

|
K
B
|
∇f(Pi*) + KT(ΔFi∘B − ΔFi) |
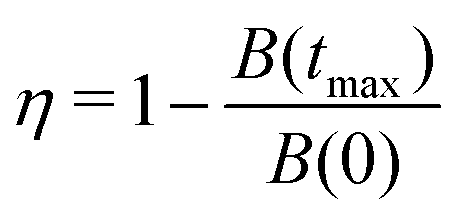
The performance of any background-treatment approach is expected to depend on the background decay rate and fractal dimension parameters. However, the most important factor to consider is the relative decay of the background function, as it determines how strong the damping and the decay of the form factor will be. In order to reduce the parameter space, we define the relative background decay as
| |  | (48) |
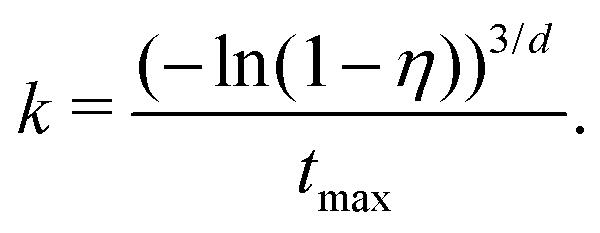
and study the performance of the proposed methods for different values of this parameter. To do so, we fixed the fractal dimension of the background to
d = 3 and then generated a set of background functions with a decay rate
k computed to match the desired set of relative background decays according to
| |  | (49) |
Therefore, while our theoretical analysis is generally applicable to any kind of background model, our numerical analysis will be focused on the exponential background function (which is a good approximation for many experimental situations). In all cases, the background functions are generated according to
(10) and multiplied to the form factor (
e.g.Fig. 3) as described in the ESI.
† The resulting signal is treated by any of the discussed background treatment approaches and then regularized. Following the optimization results in previous works
20,21 and current practice in the field, for the regularization, we chose the Tikhonov penalty, equipped with a second-order differential operator, and Akaike information criterion (AIC)
27 as the optimal regularization parameter selection method. The regularized distance distribution is then compared to the underlying ground truth
P0 using three different similarity metrics: the Euclidean distance (
![[small script l]](https://www.rsc.org/images/entities/char_e146.gif) 2
2) (directly related to the well-known root-mean square deviation) as well as the Bray–Curtis distance (
1) and the Chebyshev distance (
∞) (see ESI
†). The Euclidean distance is given by
where
P is the fitted distance distribution and
P0 the ground truth and in the context of our work it is simply proportional to the root mean square deviation between
P and
P0 (see ESI
†). The main difference between these norms is their nature: for
∞ distances only the largest value contributes, for
1 distances all values contribute the same and for
2 distances the outliers contribute the most. Therefore, an analysis based on a combination of all three types of norms allows for a better interpretation of the quality of the distance distributions. We found (see Fig. S1, ESI
†) that the choice of metric did not alter our findings and so, for the sake of clarity, only the results for the Euclidean distance will be shown.
 |
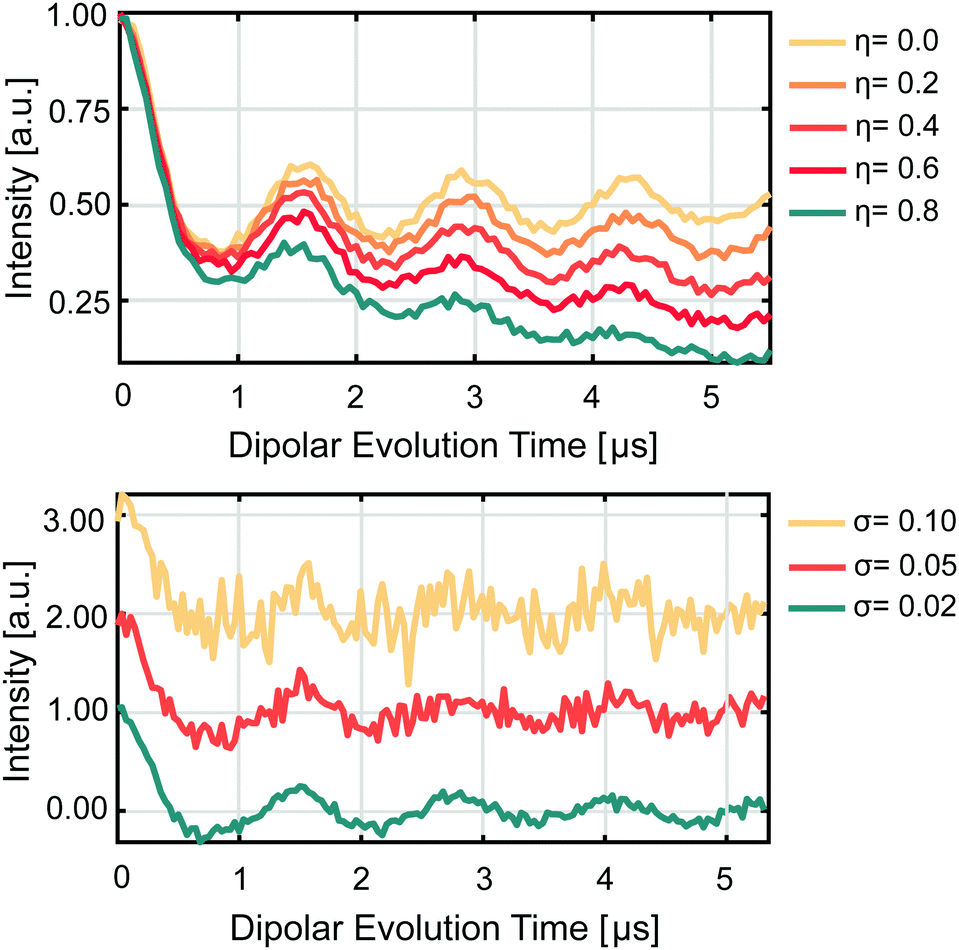
| | Fig. 3 Example form factors for visual reference. A dipolar evolution function corresponding to an inter-spin distance of 4 nm was converted to form factors (upper) with background functions of different relative background decay η values and (lower) different noise level σ values. The form factors are colour-coded according to the legends given next to each plot. | |
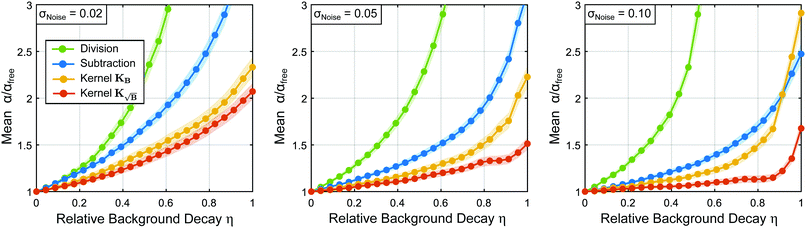
3.1 Dependence on the relative background decay
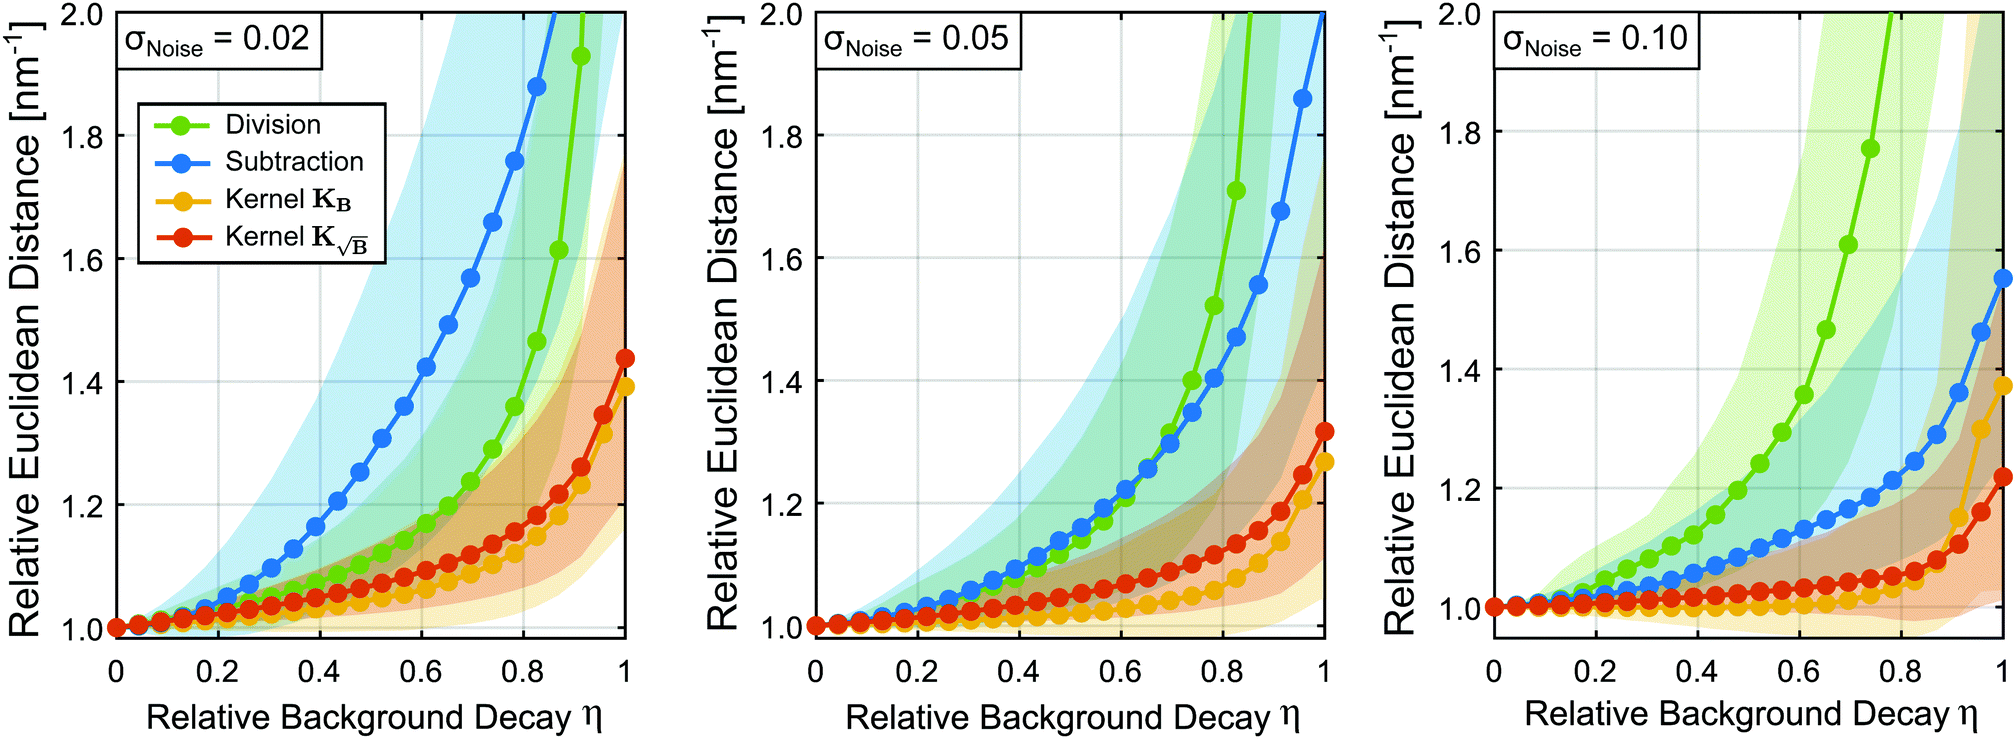
In this first test, we randomly selected 8500 different form factors and incorporated backgrounds of various relative background decays as described in the previous section. The results in Fig. 4 show performance of the different background treatment procedures relative to the performance of the background-free case. For all levels of noise, all approaches yield worse results with increasing relative background decay η as expected. At low noise levels background-division surpasses background-subtraction in terms of performance. Still, the subtraction approach yields better results than division at higher levels of noise, as expected from our previous theoretical discussion. As expected again from the theoretical derivation, methods which use the re-defined kernels yield overall better results. However, due to the spread of results we do not see major differences between the kernel methods. At higher noise levels (σ = 0.10), we see differences between the KB and  approaches for moderate η values. At moderate and larger noise levels we even observe cases where the kernel methods improve upon the background-free solution.
 |
| | Fig. 4 Relative Euclidean distances obtained from the statistical analysis of 8500 different form factors for different relative background decays and three different noise standard deviations: low (σ = 0.02), medium (σ = 0.05) and high (σ = 0.1) noise. For each instance the background is treated either by division (green), subtraction (blue), employing the kernel KB (orange) or kernel  (red). All Euclidean distances are evaluated relative to the background-free case. The coloured dotted lines represent the median values and the shaded areas, the interquartile ranges (IQR) of the data. (red). All Euclidean distances are evaluated relative to the background-free case. The coloured dotted lines represent the median values and the shaded areas, the interquartile ranges (IQR) of the data. | |
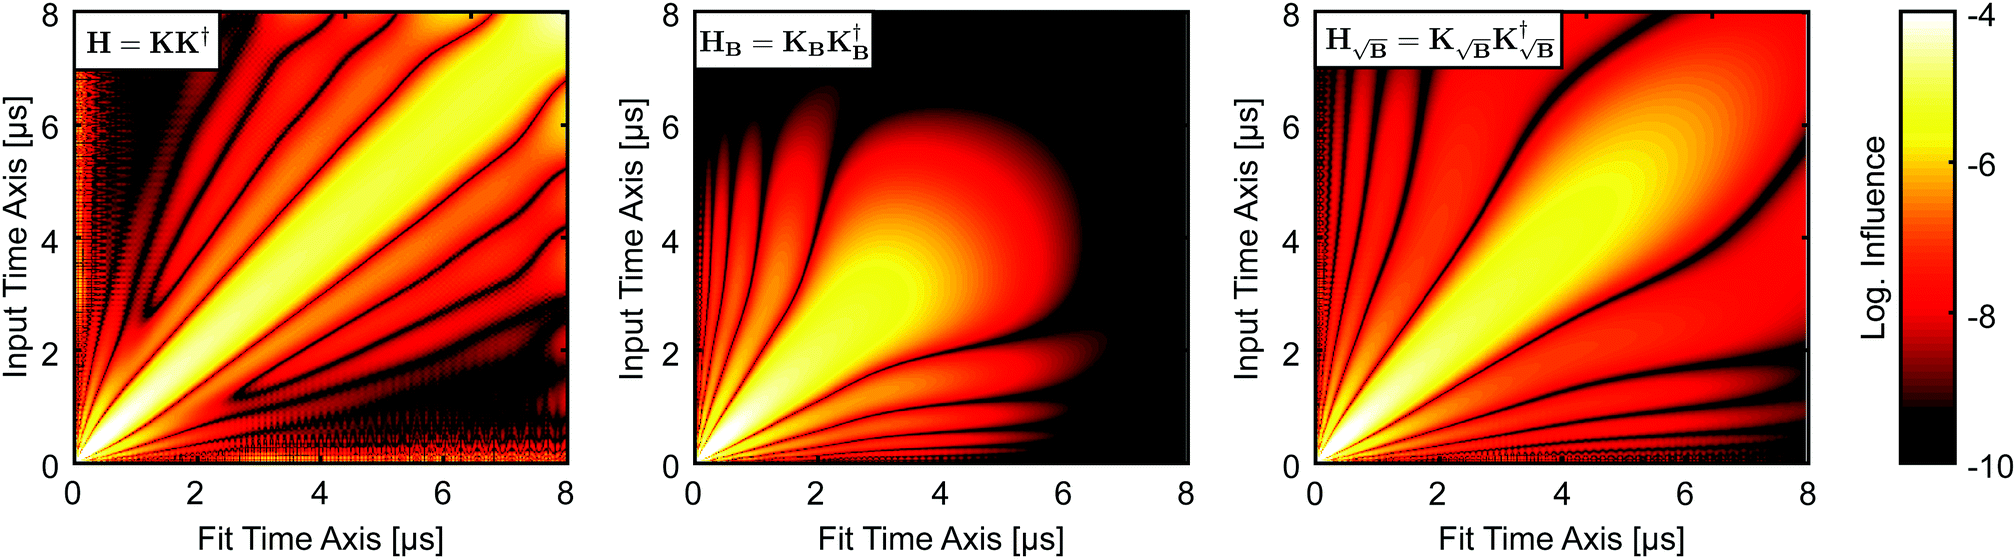
This phenomenon can also be understood by looking at the so-called influence or projection matrices H. The influence matrix maps the influence each experimental time-domain point Fi has on each fitted time-domain point Fj*. For unconstrained Tikhonov regularization, it can be expressed in closed form as
| | | H = KK† = K[(KTK + α2LTL)−1KT] | (51) |
where again
K† denotes the pseudo-inverse. We want to note again that the unconstrained solution of the Tikhonov functional is physically irrelevant. Still, since there is no way to compute the influence matrix for the constrained case we use this as an approximation for our discussion. The influence matrices
H,
HB, and

can be computed for the three kernel definitions
K,
KB and

, respectively. In order to assess the situation discussed above, where
KB performs worse than

yet still better than the background-corrected cases, we compare the influence matrices for a strong background function (
η ≈ 1) in
Fig. 5. With
H, one can see that the influence is strongly focused along the diagonal, meaning that fitted points are most influenced by the same or nearby time-domain point in the experimental signal. However, including the background function into the kernel as in
KB and

leads to diminished influence of the values at longer dipolar evolution times. Considering a very noisy signal, such as in
Fig. 4 for
σ = 0.10, this reduced influence of the later values, where most of the useful oscillations are obscured by noise, will lead to an overall reduced influence of noise. This effect is analogous to filtering by truncating the form factor prior to regularization, the difference being that the filtering obtained in this situation is smooth and acts as sort of a matched filter. However, when the background is very pronounced (
e.g. η in the range 0.8 to 1) this filtering effect can be too strong, suppressing any influence of values at longer times losing more information than noise as is the case when using
KB,
e.g. in
Fig. 5, where the fitted values at longer times are almost not influenced by any experimental values. This is not the case when using

since the background enters as the square root into the kernel. The influence of later points is still reduced, reducing the influence of noise, but experimental values at shorter times still influence the fit at longer times, thus yielding better results as seen in
Fig. 4.
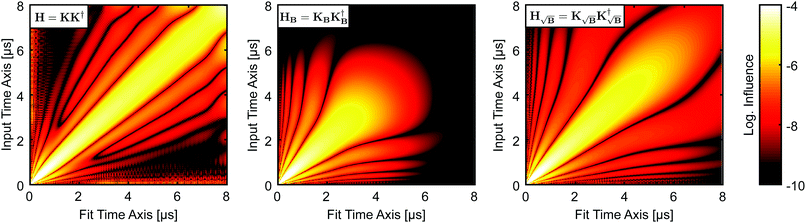 |
| | Fig. 5 Logarithmic colormaps of the influence matrices for the different kernel definitions exemplified by using kernels of 400 × 400 points, 20 ns time steps and α = 500. For the background in HB and  , an exponential function with k = 0.9 and d = 3 was used corresponding to η ≈ 1. The logarithmic intensities are colour-coded as specified by the colorbar. , an exponential function with k = 0.9 and d = 3 was used corresponding to η ≈ 1. The logarithmic intensities are colour-coded as specified by the colorbar. | |
Another interesting perspective from which to analyze this test is to monitor the various values adopted by the optimal regularization parameter α chosen by the Akaike information criterion when employing the different background treatment methods. In Fig. 6 the optimal regularization parameters averaged over the 8500 different tests are shown, where it can be identified that for the low-noise case (σ = 0.02) the background subtraction and division approaches yield too large regularization parameters relative to the background-free case, leading to broadening and worsening of the results as encountered in Fig. 4. The best approximation to the background-free case is achieved by the kernel  , which reaches regularization parameters closest to the reference value obtained in the background-free case (as expected from the discussion in Section 2.5).
 |
| | Fig. 6 Mean regularization parameters values employed for the results of Fig. 4 obtained from the statistical analysis of 8500 different form factors for different relative background decays and three different noise standard deviations: low (σ = 0.02), medium (σ = 0.05) and high (σ = 0.1) noise. These values are represented relative to the background-free regularization parameter values. For each instance the background is treated either by division (red), subtraction (violet), employing the kernel KB (orange) or kernel  (green). All regularization parameter values were evaluated relative to the values obtained for the background-free case. The Student's t 95%-confidence intervals for each curve are provided as respectively coloured shaded areas. (green). All regularization parameter values were evaluated relative to the values obtained for the background-free case. The Student's t 95%-confidence intervals for each curve are provided as respectively coloured shaded areas. | |
As the noise level increases, the increase of the regularization parameter with respect to the background-free case in all instances adopts larger values to compensate for the larger noise. Still, use of the kernel  keeps leading to the closes values to the background-free case, preventing further oversmoothing. In general, the trend observed for the optimal regularization parameter for each method correlates well with the results in Fig. 4.
3.2 Optimal truncation
We have seen multiple times, that the noise “explosion” caused by background division in situations with strong background decay leads to a considerable worsening of the regularization results. As mentioned before, in applications of this approach it is common practice to truncate the background-corrected signal, i.e. to discard the part of the data trace that is perceived by the practitioner to add more noise than information. The main problem with this approach is the fact that there are no established objective criteria for choosing the position at which to truncate and, therefore, the whole procedure is subjective and not reproducible. Still, the results we have shown thus far for the background-division have considered only the full-length signal and it is known that truncation of the trace can yield better results. Hence, in order to provide a fair comparison with the established approaches, we now consider the effects of truncating the time trace on the results.
To examine this, we tested, again, a subset of the library at various background decays. Due to the lack of criteria for selecting an optimal truncation position, we proceeded with an exhaustive grid search approach and tested all traces with the different backgrounds at several relative truncation positions. That way we err in favour of the previously established approaches since, in practice, the optimal truncation position will rarely be found. The computational cost associated with such a grid search limited the size of the subset of traces to be studied to 550. The results of this study are summarized in Fig. 7 and Fig. S2 (ESI†). In Fig. 7 we selected the optimal relative truncation position for each η-value (based on the minimum of the metric with respect to variation of the truncation position) and monitored the changes in the relative truncation positions and optimal metric values for the different relative background decay values. For the low-noise case (σ = 0.02) in Fig. 7, we see that for all other approaches besides background-division the optimal solutions are obtained without the need of truncating the trace (relative truncation positions of ∼95–100%). For the background-division case, however, we see that for decreasing relative background decay the optimal solution requires truncation of up to ∼60% of the signal. In the metrics, we see that truncation allows the background-division approach to perform considerably better than background-subtraction, provided that an experienced practitioner comes close to guessing the optimal truncation point. Still, neither of the two approaches (at optimal truncation) reaches the performance of the kernel methods. As the noise level increases (σ = 0.05), background-division requires considerable truncation even at lower η-values. Yet, despite the additional noise the background-division approach still performs better than the background-subtraction approach.
 |
| | Fig. 7 Relative Euclidean distance obtained from the statistical analysis of 550 different form factors for different relative background decays and three different noise standard deviations: low (σ = 0.02), medium (σ = 0.05) and high (σ = 0.1) noise. For each case the trace was truncated at the optimal position found by a grid-search and the background was treated either by division (green), subtraction (blue), employing the kernel KB (orange) or kernel  (red). All Euclidean distances are evaluated relative to the background-free case. The coloured dotted lines represent the median values and the shaded areas, the interquartile ranges (IQR) of the data. (red). All Euclidean distances are evaluated relative to the background-free case. The coloured dotted lines represent the median values and the shaded areas, the interquartile ranges (IQR) of the data. | |
In the high-noise case (σ = 0.10), background-division requires truncation of 25–60% of the signal even for not so strongly decaying backgrounds. However, even at optimal truncation background-division is (slightly) outperformed by subtraction. We can also see that the performance of the KB kernel method (and even the background-free case) may be improved by truncation of at least 25% of the trace in some cases, whereas background-subtraction and the  kernel method do not require truncation. This again shows the innate filtering properties of the
  kernel. In conclusion, we have shown that truncation of the form factors (assuming that the optimal truncation position is known) drastically improves the results obtained from background-division (again, assuming the practitioner manages to correctly guess the optimal truncation point), yet the performance of background division or subtraction never reaches the one obtained by the kernel methods even under optimal truncation conditions.
3.3 Influence of background misfitting
Thus far we have worked under the idealistic assumption that we know the exact background function B(t), i.e. in absence of any inaccuracy in the values of the decay rate k of the exponential function (10). Experimentally, these values are unknown beforehand and must be fitted from the experimental signal. This fitting procedure inevitably introduces uncertainty and possible errors into the parameter values which we then use to model the background. In this section, we will consider the effects this misfit can have on the performance of the different background treatment methods we have discussed so far.
First, we examine the effects of misfit of the background on the expressions derived in Section 2. If we now consider the case Bfit ≠ B then we see that the gradient (31) of the background-division case becomes
| |  | (52) |
whereas for the background-subtraction the gradient
(33) becomes
| | | ∇fsub(P)′ = ∇f(P) + KT(F − F∘B + (1 − λ)(Bfit − 1)). | (53) |
By comparing these gradients to
(31) and (33), respectively, one can see that the gradient for the background-divided case suffers more from this background misfit than the subtracted case. Hence, we expect background-division to perform worse than the other methods for a given misfitted background
Bfit. Now we shall consider the gradients when using the kernels
KB and

under misfit of the background. The gradient
(39) for the
KB case at an iteration
i now reads
| |  | (54) |
whereas the gradient
(44) for the

case reads
| |  | (55) |
From these results we see that the terms
KT(
Fi*∘(
Bfit −
B)) and
KT(
Fi*∘(
Bfit −
B)∘
Bfit) introduced by the error in fitting the background also evolve during the iterations of the fitting. Basically, as the iterations proceed and the fitted form factor
Fi* improves, the effects of the misfitting will decrease. Considering these results, we can expect the subtraction approach to be the most stable towards fitting errors due to the reduced influence on the gradient. For the kernel-corrected methods the additional term introduced by the fitting error cannot be removed anymore. However, for not too large errors the results can be expected to be better than for the other cases.
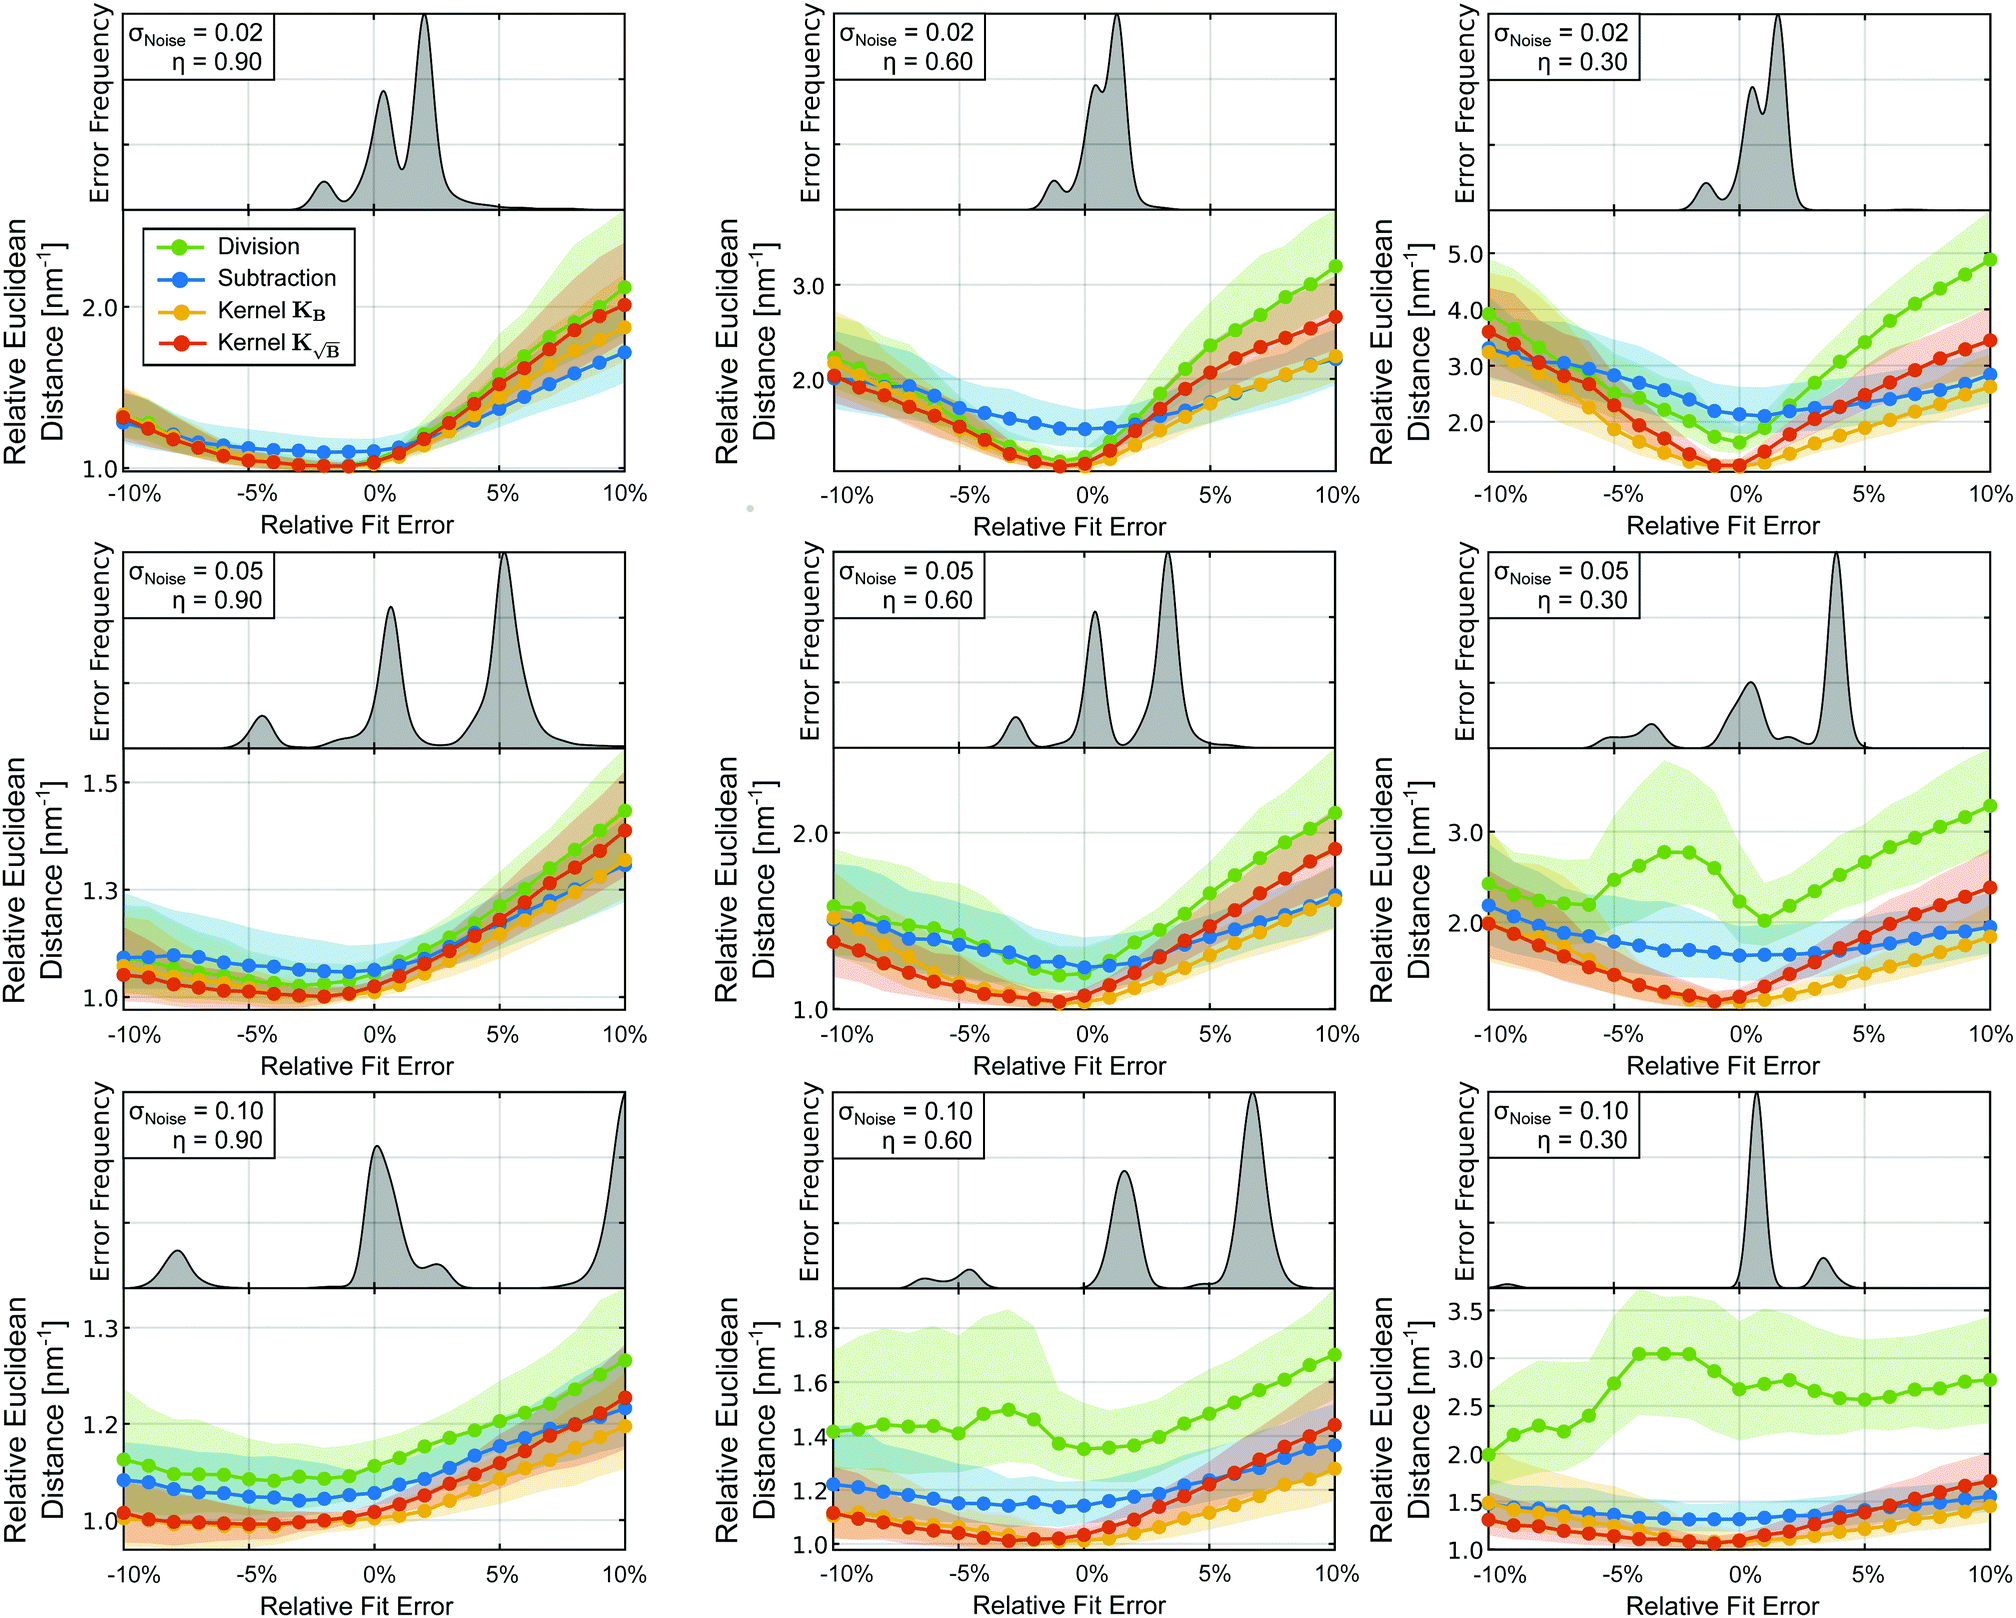
To confirm this, we performed two separate tests. First, in order to assess the typical fitting errors found in dipolar spectroscopy data processing, we considered 20000 different form factors from the dataset library with different relative background decays. The background functions were then fitted by DeerAnalysis13 using the default settings,‡i.e. automatic zero-time and background start determination and using a background model with fixed fractal dimension d = 3. The fitted parameters were then compared to the original ones and thus the relative error was determined. The statistical analysis in Fig. S3 (ESI†) revealed the range of fitting errors typically encountered when using DeerAnalysis. In a second analysis, we tested all four methods again against a subset of the dataset library for various relative background decays and assuming different errors in the fitting parameters in a range determined by the former test. To do so, we changed the values of a decay rate kfit parameter relative to the original parameter k values and employed this misfitted background for the calculations.
The results of both tests are summarized in Fig. 8 where we can see the effects on the background-treatment performance for the different methods relative to the background-free case under fitting errors typically found in DeerAnalysis. For small noise (σ = 0.02) we observe that the quality of the results quickly drops for increasing absolute fitting error for all four approaches, the effect being more drastic the smaller η gets. If compared directly to the cases with higher noise, we see that the tolerance towards errors improves. This effect can be explained by considering the influence of noise in the background-free case. For low-noise, the misfitting of the background is the primary source of error in the results. Therefore, any error in the fitting will yield much worse results than the background-free case. As the noise increases, noise becomes the primary source of error in the results and the relative contribution to the error introduced by misfitting the background will be reduced.
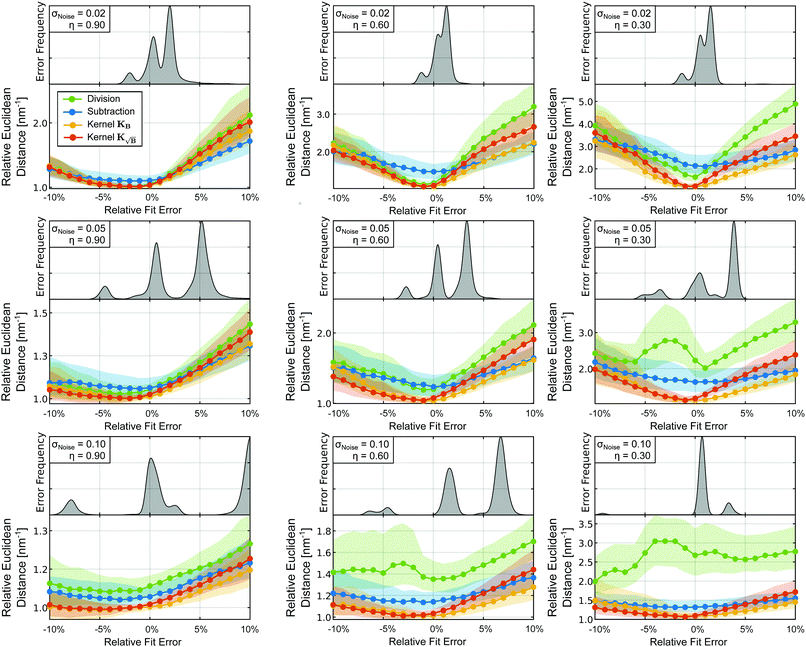 |
| | Fig. 8 Influence of errors in fitting of the decay rate parameter kfit of the exponential background function on the regularization results. The mean Euclidean distances for each method were obtained from a statistical analysis of 700 different form factors at different relative background decays, different fitting errors and three different noise standard deviations: low (σ = 0.02), medium (σ = 0.05) and high (σ = 0.1). The fitting error kfit/k is given as a percentage relative to the true value of the parameter k. As a reference, the frequency for encountering each error while fitting with DeerAnalysis are given as kernel density estimations with bandwidth h = 0.30. | |
In general, we see that background subtraction is the least affected method by misfitting as expected from (53). In comparison, the kernel methods exhibit a diminished tolerance towards background fitting errors (as expected from (54) and (55)), while division is the most affected approach. However, for small fitting errors, the subtraction case gradient (53) still represents a worse approximation of the background-free gradient than the kernel method gradients (54) and (55). Therefore, as long as the fitting error remains relatively small, these methods will still yield the best results.
Interestingly all approaches exhibit an asymmetric misfit tolerance behaviour with respect to the error-free case. Fitting smaller kfit-values (slower decaying background) appear to lead to smaller errors when compared to larger kfit-values (faster decaying background). Thus, in the case of uncertainty, underfitting of kfit-values seems to be a safer approach in terms of the regularization results, and should be considered as a rule of good practice. Additionally, for smaller kfit-values, the kernel methods seem to outperform the other approaches (especially at higher noise levels). In conclusion, we have seen that for the errors encountered most frequently the kernel methods outperform subtraction (and division) even in the presence of fitting errors. If fitting errors become too large, in some cases (e.g. σ = 0.02 in Fig. 8) background subtraction may perform as good or even somewhat better that the kernel methods. However, the quality of the signal even for the subtraction case is largely degraded and also, as shown by our statistics obtained from DeerAnalysis fitting, such cases are rare. Of course, if traces are too short for the main distances encountered in the distribution this situation is met, but then the distance distribution is unreliable with any processing.
4 Conclusions
In this work we have provided a theoretical analysis of the effects of the most commonly employed background correction approaches for dipolar EPR spectroscopy. During this analysis we have identified the problems plaguing these approaches and proposed two new approaches based on re-definition of the dipolar kernel by inclusion of the background function. The analysis also shows that one of these new approaches can reach, in theory, the true background-free solutions at given noise level.
To complement our analysis we have presented statistical studies by treating simulated test signals from a large library. The numerical results using the exponential background model confirm the results of our theoretical analysis proving the potential of these new approaches as substitutes for the current background-correction methods. In contrast to the background-division method, the kernel methods are universally applicable without the need to truncate the signal and they present a better tolerance towards errors in the fitting procedures of the background. In most situations they also perform better than background subtraction, which anyway is not physically correct.
We understand that an analysis based on similarity metrics such as the ones employed in this study does not provide an intuitive understanding of the improvements achieved. Therefore, in Fig. 9 we present a visual comparison of the distance distributions obtained with the different methods with a selection of model distance distributions. Such a comparison is purely anecdotal by necessity. In Fig. 9 we see that for mild cases (such as models D, H, and K) in the presence of a moderate background decay (η = 0.60) and low noise (σ = 0.02), all methods performs similarly without strong differences, with the kernel methods still yielding the best results. When the conditions get somewhat harsher (cases A, C, F, G, I and J) background-division (without further truncation) yields the worst results as we have seen throughout this work. The distributions obtained by background-division are all oversmoothed and many of the features present on the ground truth are lost. In models E, G, I and J we see the background-subtracted solution failing to perform well, while the kernel methods, which in general yield the best results, still do. An exception can be found in model I, where the KB kernel method fails and leads to an even worse solution than subtraction. The  kernel method, however, yields the most similar results to the ground truth for all instances, where the other methods fail to. This anecdotal analysis illustrates the benefits and potential of model-based processing approach using these new kernel definitions.
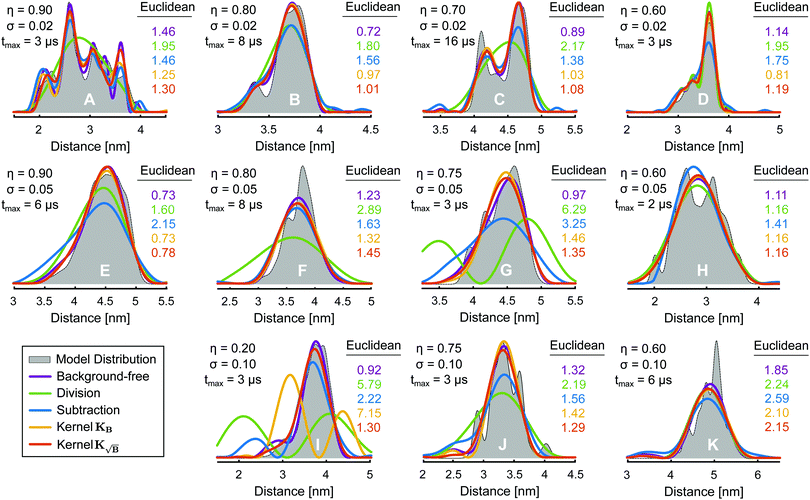 |
| | Fig. 9 Examples of distance distributions obtained via L2-AIC Tikhonov regularization after treating the background via division (green), subtraction (blue), employing the kernel KB (orange) or kernel  (red). The background-free fits are also given as a violet line. Information on the length (tmax), noise deviation (σ) and relative background decay (η) of the corresponding form factors are given next to each distribution. Additionally, the corresponding Euclidean distance between each fit and the underlying distance distribution (grey) are given next to each distribution with the corresponding colour-coding. (red). The background-free fits are also given as a violet line. Information on the length (tmax), noise deviation (σ) and relative background decay (η) of the corresponding form factors are given next to each distribution. Additionally, the corresponding Euclidean distance between each fit and the underlying distance distribution (grey) are given next to each distribution with the corresponding colour-coding. | |
In conclusion, we have shown that the current approaches for background-correction are sub-optimal when coupled to methods based on LSQ-fitting and proposed an improved approach based on a theoretical description of the background problem in dipolar spectroscopy and which yields improved results at no additional computational cost or processing steps. With this work we expect to have shed some light into the uncertainty many experimental spectroscopists experience when faced with the question on how to treat the background in dipolar signals. Additionally, this work opens up the possibility of new processing workflows for dipolar spectroscopy e.g. simultaneous fitting of background along a model-free distance distribution or other workflows based on re-definition of the kernel. All scripts employed for this work are available upon request.
Conflicts of interest
There are no conflicts to declare.
Appendix
In this appendix we provide a more detailed derivation of the expressions of the different gradients discussed in this work. First, we consider the background-free case where the gradient at the optimal solution ∇f(P*) can be written as| | | ∇f(P*) = KTKP* + Λ(P*) − KTF − KTδ | (56) |
| | | = KTF* − KTF + Λ(P*) − KTδ | (57) |
Next, let's consider the case of background division, where the gradient is given by
| | | ∇fdiv(P) = KTKP + α2LTLP − KTF − KT(δ⊘B). | (59) |
and introducing the optimal solution of the background-free case
P* into the equation yields
| | | ∇fdiv(P*) = KTKP* + Λ(P*) − KTF − KT(δ⊘B) | (60) |
| | | = KTF* + Λ(P*) − KTF − KT(δ⊘B) − KTδ + KTδ | (61) |
| | | = KTΔF + Λ(P*) − KTδ − KT(δ⊘B) + KTδ | (62) |
| | | = ∇f(P*) + KT(δ − δ⊘B). | (63) |
Next we consider background subtraction, where the gradient reads
| | | ∇fsub(P) = KTKP + α2LTLP − KT(F∘B) − KTδ + (1 − λ)KT(B − 1) | (64) |
and, again, introduction of the background-free case solution
P* yields
| | | ∇fsub(P*) = KTKP* + Λ(P*) − KTV | (65) |
| | | = KTKP* + Λ(P*) − KT(F∘B) − KTδ + (1 − λ)KT(B − 1) | (66) |
| | | = KTF* + Λ(P*) − KTδ + (1 − λ)KT(B − 1) − KT(F∘B) − KTF + KTF | (67) |
| | | = KTΔF + Λ(P*) − KTδ − KT(F∘B) + KTF + (1 − λ)KT(B − 1) | (68) |
| | | = ∇f(P*) + KT(F − F∘B+ (1 − λ)(B − 1)). | (69) |
Now we consider the case, where we employ the kernel
KB. The gradient at a given iteration
i, is given by
| | | ∇fB(Pi*) = KTBKBPi* + Λ(Pi*) − KTB(F∘B) + KTBδ | (70) |
| | | = KTB(Fi*∘B) − KTBF∘B + KTBδ + Λ(Pi*) | (71) |
| | | = KTB(ΔFi∘B) + KTBδ + Λ(Pi*) | (72) |
| | | = KT(ΔFi∘B2) + KT(δ∘B) +Λ(Pi*) | (73) |
which can be rewritten as
| | | ∇fB(Pi*) = ∇f(Pi*) + KT(ΔFi∘B2 −ΔFi) + KT(δ − δ∘B) | (74) |
Analogously, when using the kernel  as well as the partially corrected signal Ṽ, the gradient is given by
| |  | (75) |
| | | = KT(Fi*∘B) − KT(F∘B) − KTδ + Λ(Pi*) | (76) |
| | | = KT(ΔFi∘B) − KTδ + Λ(Pi*) | (77) |
| | | = KT(ΔFi∘B) − KTδ + Λ(Pi*) + KTΔFi − KTΔFi | (78) |
which can be rewritten as
| |  | (79) |
Acknowledgements
The authors thank the Stoll group for fruitful discussions. This work was supported by the ETH Zurich with grant ETH-35 18-2. Numerical calculations were facilitated by the use of the high-performance Euler cluster managed by the HPC team at ETH Zurich.
Notes and references
- O. Schiemann and T. F. Prisner, Q. Rev. Biophys., 2007, 40, 1–53 CrossRef CAS PubMed
 .
.
- G. Jeschke, Annu. Rev. Phys. Chem., 2012, 63, 419–446 CrossRef CAS PubMed .
- A. Milov, K. Salikhov and M. Shchirov, Fiz. Tverd. Tela, 1981, 23, 975–982 CAS .
- A. D. Milov and M. D. Shchirov, Sov. Phys. – Solid State, 1981, 23, 565–569 Search PubMed .
- A. D. Milov, A. B. Ponomarev and Y. D. Tsvetkov, Chem. Phys. Lett., 1984, 110, 67–72 CrossRef CAS .
- M. Pannier, S. Veit, A. Godt, G. Jeschke and H. Spiess, J. Magn. Reson., 2009, 213, 316–325 CrossRef PubMed .
- P. P. Borbat and J. H. Freed, Chem. Phys. Lett., 1999, 313, 145–154 CrossRef CAS .
- G. Jeschke, M. Pannier, A. Godt and H. Spiess, Chem. Phys. Lett., 2000, 331, 243–252 CrossRef CAS .
- L. V. Kulik, S. A. Dzuba, I. A. Grigoryev and Y. D. Tsvetkov, Chem. Phys. Lett., 2001, 343, 315–324 CrossRef CAS .
- S. Milikisyants, F. Scarpelli, M. G. Finiguerra, M. Ubbink and M. Huber, J. Magn. Reson., 2009, 201, 48–56 CrossRef CAS PubMed .
- G. Jeschke, A. Koch, U. Jonas and A. Godt, J. Magn. Reson., 2002, 155, 72–82 CrossRef CAS PubMed .
- G. Jeschke, Emerging Top. Life Sci., 2018, 2, 9–18 CrossRef CAS .
- G. Jeschke, V. Chechik, P. Ionita, A. Godt, H. Zimmermann, J. Banham, C. R. Timmel, D. Hilger and H. Jung, Appl. Magn. Reson., 2006, 30, 473–498 CrossRef CAS .
- A. D. Milov and Y. D. Tsvetkov, Appl. Magn. Reson., 1997, 12, 495–504 CrossRef CAS .
- K. Keller, M. Qi, C. Gmeiner, I. Ritsch, A. Godt, G. Jeschke, A. Savitsky and M. Yulikov, Phys. Chem. Chem. Phys., 2019, 21, 8228–8245 RSC .
- A. Doll and G. Jeschke, Phys. Chem. Chem. Phys., 2016, 18, 23111–23120 RSC .
-
R. A. Stein, A. H. Beth and E. J. Hustedt, in Methods in Enzymology, ed. P. Z. Qin and K. Warncke, Academic Press, 2015, vol. 563 of Electron Paramagnetic Resonance Investigations of Biological Systems by Using Spin Labels, Spin Probes, and Intrinsic Metal Ions, Part A, pp. 531–567 Search PubMed .
- S. Brandon, A. H. Beth and E. J. Hustedt, J. Magn. Reson., 2012, 218, 93–104 CrossRef CAS PubMed .
-
G. Jeschke, eMagRes, American Cancer Society, 2016, pp. 1459–1476 Search PubMed .
- T. H. Edwards and S. Stoll, J. Magn. Reson., 2018, 288, 58–68 CrossRef CAS PubMed .
- L. Fábregas Ibáñez and G. Jeschke, J. Magn. Reson., 2019, 300, 28–40 CrossRef PubMed .
-
C. L. Lawson and R. J. Hanson, Solving Least Squares Problems, SIAM, Prentice-Hall, Englewood Cliffs, New Jersey, 1974, vol. 18 Search PubMed .
- R. Bro and S. D. Jong, J. Chemom., 1997, 11, 393–401 CrossRef CAS .
-
W. Karush, MSc dissertation, Dept. of Mathematics, Univ. of Chicago, Chicago, Illinois, 1939 Search PubMed .
-
H. W. Kuhn and A. W. Tucker, Proceedings of the Second Berkeley Symposium on Mathematical Statistics and Probability, 1951.
-
D. Chen and R. J. Plemmons, The Birth of Numerical Analysis, World Scientific, 2009, pp. 109–139 Search PubMed .
- H. Akaike, IEEE Trans. Autom. Control, 1974, 19, 716–723 CrossRef .
- M. A. Lukas, Inverse Probl., 2006, 22, 1883 CrossRef .
- T. Robinson and R. Moyeed, Commun. Stat. - Theory Methods, 1989, 18, 523–539 CrossRef .
-
P. C. Hansen, Discrete Inverse Problems: Insight and Algorithms, Siam, 2010, vol. 7 Search PubMed .
-
P. C. Hansen, in Computational Inverse Problems in Electrocardiology, ed. P. Johnston, Advances in Computational Bioengineering, WIT Press, 2000, pp. 119–142 Search PubMed .
-
A. Davies, Treatment of Integral Equations by Numerical Methods, Academic Press, London, 1982, pp. 85–105 Search PubMed .
- G. Wahba, Ann. Stat., 1985, 13, 1378–1402 CrossRef .
-
M. A. Lukas, Mini Conference on Inverse Problems in Partial Differential Equations, 1992, pp. 89–110.
-
T. H. Edwards and S. Stoll, Synthetic Test Data Set for DEER Spectroscopy Based on T4 Lysozyme, 2018 Search PubMed .
- G. Jeschke, Protein Sci., 2018, 27, 76–85 CrossRef CAS PubMed .
Footnotes |
| † Electronic supplementary information (ESI) available. See DOI: 10.1039/c9cp06111h |
| ‡ Home-written scripts where used to automate the DeerAnalysis GUI for the fitting. |
|
| This journal is © the Owner Societies 2020 |
Click here to see how this site uses Cookies. View our privacy policy here. 
 Open Access Article
 This Open Access Article is licensed under a
  * and
Gunnar
Jeschke
* and
Gunnar
Jeschke
 to fulfill the condition
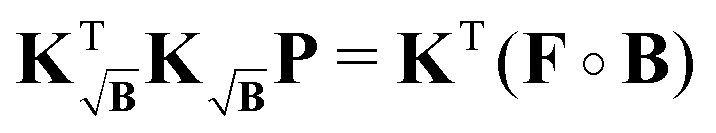


 in (41) and input signal Ṽ in (43), we did not analyze the expression for the residual, which has the form
 along with the experimental signal V in (15) so that the expected residual term
 kernel method can achieve a very good approximation of the background-free gradient. It is to be expected that, from all methods discussed this far, the
  kernel method finds the regularization parameter value closest to αopt for the background-free case.


 approaches for moderate η values. At moderate and larger noise levels we even observe cases where the kernel methods improve upon the background-free solution.
 (red). All Euclidean distances are evaluated relative to the background-free case. The coloured dotted lines represent the median values and the shaded areas, the interquartile ranges (IQR) of the data.
 can be computed for the three kernel definitions K, KB and
  , respectively. In order to assess the situation discussed above, where KB performs worse than
  yet still better than the background-corrected cases, we compare the influence matrices for a strong background function (η ≈ 1) in Fig. 5. With H, one can see that the influence is strongly focused along the diagonal, meaning that fitted points are most influenced by the same or nearby time-domain point in the experimental signal. However, including the background function into the kernel as in KB and
  leads to diminished influence of the values at longer dipolar evolution times. Considering a very noisy signal, such as in Fig. 4 for σ = 0.10, this reduced influence of the later values, where most of the useful oscillations are obscured by noise, will lead to an overall reduced influence of noise. This effect is analogous to filtering by truncating the form factor prior to regularization, the difference being that the filtering obtained in this situation is smooth and acts as sort of a matched filter. However, when the background is very pronounced (e.g. η in the range 0.8 to 1) this filtering effect can be too strong, suppressing any influence of values at longer times losing more information than noise as is the case when using KB, e.g. in Fig. 5, where the fitted values at longer times are almost not influenced by any experimental values. This is not the case when using
  since the background enters as the square root into the kernel. The influence of later points is still reduced, reducing the influence of noise, but experimental values at shorter times still influence the fit at longer times, thus yielding better results as seen in Fig. 4.
 , an exponential function with k = 0.9 and d = 3 was used corresponding to η ≈ 1. The logarithmic intensities are colour-coded as specified by the colorbar.
 , which reaches regularization parameters closest to the reference value obtained in the background-free case (as expected from the discussion in Section 2.5).
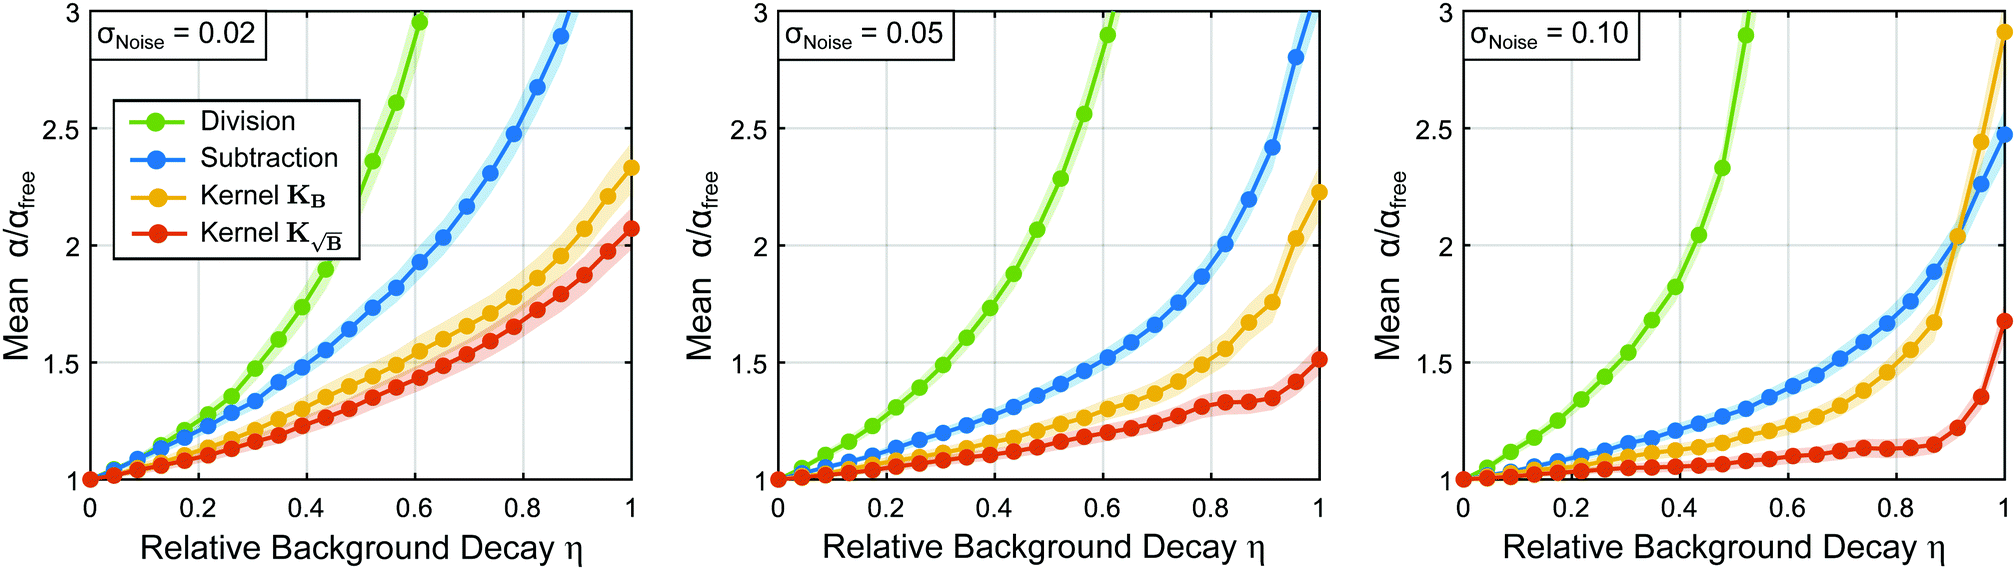
 (green). All regularization parameter values were evaluated relative to the values obtained for the background-free case. The Student's t 95%-confidence intervals for each curve are provided as respectively coloured shaded areas.
 keeps leading to the closes values to the background-free case, preventing further oversmoothing. In general, the trend observed for the optimal regularization parameter for each method correlates well with the results in Fig. 4.
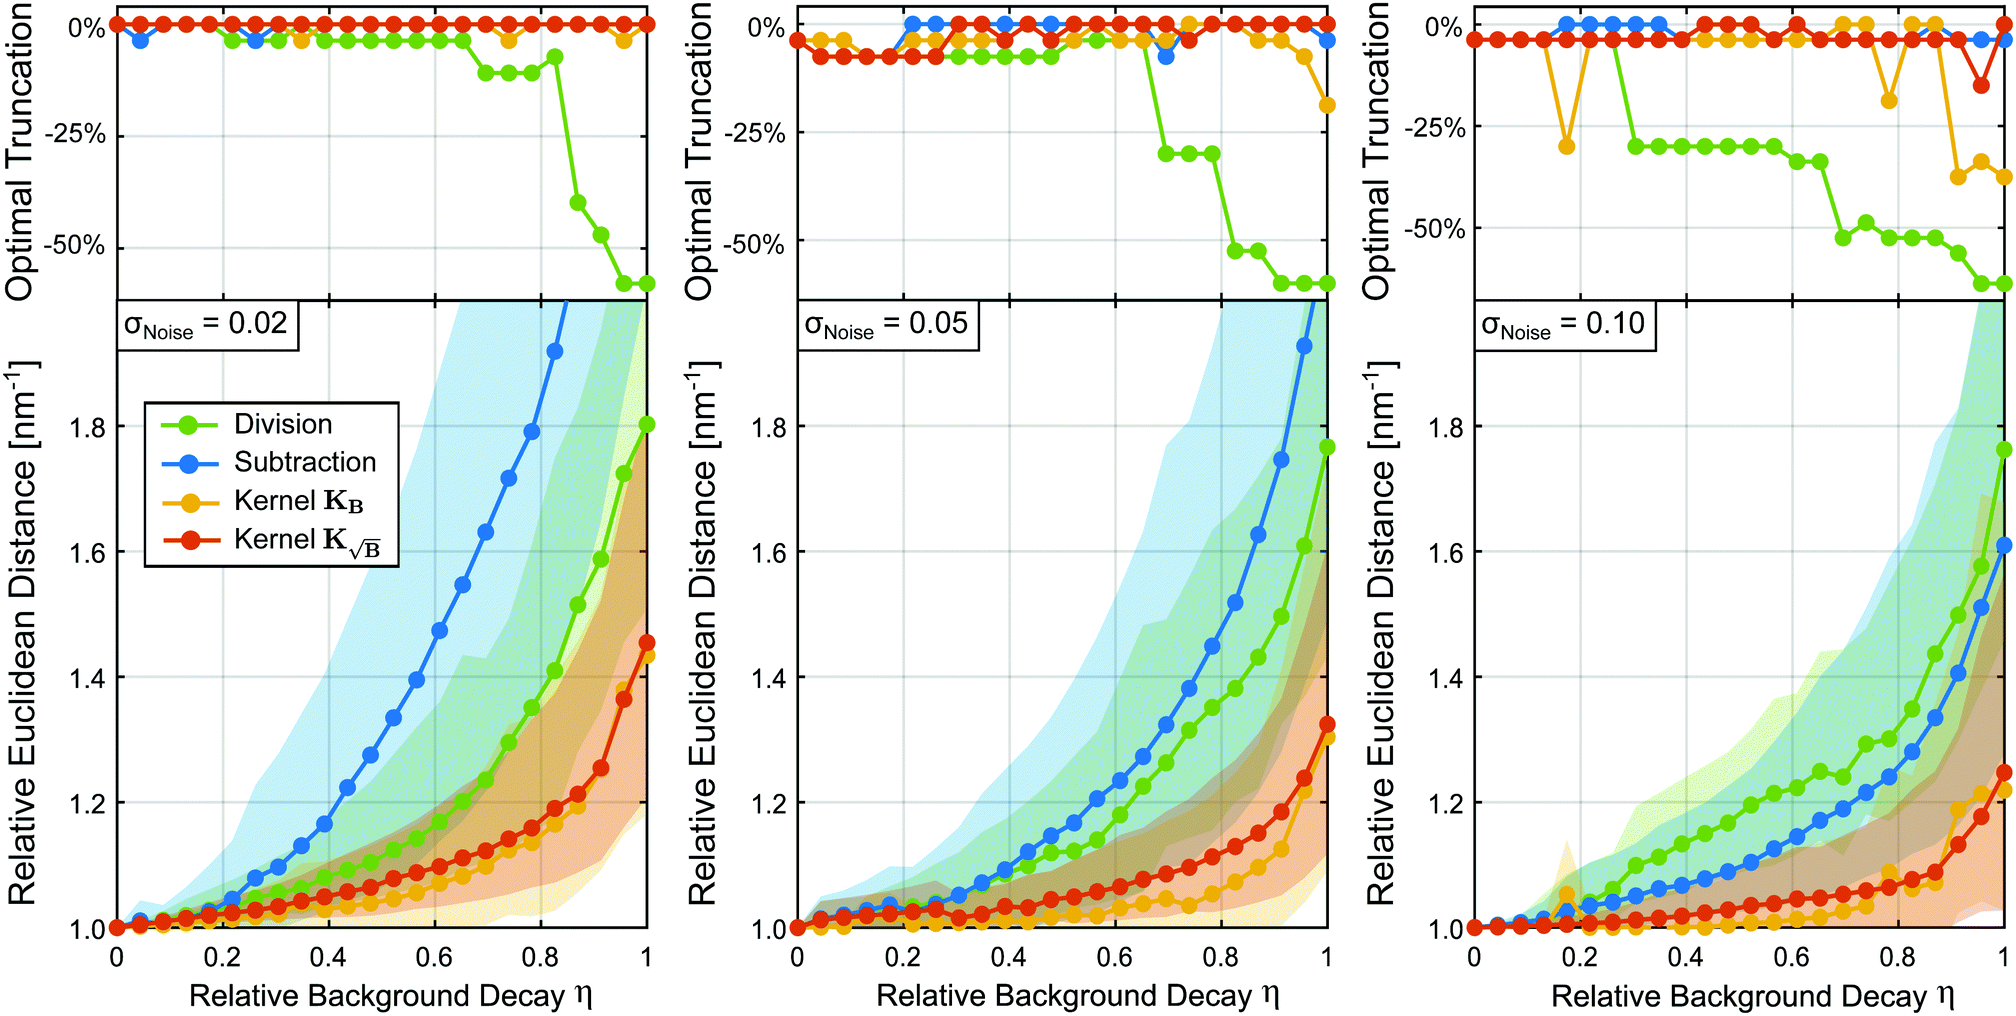
 (red). All Euclidean distances are evaluated relative to the background-free case. The coloured dotted lines represent the median values and the shaded areas, the interquartile ranges (IQR) of the data.
 kernel method do not require truncation. This again shows the innate filtering properties of the
  kernel. In conclusion, we have shown that truncation of the form factors (assuming that the optimal truncation position is known) drastically improves the results obtained from background-division (again, assuming the practitioner manages to correctly guess the optimal truncation point), yet the performance of background division or subtraction never reaches the one obtained by the kernel methods even under optimal truncation conditions.
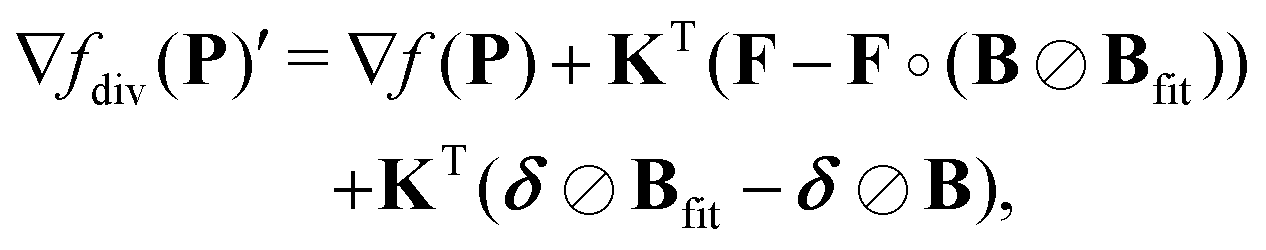
 under misfit of the background. The gradient (39) for the KB case at an iteration i now reads
 case reads
 kernel method, however, yields the most similar results to the ground truth for all instances, where the other methods fail to. This anecdotal analysis illustrates the benefits and potential of model-based processing approach using these new kernel definitions.
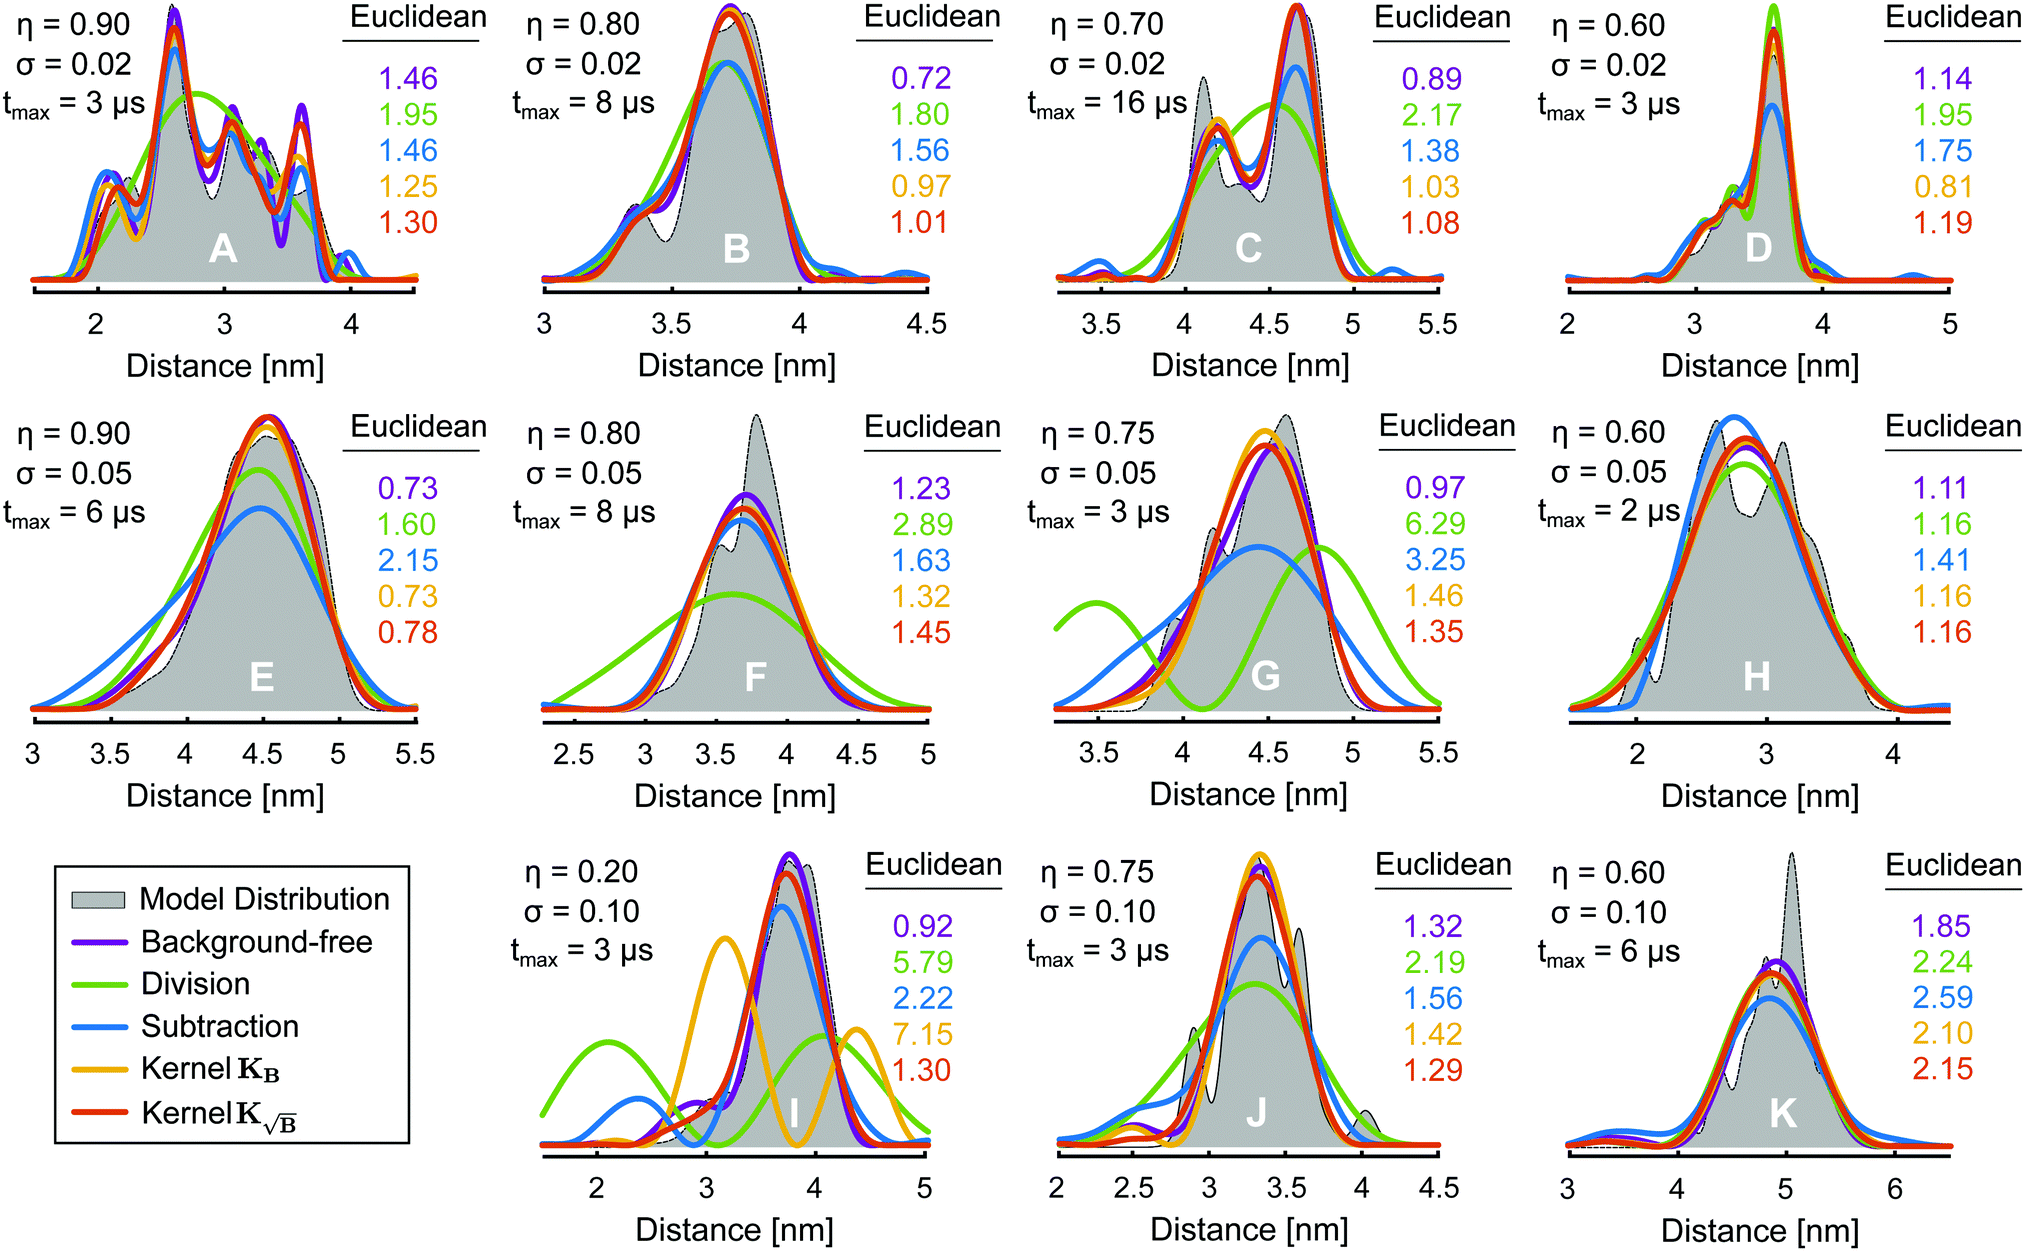
 (red). The background-free fits are also given as a violet line. Information on the length (tmax), noise deviation (σ) and relative background decay (η) of the corresponding form factors are given next to each distribution. Additionally, the corresponding Euclidean distance between each fit and the underlying distance distribution (grey) are given next to each distribution with the corresponding colour-coding.
 as well as the partially corrected signal Ṽ, the gradient is given by