
 Open Access Article
 This Open Access Article is licensed under a Creative Commons Attribution-Non Commercial 3.0 Unported Licence
Isothermal relaxation kinetics for the reduction and oxidation of SrFeO3 based perovskites†
B.
Bulfin
 *a,
J.
Vieten
bc,
S.
Richter
bc,
J. M.
Naik
d,
G. R.
Patzke
d,
M.
Roeb
b,
C.
Sattler
bc and
A.
Steinfeld
a
*a,
J.
Vieten
bc,
S.
Richter
bc,
J. M.
Naik
d,
G. R.
Patzke
d,
M.
Roeb
b,
C.
Sattler
bc and
A.
Steinfeld
a
aDepartment of Mechanical and Process Engineering, ETH Zürich, 8092 Zürich, Switzerland. E-mail: bulfin@ethz.ch; Tel: +41 44 633 87 30
bInstitute of Solar Research, German Aerospace Center, 51147 Cologne, Germany
cFaculty of Mechanical Science and Engineering, Institute of Power Engineering, Professorship of Solar Fuel production, TU Dresden, 01062 Dresden, Germany
dDepartment of Chemistry, University of Zurich, Winterthurerstrasse 190, CH-8057 Zurich, Switzerland
First published on 6th January 2020
Abstract
The perovskite oxide SrFeO3 has favourable redox properties for oxygen exchange applications, including oxygen separation and oxygen production chemical looping cycles. For such applications, lower temperature operation can improve the energy demand and feasibility of the process, but can also lead to kinetic limitations. Here we investigate the oxidation and reduction reaction kinetics of SrFeO3 in the temperature range 450–750 K. Isothermal relaxation techniques are used to observe the reaction rates across this temperature range, using a thermogravimetric analysis system. Experimental data are analysed according to an isoconversional method and fit with a simple power law model to extract activation energies. The apparent activation energy of oxidation and reduction was found to be 92 ± 16 and 144 ± 17 kJ mol−1 respectively. Comparison of oxidation and reduction kinetics together with considerations of particle size indicate that the oxidation reaction rate may be limited by diffusion in the bulk, while the reduction reaction rate is limited by the surface reaction. Furthermore, we also investigated the mixed perovskite Sr0.93Ca0.07Fe0.9Co0.1O3, which exhibited a 4-fold increase in the oxidation rate.
1 Introduction
The perovskite oxide SrFeO3 exhibits an oxygen non-stoichiometry which depends on the temperature and partial pressure of oxygen,1–3 | (1) |
For these oxygen separation applications, operating the redox cycle at lower temperatures can be very beneficial. Lower temperature implies less constraints on the reactor design and heat exchanger materials, a longer lifetime for the redox material, a potentially much lower energy demand, and therefore higher efficiency. However, lower temperatures will also hinder the kinetic activity of the redox reaction. Isothermal relaxation experiments on reduced SrFeO3 powder have shown rapid oxidation kinetics for temperatures above 673 K,16 where thermodynamic equilibrium was reached in approximately 1–2 min at 723 K.6,16 However, at 523 K 300 hours was insufficient time for a dense disk of the reduced perovskite SrFeO2.5 to reach equilibrium.4 These results suggest that oxidation reaction kinetics can become a critical limitation for temperatures below 723 K.
Previous kinetic studies have mostly focused on intrinsic oxygen transport properties at temperatures above 723 K, with a targeted application of SOFC cathodes.17 Electrical conductivity relaxation techniques were used to determine surface exchange and diffusion coefficients for SrFeO3 at temperatures in the range 973–1273 K.18,19 Relaxation kinetics of SrFeO3 have also been studied using thermogravimetric analysis,20 and oxygen uptake in a lab scale fixed bed reactor,21 but with both studies focused on temperatures above 723 K.
In this work we focus on a lower temperature range, 450–750 K, and use thermogravimetric analysis (TGA) with changes in temperature and abrupt changes in partial pressure to achieve the non-equilibrium conditions required for relaxation kinetics. We consider both the oxidation and reduction reactions of SrFeO3, and a mixed variant Sr0.93Ca0.07Fe0.9Co0.1O3 (SCFCO) from a previous study.22 This mixed perovskite has cobalt added in place of iron, to modify the redox behaviour, and calcium in place of strontium to mitigate the effect of the lower ionic radius of Co4+ with respect to Fe4+, and maintain the same Goldschmidt tolerance factor as SrFeO3.22 This mixed variant of SrFeO3 shows that the kinetics can be improved by the substitution of cobalt and calcium into the lattice.
2 Experimental
2.1 Sample preparations and characterization
SrFeO3 powder samples used in the thermogravimetric analysis (TGA) were prepared via a solid state route. Fe3O4 and SrCO3 were stoichiometrically mixed and annealed at 1373 K for 20 hours in an alumina crucible, after which the SrFeO3 is formed in large sintered granules. These granules were then pestled into a powder. In order to allow for a larger mass to be placed in the TGA, the SrFeO3 powder was compressed into an 8 mm diameter pellet, with a load of 4 metric tons, and then sintered at 1573 K for 20 hours, to improve structural stability. The resulting pellet weighed close to 500 mg, and mass and volume measurements indicated it had approximately 10–15% void space. Following the oxidation kinetics analysis, the pellet was used to study the reduction kinetics, but the first attempts at measuring the reduction, resulted in the pellet fracturing during the cycle. To avoid the possibility that a change in morphology might alter the kinetics, the pellet was ground back into a powder, and this was analysed instead. It was also this powder that the characterization data in Table 1 for the pellet is given.![[d with combining macron]](https://www.rsc.org/images/entities/i_char_0064_0304.gif) , the standard deviation in particle diameter σd, and d10 − d90 which is the diameters bounding the lower 10% and upper 90% of the cumulative mass/volume
, the standard deviation in particle diameter σd, and d10 − d90 which is the diameters bounding the lower 10% and upper 90% of the cumulative mass/volume
| Sample | T [K] | XRD main structure | Wt% perovskite | Lattice parameters [Å] |
[μm] |
σ d [μm] | d 10 − d90 [μm] |
|---|---|---|---|---|---|---|---|
| a This SrFeO3 powder sample showed two distinct perovskite structures, with approximately 50% in each phase, with both phases known to exhibit oxygen non-stoichiometry.27,28 b The SCFCO sample showed two additional secondary phases, a brownmillerite and a Ruddlesden–Popper structure both of which also exhibit oxygen non-stoichiometry.29,30 | |||||||
| SFO powder | 1373 | I4mmm – tetragonal | 50%a | a = 10.8970(7), c = 7.7170(5) | 5.3 | 1.82 | 3.2–7.7 |
| SFO pellet | 1573 |
Pm![[3 with combining macron]](https://www.rsc.org/images/entities/char_0033_0304.gif) m – cubic m – cubic |
100% | a = 3.8695(1) | 10.85 | 9.22 | 4.29–17.2 |
| SCFCO | 1573 |
Pmm – cubic |
80%b | a = 3.8543(1) | 7.8 | 2.79 | 4.5–11.5 |
The SCFCO sample was synthesized via the Pechini method,22 with detailed descriptions of this route given in earlier publications.23,24 After auto-combustion, the resulting fine oxide powder was ground and filled into alumina crucibles, which were then heated in a high temperature box furnace (Carbolite RHF 14/35) in order to produce the perovskite phase. The samples were treated twice at 800 °C for 10 hours followed by a treatment at 1300 °C for 20 hours. All samples were heated in air, and no intermediate powdering or mixing was carried out.
The perovskite phase formation of the samples were verified by powder X-ray diffraction (PXRD) using a STOE STADI P diffractometer equipped with a Dectris MYTHEN 1 K detector in transmission mode using a Ge monochromator for Cu-Kα radiation. The powders were scanned from 10–90°, with a step size of 0.01°, with a Rietveld refinement preformed using FullProf suite.25 The results are summarized in Table 1 (see ESI† for raw data and refinement plots), where it can be seen that the pellet showed a pure cubic perovskite structure, with a lattice parameter a which was slightly larger than that of SrFeO2.96.26 This expansion of the lattice can be explained by the fact that we do not expect a larger oxygen non-stoichiometry in our sample, which would expand the lattice due to more Fe3+ which has a larger ionic radius compared to Fe4+. The SCFCO sample was also primarily a cubic perovskite structure, but with two secondary phases, a brownmillerite and a Ruddlesden–Popper phase. The SrFeO3 annealed at 1100 °C was split between two tetragonal phases one of which was the Ruddlesden–Popper structure.
The particle size distribution of the powders was measured using a Horiba LA-950 laser scattering device. The powders were suspended in deionized water with a small amount of surfactant used to stop particles from getting trapped on the surface of the liquid. A scanning electron microscope was used to get qualitative visual confirmation of the particle size distribution measurements. The data is shown in Table 1, where it can be seen that the samples sintered at higher temperature have larger particles. The pellet shows the largest particles and broadest distribution. This can also be qualitatively seen in the SEM images in the ESI.† It should be noted here that in order to measure the pellets particle size distribution the pellet was first crushed using a mortar and pestle which may have reduced the average particle size.
2.2 Thermogravimetric analysis
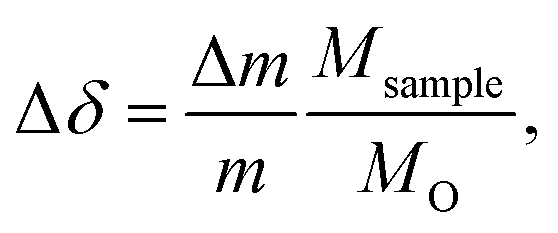
For TGA experiments, a thermobalance system by Netzsch (STA 409 CD) was used. This system was used to investigate both equilibrium non-stoichiometry and isothermal relaxation kinetics. Both powder and pellet samples were placed on a platinum foil wrapped alumina sample holder, and mounted on an alumina pin. The oxygen partial pressure was controlled by using different mixtures of pure oxygen, argon, and synthetic air. The changes in sample mass Δm, were then recorded while the temperature and partial pressures were varied. Since SrFeO3 displays non-stoichiometry even at ambient conditions, the changes in mass were always measured relative to an equilibrium reference point with a fixed temperature and oxygen partial pressure.The relative change in non-stoichiometry Δδ in SrFeO3−δ, can then be calculated from the mass changes,
 | (2) |
In order to measure isothermal relaxation kinetics the samples must be brought to a state where the non-stoichiometry is not at the equilibrium value δ ≠ δeq. For oxidation kinetics, the samples were initially reduced under Ar 5.0 (≈10−4–10−5 O2) flow of 100 ml min−1 at 800 °C. The samples were then cooled under the same Ar flow to the desired temperature, where re-oxidation is limited due to the lack of available oxygen. When the temperature has stabilised at the desired set point the gas flow is then switched to pure oxygen. The perovskite then begins to oxidise towards equilibrium and the resulting increase in mass was measured against time, giving an isothermal relaxation profile. Finally, the sample was brought to 400 °C in synthetic air after each kinetic run, as a reference point. Further experiments were carried out where the oxidising gas was a mixture with an oxygen percentage in the range 1–100% O2, in order to investigate the effect of the oxygen partial pressure on the kinetics. For the SCFCO perovskite the reduction step in argon was performed at 600 °C instead of 800 °C, as this material was seen to undergo a phase transition at higher temperatures in a previous study.22
For the reduction reaction the non-equilibrium state required for relaxation kinetics was achieved only by switching the gases. The samples were brought to the desired temperature set point in a pure oxygen flow of 200 ml min−1, giving pO2 ≈ 1 bar. When the temperature had stabilised the gas flow was then switched to 190 ml min−1 Ar and 10 ml min−1 synthetic air (20% O2) giving pO2 ≈ 0.01 bar. The more reducing atmosphere will cause the sample to lose oxygen, proceeding towards equilibrium with the resulting decrease in mass measured against time. Finally, the samples were brought to 450 °C in pure oxygen after each kinetic run, as the reference point.
A potentially limiting aspect of these isothermal relaxation measurements is the gas switching time, which can be affected by the mass flow controllers and diffusion along the gas flow. An analysis of this is given in the ESI,† which was validated using a mass-spectrometer downstream of the system. The time required to go from an initial change in pO2, to greater than 90% switched (i.e. 0.9 bar O2 for oxidation and 0.1 bar O2 for reduction), was on the order of 20 seconds for oxidation and 7 seconds for the reduction reaction. Mass changes measured in this region are included in plots and in determining the conversion extent, but were not used to analyse the kinetic data.
Examples of the raw TGA data for equilibrium analysis, reduction and oxidation isothermal kinetics are all available in the ESI.†
3 Results
3.1 Equilibrium measurements
In previous studies equilibrium measurements have typically focused on high temperatures 773–1473 K.1,3 There is some limited data at lower temperatures,4,6 but in the present study we aim to have a broader set of equilibrium data at lower temperatures, so that we know more accurately what the final equilibrium non-stoichiometry should be when the reactions are complete (δ∞ in eqn (3)).SrFeO3 is non-stoichiometric in oxygen, where the concentration of oxygen vacancies depends on the temperature and partial pressure (see eqn (1)).31,32 This oxide can exhibit a number of intermediate phases, which have been extensively reported on in the literature.4,33–35 Here we focus on the determination of the equilibrium non-stoichiometry at a range of temperature and partial pressures below 900 K.
The relative change in non-stoichiometry Δδ at equilibrium, was determined as described in the experimental details, and is plotted in Fig. 1. The data shown for SrFeO3 was obtained using the ground pellet which was annealed at 1573 K, as this showed the purest phase in the XRD analysis. The data is given in terms of the relative non-stoichiometry Δδ so that SrFeO3 and SCFCO can be directly compared, where Δδ = 0 corresponds to T = 803 K and pO2 = 1 bar. They have extremely similar changes in non-stoichiometry with temperature and oxygen partial pressure. This is not particularly surprising as they have the same phase and the species expected to change oxidation state in the oxidation and reduction reactions is predominately Fe4 +–Fe3+ in both cases.
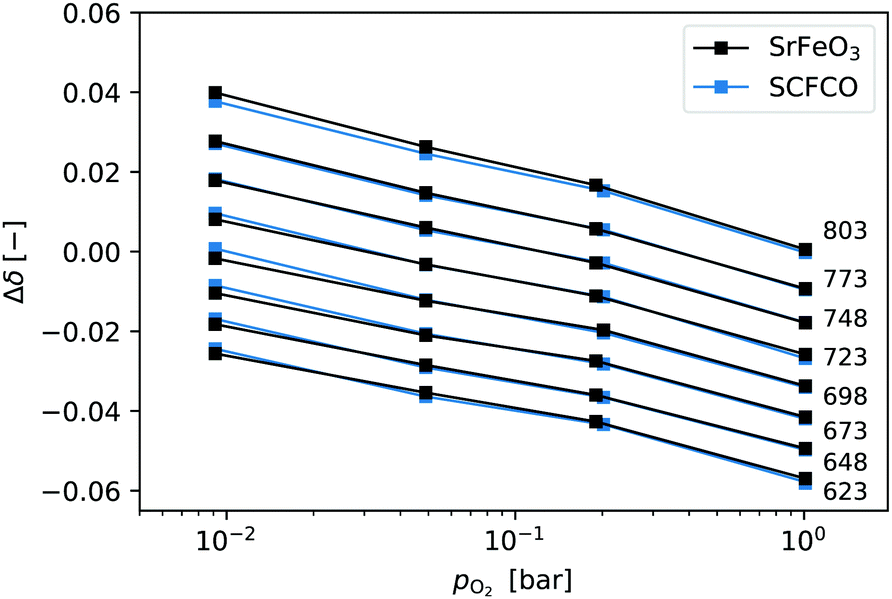 | ||
| Fig. 1 Relative non-stoichiometry Δδ plotted against the oxygen partial pressure for temperatures in the range 623–803 K. Data at a given temperature are connected by lines and labeled on the right. | ||
3.2 Oxidation kinetics
The oxidation kinetics were measured at isothermal conditions in a pure oxygen atmosphere in the temperature range 450–750 K. The mass changes as a function of time were used to calculate Δδ(t), using eqn (2). Some examples of the raw TGA data are given in the ESI.† In order to analyse such data it is convenient to define an extent of conversion X, given by,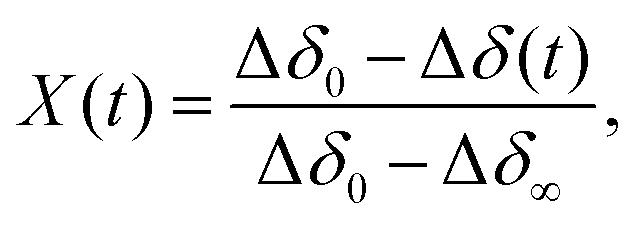 | (3) |
A quick check of the effect of temperature on the oxidation reaction can be obtained by looking at the half life of the reactions t1/2, defined by,
| X(t1/2) = 0.5. | (4) |
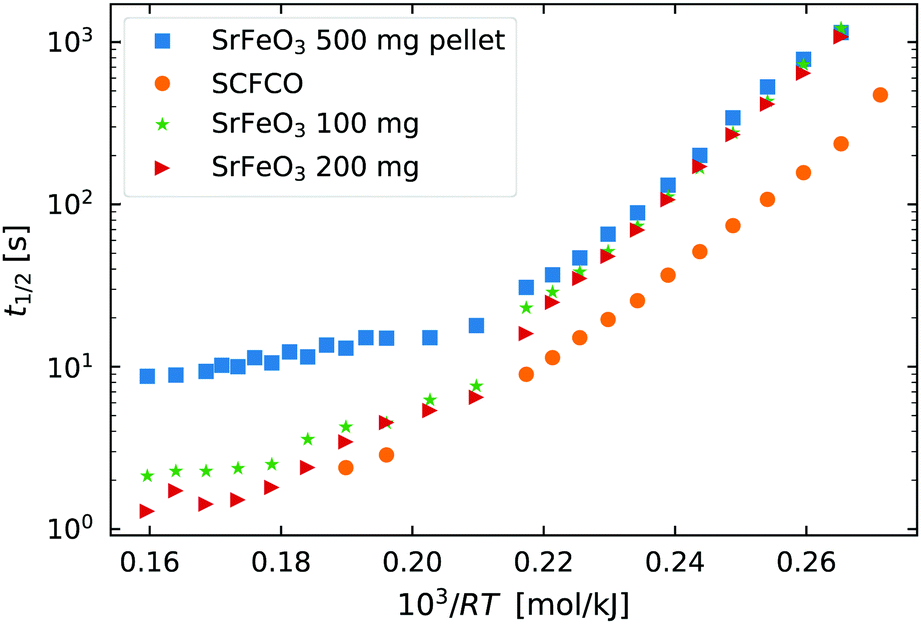 | ||
Fig. 2 The half life t1/2 of the oxidation reaction t1/2vs. , for re-oxidation of the SrFeO3 pellet, 200 mg of the SCFCO powder, and the SrFeO3 powder sintered at 1373 K (100 and 200 mg). , for re-oxidation of the SrFeO3 pellet, 200 mg of the SCFCO powder, and the SrFeO3 powder sintered at 1373 K (100 and 200 mg). | ||
Above 550 K (103/RT < 0.22) the trends in t1/2 change, particularly for the pellet where the half life no longer has a strong dependence on temperature. In this region the half life is on the order of 10 seconds for the 500 mg pellet. The total mass change to reach the X = 0.5 is on the order of 5 mg or 1.56 × 10⁻⁴ mol of O2, and the oxygen supply rate of 100 ml min−1 corresponds to 7.34 × 10⁻⁵ mol s−1 of O2. So the minimum t1/2 by mass transfer limitations is just over 2 seconds. Given that the gas switching in the TGA requires approximately 20 seconds (see gas switching section in the ESI†), we conclude that the kinetics above 550 K are mass transfer limited.
Finally, Fig. 2 also shows the half life for the oxidation of SCFCO powder, which can be seen to have considerably faster kinetics than SrFeO3. For example at 473 K, SCFCO has a half life of just 107 s, while the SrFeO3 powder had a half life of 426 s. This factor of four increase in the rate of reaction can not be explained by the physical morphology of samples, as the SCFCO sample had a similar particle size distribution as the SrFeO3 pellet (see Table 1). We can therefore assume, that the mixed perovskite has improved intrinsic oxygen transport kinetics, which could be better oxygen lattice diffusion or surface exchange properties.
The mechanism by which the oxidation takes place can be broken into a number of steps, (1) oxygen gas adsorption and dissociation, (2) charge transfer and incorporation of the adsorbed oxygen into the oxide, and (3) diffusion into the bulk.36–38 In the methods used here we do not have the possibility to probe the individual reaction steps. For simplicity it is therefore easier to consider the adsorption, dissociation and incorporation of oxygen into the bulk, as the surface reaction. We then have a surface reaction followed by a diffusion process, which for spherical particles can be analytically modelled.39 However, here we have a distribution of particles, which rules out the use of such a simple analytical approach. Instead, we first apply the isoconversional method from the ICTAC Kinetics Committee recommendations for performing kinetic computations on thermal analysis data.40
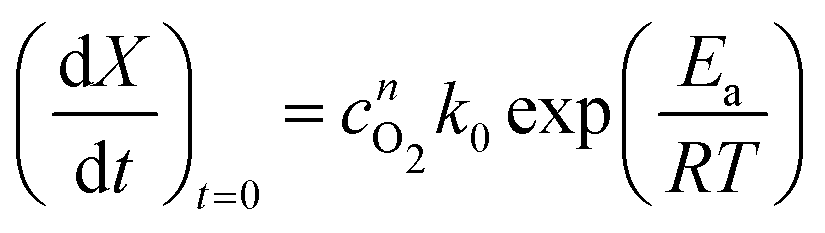
To implement this approach, we assume that the rate of reaction can be parametrized in terms of the temperature T, conversion extent X, and the oxygen gas concentration cO2,
 | (5) |
 | (6) |
It is worth noting here that the ICTAC Kinetics Committee recommendations suggest a generic function of partial pressure h(pO2) instead of concentration.40 However, in the classical literature on this topic concentration is preferred.41 This is an important distinction as the concentration for a fixed partial pressure depends on the temperature, where according to the ideal gas law we have,
 | (7) |
In order to determine the value of n, SrFeO3 relaxation kinetics were measured at oxygen partial pressures pressures 1, 0.2, 0.05 and 0.01 bar, and at temperatures of 523 K and 573 K. This data range was selected as at lower temperatures and lower partial pressures the reaction proceeds too slowly to accurately measure the rate, and at higher temperatures the pure oxygen case was mass transfer limited. To analyse the data we note that the initial slope of the mass change is proportional to the rate of change of the conversion extent  . Therefore a log–log plot of
  vs. cO2 should yield n as the slope. Fig. 3 shows such a plot, where the slope of the lines were found to be n = 0.68 and 0.71. We therefore took the value of n to be 0.695 in the rest of the analysis. We use the same value for all samples as the oxygen concentration dependence should not change much between samples. A sensitivity analysis also showed that varying n between 0.4 and 1 had very little effect (<2% change) on the apparent activation energies.
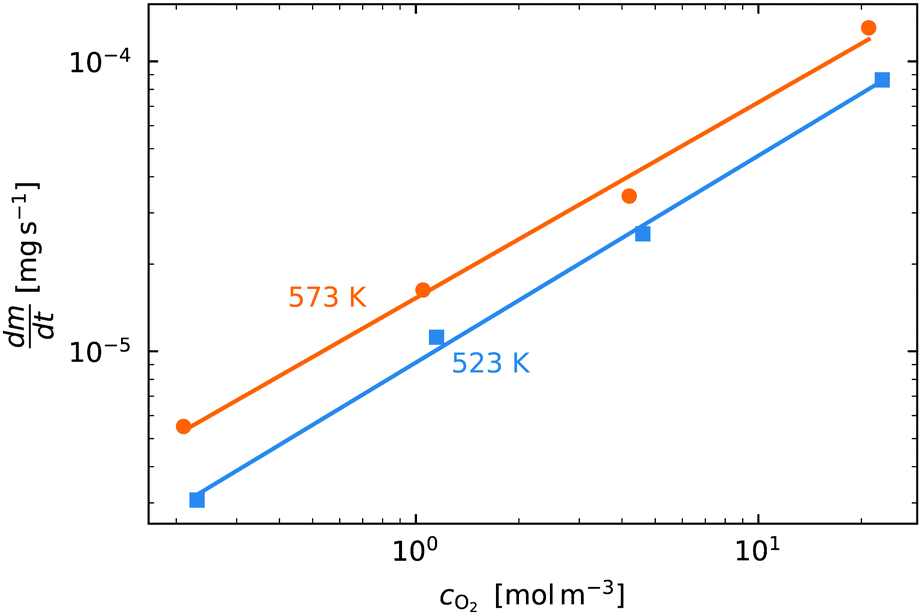 | ||
Fig. 3 The initial slope  plotted against the oxygen concentration for cO2 for data taken recorded at temperatures 523 K and 573 K. plotted against the oxygen concentration for cO2 for data taken recorded at temperatures 523 K and 573 K. | ||
With the value of n we can now apply the isoconversional method. For a fixed value of X, eqn (5) can be written as,
 | (8) |
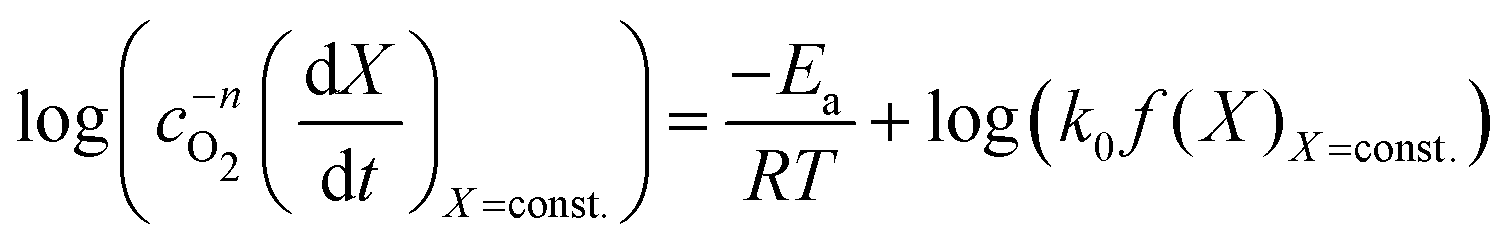 | (9) |
 vs.
vs. will have the activation energy as the slope and log(k0f(X)) as the intercept. Since we currently assume that we do not know anything about f(X), we only extract the activation energy.
Fig. 4(a) shows the conversion extent vs. time for the SrFeO3 pellet in the temperature range where the kinetics were not limited by mass transfer. In order to analyse the data we need to take the time derivative of X. Taking the numerical derivative of the original time series data is problematic, as noise in the original the mass data, taken at short intervals of 1 second, is amplified. Instead we take a subset of the experimental X, with larger discreet steps of 0.05 in the range 0 to 1, with these points marked by square symbols in Fig. 4(a). The numerical derivative was then calculated using second order accurate central differences, and first order accurate one-side difference at the boundary points. This resulted in a smoother derivative of the experimental rate which was suitable for further analysis.
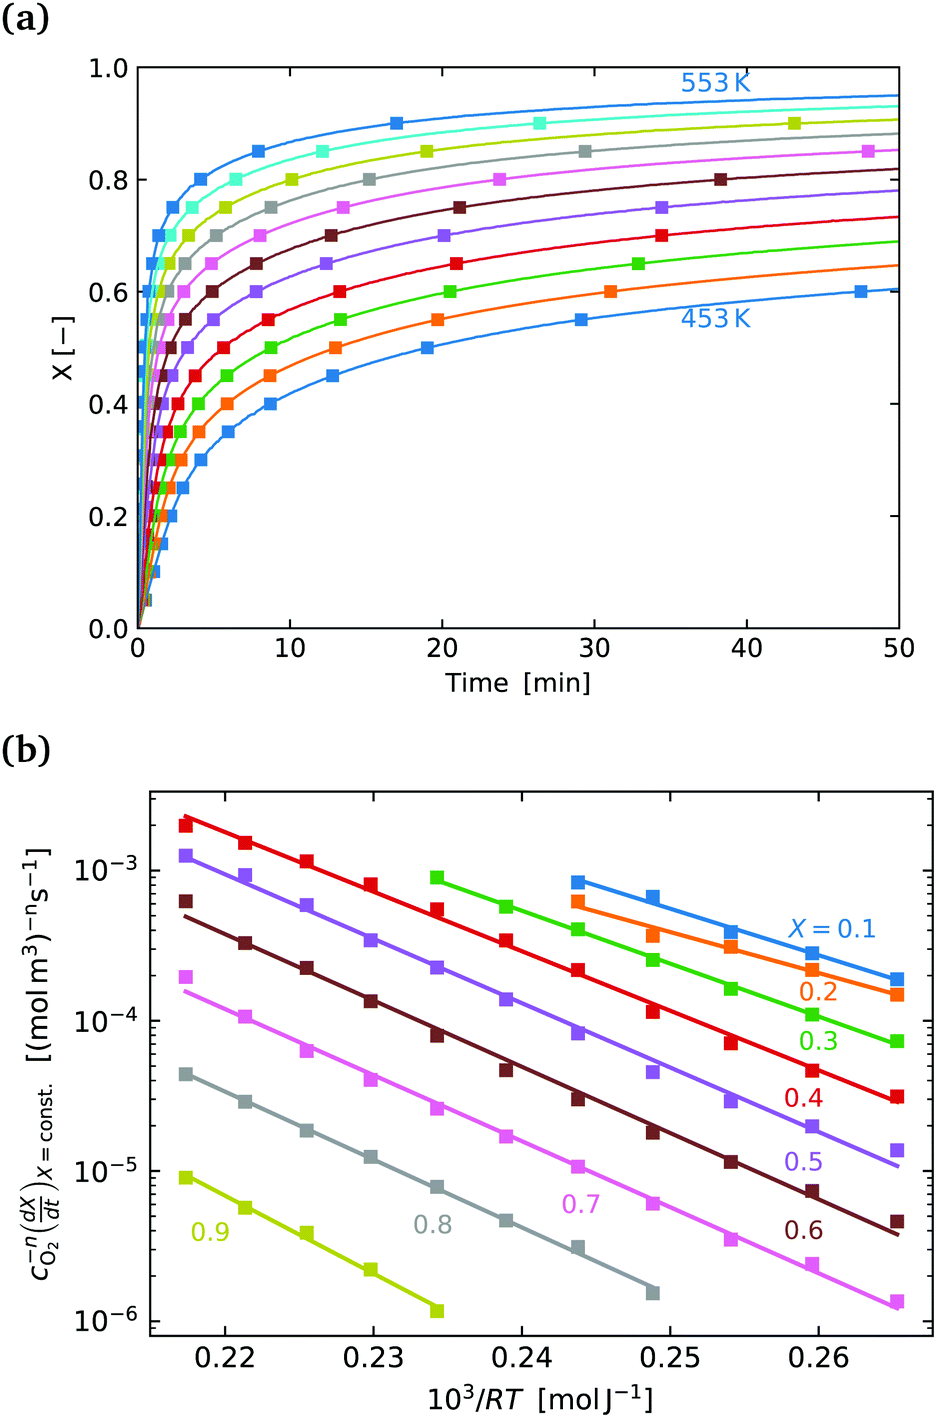 | ||
Fig. 4 (a) Conversion extent X vs. time for temperatures in the range 453–553 K in steps of 10 K. (b) 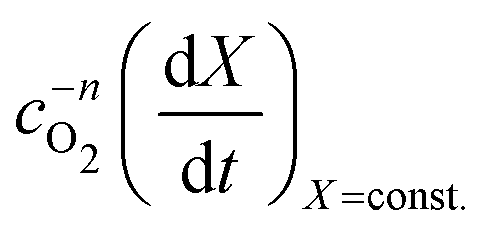 plotted on a log scale vs. plotted on a log scale vs.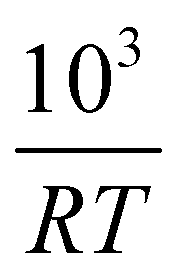 where the slope of each line is the activation −Ea in [kJ mol−1]. The labels indicate the fixed value of X for each line. where the slope of each line is the activation −Ea in [kJ mol−1]. The labels indicate the fixed value of X for each line. | ||
Fig. 4(b) shows the plot of the isoconversional method used to extract the activation energies. All of the lines have comparable slopes and thus also similar activation energies. Taking the average of the slopes as the activation energy and the standard deviation as the error gives Ea = 92 ± 17 [kJ mol−1]. Yoo et al. determined an apparent activation energy for diffusion of Ea = 110 ± 10 [kJ mol−1], via electrical conductivity relaxation experiments in the temperature range 1073–1273 K. The similarity in these values which have overlapping errors, could indicate that the oxidation reaction is diffusion controlled in the temperature region considered. This is supported by the data in Fig. 2 where the pellet is seen to have a half life on the order of 1.5 to 2 times that of the finer SrFeO3 powder. The SEM images (ESI,† Fig. S5) and particle size distribution measurements (Table 1) indicate that the SrFeO3 powder from the SrFeO3 pellet has twice the average particle size compared to the finer SrFeO3 powder. If the reaction were surface controlled we might expect a much larger difference in kinetics, as they would depend directly on the surface area. However, given that the SrFeO3 powder showed different phases we should be cautious in directly comparing these samples.
| f(X) = (1 − X)m | (10) |
 | (11) |
 | (12) |
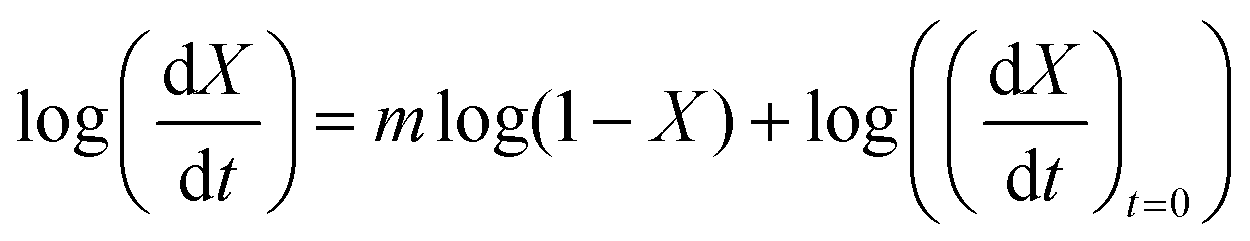 | (13) |
 vs. 1 − X should be linear with a slope of m and intercept
  .
.
Fig. 5(a) shows the experimental data obtained for the SrFeO3 pellet and a fit made according to eqn (11). For small values of X the data diverges from the model, which is more significant at high temperatures. This behaviour is due to the fact that we do not have a perfect switch to an oxidising atmosphere. It takes approximately 20 seconds to go from low oxygen concentration to 90% oxygen atmosphere around the pellet. The effect is more evident at higher temperatures where the kinetics are faster and thus more of the data is affected by this switching region. When fitting the data we therefore only considered the regions outside this switching time, where the points appear to have a linear dependence on X. To fit the model each temperature data set was initially fit linearly to determine m, the average of these individual fit values was taken and used to fit the model to the entire dataset.
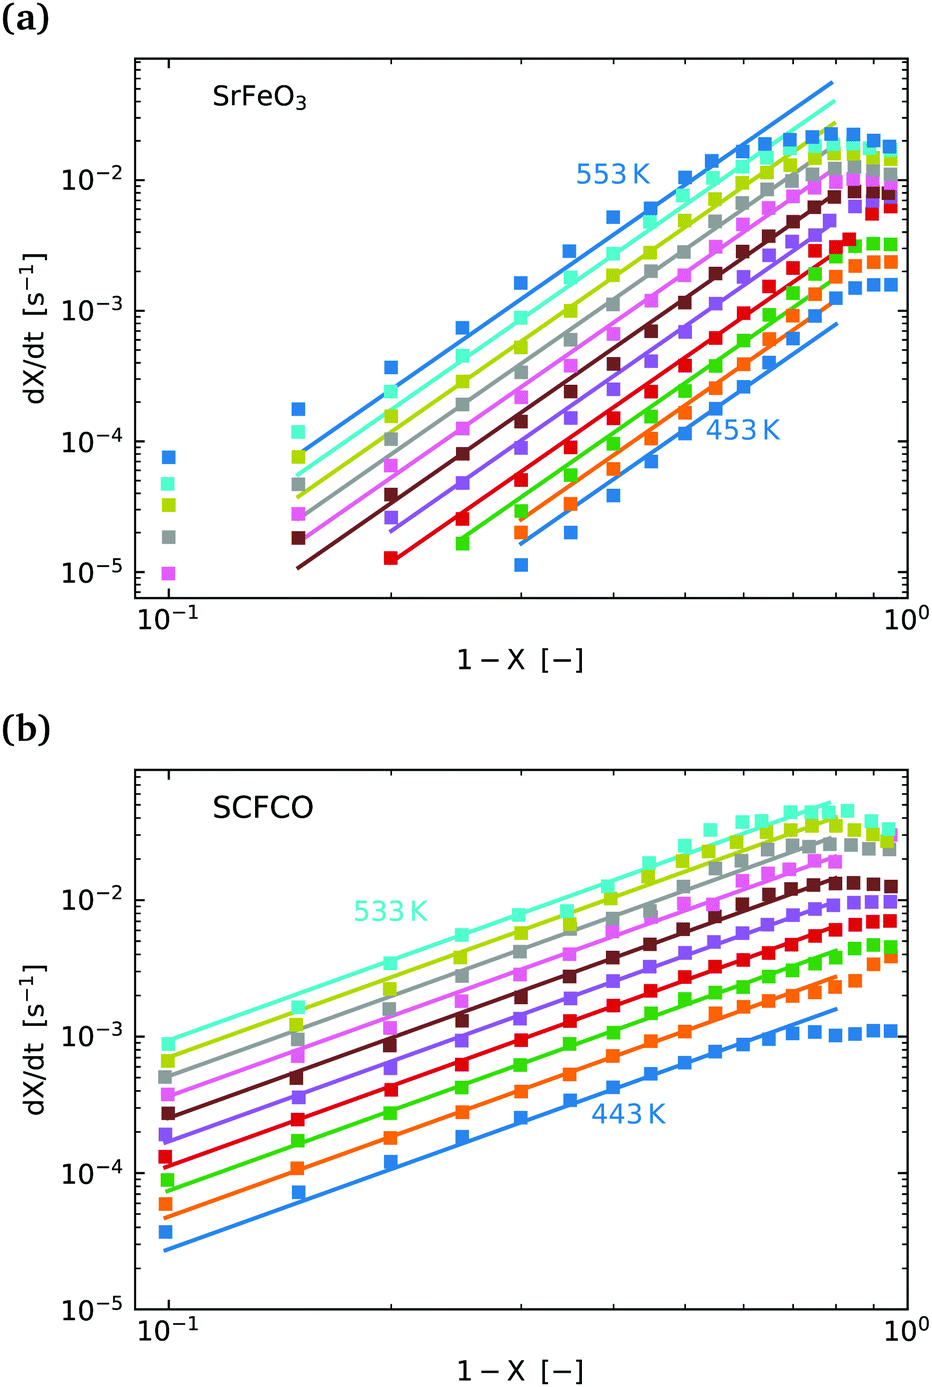 | ||
Fig. 5 (a)  vs. 1 − X with a log–log scale. The markers show the experimental data from Fig. 4. The lines show a fit of eqn (11) to the section which shows a linear dependence. (b) The same plot and model fit for data obtained for SCFCO. vs. 1 − X with a log–log scale. The markers show the experimental data from Fig. 4. The lines show a fit of eqn (11) to the section which shows a linear dependence. (b) The same plot and model fit for data obtained for SCFCO. | ||
After the entire data set is fit using the same mean slope for each temperature, the intercepts from Fig. 5, can be used to determine the activation energy Ea and the pre-exponential factor k0, according to eqn (12). This analysis is shown graphically in the ESI,† where an Arrhenius plot can be seen to yield a clear linear dependence.
This fitting procedure and the iso-conversional analysis was repeated for SCFCO and the SrFeO3 powder, with the fit parameters for all materials given in Table 2, and the experimental data and model shown in Fig. 5 for the pellet and SCFCO (see ESI,† for the full set of analysis plots). The SrFeO3 powder sample had very similar activation energies compared to the pellet, but with a larger standard deviation in activation energies determined via the isoconversional method, as can be seen by the large error (Table 2). Comparison of the k0 values for the SrFeO3 pellet and finer powder shows a factor of two increase for the finer powder, which could indicate diffusion control, where we might expect k0 ∝ (for a surface reaction k0 ∝ 2). However, given that both materials are actually different phases (see Table 1), this point should be treated with some caution.
| Sample | E a iso-X [kJ mol−1] | E a model [kJ mol−1] | m [—] | k 0 [s−1 (mol m−3)−n] |
|---|---|---|---|---|
| SFO pel. | 92 ± 17 | 95.3 | 3.94 ± 0.5 | 1.652 × 10⁷ |
| SFO pow. | 99 ± 28 | 97.9 | 3.98 ± 0.77 | 3.571 × 10⁷ |
| SCFCO | 79 ± 6.5 | 79.5 | 1.94 ± 0.11 | 6.293 × 10⁵ |
SCFCO on the other hand has a considerably lower activation energy compared to SrFeO3, which explains the faster kinetics. The 1 − X power law dependence m is also lower than that of SrFeO3, and the model can be seen to have a better fit of the experimental data, particularly for larger X.
Considering all of the oxidation kinetics results, we conclude that the kinetics may be diffusion controlled and that the SCFCO sample has a lower activation energy of diffusion. Indeed, Wang et al. also reported that the material Ba0.5Sr0.5Co0.4Fe0.6O3 has much improved oxygen transport properties compared to SrFeO3.17 This could be attributed in both cases to the addition of cobalt into the lattice, which can introduce more oxygen vacancies due to the fact that cobalt likely remains in the Co3+.22 However, it important to note that such simplified conclusion are rather speculative. In reality the oxygen transport in the lattice can have many dependencies, including the temperature, oxygen non-stoichiometry, electric conductivity, and lattice strain/distortions. It is therefore very difficult to draw specific physical conclusions from the apparent activation energies.
3.3 Reduction kinetics
The reduction kinetics were measured at isothermal conditions by switching the atmosphere from pure oxygen to a 1% oxygen in inert gas mixture, in the temperature range 573–723 K at intervals of 25 K. Below 573 K the kinetics were seen to be very slow and above 723 K the half life was approaching the same values where we saw a switch to mass transfer controlled kinetics for the oxidation. We also note her that for reduction kinetic analysis only the ground pellet and the SCFCO sample were analysed.To monitor the kinetics the mass change as a function of time was again used to calculate Δδ(t), using eqn (2). Some examples of the raw TGA data are given in the ESI,† (Fig. S8). We again use the extent of conversion X, given by eqn (3), where the value of Δδ∞ was taken to be the equilibrium values seen in Fig. 1(a). For temperatures outside the range a linear extrapolation of the data was used.
As a starting point we again look at the effect of temperature on the half life of the reactions t1/2, shown in Fig. 6. The first thing worth noting is that the reduction reaction is considerably slower than the oxidation reaction for a given temperature. At  (T = 603 K) the half life for the oxidation of the SrFeO3 pellet was around 15 seconds, whereas for the reduction reaction it was around 6000 seconds. This certainly indicates that the rate of the reduction reaction is not controlled by the same physical regime as that of the oxidation reaction. In-fact since diffusion plays the same role in both oxidation and reduction, it must be that the rate of the reduction reaction is controlled by the surface reaction kinetics. Otherwise we would expect similar or faster reaction times compared to the oxidation reaction.
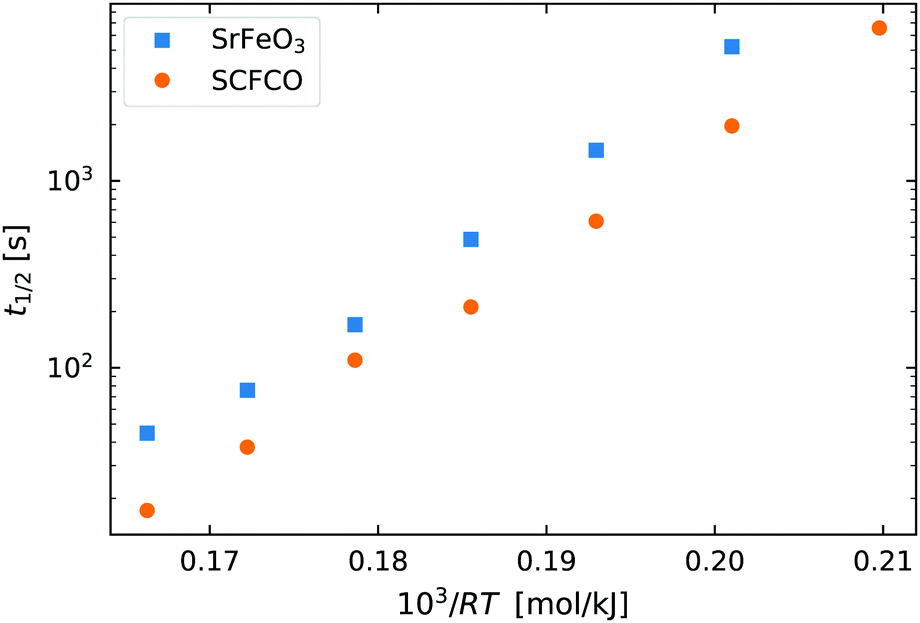 | ||
Fig. 6 The half life of the reduction reaction t1/2vs. , for the ground SrFeO3 pellet annealed at 1573 K, and the SCFCO powder. , for the ground SrFeO3 pellet annealed at 1573 K, and the SCFCO powder. | ||
Again the SCFCO sample shows faster reaction kinetics, but the difference is not as pronounced as the oxidation case. Here the SrFeO3 has a t1/2 which is typically double that of SCFCO, compared to a factor of four difference for oxidation.
 | (14) |
 | (15) |
Fig. 7(a) shows the conversion extent vs. time for the SrFeO3 sample. The data has a lot more noise than that measured for oxidation, which is due to the fact that the overall mass changes were much smaller. For reduction kinetics 220 mg of powder sample were placed in the TGA and the switching of partial pressures resulted in a total mass change of approximately 1.3 mg. In comparison, the oxidation of the 500 mg sample gave a total mass change of more than 10 mg, and a much better signal to noise ratio. The noise in the data means that the analysis has a larger uncertainty, as can be seen by the error in m in Table 3.
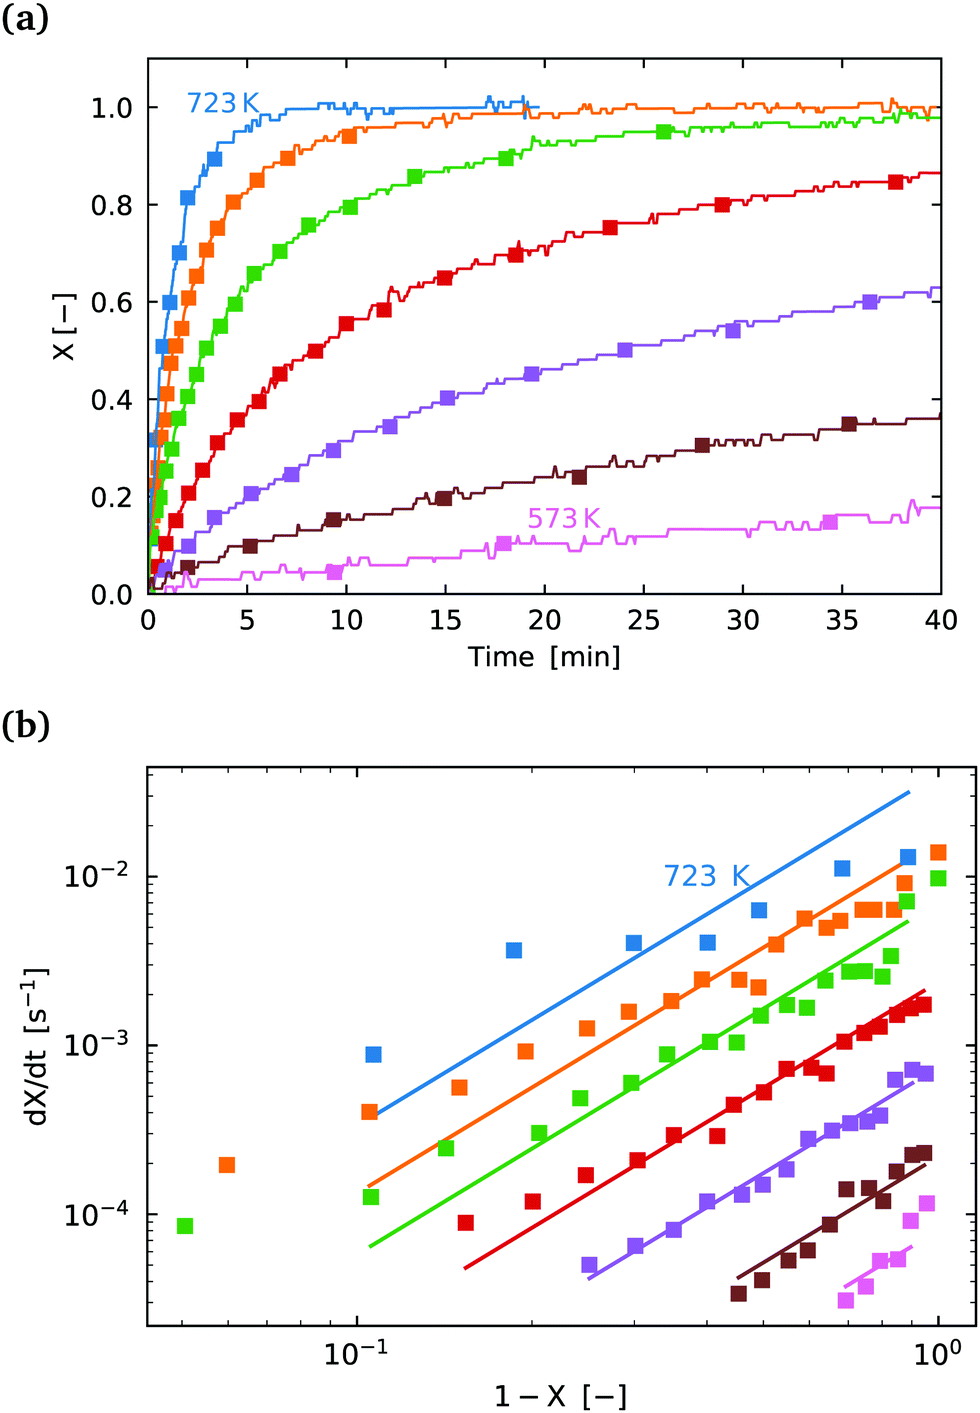 | ||
Fig. 7 (a) Conversion extent X vs. time for temperatures in the range 573–723 K in steps of 25 K for SrFeO3 reduction. (b)  vs. 1 − X with a log–log scale. The markers show the experimental data from (a) above. The lines show a fit of eqn (11) to the section which shows a linear dependence. vs. 1 − X with a log–log scale. The markers show the experimental data from (a) above. The lines show a fit of eqn (11) to the section which shows a linear dependence. | ||
| Sample | E a iso-X [kJ mol−1] | E a model [kJ mol−1] | m [—] | k 0 [s−1] |
|---|---|---|---|---|
| SFO pellet | 144 ± 16 | 145.5 | 2.1 ± 0.9 | 1.27 × 10⁹ |
| SCFCO | 142 ± 5 | 146.2 | 2.3 ± 0.8 | 3.45 × 10⁹ |
The isoconversional analysis and model fit of both samples show similar apparent activation energies, which are much larger than those seen for the oxidation reaction. This offers further evidence that the reaction control cannot be the same as is seen for the oxidation reaction. Fig. 7(b) shows the experimental data fit with the (1 − X)m model, with the fit parameters given in Table 3.
We conclude that the kinetic regime for the reduction reaction is different from the oxidation reaction, with a much larger energy barrier, and by process of elimination it must be surface reaction controlled. From a simplified energetic perspective, one might expect the activation energy of this reaction to at least be larger than the change in enthalpy for the reaction. From the literature the change in enthalpy per mole of atomic oxygen is in the range 70–90 [kJ mol−1].6 Indeed this is the case with values of activation energy close to 150 [kJ mol−1] measured here. Most of this change in enthalpy would also be attributed to the reaction at the surface, supporting the result that the reduction reaction is limited by the surface reaction.
4 Conclusions
The kinetic data collected in this work should be of high value for designing applications which make use of SrFeO3 as an oxygen exchange material. In particular the low temperature oxidation and reduction kinetics are very important for oxygen separation applications. The results show that the substitution of some cobalt in place of iron, while also adding calcium to maintain the cubic perovskite structure in Sr0.93Ca0.07Fe0.9Co0.1O3, greatly improved the oxidation kinetics. The presence of some secondary phases complicates the physical interpretation of this result, but this improvement in kinetics would allow cycling materials at lower temperatures. This can improve the energy balance and practicality of chemical looping oxygen separation processes. Analysis of the kinetic data indicated that the reduction reaction is limited by the surface reaction kinetics, and with a lower level of certainty the oxidation reaction was in the diffusion controlled regime.Conflicts of interest
There are no conflicts of interest to declare.Acknowledgements
We gratefully acknowledge the financial support of the Swiss National Science Foundation (Grant No. 200021-162435), the European Union's Horizon 2020 research infrastructure programme (Project SFERA-III – Grant Nr. 823802), the University of Zurich Research Priority Program for Solar Light to Chemical Energy Conversion (LightChEC), and the project DÜSOL (EFRE-0800603) which is co-funded in the Klimaschutzwettbewerb “ErneuerbareEnergien.NRW” by the state of Northrhine-Westphalia, Germany, and the European EFRE fund. We would also like to acknowledge Benjamin Gockeln for his assistance with TGA experiments.References
- C. Haavik, T. Atake and S. Stølen, Phys. Chem. Chem. Phys., 2002, 4, 1082–1087 RSC.
- A. Holt, T. Norby and R. Glenne, Ionics, 1999, 5, 434–443 CrossRef CAS.
- J. Yoo, C.-Y. Yoo, J.-H. Yu and A. J. Jacobson, J. Am. Ceram. Soc., 2017, 100, 2690–2699 CrossRef CAS.
- Y. Takeda, K. Kanno, T. Takada, O. Yamamoto, M. Takano, N. Nakayama and Y. Bando, J. Solid State Chem., 1986, 63, 237–249 CrossRef CAS.
- K. Krishnamurthy, D. Acharya and F. Fitch, Pilot-Scale Demonstration of a Novel, Low-Cost Oxygen Supply Process and its Integration with Oxy-Fuel Coal-Fired Boilers, Boc Group, Inc., the (a delaware corp) technical report, 2008.
- B. Bulfin, J. Lapp, S. Richter, D. Gubàn, J. Vieten, S. Brendelberger, M. Roeb and C. Sattler, Chem. Eng. Sci., 2019, 203, 68–75 CrossRef CAS.
- J. Vieten, B. Bulfin, F. Call, M. Lange, M. Schmücker, A. Francke, M. Roeb and C. Sattler, J. Mater. Chem. A, 2016, 4, 13652–13659 RSC.
- H. E. Bush, R. Datta and P. G. Loutzenhiser, Sol. Energy, 2019, 188, 775–786 CrossRef CAS.
- B. Bulfin, J. Vieten, C. Agrafiotis, M. Roeb and C. Sattler, J. Mater. Chem. A, 2017, 5, 18951–18966 RSC.
- Z. Yang, Y. Lin and Y. Zeng, Ind. Eng. Chem. Res., 2002, 41, 2775–2784 CrossRef CAS.
- H. Ikeda, S. Nikata, E. Hirakawa, A. Tsuchida and N. Miura, Chem. Eng. Sci., 2016, 147, 166–172 CrossRef CAS.
- Z. Yang and Y. Lin, Ind. Eng. Chem. Res., 2003, 42, 4376–4381 CrossRef CAS.
- M. Haänchen, A. Stiel, Z. Jovanovic and A. Steinfeld, Ind. Eng. Chem. Res., 2012, 51, 7013–7021 CrossRef.
- M. Ezbiri, K. M. Allen, M. E. Gàlvez, R. Michalsky and A. Steinfeld, ChemSusChem, 2015, 8, 1966–1971 CrossRef CAS PubMed.
- B. Moghtaderi, Energy Fuels, 2009, 24, 190–198 CrossRef.
- J. Vieten, B. Bulfin, D. E. Starr, A. Hariki, F. M. de Groot, A. Azarpira, C. Zachäus, M. Hävecker, K. Skorupska and N. Knoblauch, et al. , Energy Technology, 2019, 7, 131–139 CrossRef CAS.
- L. Wang, R. Merkle and J. Maier, ECS Trans., 2009, 25, 2497–2505 CAS.
- J. Yoo, A. Verma, S. Wang and A. J. Jacobson, J. Electrochem. Soc., 2005, 152, A497–A505 CrossRef CAS.
- J. Yoo and A. J. Jacobson, MRS Online Proc. Libr., 2002, 756, EE3.10 CrossRef.
- M. Rekas, T. Bak, J. Nowotny, C. Sorrell, Y. Zhao, K. Foger and E. Vance, J. Mater. Sci.: Mater. Electron., 2000, 11, 691–696 CrossRef CAS.
- S. Bychkov, I. Gainutdinov, S. Chizhik and A. Nemudry, Solid State Ionics, 2018, 320, 297–304 CrossRef CAS.
- J. Vieten, B. Bulfin, P. Huck, M. Horton, D. Guban, L. Zhu, Y. Lu, K. A. Persson, M. Roeb and C. Sattler, Energy Environ. Sci., 2019, 12, 1369–1384 RSC.
- J. Vieten, B. Bulfin, M. Roeb and C. Sattler, Solid State Ionics, 2018, 315, 92–97 CrossRef CAS.
- A. E. Danks, S. R. Hall and Z. Schnepp, Mater. Horiz., 2016, 3, 91–112 RSC.
- J. Rodrguez-Carvajal, Nouveaux développements de FullProf Analyse de la microstructure et utilisation du recuit simulé pour la résolution de structures, CEA/Saclay, France, 2001 Search PubMed.
- J. Blasco, J. Stankiewicz and J. Garca, J. Solid State Chem., 2006, 179, 898–908 CrossRef CAS.
- F. Deganello, L. Liotta, A. Longo, M. Casaletto and M. Scopelliti, J. Solid State Chem., 2006, 179, 3406–3419 CrossRef CAS.
- S. Dann, M. Weller and D. Currie, J. Solid State Chem., 1992, 97, 179–185 CrossRef CAS.
- F. Ramezanipour, J. E. Greedan, L. M. Cranswick, V. O. Garlea, J. Siewenie, G. King, A. Llobet and R. L. Donaberger, J. Mater. Chem., 2012, 22, 9522–9538 RSC.
- Y. Bréard, C. Michel, M. Hervieu, F. Studer, A. Maignan and B. Raveau, Chem. Mater., 2002, 14, 3128–3135 CrossRef.
- E. Bakken, S. Stølen, T. Norby, R. Glenne and M. Budd, Solid State Ionics, 2004, 167, 367–377 CrossRef CAS.
- C. Haavik, T. Atake, H. Kawaji and S. Stølen, Phys. Chem. Chem. Phys., 2001, 3, 3863–3870 RSC.
- B. Tofield, C. Greaves and B. Fender, Mater. Res. Bull., 1975, 10, 737–745 CrossRef CAS.
- M. Schmidt and S. Campbell, J. Solid State Chem., 2001, 156, 292–304 CrossRef CAS.
- P. Battle, T. Gibb and S. Nixon, J. Solid State Chem., 1989, 79, 75–85 CrossRef CAS.
- P. Fielitz and G. Borchardt, Phys. Chem. Chem. Phys., 2016, 18, 22031–22038 RSC.
- R. D. Souza, Phys. Chem. Chem. Phys., 2006, 8, 890–897 RSC.
- N. A. Merino, B. P. Barbero, P. Eloy and L. E. Cadús, Appl. Surf. Sci., 2006, 253, 1489–1493 CrossRef CAS.
- J. Crank, The Mathematics of Diffusion, Oxford University Press, Oxford, 1975 Search PubMed.
- S. Vyazovkin, A. K. Burnham, J. M. Criado, L. A. Pérez-Maqueda, C. Popescu and N. Sbirrazzuoli, Thermochim. Acta, 2011, 520, 1–19 CrossRef CAS.
- O. Levenspiel, Inc., New York, 1972.
- S. Kimura, S. Tone and T. Otake, J. Chem. Eng. Jpn., 1981, 14, 491–493 CrossRef CAS.
- S. kimura, Y. Takagi, S. Tone and T. Otake, J. Chem. Eng. Jpn., 1983, 16, 217–223 CrossRef CAS.
- S. Kimura, AIChE J., 1989, 35, 339–342 CrossRef CAS.
Footnote |
| † Electronic supplementary information (ESI) available. See DOI: 10.1039/c9cp05771d |
| This journal is © the Owner Societies 2020 |