
 Open Access Article
 This Open Access Article is licensed under a
 Creative Commons Attribution 3.0 Unported Licence
Core level spectroscopies locate hydrogen in the proton transfer pathway – identifying quasi-symmetrical hydrogen bonds in the solid state†
Joanna S.
Stevens
 *ab,
Sarah
Coultas
c,
Cherno
Jaye
d,
Daniel A.
Fischer
d and
Sven L. M.
Schroeder
*ef
*ab,
Sarah
Coultas
c,
Cherno
Jaye
d,
Daniel A.
Fischer
d and
Sven L. M.
Schroeder
*ef
aSchool of Chemical Engineering and Analytical Science, The University of Manchester, Oxford Road, Manchester, M13 9PL, UK
bThe Cambridge Crystallographic Data Centre, 12 Union Road, Cambridge, CB2 1EZ, UK. E-mail: jstevens@ccdc.cam.ac.uk
cKratos Analytical, Wharfside, Trafford Wharf Road, Manchester, M17 1GP, UK
dNational Institute of Standards and Technology, Gaithersburg, MD 20899, USA
eSchool of Chemical and Process Engineering, University of Leeds, Leeds, LS2 9JT, UK. E-mail: s.l.m.schroeder@leeds.ac.uk
fFuture CMAC Group, Research Complex at Harwell, Chilton, Didcot, OX11 0FA, UK
First published on 18th February 2020
Abstract
Short, strong hydrogen bonds (SSHBs) have been a source of interest and considerable speculation over recent years, culminating with those where hydrogen resides around the midpoint between the donor and acceptor atoms, leading to quasi-covalent nature. We demonstrate that X-ray photoelectron spectroscopy (XPS) and near-edge X-ray absorption fine structure (NEXAFS) spectroscopy provide deep insight into the electronic structure of the short OHN hydrogen bond of 3,5-pyridinedicarboxylic acid, revealing for the first time distinctive spectroscopic identifiers for these quasi-symmetrical hydrogen bonds. An intermediate nitrogen (core level) chemical shift occurs for the almost centrally located hydrogen compared to protonated (ionic) and non-ionic analogues, and it reveals the absence of two-site disorder. This type of bonding is also evident through broadening of the nitrogen 1s photoemission and 1s → 1π* peaks in XPS and NEXAFS, respectively, arising from the femtosecond lifetimes of hydrogen in the potential wells slightly offset to either side of the centre. The line-shape of the core level excitations are thus related to the population occupancies, reflecting the temperature-dependent shape of the hydrogen potential energy well. Both XPS and NEXAFS provide a distinctive identifier for these quasi-symmetrical hydrogen bonds, paving the way for detailed studies into their prevalence and potentially unique physical and chemical properties.
Introduction
The ability and flexibility of hydrogen in non-covalent electrostatic interactions is without comparison: hydrogen bonds (X–H⋯Y)1 are fundamentally important molecular interactions that influence structure and reactivity in many chemical and biological systems,2 a key example being base pair formation between nucleotides in DNA, while proton transfer from the donor to acceptor atoms (−X⋯H–Y+) leads to an ionic system. Such hydrogen bonding and proton transfer are the two most commonly observed scenarios for an interaction involving hydrogen. They can be rationalised in terms of a double well potential along the axis between the constituent hydrogen donor and acceptor groups (Fig. 1). In a hydrogen bond, hydrogen remains located in the deeper donor potential well, while proton transfer is associated with its location in the acceptor potential (Fig. 1). In either case, the energetic barrier to the other potential well is high. Two-site disorder can occur when both potential wells are sufficiently deep to enable localisation but the barrier between the two wells is low enough to allow partial occupancies of hydrogen at both donor and acceptor sites (Fig. 1). Perhaps most interesting is the potential for hydrogen to populate different points along the donor–acceptor axis in low-barrier systems, creating a continuum of states between hydrogen bonded (X–H⋯Y) and complete proton transfer (−X⋯H–Y+). This typically arises when the donor–acceptor distance becomes particularly short (ca. 2.5 Å) with close matching of pKa values of the participating functional groups. Then the atomic potentials of donor and acceptor strongly overlap, leading to lowering of the potential barrier (Fig. 1) and the formation of ‘so-called’ short, strong hydrogen bonds (SSHBs). The interaction with acceptor atom Y can become so strong that the donor bond X–H becomes abnormally elongated and the bond to the acceptor H⋯Y is short enough to afford a significant level of covalency.3–6 In some cases the potential barrier becomes so low that hydrogen resides in what is essentially a single potential well between the donor and the acceptor atoms3,7–9 – i.e. quasi-central location of hydrogen between donor and acceptor (X⋯H⋯Y, Fig. 1)7,10–13 in 3-centre, 4-electron, quasi-covalent bonds,3,14–17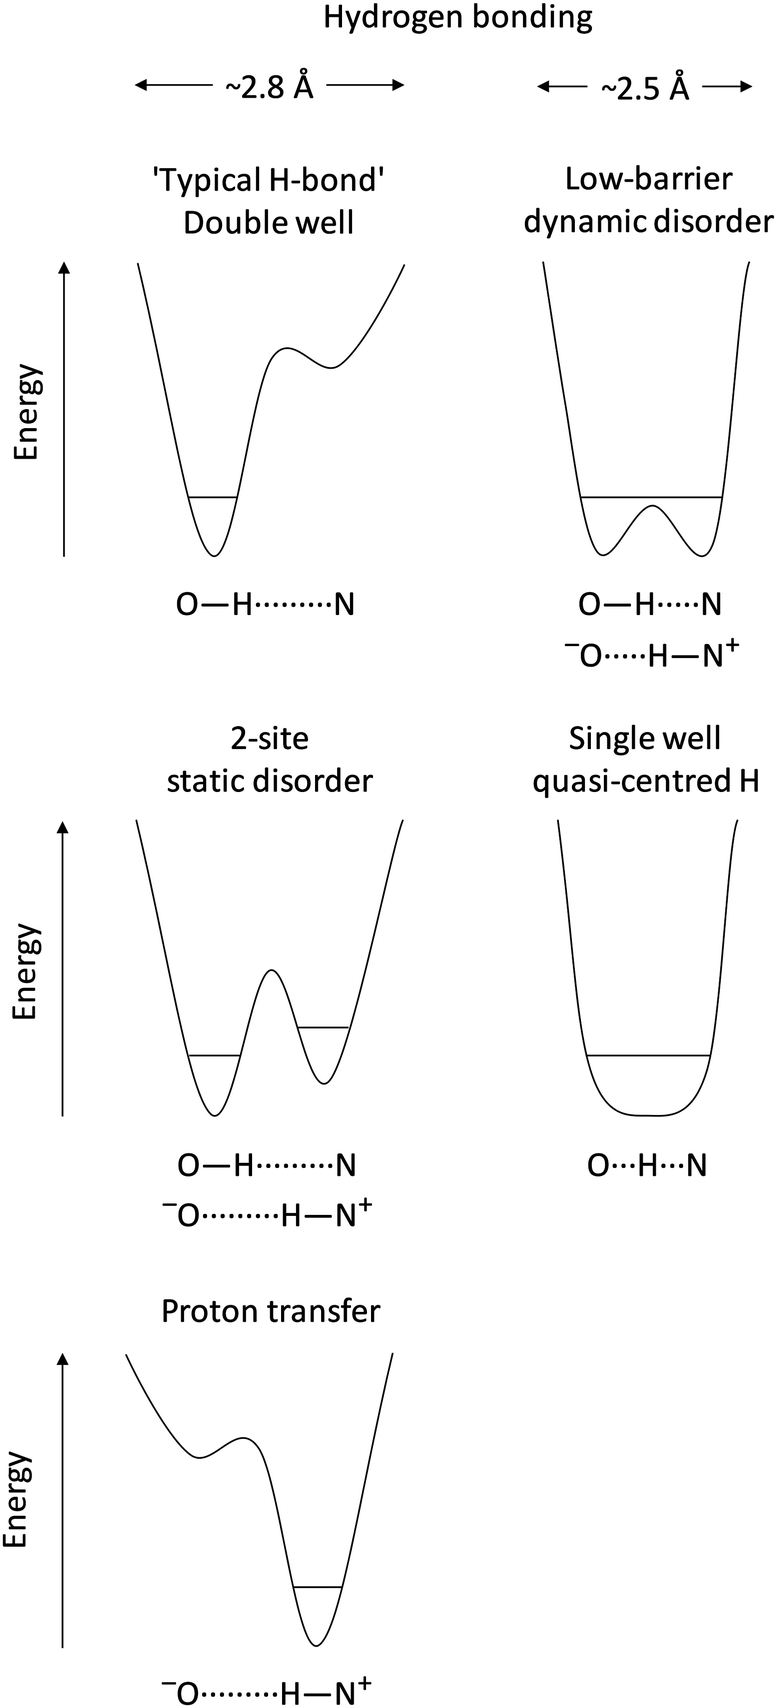 | ||
| Fig. 1 Schematic of hydrogen potential energy wells for the range of hydrogen bonding interactions and Brønsted proton transfer between an oxygen donor and nitrogen acceptor. | ||
Significant variations in physicochemical properties can result with full proton transfer such as solubility, bioavailability and colour.18–21 These are of interest in practical applications, as they allow tuneability to product requirements. Very importantly, identification of the extent of proton transfer underpins the regulatory definitions of pharmaceutical salts and co-crystals.19,22 Specific behaviour has also been associated with the intermediate scenarios, such as stabilisation of photoactive proteins23 and transition states in enzymatic reactions with low-barrier hydrogen bonds,15,24,25 and stabilisation of hydrogen around the midpoint in the solid state for single wells through femtosecond low-frequency lattice vibrations.7,10–12
Despite the potential ramifications for alteration of physicochemical properties and the regulatory requirements, there is no single, unequivocal experimental basis for identifying a low barrier or single well hydrogen bond and quasi-centred hydrogen. Experimentally accessible indicators include the short donor–acceptor distance via X-ray diffraction, closely matched pKa values, 1H NMR chemical shifts to high frequency, low isotope fractionation factors, and unusual primary isotope shifts,3,15,26 although these exhibit a spectrum of values that overlaps with those of ordinary hydrogen bonds.26 Neutron diffraction can accurately locate hydrogen positions, including situations where when hydrogen is quasi-centred, but it still requires particular care and expertise in recognising and examining electron density maps/displacement ellipsoids, while not auto-refining the hydrogen onto the donor or acceptor. Additionally, crystallography and NMR spectroscopy provide a time-average of the dynamic hydrogen population and are not suited to provide information about any proton migration dynamics within these bonds.
We have previously shown that the core level spectroscopies, X-ray photoelectron spectroscopy (XPS) and near-edge X-ray absorption fine-structure (NEXAFS) spectroscopy distinguish incisively between hydrogen bonding and Brønsted proton transfer in organic systems,27–36 with their strong sensitivity to the local environment and bonding around the probed atoms. The movement of a proton between donor and acceptor leads to a strong chemical shift in the core level photoemission from the acceptor moiety – the XPS chemical shift of the acceptor depends strongly on the distance of the proton (hydrogen).34 Localised, 2-site disorder is also easily recognisable from the presence two distinct photoemission signals, with the population occupancies reflected by the area under the peaks. With knowledge of core level binding energy shifts from XPS, deeper insight into local bonding can be obtained by probing unoccupied molecular orbitals energies with NEXAFS spectroscopy, including the influence of hydrogen bonding;21,34,37–41 moreover, the ultrafast timescale of these spectroscopic techniques42–44 makes them ideal for probing dynamic processes. XPS and NEXAFS are therefore ideally placed to also probe short hydrogen bonding, providing information not only on the location of hydrogen along the proton transfer axis, but also the presence (or absence) of any population occupancies or dynamic processes.
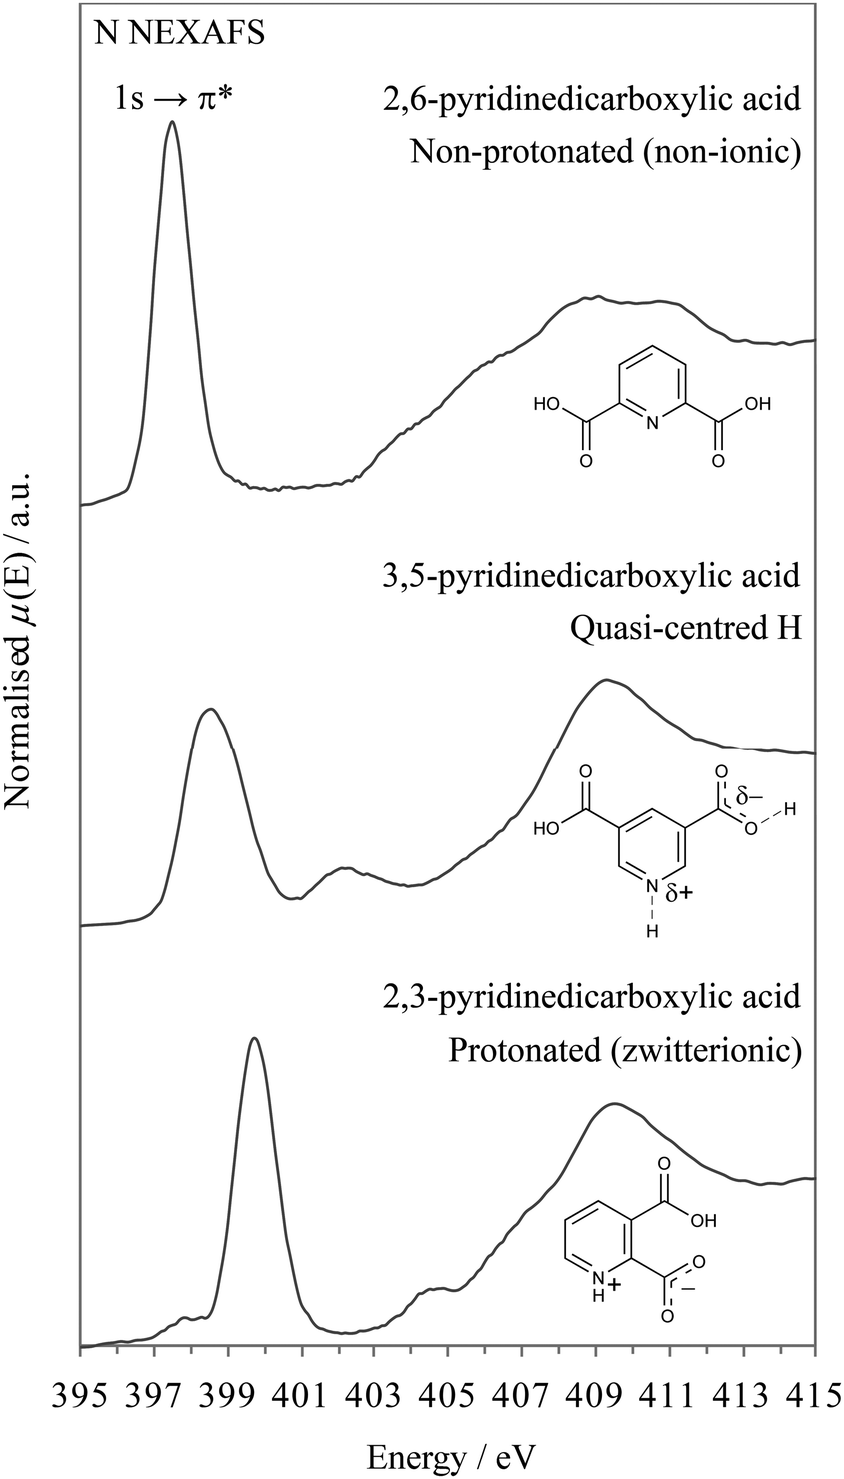
In the following, we will describe how XPS and NEXAFS involving the 1s core level of nitrogen acceptors in pyridine-dicarboxylic acid (PDCA) systems (Fig. 2) reliably characterises the varying positions in the proton transfer pathway. Using crystalline 3,5-PDCA as our model system, we show for the first time that core level spectroscopies unequivocally detect a single-well, quasi-centred hydrogen bond. This will be contrasted with results for hydrogen residing on the donor atom in 2,6-PDCA and proton transfer to the acceptor atom in 2,3-PDCA (Fig. 2).
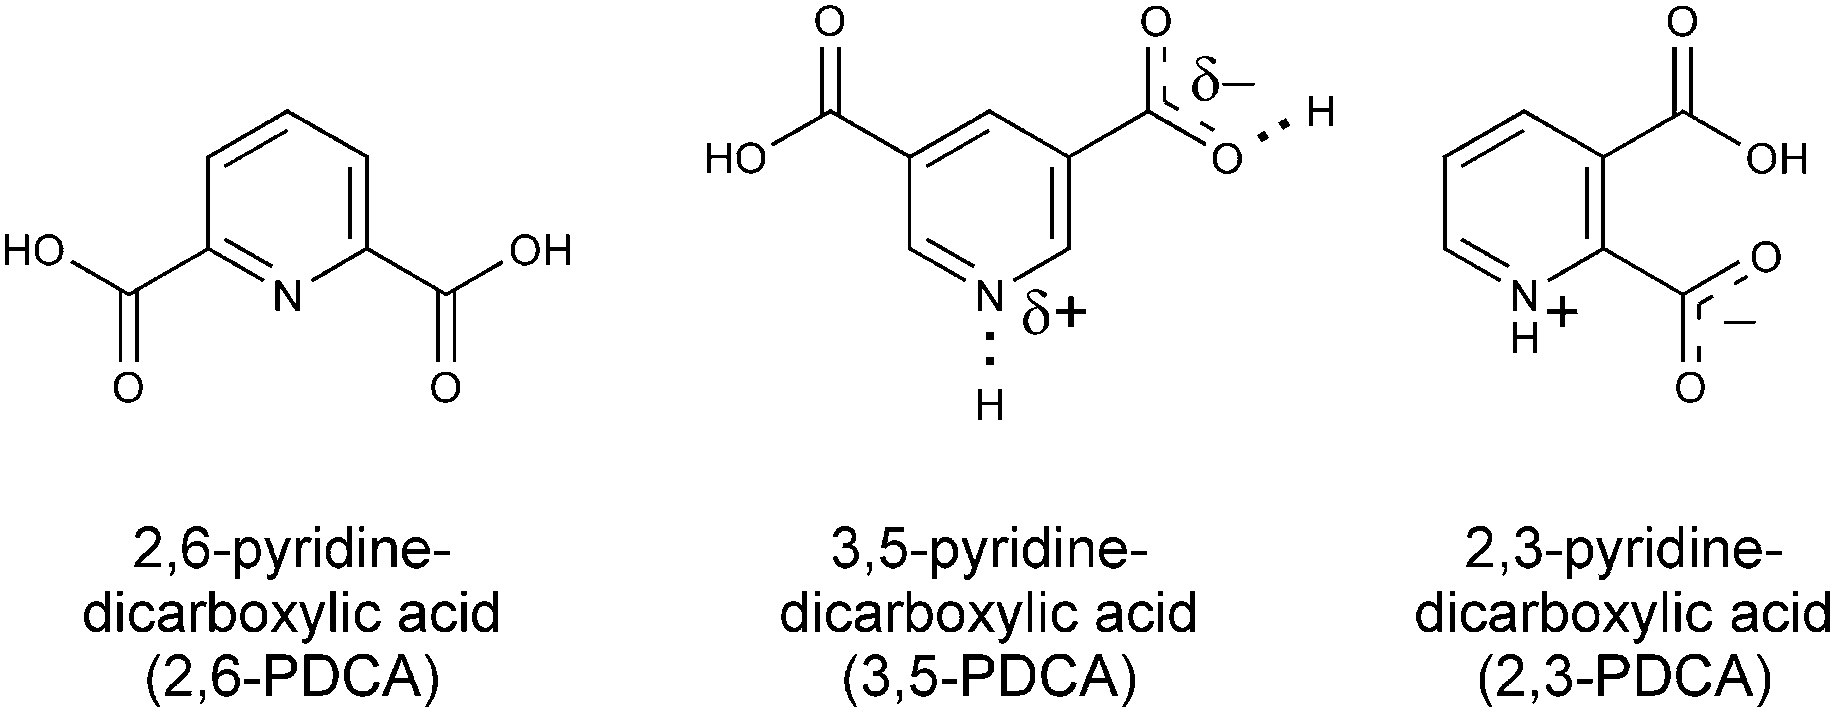 | ||
| Fig. 2 Chemical structures of 3,5-PDCA, with its quasi-centred hydrogen bond, and its non-ionic (2,6-PDCA) and ionic protonated (2,3-PDCA) analogues. | ||
3,5-PDCA has a short intermolecular donor–acceptor distance (2.52 Å, Table 1), with hydrogen residing around the centre.10 This system provides an ideal case study for XPS/NEXAFS because it involves a single nitrogen acceptor and an oxygen donor, providing a simple emission spectrum from both moieties that does not overlap with emission lines from other species. The strength of the interaction with the nitrogen acceptor group, and hence the chemical shift of the nitrogen 1s core level emission line, is expected to be intermediate between those of a protonated nitrogen acceptor and a nitrogen acceptor in an ordinary hydrogen bond, in which the hydrogen remains located close to the donor group. Temperature-dependent measurements also permit investigation of stabilisation of the hydrogen position around the centre of the donor–acceptor bridge10–12 through ultrafast dynamic, slight lattice vibrations.7
| d(NH)/Å | d(OH)/Å | d(NO)/Å | d(NH)–d(OH) | d(NH)/d(NO) | |
|---|---|---|---|---|---|
| a List of crystal structures and CSD refcodes in the ESI. Diffraction data collection at 283–303 K with a neutron source, apart from 2,6-PDCA with XRD. A hydrogen bonded carboxylic acid dimer is formed for 2,6-PDCA, rather than an OHN intermolecular hydrogen bond, so the NH and NO values for 2,6-PDCA are the closest intermolecular distances for the atoms. | |||||
| 2,6-pya | 4.575 | 0.774 | 5.335 | 3.08 | 0.858 |
| 3,5-py | 1.308 | 1.218 | 2.525 | 0.090 | 0.518 |
| 2,3-py | 1.036 | 1.845 | 2.725 | −0.809 | 0.380 |
Experimental
Starting materials
2,3-Pyridinedicarboxylic acid and 2,6-pyridinedicarboxylic acid were obtained with >99% purity, and 3,5-pyridinedicarboxylic acid with >98% purity (Sigma-Aldrich, UK). Polycrystalline (powder) samples ∼1 mg were used for XPS and NEXAFS measurements.X-ray photoelectron spectroscopy (XPS)
XP spectra of 2,3-, 3,5-, and 2,6-pyridinedicarboxylic acids (PDCA) were recorded with a Kratos Axis Ultra instrument employing a monochromatic Al Kα source (1486.69 eV)31,47 at room temperature. High resolution spectra were measured within the spectral range of interest (ca. ±20 eV around core level emission peaks) with a 20 eV pass energy, 0.1 eV steps, and 1000 ms dwell time per data point. Temperature-dependent measurements for 3,5-pyridinedicarboxylic acid were recorded at Kratos Analytical (Manchester, UK) with a Kratos Axis Ultra instrument employing temperature controlled sample holders (Exotherm control program). The temperature was recorded via a thermocouple at the fork just before the stub and sample, and in situ measurements were recorded at 30 °C (303.15 K), −150 °C (123.15 K), and 305 °C (578.15 K) using liquid N2 to cool the sample. High resolution spectra were measured within the spectral range of interest (ca. ±20 eV around core level emission peaks) with a 40 eV pass energy, 0.1 eV steps, 298.5 ms dwell time per data point, and 2 sweeps. Analysis of the data was carried out with Casa XPS software48 using a linear background and GL(30) line shape except for an asymmetric A(0.2,0.6,0)GL(50) Voigt-like function for 3,5-PDCA.48 Samples were referenced following the procedure outlined previously,29,31,32 to the lowest EB photoemission C![[double bond, length as m-dash]](https://www.rsc.org/images/entities/char_e001.gif) C at 284.8 eV. Repeated measurements showed no evidence for radiation damage. Repeatability of the peak positions was within 0.1 eV.
C at 284.8 eV. Repeated measurements showed no evidence for radiation damage. Repeatability of the peak positions was within 0.1 eV.
Near edge X-ray absorption fine structure (NEXAFS)
NEXAFS measurements were performed at the U7a beamline of the National Synchrotron Light Source (NSLS) at Brookhaven National Laboratory, NY. Partial electron yield (PEY) spectra for the nitrogen K-edge were collected at RT via a channeltron electron multiplier with the samples at the magic angle (54.7°) relative to the incident beam. An entrance grid bias of −150 V was used for PEY collection and a monochromator with a 600 l mm−1 grating, providing energy resolution of ∼0.15 eV. In situ temperature-dependent measurements were recorded at 301 K (25.85 °C) and 131 K (−142.15 °C) using liquid N2 to cool the sample. After collection, the spectra were normalized by the simultaneously collected drain current from an in situ gold-coated, 90% transmission grid (I0) placed in the incident X-ray beam to eliminate the effect of incident beam intensity fluctuations and beamline optics absorption features. The monochromator energy scale was calibrated using the 400.6 eV 1st π* transition of a titanium nitride grid located in the path of the incident X-ray beam. Repeated measurements showed no evidence for radiation damage. Repeatability of the peak positions was within 0.1 eV.Results and discussion
We will first look at the XPS photoemission from the extremes of the proton transfer pathway, with hydrogen located on the oxygen donor for 2,6-PDCA and with proton transfer to the nitrogen acceptor for 2,3-PDCA. The crystal structure of 2,6-PDCA is formed from neutral, non-ionic molecules (Fig. 3).45 A characteristic nitrogen 1s XPS photoemission peak at 399.10 eV arises from the aromatic nitrogen in the pyridine ring for 2,6-PDCA (Fig. 4), as hydrogen remains on the donor OH. In the following, this unprotonated aromatic nitrogen will be referred to simply as CN. In contrast, the pyridine nitrogen is protonated in the zwitterionic 2,3-PDCA crystal structure (Fig. 3),46 and the nitrogen 1s photoemission from the CNH+ group bears this out through a strong chemical shift of +2.2 eV to a binding energy of 401.30 eV (Fig. 4) with proton transfer from the OH to the nitrogen acceptor.27–36
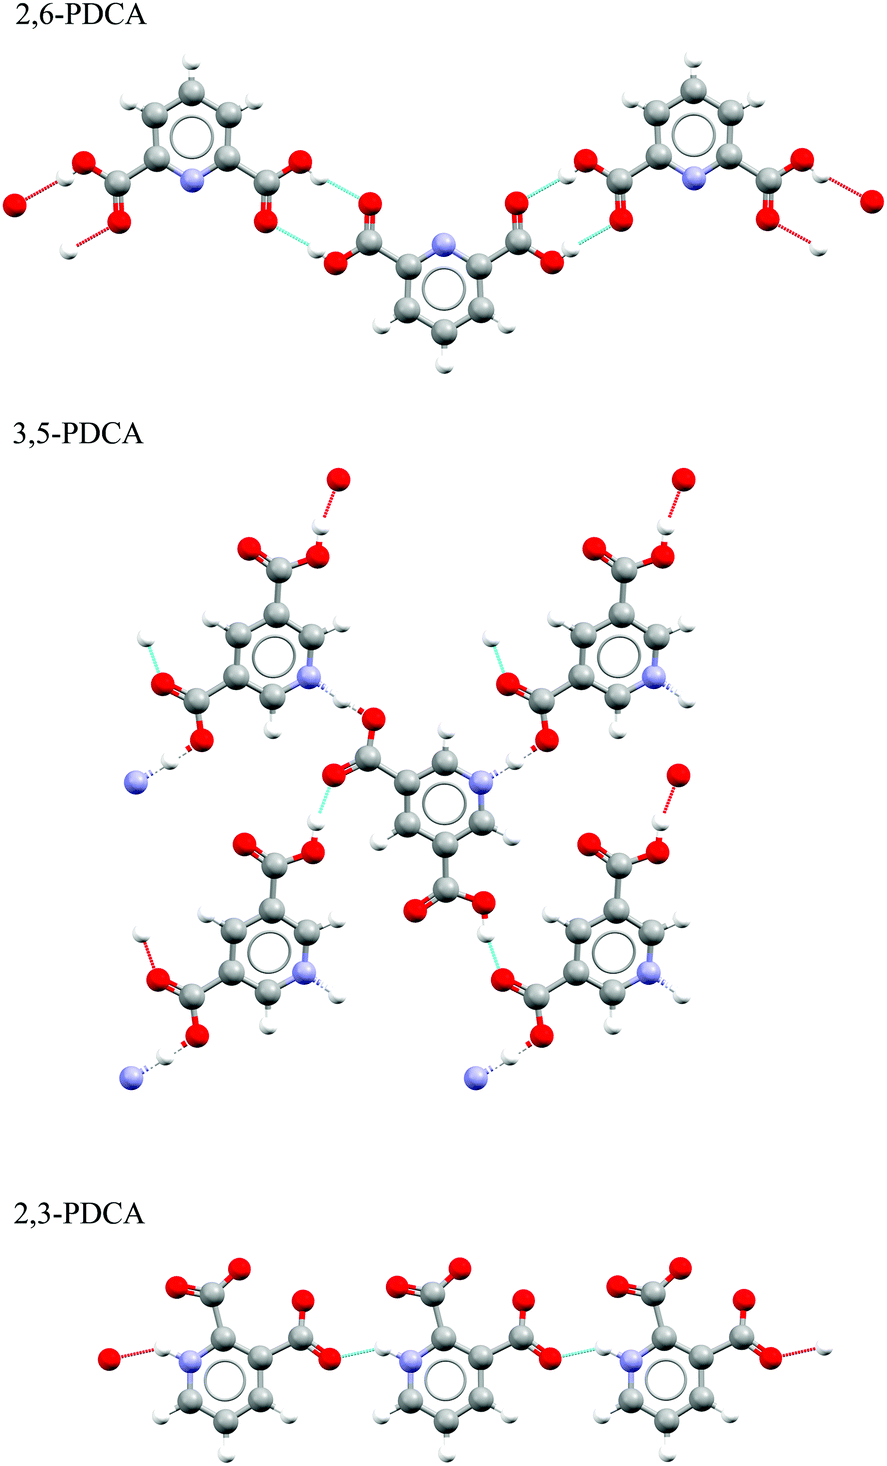 | ||
| Fig. 3 Hydrogen bonding present in the crystal structures of 3,5-, 2,6-, and 2,3-PDCA,10,45,46 showing no proton transfer for 2,6-PDCA, intermediate hydrogen location between nitrogen and oxygen for 3,5-PDCA, and full proton transfer for 2,3-PDCA. | ||
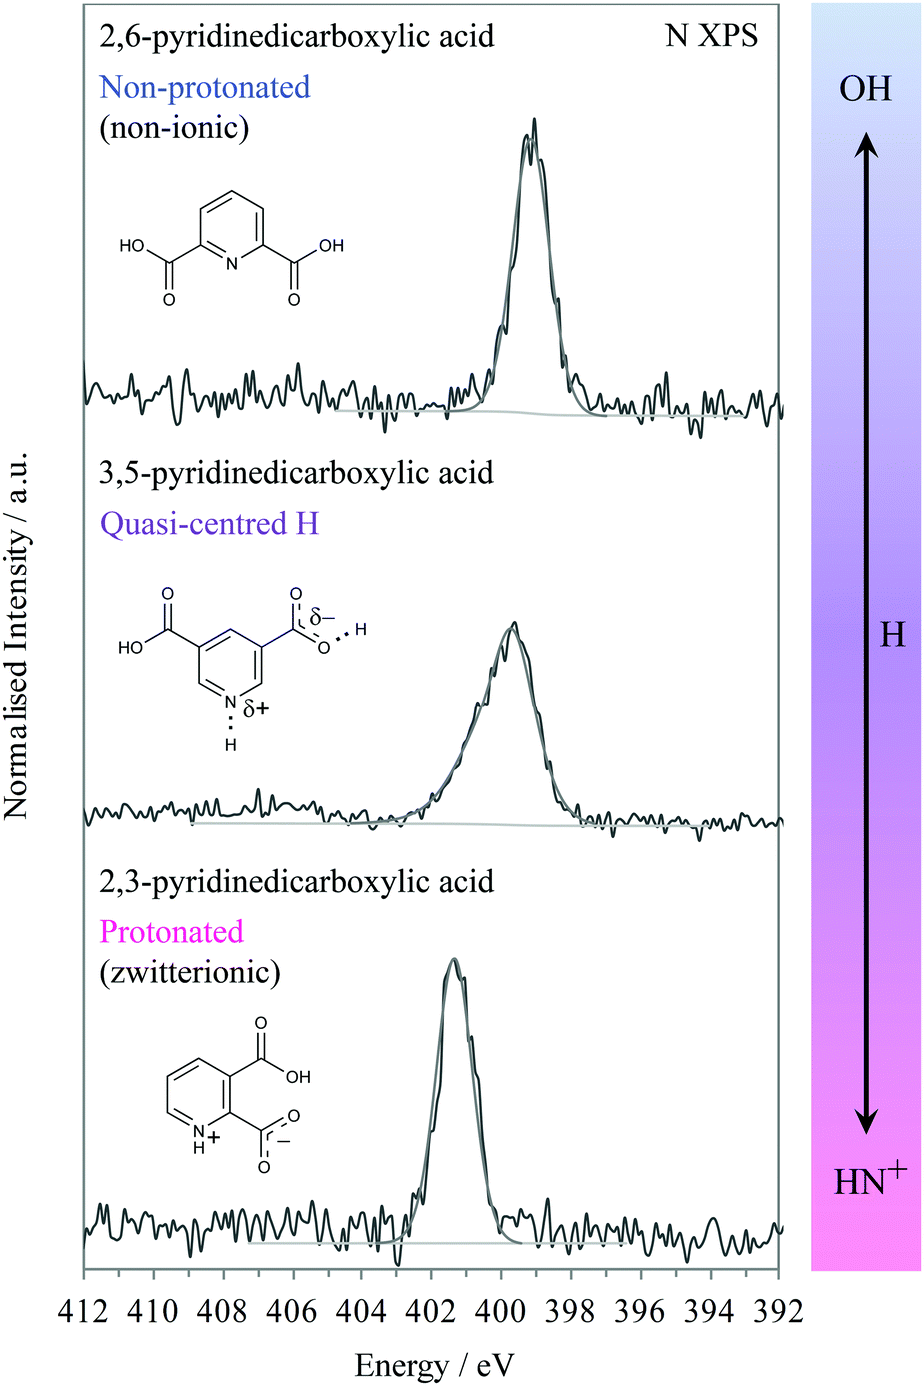 | ||
| Fig. 4 Nitrogen 1s XPS of 3,5-, 2,6-, and 2,3-PDCA showing the characteristic intermediate chemical shift and broadening for the presence of a quasi-centred hydrogen bond O⋯H⋯N compared to the non-protonated (non-ionic) and protonated analogues. | ||
In 3,5-PDCA, the hydrogen is residing almost equidistant from both the donor oxygen and acceptor nitrogen atoms (i.e. the OH and NH distances are similar), in an extremely short intermolecular OHN hydrogen bond (Table 1 and Fig. 3).10 The nitrogen 1s XP spectrum reflects this through a slightly asymmetric signal centred at a binding energy of approximately 400.15 eV, with the asymmetric peak maximum offset by 0.4 eV to lower energy. This binding energy is intermediate to that of the unprotonated (no proton transfer) and the protonated nitrogen (proton transfer) in the two reference systems (Fig. 4), with a far greater chemical shift for 3,5-PDCA than observed for formation of ordinary hydrogen bonds (ca. ≤+0.2 eV for the acceptor atom),33,49–51 but much less than observed for protonation of nitrogen acceptors (ca. +2 eV, Fig. 4).27–35 Comparison of the donor-hydrogen (OH) and acceptor-hydrogen (NH) distances involved in the intermolecular interaction in 3,5-PDCA from neutron diffraction (Table 1) shows hydrogen is located almost centrically between the (original) donor oxygen and acceptor nitrogen atoms,10 with a slight offset towards oxygen at RT, mirroring the chemical shifts from XPS.
Notably, there is significant broadening and reduced intensity (Fig. 4) of the nitrogen 1s signal relative to the non-protonated and protonated forms, with a 2 eV full-width half-maximum (FWHM) while the reference systems have narrow emission lines with a FWHM of 1.2 eV. We note here that all other emission lines from 3,5-pyridinedicarboxylic acid are not broadened, thus ruling out surface charging, roughness or particle size variations as causes for the observed broadening of the nitrogen 1s emission line. Moreover, we will also see further below that similar broadening occurs in the N K-edge NEXAFS.
The broadening thus indicates nitrogen is experiencing more than one type of chemical environment in 3,5-PDCA. The crystal structure does not indicate inequivalent nitrogen atoms – there is only one molecule, and thus one nitrogen atom, in the asymmetric unit.10 More specifically, there was no indication of hydrogen disorder over two distinct positions (CN, COOH and CNH+, COO−) in the X-ray and neutron diffraction analysis.10
If the 3,5-PDCA system exhibited hydrogen disorder across two distinct sites, a non-protonated CN and a protonated CNH+, then the XP spectra would resemble that of 2,6- and 2,3-PDCA superimposed on one another, i.e. a double peak spectrum with maxima at about 399.1 and 401.3 eV, with the relative area intensities providing the hydrogen occupancies on the two sites. For example, a 30![[thin space (1/6-em)]](https://www.rsc.org/images/entities/char_2009.gif) :70 distribution of H across the N and O sites would be reflected by two well-resolved peaks comprised of a 30% signal at the binding energy for CNH+ and a 70% signal for CN (Fig. 5). Such a spectrum is clearly not observed in Fig. 4 for 3,5-PDCA.
:70 distribution of H across the N and O sites would be reflected by two well-resolved peaks comprised of a 30% signal at the binding energy for CNH+ and a 70% signal for CN (Fig. 5). Such a spectrum is clearly not observed in Fig. 4 for 3,5-PDCA.
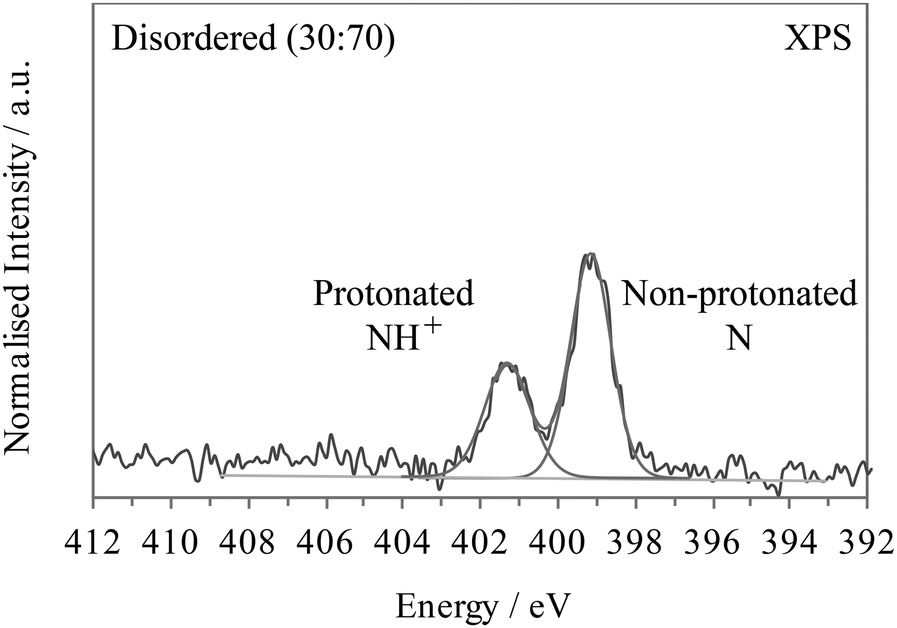 | ||
| Fig. 5 Interpolated nitrogen 1s XPS of 2,6- and 2,3-PDCA, illustrating the expected effect of a 30:70 disordered hydrogen population over the nitrogen and oxygen sites (i.e. two-site disorder), with 30% protonated CNH+ and 70% non-protonated CN. | ||
The absence of 2-site disorder leaves a dynamic process as an explanation for the observed broadening of the nitrogen 1s photoemission line, for which XPS is ideally placed to probe, with the ultrafast nature of the photoemission process (sub-fs).42–44 Indeed, a previous molecular dynamics (MD) study7 investigated the location of hydrogen in the short hydrogen bond between oxygen and nitrogen in 3,5-PDCA. It indicated small magnitude dynamic migration of the hydrogen around the midpoint between the donor and the acceptor (Table 2), but never localised on one side.10 The MD simulations predicted a symmetrical, broadened single minimum potential energy well for hydrogen (Fig. 1) at the temperature for which its distance to the acceptor and donor atoms becomes equivalent. Asymmetric distributions were then predicted for higher and lower temperatures with a slightly offset hydrogen position.7 The broadened minimum allows the proton wavefunction to extend, facilitating slight movements to either side of the midpoint,7 even at room temperature. This sharing of the hydrogen electron density between nitrogen and oxygen is opposed to its localisation in the deeper potential well of an ordinary hydrogen bond (Fig. 1).2,3
| d(NH)/Å | d(OH)/Å | d(NO)/Å | d(NH)–d(OH) | d(NH)/d(NO) | |
|---|---|---|---|---|---|
| 15 K | 1.213 | 1.311 | 2.523 | −0.098 | 0.481 |
| 296 K | 1.308 | 1.218 | 2.525 | 0.090 | 0.518 |
The MD simulations7 indicated rapid movement of the hydrogen by up to ca. 0.1 Å between nitrogen and oxygen on the order of 100 fs (10−13 s), with the quasi-central position stabilised through low frequency lattice vibrations (and not excited N–H vibrational precluding conventional vibrational broadening visible in XPS for simple hydrocarbons52,53). This is significantly faster than typical proton hopping/exchange easily resolvable with XPS, such as with imidazole (around 10−10 s),43,44 although still considerably slower than the photoemission timescale (∼10−16 s).42–44 When there are significant chemical shifts associated with the location of hydrogen in a dynamic population, the lineshape of XPS can therefore provide a snapshot of the hydrogen distribution across the accessible positions in the potential well. We therefore conclude that the asymmetric broadening towards high binding energy in the room temperature nitrogen 1s emission line for 3,5-PDCA (Fig. 4) reflects a situation in which more hydrogens are, on average, localised marginally closer to the oxygen atom, but still with a significant population located marginally closer to nitrogen – i.e. reflecting an asymmetric single minimum potential energy well.
A previous temperature-dependent neutron diffraction study10 indicated the likely dynamic nature of this system, with observation of very slight hydrogen movement towards the nitrogen acceptor at lower temperatures (Table 2). The authors could not rule out the temperature-dependent changes being related to some experimental error, but concluded there was no evidence of two-site disorder based on examination of H-atom displacement ellipsoids, and suggested a single potential well rather than a low barrier double well based on similar behaviour with deuterium (correlating with the MD simulation results7). We examined the temperature-dependence of the nitrogen 1s photoemission line of 3,5-PDCA. The results shown in Fig. 6 show an increasing intensity of the high binding energy side of the emission line with decreasing temperature, which is associated with the movement of hydrogen slightly towards the nitrogen acceptor. Compared to the nitrogen 1s XPS peak seen at RT (303.15 K, 30 °C; grey, Fig. 6), that at low temperature (123.15 K, −150 °C) is approaching symmetrical (black, Fig. 7), indicating that hydrogen prefers to reside almost equidistant from the oxygen donor and nitrogen acceptor at this temperature – i.e. approaching a symmetrical single minimum potential energy well with decreasing temperature. In contrast, heating the sample up to 578.15 K (305 °C), results in a more asymmetric peak than at RT (Fig. 6) confirming that higher temperature favours the localisation of hydrogen slightly closer to the oxygen donor.
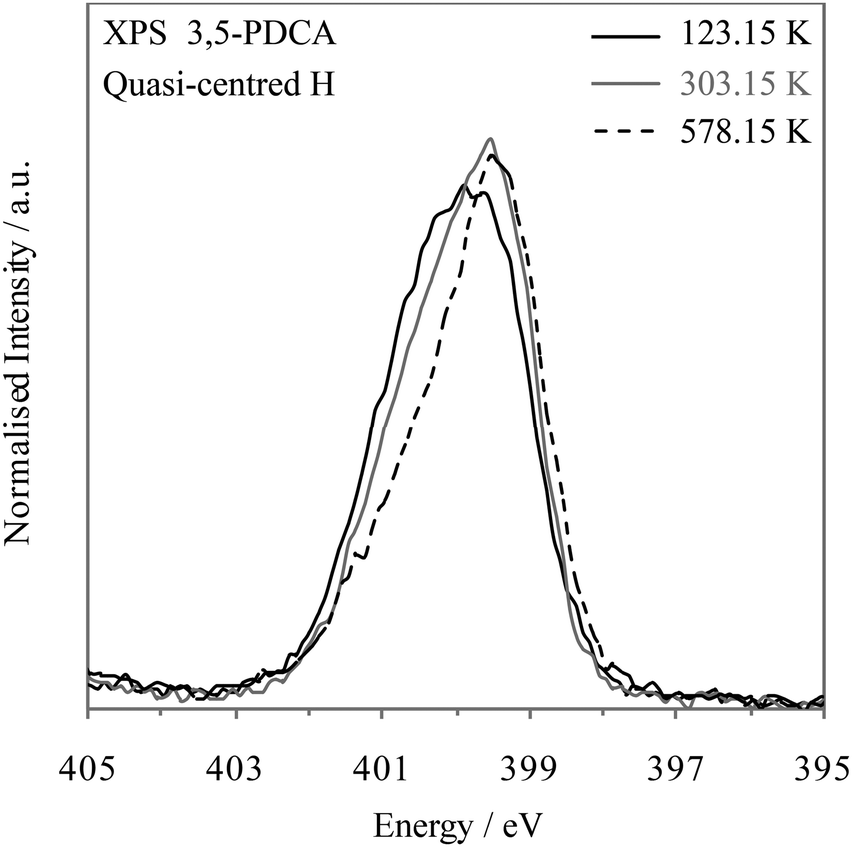 | ||
| Fig. 6 Nitrogen 1s XPS spectra of 3,5-PDCA with temperature: 123.15 K (−150 °C, black), 303.15 K (30 °C, grey), and 578.15 K (305 °C, black dashed). | ||
 | ||
| Fig. 7 Nitrogen K-edge NEXAFS spectra of 3,5-, 2,6-, and 2,3-PDCA, showing the characteristic intermediate π* resonance and broadening for a quasi-centred hydrogen bond compared to the non-protonated and protonated analogues. | ||
Turning to the nitrogen K-edge NEXAFS (Fig. 7) of the three systems, we observe in all spectra a sharp pre-edge resonance that arises from transitions from the nitrogen 1s core level to unoccupied valence orbitals with p character (N 1s → π*). In line with the XPS results, a slightly asymmetric, broadened nitrogen 1s → 1π* resonance occurs for the pyridine CN nitrogen environment of 3,5-PDCA, which is again at an intermediate energy between those of the non-protonated and protonated nitrogen analogues (Fig. 7).
The asymmetric lineshape and observed chemical shifts seen in the NEXAFS data mirror the slight offset towards oxygen seen with XPS (i.e. signal slightly closer to CN than CNH+ for 3,5-PDCA). This provides evidence that the chemical shifts in NEXAFS are mainly dominated by the variations in the nitrogen 1s core level binding energies, rather than variations in the energies of the π* orbitals. We have previously observed a similar initial-state domination of NEXASF chemical shifts.38
The timescale of NEXAFS absorption is determined by the core hole lifetime, in analogy to XPS. NEXAFS can therefore also act to provide snapshots of all the possible hydrogen position occupancies (i.e. population) relative to nitrogen. The shape and asymmetry of the peaks can again be used to trace the slight migration of the hydrogen around the midpoint and its preferred location at a particular temperature (as noted with neutron diffraction, Table 2)10 and reflect the change in potential energy well from slightly asymmetric towards symmetric predicted by the MD simulations as the midpoint is approached.7 The temperature-dependent NEXAFS (Fig. 8) is consistent with the conclusions drawn from XPS, in that the nitrogen π* resonance becomes more symmetrical at low temperature (131 K, −142.15 °C) as more hydrogen atoms move slightly closer to the nitrogen such that the distribution becomes more evenly spread, i.e. towards a symmetrical, single potential well.
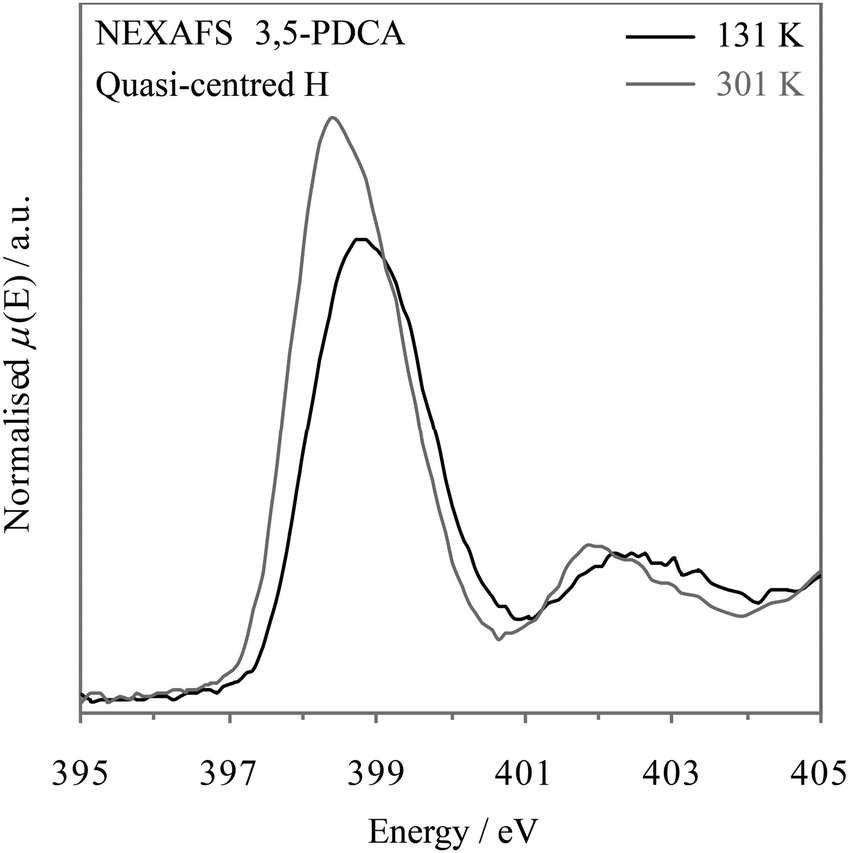 | ||
| Fig. 8 Nitrogen K-edge NEXAFS spectra of 3,5-PDCA with temperature: 131 K (−142.15 °C, black) & 301 K (25.85 °C, grey). | ||
The results for both XPS and NEXAFS show how sensitive they are as probes for the hydrogen location in these donor–acceptor systems. With the latest generation of XPS and NEXAFS equipment permitting rapid turnaround measurements on a timescale of minutes, they should be considered complementary techniques for crystallographic analysis of hydrogen bonding dynamics. The ultrafast nature of core level spectroscopies is a distinct advantage over NMR in that line-shape analysis should allow drawing conclusions about the location and population of sites in the crystal structure. The value of core level spectroscopies thus lies particularly in their ability to distinguish unequivocally between different types of interactions involving hydrogen, effectively probing different points in the continuum from hydrogen bonded (X–H⋯Y) through to proton transfer (−X⋯H–Y+). The short, quasi-centred hydrogen bond can then be envisaged as the middle of this continuum or proton transfer pathway/reaction (X⋯H⋯Y), with XPS able to successfully identify this.
There are also short hydrogen bonds where the acceptor-hydrogen distance is less than in a more conventional hydrogen bond, but the hydrogen electron density remains localised on the donor atom.54–56 This is opposed to a short hydrogen bond in which the hydrogen is more centrally localised between acceptor and donor and more even sharing of electron density as observed in the present study. In the latter case, the decision as to which of the atoms hydrogen is covalently bound to becomes blurred.10,11,56 Based on the results reported here we predict that core level spectroscopies can distinguish these two cases, because no line broadening would be observed for the former, and given non-protonated and protonated references the chemical shift indicates the relative distance of hydrogen from the donor/acceptor.
Finally, we would like to note once more that classifying such bonds reliably can have substantial real-world impact, for example in the pharmaceutical industry, where incorrect classifications may potentially determine intellectual property rights and regulatory requirements.19,22,57 In fact, one could argue that where the electron density in a hydrogen bond becomes quasi-centred10,11,12,58 it becomes less clear whether these interactions even fall under the common notion of a hydrogen bond1 – at the very least some nomenclature for easily referring to this type of symmetric/quasi-centred hydrogen bond would be beneficial. The ability to experimentally distinguish between these different types of bonding should not, therefore, be underestimated.
Conclusions
The short OHN hydrogen bond in 3,5-PDCA has been probed by XPS and NEXAFS, which both indicate a chemical shift of the N 1s core level that is intermediate to the values of non-protonated (N) and protonated (NH+) nitrogen acceptors, i.e. no proton transfer vs. proton transfer. This reflects the fact that hydrogen bonding to the nitrogen moiety in 3,5-PDCA is characterised by a single-well hydrogen bond between the donor and acceptor where hydrogen resides around the centre, with quasi-covalent nature of the bonding in a near symmetrical hydrogen bond. The spectroscopic results are demonstrably distinct from what would be observed for conventional disordered hydrogen (two-site disorder) across donor and acceptor sites. The broad single-minimum potential results in a hydrogen population dynamically distributed just either side of the midpoint. Due to the ultrafast nature of core level excitation events, the core level spectroscopies detect this as a distribution of the associated N 1s chemical shifts, which increases the FWHM of the N 1s emission line in XPS and of the N 1s → π* transition in NEXAFS. Indeed, heating and cooling also change the N 1s photoemission and N 1s → π* absorption lines, reflecting slight movement of hydrogen within the quasi-symmetrical hydrogen bond. At low temperatures, hydrogens reside at the midpoint between the donor and acceptor atoms with a symmetrical hydrogen potential energy well, reflected by the XPS line-shape. Increasing asymmetry is observed at high temperatures, as the range of accessible positions moves slightly away from the nitrogen acceptor towards the oxygen donor and the potential energy well becomes asymmetric. Both XPS and NEXAFS therefore provide an experimental method for identifying and characterising quasi-centred hydrogen bonds and probing the ultrafast population dynamics of hydrogen positions. The ability to identify systems with this type of bonding spectroscopically presents an opportunity to not only examine their prevalence, but also to examining their properties, and establishing structure–function relationships.Conflicts of interest
There are no conflicts to declare.Acknowledgements
JSS would like to acknowledge previous support through the University of Manchester Research Fellowship and a PhD+ postdoctoral fellowship. We acknowledge support and funding for JSS and SLMS through the EPSRC Critical Mass Grant EP/I013563/1. SLMS acknowledges support by EPSRC under EP/P006965/1 and by the Royal Academy Engineering, Diamond Light Source and Infineum UK Ltd through the Bragg Centenary Chair. Use of the National Synchrotron Light Source, Brookhaven National Laboratory, was supported by the U.S. Department of Energy, Office of Science, Office of Basic Energy Sciences, under Contract No. DE-AC02-98CH10886. Certain commercial names are mentioned in this manuscript for purposes of example and are not an endorsement of the National Institute of Standards.References
- E. Arunan, G. R. Desiraju, R. A. Klein, J. Sadlej, S. Scheiner, I. Alkorta, D. C. Clary, R. H. Crabtree, J. J. Dannenberg, P. Hobza, H. G. Kjaergaard, A. C. Legon, B. Mennucci and D. J. Nesbitt, Pure Appl. Chem., 2011, 83, 1637–1641 CAS.
- G. A. Jeffrey, An Introduction to Hydrogen Bonding, Oxford University Press, New York, 1997 Search PubMed.
- G. Gilli and P. Gilli, The Nature of the Hydrogen Bond, Oxford University Press, Oxford, UK, 1st edn, 2009 Search PubMed.
- V. L. Deringer, U. Englert and R. Dronskowski, Chem. Commun., 2014, 50, 11547–11549 RSC.
- S. J. Grabowski, Chem. Rev., 2011, 111, 2597–2625 CrossRef CAS PubMed.
- T. Steiner, J. Phys. Chem. A, 1998, 102, 7041–7052 CrossRef CAS.
- F. Fontaine-Vive, M. R. Johnson, G. J. Kearley, J. A. Cowan, J. A. K. Howard and S. F. Parker, J. Chem. Phys., 2006, 124, 234503 CrossRef CAS PubMed.
- F. Fontaine-Vive, M. R. Johnson, G. J. Kearley, J. A. K. Howard and S. F. Parker, J. Am. Chem. Soc., 2006, 128, 2963–2969 CrossRef CAS PubMed.
- R. N. Karingithi, C. L. Shaw, E. W. Roberts and P. A. Molina, THEOCHEM, 2008, 851, 92–99 CrossRef CAS.
- J. A. Cowan, J. A. K. Howard, G. J. McIntyre, S. M. F. Lo and I. D. Williams, Acta Crystallogr., Sect. B: Struct. Sci., 2005, 61, 724–730 CrossRef PubMed.
- J. A. Cowan, J. A. K. Howard, G. J. McIntyre, S. M. F. Lo and I. D. Williams, Acta Crystallogr., Sect. B: Struct. Sci., 2003, 59, 794–801 CrossRef PubMed.
- T. Steiner, I. Majerz and C. C. Wilson, Angew. Chem., Int. Ed., 2001, 40, 2651–2654 CrossRef CAS.
- K. K. Arora and V. R. Pedireddi, J. Org. Chem., 2003, 68, 9177–9185 CrossRef CAS PubMed.
- T. Steiner, Angew. Chem., Int. Ed., 2002, 41, 48–76 CrossRef CAS.
- P. A. Frey, in Encyclopedia of Biological Chemistry, ed. W. J. Lennarz and M. D. Lane, Elselvier Inc., 2004, vol. 2, pp. 594–598 Search PubMed.
- P. Gilli, V. Bertolasi, V. Ferretti and G. Gilli, J. Am. Chem. Soc., 1994, 116, 909–915 CrossRef CAS.
- B. Schiott, B. B. Iversen, G. K. H. Madsen, F. K. Larsen and T. C. Bruice, Proc. Natl. Acad. Sci. U. S. A., 1998, 95, 12799–12802 CrossRef CAS PubMed.
- Handbook of Pharmaceutical Salts: Properties, Selection, and Use, ed. P. H. Stahl and C. G. Wermuth, Wiley VCH, Zurich, 2nd edn, 2011 Search PubMed.
- Pharmaceutical Salts and Co-crystals, ed. J. Wouters and L. Quéré, The Royal Society of Chemistry, Cambridge, UK, 1st edn, 2012 Search PubMed.
- N. Schultheiss and A. Newman, Cryst. Growth Des., 2009, 95, 2950–2967 CrossRef PubMed.
- J. S. Stevens, M. Walczak, C. Jaye and D. A. Fischer, Chem. – Eur. J., 2016, 22, 15600–15604 CrossRef CAS PubMed.
- Regulatory Classification of Pharmaceutical Co-Crystals, Food and Drug Administration, Rockville, MD, 2018, https://www.fda.gov/media/81824/download Search PubMed.
- S. Anderson, S. Crosson and K. Moffat, Acta Crystallogr., Sect. D: Biol. Crystallogr., 2004, 60, 1008–1016 CrossRef PubMed.
- W. W. Cleland, Arch. Biochem. Biophys., 2000, 382, 1–5 CrossRef CAS PubMed.
- W. W. Cleland, P. A. Frey and J. A. Gerlt, J. Biol. Chem., 1998, 273, 25529–25532 CrossRef CAS PubMed.
- C. L. Perrin and J. B. Nielson, Annu. Rev. Phys. Chem., 1997, 48, 511–544 CrossRef CAS PubMed.
- J. S. Stevens, S. J. Byard, C. C. Seaton, G. Sadiq, R. J. Davey and S. L. M. Schroeder, Angew. Chem., Int. Ed., 2011, 50, 9916–9918 CrossRef CAS PubMed.
- J. S. Stevens, S. J. Byard, C. C. Seaton, G. Sadiq, R. J. Davey and S. L. M. Schroeder, Angew. Chem., 2011, 123, 10090–10092 CrossRef.
- J. S. Stevens, S. J. Byard, C. A. Muryn and S. L. M. Schroeder, J. Phys. Chem. B, 2010, 114, 13961–13969 CrossRef CAS PubMed.
- J. S. Stevens, S. J. Byard and S. L. M. Schroeder, J. Pharm. Sci., 2010, 99, 4453–4457 CrossRef CAS PubMed.
- J. S. Stevens, S. J. Byard and S. L. M. Schroeder, Cryst. Growth Des., 2010, 10, 1435–1442 CrossRef CAS.
- J. S. Stevens, S. J. Byard, E. Zlotnikov and S. L. M. Schroeder, J. Pharm. Sci., 2010, 100, 942–948 CrossRef PubMed.
- J. S. Stevens, S. J. Byard, C. C. Seaton, G. Sadiq, R. J. Davey and S. L. M. Schroeder, Phys. Chem. Chem. Phys., 2014, 16, 1150–1160 RSC.
- J. S. Stevens, L. K. Newton, C. Jaye, C. A. Muryn, D. A. Fischer and S. L. M. Schroeder, Cryst. Growth Des., 2015, 15, 1776–1783 CrossRef CAS.
- J. S. Stevens, A. C. d. Luca, M. Pelendritis, G. Terenghi, S. Downes and S. L. M. Schroeder, Surf. Interface Anal., 2013, 45, 1238–1246 CrossRef CAS.
- J. S. Stevens and S. L. M. Schroeder, in Encyclopedia of Physical Organic Chemistry, ed. Z. Wang, Tools and Experimental Techniques, John Wiley & Sons, 1st edn, 2017, vol. 4, pp. 3241–3294 Search PubMed.
- J. Stöhr, NEXAFS Spectroscopy, Springer-Verlag, Berlin, 2nd edn, 1992 Search PubMed.
- J. S. Stevens, A. Gainar, E. Suljoti, J. Xiao, R. Golnak, E. F. Aziz and S. L. M. Schroeder, Chem. – Eur. J., 2015, 21, 7256–7263 CrossRef CAS PubMed.
- J. S. Stevens, A. Gainar, C. Jaye, D. A. Fischer and S. L. M. Schroeder, J. Phys.: Conf. Ser., 2016, 712, 12133 CrossRef.
- W. Hua, B. Gao, S. Li, H. Ågren and Y. Luo, J. Phys. Chem. B, 2010, 114, 13214–13222 CrossRef CAS PubMed.
- V. Feyer, O. Plekan, R. Richter, M. Coreno, K. C. Prince and V. Carravetta, J. Phys. Chem. A, 2009, 113, 10726–10733 CrossRef CAS.
- G. A. Sawatzky and E. Antonides, J. Phys., Colloq., 1976, 37, C4-117 CrossRef.
- D. Nolting, N. Ottosson, M. Faubel, I. V. Hertel and B. Winter, J. Am. Chem. Soc., 2008, 130, 8150–8151 CrossRef CAS PubMed.
- E. Ito, H. Oji, T. Araki, K. Oichi, H. Ishii, Y. Ouchi, T. Ohta, N. Kosugi, Y. Maruyama, T. Naito, T. Inabe and K. Seki, J. Am. Chem. Soc., 1997, 119, 6336–6344 CrossRef CAS.
- V. C. Téllez, B. S. Gaytán, S. Bernès and E. G. Vergara, Acta Crystallogr., Sect. C: Cryst. Struct. Commun., 2002, 58, o228–o230 CrossRef PubMed.
- A. Kvick, T. F. Koetzle, R. Thomas and F. Takusagawa, J. Chem. Phys., 1974, 60, 3866–3874 CrossRef CAS.
- J. S. Stevens and S. L. M. Schroeder, Surf. Interface Anal., 2009, 41, 453–462 CrossRef CAS.
- N. Fairley and A. Carrick, The Casa Cookbook - Part 1: Recipes for XPS Data Processing, Acolyte Science, Knutsford, Cheshire, 2005 Search PubMed.
- S. Garcia-Gil, A. Arnau and A. Garcia-Lekue, Surf. Sci., 2013, 613, 102–107 CrossRef CAS.
- F. Bisti, A. Stroppa, S. Picozzi, M. Donarelli, S. Picozzi and M. Coreno, J. Chem. Phys., 2013, 138, 014308 CrossRef CAS PubMed.
- G. Tu, Y. Tu, O. Vahtras and H. Agren, Chem. Phys. Lett., 2009, 468, 294–298 CrossRef CAS.
- G. Beamson, D. T. Clark, J. Kendrick and D. Briggs, J. Electron Spectrosc. Relat. Phenom., 1991, 57, 79–90 CrossRef CAS.
- E. A. Thomas, A. R. Carrick and J. E. Fulghum, Surf. Interface Anal., 1998, 26, 278–289 CrossRef CAS.
- I. Majerz and M. J. Gutmann, J. Phys. Chem. A, 2008, 112, 9801–9806 CrossRef CAS PubMed.
- M. Schmidtmann, L. J. Farrugia, D. S. Middlemiss, M. J. Gutmann, G. J. McIntyre and C. C. Wilson, J. Phys. Chem. A, 2009, 113, 13985–13997 CrossRef CAS PubMed.
- T. Steiner, C. C. Wilson and I. Majerz, Chem. Commun., 2000, 1231–1232 RSC.
- N. K. Duggirala, M. L. Perry, O. Almarsson and M. J. Zaworotko, Chem. Commun., 2016, 52, 640–655 RSC.
- C. Wilson, Acta Crystallogr., Sect. B: Struct. Sci., 2001, 57, 435–439 CrossRef CAS PubMed.
Footnote |
| † Electronic supplementary information (ESI) available: List of crystal structures and CSD Refcodes. See DOI: 10.1039/c9cp05677g |
| This journal is © the Owner Societies 2020 |