 Open Access Article
Creative Commons Attribution 3.0 Unported Licence
Seeking minimum entropy production for a tree-like flow-field in a fuel cell
Marco
Sauermoser
 *a,
Signe
Kjelstrup
 a,
Natalya
Kizilova
 bca,
Bruno G.
Pollet
 d and
Eirik G.
Flekkøy
 a
a
aPoreLab, Department of Chemistry, Norwegian University of Science and Technology, NTNU, Trondheim, Norway. E-mail: marco.sauermoser@ntnu.no
bWarsaw University of Technology, Institute of Aviation and Applied Mechanics, Warsaw 00-665, Poland
cDepartment of Applied Mathematics, V. N. Karazin Kharkov National University, 61022 Kharkiv, Ukraine
dDepartment of Energy and Process Engineering, Norwegian University of Science and Technology, NTNU, Trondheim, Norway
First published on 18th March 2020
Abstract
Common for tree-shaped, space-filling flow-field plates in polymer electrolyte fuel cells is their ability to distribute reactants uniformly across the membrane area, thereby avoiding excess concentration polarization or entropy production at the electrodes. Such a flow field, as predicted by Murray's law for circular tubes, was recently shown experimentally to give a better polarization curve than serpentine or parallel flow fields. In this theoretical work, we document that a tree-shaped flow-field, composed of rectangular channels with T-shaped junctions, has a smaller entropy production than the one based on Murray's law. The width w0 of the inlet channel and the width scaling parameter, a, of the tree-shaped flow-field channels were varied, and the resulting Peclet number at the channel outlets was computed. We show, using 3D hydrodynamic calculations as a reference, that pressure drops and channel flows can be accounted for within a few percents by a quasi-1D model, for most of the investigated geometries. Overall, the model gives lower energy dissipation than Murray's law. The results provide new tools and open up new possibilities for flow-field designs characterized by uniform fuel delivery in fuel cells and other catalytic systems.
1 Introduction
Since the start of polymer electrolyte membrane fuel cell (PEMFC) research,1 serpentine flow-fields have been commonly used to supply reactants (oxygen and hydrogen) to the cell's catalytic layers in the membrane electrode assembly (MEA). The serpentine field is in use2–4 also in industry, but it has become increasingly clear that other flow-fields perform better, in terms of a better polarization curve and lower operational costs.5,6 The distance from the polarization curve to the value of the reversible potential of the cell expresses the energy dissipated as heat or the entropy production times the temperature of the fuel cell.7 The losses, which vary with the current density, are much larger at the electrodes and in the membrane than in the porous transport layers (PTLs).8 However, the losses in the PTLs will have an impact on the cell's overpotentials via the gas concentration at the catalyst. A flow-field that can deliver reactants at uniform conditions to the cell's active membrane area is therefore beneficial. An optimal field can thus be characterized by a uniform entropy production. Among numerous replacement proposals, it has been argued that bio-inspired fractal-type flow-fields would be beneficial, because they are developed for energy-efficient biofluid delivery, meaning uniform delivery of fluids to animal and plant tissues.9,10 Recent experimental evidence confirms their superiority in this respect for PEMFCs. Fractal-type flow channels could have an open side like other conventional designs and, thus, provide a continuous non-uniform gas delivery to the membrane along the flow-field. Trogadas et al.11 proposed a 3D lung-inspired design with closed channels that is perpendicular to the PEMFC membrane and is only in contact with the MEA through the openings of the smallest channels, which supplied the active area with a uniform gas mixture from above. The flow-field was better than a serpentine flow-field in terms of its polarization curve. The property of equipartition of entropy production has been connected with minimum energy dissipation in various process equipment (for an overview, see ref. 12). This altogether has led us to speculate that fractal-like (or self-similar) patterns with constant scaling parameters could be beneficial as distributors of gases in PEMFCs.13 Perfect equipartition can be obtained using scaling parameters obtained with the method of Gheorghiu et al.14 and Trogadas et al.,11 but, in reality, there are often boundary- or material conditions that do not allow us to reach the ideal limit. Additional constraints or variables are therefore interesting. We shall study such here, comparing the outcome all the time to the performance of Murray's law for volume or area-filling conditions,15 see Appendix 1. This condition is also close to the practical condition facing a fuel cell designer. Murray15 used a volume-filling condition as a constraint for flow in tree-shaped structures, and obtained as an outcome of the optimization his famous scaling law, saying that the diameters of the branches from one generation to the next were scaling as eqn (1) shows: | (1) |
Eqn (1) characterises the fluid delivery system for which the total entropy production of the flow-field pattern by viscous dissipation is minimum, given the total volume available to flow.15 An optimization problem with minimum total volume at a given entropy production, has, however, the exact same solution. Both formulations are beneficial to use in flow-field plate design. Minimum total volume at a constant channel depth means maximum gas–land contact area and, therefore, smaller total electric resistance of current collectors (smaller Ohmic losses). In this sense, it is logical to use constant volume as a constraint in the optimization problem.
Gheorghiu et al.14 studied airflows in the bronchial tree of humans and used as a constraint that the volume flow through each generation of branches was constant. They found that minimum entropy production corresponded to a constant pressure drop across each branch. In their case, minimum entropy production could be understood as equipartition of entropy production (uniformly distributed entropy production).
The geometric design principle of Murray15 was seen as a manifestation of equipartition of entropy production.14 The constraints used by Gheorghiu et al. and Murray were not the same, however. In the first case, no restriction was placed on the geometry, while in Murray's case the volume-filling geometry compatible with minimum work was of primary interest.
From studies of Nature, we know, however, that a decrease in the entropy production in one a part of a complex system could be beneficial for the overall efficiency. This was confirmed by an enormously high number of studies of fluid delivery systems in Nature (in plants, animals, sponges, fungi, etc.). They were shown to have minimum dissipated energy (entropy generation), independently of other functions.9,10 Therefore, we shall assume that an approach to minimize the viscous dissipation in the flow-field also could be beneficial for PEMFCs, in spite of non-constant temperatures across the cell and other types of dissipation. Previous studies have already shown that the entropy production of a fuel cell can be optimized by separating the flow-field plate and MEA if the gases are delivered uniformly. In our design the fractal channels are in contact with the MEA only through the fixed number of open ends of the last generation's channels. This allows one to optimize the flow-field plate in the x–y direction and the MEA in the z-direction without any reiterations to connect both.13 This hypothesis needs, of course, to be checked by experiments and/or more detailed multiphysics CFD computations, but a successful starting geometry could well come from the simplest base.
There are presently few quantitative reports on bio-inspired designs,11,13,16 and the present work attempts to change this situation, contributing to analytic and numerical studies of biomimetic designs of the flow-fields in PEMFCs. The problem is challenging, as the transport of oxygen can be severely hindered by water formation in the catalytic layers and water clogging in the PTL. In addition, the heat production at the cathode can shift the ratio of water vapor to liquid.8
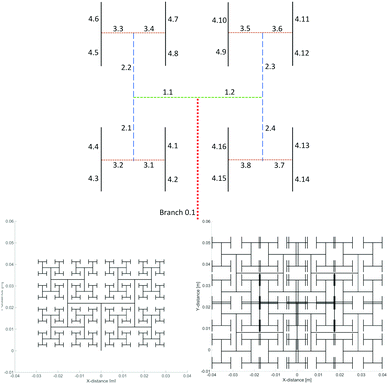
But, in this context, a tree-like structure for supply of gases may offer advantages. Trogadas et al.11 used a 3D lung-inspired tree perpendicular to the PEMFC membrane, supplying the active area with the same gas mixture from above. We shall use a “flat” tree, or a quasi-3D-tree that is parallel to the membrane, see Fig. 1, as in the original proposal of Kjelstrup et al.13 The inlet is set at the symmetry line of the area close to its perimeter (Branch 0, 1 in Fig. 1), while the outlets are (only) at the ends of all the branches of the last generation (here 4 generations are shown). Both types of trees will, by construction, deliver gas at (nearly) uniform conditions to the membrane active area. The “flat” tree may also be embedded into the end-plates of the cell, and possibly help us avoid the PTL all together. There is a possibility to construct parallel outlet channels for water, with a similar structure operating in the reverse direction.
These potential options have motivated this first study of a flat tree-like flow-field. We are concerned with a gas inlet distributor where hydrodynamic flows take place in a plane, with a certain channel depth and width. The Peclet number will be used to assess how far we are from the diffusional regime. The model applies so far to the anode side of the PEMFC, where hydrogen and water vapour flow in the same direction, and where there is negligible water condensation. In order to use it for the cathode, we need to introduce two-phase flow of water and gas with the possibility of water clogging the pores in an outlet system with the same shape. This problem will be postponed, however. The paper is organized as follows. We describe first (Section 2) the quasi 3-dimensional (3D) tree-shaped flow-field pattern, with a finite number of branches, to set a practical stage for the investigation. Afterwards we define the equations which describe the system in use. The 3D system describing the flow in the fractal flow-field is solved numerically, while a simplified 1D representation of the same is solved analytically. The flow-fields are studied under flow and boundary conditions typical for PEM fuel cells. The impact of geometry is pointed out. In our study, we find that there are other geometries than those given by Murray that have a smaller energy dissipation. We proceed to explain the benefits/disadvantages of various case studies, followed by a discussion of the results. We believe that our systematic use of the entropy production as a tool to observe the performance of a flow-field is new in the context of fuel cells.
2 System
The flow-field of a fuel cell should preferably deliver gas at uniform conditions all over the 2D-catalytic layer. This motivated our choice of a tree-like structure where each branch always splits into 2 sub-branches. The cross-section of the branch is rectangular or square. Such patterns, which are the focus here, can be characterized by geometric series. The system can be designed to fill the space available, be it a certain volume or, in the quasi 3D-case, an area.The uniform supply of a fluid to the catalyst is the first essential requirement of an optimal PEMFC.13 A working quasi-3D flow-field needs inlet- and outlet-patterns. Only one pattern leads to dead-end flow channels. However, we shall now look at the inlet pattern only for the sake of simplification, where only the branches in the last generation are connected to the gas diffusion layer. The situation shares similarities with an interdigitated flow-field design, where the flow needs to go through the gas diffusion layer before the gases and water are able to leave the fuel cell.
The outlet pattern can be machined onto a new plate, making it a 2-layer flow-field plate. Machining can be done with conventional milling methods since we propose to use a 2D channel structure with constant channel depth. Constant depth allows an easy milling process and reduces pressure loss effects from a step-wise decrease of the channel depth at T-junctions. Any 3D printing will, therefore, not be needed. The branches of the last generation of the inlet pattern will be in contact with the openings drilled in the second plate. One advantage of this type of flow-field plate is the modularity, meaning that the outlet pattern can be easily changed independently of the inlet pattern and vice versa. The first generation of both inlet and outlet patterns will need to be connected to the fuel inlet and gas outlet of the fuel cell, and this can be done by a straight channel.
Take the symbol l0 for the length of the first branch which is not yet split (level 0). When Nj is the sum of the number of branches at level j, the ratio Nj/Nj+1 is therefore 1/2. The parameter jf is defined as the generation level number of the last generation. In the first step we are looking at a self-similar system, meaning that the length, lj,i, and width, wj,i, of each branch i at generation level j are scaled down by the same factor, k and a, respectively. Widths and lengths have the unit m.
The numbering of branches is illustrated in Fig. 1. We show in Appendix 1 how the length scaling parameter can be derived for volume-filling or area-filling conditions. The branch length will scale as:
 | (2) |
| wj,i = ajw0 | (3) |
 | (4) |
 | (5) |
For the case of a rectangular-shaped (quasi 3D-) flow channel, we chose to replace d0 and dj,i with w0 and wj,i. From eqn (4), we calculated a value for a, which is 0.51/3 ≈ 0.79. This value will be used for all calculations where we refer to Murray's law. The k-value has an impact on how the pattern fills out the free space in the plane. We shall study values where 2 < k < 3 in connection with Murray's law for width-scaling cases. The endpoint values have clear geometric interpretations. The shape of other fractal-like patterns will also be investigated, changing the k-parameter from 2 up to 3.
Fig. 1 (bottom two figures) shows the space-filling ability of such a tree as a function of the k-parameter (the width was not scaled in this figure). The number of generations in the tree was set to 9 for visual purposes, which means that jf = 8. Values below k = 2 created patterns that did not fill the space. Values of k > 2.2 create cross-overs. This means that the pattern will turn out to be problematic in a manufacturing process that uses 3D techniques like 3D-printing. The analysis (Fig. 1) of the length scaling parameter k demonstrated the biggest disadvantage of this way to scale the pattern: this always results in a rectangular area. The PEMFC area to be investigated was however a square. Therefore, we set the branch length at a predefined value, constant for all cases, when we asked for the space filling pattern. The only parameter to be scaled was then the width of the rectangular channel. Table 1 shows the length of the different generation levels which were used in the calculations (jf set to 4), chosen in such a way that we obtain an area-filling pattern for a 25 cm2 active fuel cell membrane area.
| Generation level j | Length [mm] |
|---|---|
| 0 | 24 |
| 1 | 12 |
| 2 | 12 |
| 3 | 6 |
| 4 | 6 |
3 Theory
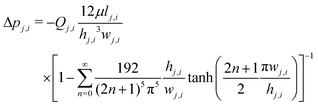
The “flat” tree flow-field will be modelled in several ways. In the most precise manner, we consider all three dimensions of each channel, and compute the flow-field in the full network of branches. The entropy production due to viscous dissipation at isothermal conditions in the 3D-case is: | (6) |
 is the entropy production of branch i at generation level j of the flow-field pattern in J s−1 K−1, Π is the viscous stress tensor in Pa, Vi,j is the volume of branch i at generation level j in m3, and v is the barycentric velocity in m s−1. The total entropy production is the sum of the entropy production of all branches:
 | (7) |
 | (8) |
 | (9) |
 | (10) |
 in J m−1 s−1 K−1 is introduced:
 | (11) |
 | (12) |
 | (13) |
 | (14) |
 | (15) |
 | (16) |
 | (17) |
4 Methods
4.1 Case studies
Table 2 shows a summary of the conducted studies on the chosen tree-shaped pattern. To start, we studied the variation in the entropy production with flow rate, and the impact of the pressure drop calculation method (Study 1 in Table 2), followed by an analysis of Murray's law and the impact of it on the entropy production (Study 2). We studied the impact of the geometry and scaling properties on the TEP (eqn (9)) and TSEP (eqn (12)) of the flow-field pattern to answer the question: is Murray's law the most efficient way to scale the pattern in terms of entropy production?| Study | Investigation | Variables | Method |
|---|---|---|---|
| 1 | Q 0 and Δp calculation method dependency on TEP and TSEP | Q 0, Δp calculation method, w0 | 1D |
| 2 | Murray's law and entropy production | a, w0 | 1D |
| 3 | 1D Δp | a, Δp calculation method | 1D |
| 4 | Flow rate distribution | a, w0 | 3D |
| 5 | 3D TEP and TSEP | a, w0, Q0 | 3D |
| 6 | a, comparison of 1D and 3D Δp | a, Δp calculation method, 3D Δp | 3D, 1D |
| 7 | Peclet number | L, w0, a, Q0 | 1D |
All three cases described in Section 3 were used and compared to each other (Study 3). It was of interest to see how the pressure varied along the branches for different scaling parameters. The 1D-calculations of the pressure drop in the tree-shaped pattern (with the equations given in Section 3) do not include entrance length effects or flow retardation at the T-junctions, thus promoting the 3D calculations (Studies 4–6).
Due to branching, the flow inside the channels can become asymmetric (see ref. 18 and 19), and this may cause an undesirable nonuniform flow distribution over the PEMFC. Therefore we computed the outlet flow rates from the last generation and compared them to each other, in order to see if we were able to reproduce the results of Ramos et al.,19 and to prove that tree-shaped patterns deliver the fuels uniformly (Study 4).
To answer how well the simple 1D method can capture a more advanced result, we performed 3D simulations. We examined the pressure drop prediction of the 1D-model and evaluated its impact on the entropy production (Study 5 and 6). Finally (Study 7) we computed the Peclet number (cf.eqn (18)) at the outlet of the last branch. The Peclet number defines the ratio between convective and diffusive flow. A Peclet number lower than one means that diffusion dominates the flow. We have:
 | (18) |
4.2 Computational methods
| Current density [A m−2] | Flow rate [m3 s−1] |
|---|---|
10![[thin space (1/6-em)]](https://www.rsc.org/images/entities/char_2009.gif) 000 000 |
5.7104 × 10⁻⁶ |
| 5000 | 2.8552 × 10⁻⁶ |
| 1000 | 5.7104 × 10⁻⁷ |
| 100 | 5.7104 × 10⁻⁸ |
5 Results and discussion
5.1 TEP dependence on flow rate and total pressure difference
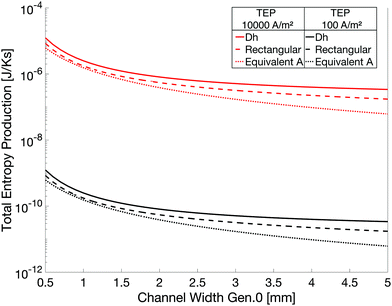
The results for the TEP and TSEP of the flow-field pattern (Study 1) are shown in Fig. 2 as a function of channel width, for flow rates corresponding to a current density of 104 and 100 A m−2, and the three ways to compute the pressure drop. The value of a was kept constant (0.79). The pressure drop was calculated using the hydraulic diameter (full line), the analytic solution of Hagen–Poiseuille flow for a rectangular channel (broken line) and the same for an equivalent cross-sectional area (dotted line). We saw an expected impact of the flow rate. An increase or decrease in the rate led to an increase or decrease respectively in the TEP and TSEP of the flow-field pattern. The variation between the flows was large, four orders of magnitude for the values chosen, since the entropy production is scaled with the flow to the power of 2. Fig. 2 shows furthermore the change of the TEP and TSEP with different ways to compute the pressure drop. Generally speaking, the use of the hydraulic diameter gave the highest entropy production (pressure drop values), whereas the method which uses a diameter calculated from the equivalent cross-sectional area gave the lowest values. The difference between the choice of areas was not large, however, considering the variation in the gas flow rates.The width of the channels (Fig. 2 shows the channel width of generation 0 in mm) had a big impact on the TEP (and TSEP) of the flow-field pattern, especially at the initial increase of w0. The higher w0 was, the lower was the decrease in entropy production. This could be explained by a much lower pressure drop at higher channel widths (at constant channel depth). The results will be compared to full hydrodynamic 3D simulations below.
5.2 Murray's law and entropy production
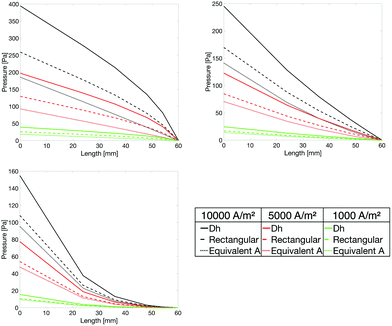
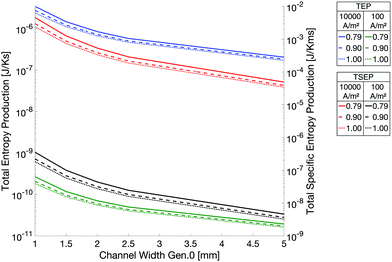
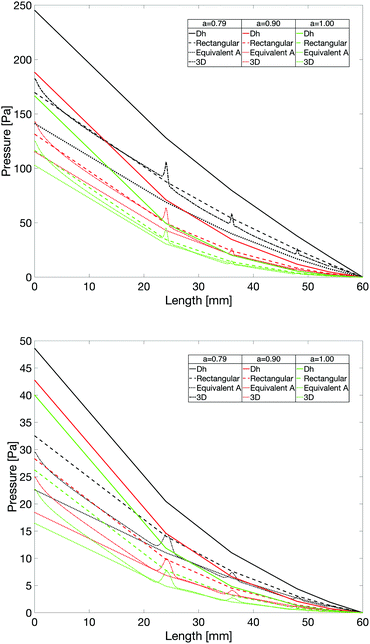
The impact of the width scaling parameter a on the TEP and TSEP of the flow-field pattern (Study 2) is shown in Fig. 3. The figure shows the TEP and TSEP as a function of the width of generation 0 for different values of a, at a flow rate which corresponds to 10![[thin space (1/6-em)]](https://www.rsc.org/images/entities/char_2009.gif) 000 A m−2, where the pressure drop was calculated with the hydraulic diameter Dh. We saw that the value of a obtained from Murray's law (a = 0.79) did not give the lowest total entropy production (total specific entropy production) of the flow-field pattern, independent of the way we computed the pressure drop and the flow rate. An increase in a led to a decrease of the entropy production values. This was caused by the faster decline in the pressure drop with a higher a, see Fig. 4 (Study 3). If a > 0.79 (Fig. 4 bottom left) the pressure along the branches became a convex function, whereas if a < 0.79 (Fig. 4 top left) the pressure dropped in a concave way. Using Murray's law led (Fig. 4 top right) to a close-to-linear pressure variation. The same effects could also be found for a variation in w0. Gheorghiu et al.14 described that if the pattern is scaled with Murray's law, a Lagrange multiplier optimization applied on the entropy production equation will show that the minimum entropy production will be reached when the pressure drop is constant along all branches. This was no longer the case here because we were setting the lengths manually to obtain a square area-filling pattern, contrary to the work of Gheorghiu et al. where the lengths were scaled with the assumption of a volume filling pattern (k = 3).
000 A m−2, where the pressure drop was calculated with the hydraulic diameter Dh. We saw that the value of a obtained from Murray's law (a = 0.79) did not give the lowest total entropy production (total specific entropy production) of the flow-field pattern, independent of the way we computed the pressure drop and the flow rate. An increase in a led to a decrease of the entropy production values. This was caused by the faster decline in the pressure drop with a higher a, see Fig. 4 (Study 3). If a > 0.79 (Fig. 4 bottom left) the pressure along the branches became a convex function, whereas if a < 0.79 (Fig. 4 top left) the pressure dropped in a concave way. Using Murray's law led (Fig. 4 top right) to a close-to-linear pressure variation. The same effects could also be found for a variation in w0. Gheorghiu et al.14 described that if the pattern is scaled with Murray's law, a Lagrange multiplier optimization applied on the entropy production equation will show that the minimum entropy production will be reached when the pressure drop is constant along all branches. This was no longer the case here because we were setting the lengths manually to obtain a square area-filling pattern, contrary to the work of Gheorghiu et al. where the lengths were scaled with the assumption of a volume filling pattern (k = 3).
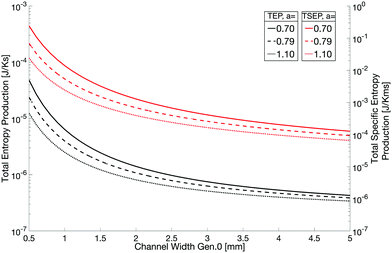 | ||
Fig. 3 TEP and TSEP as a function of channel width for different values of a. The flow rate was equivalent to a current density of 10![[thin space (1/6-em)]](https://www.rsc.org/images/entities/char_2009.gif) 000 A m−2. The pressure drop was calculated with Case Dh. 000 A m−2. The pressure drop was calculated with Case Dh. | ||
5.3 Flow rate distribution
As a consistency check, the overall outlet flow rate (summed flow rates at each branch outlet in the fourth generation) was compared to the set inlet flow rate (Study 4). The deviation was maximum 0.45% and minimum 0.19%. The differences were caused by numerical errors and we assumed that the results are therefore acceptable. The results for the analysis of the outlet flow rates can be found in Table 4. Furthermore, Fig. 5 shows the asymmetric effects caused by the branching in the tree-shaped pattern. As it can be seen, the difference was in most cases negligible, except for the cases with w0 = 5 mm, a = 0.9 and a = 1. For the case of a = 0.9, differences up to 2.5% could be seen, but only at flow rates equivalent to 104 A m−2. The explanation could be the asymmetry in the system: the branches did not have enough time to fully develop the hydrodynamic flow, leading to an asymmetric flow. For the case of a = 1, variations up to 8% could be seen even at lower flow rates, making this geometry less suitable for use in fuel cells due to non-uniform fuel distribution. Also Fan et al.18 documented non-uniform flow rates, and proposed that a good flow distribution could be achieved at certain flow rates. In their study, however, only one geometry was analysed. Ramos et al.19 also worked on this type of investigation with similar results.10![[thin space (1/6-em)]](https://www.rsc.org/images/entities/char_2009.gif) 000 A m−2 000 A m−2 |
5000 A m−2 | 1000 A m−2 | 100 A m−2 | |
|---|---|---|---|---|
| w 0 = 1 mm, a = 0.79 | 0.02 | 0.03 | 0.04 | 0.08 |
| w 0 = 1 mm, a = 0.9 | 0.11 | 0.20 | 0.27 | 0.53 |
| w 0 = 1 mm, a = 1 | 0.23 | 0.36 | 0.62 | 0.84 |
| w 0 = 1.5 mm, a = 0.79 | 0.03 | 0.01 | 0.01 | 0.01 |
| w 0 = 1.5 mm, a = 0.9 | 0.16 | 0.09 | 0.14 | 0.36 |
| w 0 = 1.5 mm, a = 1 | 0.37 | 0.14 | 0.17 | 0.46 |
| w 0 = 2 mm, a = 0.79 | 0.24 | 0.17 | 0.31 | 0.59 |
| w 0 = 2 mm, a = 0.9 | 0.29 | 0.03 | 0.04 | 0.09 |
| w 0 = 2 mm, a = 1 | 0.77 | 0.10 | 0.04 | 0.09 |
| w 0 = 2.5 mm, a = 0.79 | 0.20 | 0.02 | 0.03 | 0.06 |
| w 0 = 2.5 mm, a = 0.9 | 0.61 | 0.06 | 0.07 | 0.14 |
| w 0 = 2.5 mm, a = 1 | 0.75 | 0.11 | 0.18 | 0.34 |
| w 0 = 5 mm, a = 0.79 | 0.28 | 0.14 | 0.40 | 0.53 |
| w 0 = 5 mm, a = 0.9 | 2.54 | 0.41 | 0.70 | 0.90 |
| w 0 = 5 mm, a = 1 | 3.78 | 3.82 | 7.77 | 8.53 |
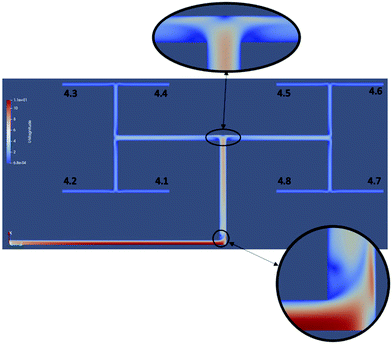 | ||
Fig. 5 Flow velocity distribution in the geometry with w0 = 1 mm and a = 0.79, at a flow rate equivalent to 10![[thin space (1/6-em)]](https://www.rsc.org/images/entities/char_2009.gif) 000 A m−2. 000 A m−2. | ||
5.4 TEP and TSEP from 3D calculations
The results of the TEP and TSEP computations are shown in Fig. 6 (Study 5). The same conclusion could be drawn from this as we did in the 1D calculations. An increase in a and w0 led to a lower TEP and TSEP of the flow-field pattern. Scaling the width according to Murray's law did not give the minimum entropy production. A quantitative comparison between the 3D and 1D results showed that the entropy production values, both the TEP and TSEP, were on the same order of magnitude. The maximum difference between the 1D and 3D calculations was dependent on the pressure drop calculation method. For the most suitable one, we had a maximum deviation of around 10%, whereas the worst one gave differences up to 61%. This emphasized the importance of the selection of the pressure drop calculation method. Also, the same trends could be observed.5.5 1D- and 3D pressure drop calculations compared
The pressure, plotted along the center of the flow channels, for the 1 mm and 2.5 mm geometries at different width scaling parameters and a flow rate equivalent to 104 A m−2 is presented in Fig. 7. Here the 3D results are compared to the ones from the 1D calculations (Study 6). Again there was a lower entropy production at higher a values than the one given by Murray's law, which could be explained by looking at the pressure drop (Fig. 7). The pressure drop was nearly linear with a = 0.79, whereas there was a non-linear pressure drop with higher scaling parameters, leading to a higher gradient. In this sense, we reproduced the results of Gheorghiu et al.14The pressure peaks appear only in the 3D simulations, which have a continuously connected flow channel. The peaks are due to the branching. In the bifurcations, flow is hampered and that increases their hydraulic resistance and, therefore, produces higher pressure drops to maintain the constant flow rate. 1D calculations based upon analytic equations do not produce such peaks. Fig. 7 gives a comparison of this branching effect on the pressure drop. The pressure peaks may be computed from the 1D model if the known approximate hydraulic formulas for the inlet flows, and flows in curved or T-shaped geometries, are used. Since CFD computations are quite fast and reliable, we have not reproduced the distributions with pressure peaks in the 1D models with approximate formulas. However, except for the first 2 branches, there was only a negligible pressure drop added to the system from this branching. Even though Ramos et al.19 used a slightly different geometry than here, the pressure drop values computed in the 3D simulations were of the same order of magnitude. The use of the hydraulic diameter overestimated the pressure drop in all simulated geometries. For the w0 = 1 mm geometry, the pressure drop in generation 0 and 1 could be well estimated with the analytic solution of Hagen–Poiseuille for rectangular channels. However, the results started to deviate at higher generation levels. For the other geometries (e.g.Fig. 7 bottom), the most accurate way to estimate the pressure drop at higher generation levels was the method of equivalent cross-sectional area. However, the interesting part is that even though the pressure drop of the branches itself deviated from the method using the analytic solution, the overall pressure drop of the complete pattern (pressure at x = 0) was quite accurate up to a width of generation 0 of 2 mm. It seemed that the more rectangular a channel got, the more difficult it was to estimate the pressure drop in the channels with 1D calculations.
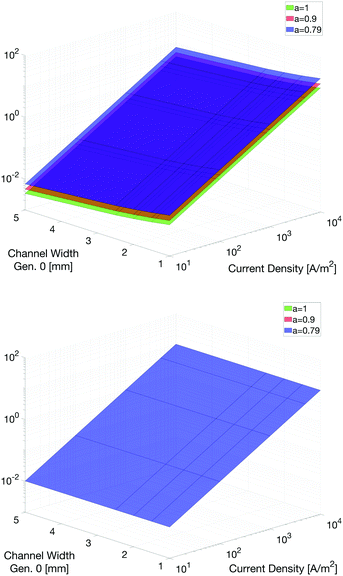
5.6 Peclet number
As discussed in Section 4.1, the Peclet number (eqn (18)) could be used as some form of design criterion for the channel geometries (Study 7). Trogadas et al.11 approached this problem by looking at the number of generation levels needed to achieve a Peclet number lower than one, using the thickness of the PTL as the characteristic length. In our case, we have a different approach. We were looking at two different characteristic lengths. One was the hydraulic diameter of a rectangular channel, and the other one was the width of the last branch. By doing so we were able to find the Peclet number directly at the outlet of the flow pattern, independent of the thickness of the PTL. It was then possible to conclude on the status of the flow at the end of the tree-shaped pattern. The Peclet number at the last branch (here generation 4) was calculated for both mentioned characteristic lengths, a varying width between 1 and 5 mm, a width scaling parameter a of 0.79, 0.9 and 1, and a current density between 10 A m−2 and 104 A m−2. We chose a diffusivity coefficient of 3.5 × 10⁻⁵ m s−2 for oxygen in water vapour according to Trogadas et al. The results can be seen in Fig. 8.The graphs illustrate the following points: both characteristic lengths give nearly the same results. At the last branch, the surface plot showing the Peclet number showed non-linear behavior, but neither the width of the channel nor the width scaling parameter had any significant influence on the Peclet number. The biggest impact came from the flow rate. For the case where the Peclet number was calculated with the width of the last branch as the characteristic length, the Peclet number was influenced by neither the width scaling parameter nor the width itself. This was due to the fact that the widths in eqn (18) cancelled each other out (if L = w4,i). It only depended on the depth of the channel, which was constant in our case.
This means that it will be difficult to use the Peclet number as a design criterion for the dimension/shape of the flow pattern. The huge influence of the flow rate within a typical regime of flow variation prevented this. It was still possible to use the Peclet number of a given channel width and width-scaling parameter to find a current density range where the Peclet number was smaller than 1. This will then enable us to obtain a diffusion dominated flow at the last branches. An increased number of generations will make the condition more likely.
6 Discussion
We know already from the experiments of Trogadas et al.11 that a tree-shaped field gives a better PEMFC performance than serpentine fields. The present flow-field gave also a uniform distribution of reactants, but at an entropy production that was lower than the one in the field predicted by Murray. The entropy production was reduced from branch to branch. The work pointed at further improvements, in terms of geometric choices, and possibilities to keep the Peclet number at a reasonably low value.We have seen that much of the 3D-behaviour could be captured in a simpler quasi 1D-model. This has the interesting aspect that a model of the total cell obtains a good quasi 1D-representation. A simplified, but realistic, fuel cell model can, therefore, be obtained by combining the present 1D tree calculation with 1D-calculations, see e.g.ref. 8 and 21. This allows for simple tests of, say, the impact of boundary conditions. The value of the flow rate is more important for the concrete result than any approximation used to compute the hydraulic diameter. All this is possible due to the uniform flow distribution and because the inlet pattern is only in contact with the MEA over the 2jf branches of the last generation. The pattern used by Trogadas et al.11 was similar to ours, as it was also inspired by a natural design (the lung). While their design was a 3D-design perpendicular to the MEA, ours had the flow-field tree in-plane with respect to the MEA. Our design can be machined with conventional milling techniques, where the outlet branches are located on a different layer. This may facilitate production and lead to decreased production costs for the flow-field plates.
A quasi-3D pattern allows for easy adjustment of the area filling property, through an increase of the generation levels. The pressure drop, as shown in Fig. 4, will not increase significantly when the generation level increases, due to the ever-decreasing gradient when a > 0.79. This creates room for the adjustment of generation levels and area filling properties. The pattern of Trogadas et al.11 does not have this flexibility.
The computed pressure drop across our flow-field could be compared to measured results for the conventional serpentine or parallel patterns. In order to do so, we used the results from 3D simulations of Su et al.22 With similar operating conditions to ours, we found that our tree-shaped field had a lower pressure drop than the serpentine field. Depending on the chosen width scaling parameter a, the difference could be as big as one order of magnitude. It has to be noted, however, that the pressure drop across the tree-shaped pattern will slightly increase if a more space-filling pattern is used. On the other hand, the pressure drop was bigger than the one across the simulated parallel pattern (up to 1 order of magnitude). To see the full impact on the performance of our flow-field on the fuel cell, experiments need to be conducted, and compared to industry-standard flow-field patterns. Another point of interest in connection with the tree-shaped pattern is the use of different branching rules. For example, different branching angles or numbers of branches per generation level (e.g. 4 instead of 2, to create some form of “H” branching) can be introduced. Effects on the uniformity of fuel and entropy production need to be investigated and compared with the presented flow-field. The fractal FFP has been designed for uniform distribution of reactant gases over the PEM, with a constant density of outlet channels. This implies that the total entropy production in a fuel cell can be lowered by optimizing the flow-field separately from the MEA. This means that to find the minimum entropy production of the fuel cell, we have to minimize the total entropy production both in the MEA and the FFP. In this case, the flow-field optimization would take place in the x–y plane, whereas the MEA optimization would be over the z-direction due to the uniform fuel distribution. This separation of problems was performed already in the original article of Kjelstrup et al.,13 which also Cho et al.23 draw inspiration from. The optimal catalytic layer did not depend (much) on the flow-field geometry, at least when the water accumulation had no impact on the hydraulic resistivity. According to Cho et al.23 the multilayer 3D FFP may lead to high water accumulation. Thick 3D FFPs are not beneficial for FCs because of their high mass and cost. The present fractal flow-field can be milled into a flow-field plate of standard thickness and hopefully give an essentially lighter and cheaper alternative.
In a complete fuel cell system, there are many other different sources of entropy production. These sources and values for different current densities can be found in the paper of Sauermoser et al.21 which describes the 1D modelling of a PEMFC with non-equilibrium thermodynamics. The results show the main contributions to the entropy production, namely the electrode overpotentials, ohmic resistances and losses due to concentration-overpotentials. A general aspect of the above study should finally be pointed out. The flow-field evaluated here is by no means restricted to PEMFCs. Also, other fuel cells may benefit from a similar structure. Supply systems like this are common in nature, and may thus have more applications also in technology, say in catalysis.
7 Conclusion and perspectives
We have documented a tree-shaped flow-field based on Murray's law's constraints, but with different geometric variables, for the supply of gases to a PEMFC membrane. The gases were delivered at the membrane at uniform conditions, but with smaller entropy production than Murray's tree. Entropy production was due to viscous dissipation only. A quasi-1D model was used and found to represent a 3D model within a maximum deviation of 10% for the most suitable pressure drop calculation method and most flow magnitudes relevant to PEMFCs. This applied when the channel cross-section was rectangular, not circular. Flow channels which had a high width to depth ratio produce a small asymmetric behaviour, which explained the deviations.We have thus established a basis for a 1D analysis of a whole single cell PEMFC, to be expanded to non-isothermal conditions in the future. 3D computations are time-consuming and can only be conducted for a restricted number of geometries. The 1D-results give an opportunity for fast quantitative estimations on different fractal-type geometries.
The main difference between this design and that of Trogadas et al. is that Trogadas et al. used a 3D structure, whereas we propose a two-layer flow-field plate with 2D patterns of constant channel depth. We hope that the new design may help reduce the weight and costs of the flow-field plate. Experimental proof beyond that offered by Trogadas et al.11 remains to be obtained. Additional sources of entropy production from thermal, electrical and chemical sources exist in the MEA.21 Studies indicate that the present design allows us to optimize these sources independently of the flow-field optimization.13
Conflicts of interest
There are no conflicts of interest to declare.Appendix 1: filling properties of self-similar networks
West et al.24 required that the spherical volume around one branch was equal to the sum of the volumes of all spheres around the sub-branches. This is expressed in eqn (19). The conditions follow from the need to accommodate the entire volume flow in the network.24 Each sphere has as the diameter the length of the corresponding branch. | (19) |
 | (20) |
 | (21) |
 | (22) |
 | (23) |
Acknowledgements
We gratefully acknowledge the support from NTNU in Trondheim and the Research Council of Norway through its Centre of Excellence funding scheme with Project No. 262644 (PoreLab). The simulations were performed on resources provided by UNINETT Sigma2 – the National Infrastructure for High Performance Computing and Data Storage in Norway.Notes and references
- C. Spiegel, Designing and building fuel cells, McGraw-Hill, New York, 2007 Search PubMed.
- P. J. Hamilton and B. G. Pollet, Fuel Cells, 2010, 10, 489–509 CrossRef CAS.
- H. Kahraman and M. F. Orhan, Energy Convers. Manage., 2017, 133, 363–384 CrossRef CAS.
- H. W. Wu, Appl. Energy, 2016, 165, 81–106 CrossRef CAS.
- H. Liu, P. Li, D. Juarez-Robles, K. Wang and A. Hernandez-Guerrero, Front. Energy Res., 2014, 2, 2 Search PubMed.
- T. Monsaf, B. M. Hocine, S. Youcef and M. Abdallah, Int. J. Hydrogen Energy, 2017, 42, 1237–1251 CrossRef CAS.
- O. Burheim, P. J. Vie, S. Moller-Holst, J. Pharoah and S. Kjelstrup, Electrochim. Acta, 2010, 55, 935–942 CrossRef CAS.
- S. Kjelstrup and D. Bedeaux, Non-equilibrium Thermodynamics Of Heterogeneous Systems, World Scientific, 2008 Search PubMed.
- M. LaBarbera, Science, 1990, 249, 992–1000 CrossRef CAS PubMed.
- N. Kizilova, Computational Science and Its Applications – ICCSA 2004, Berlin, Heidelberg, 2004, pp. 476–485 Search PubMed.
- P. Trogadas, J. I. S. Cho, T. P. Neville, J. Marquis, B. Wu, D. J. L. Brett and M.-O. Coppens, Energy Environ. Sci., 2018, 11, 136–143 RSC.
- S. Kjelstrup, D. Bedeaux, E. Johannessen and J. Gross, Non-equilibrium thermodynamics for engineers, World Scientific, 2nd edn, 2017 Search PubMed.
- S. Kjelstrup, M. O. Coppens, J. G. Pharoah and P. Pfeifer, Energy Fuels, 2010, 24, 5097–5108 CrossRef CAS.
- S. Gheorghiu, S. Kjelstrup, P. Pfeifer and M.-O. Coppens, Fractals in Biology and Medicine, Basel, 2005, pp. 31–42 Search PubMed.
- C. D. Murray, Proc. Natl. Acad. Sci. U. S. A., 1926, 12, 299–304 CrossRef CAS PubMed.
- A. Arvay, J. French, J. C. Wang, X. H. Peng and A. M. Kannan, Nature inspired flow field designs for proton exchange membrane fuel cell, 2013 Search PubMed.
- F. M. White, Fluid Mechanics, McGraw-Hill, 7th edn, 2011 Search PubMed.
- Z. Fan, X. Zhou, L. Luo and W. Yuan, Exp. Therm. Fluid Sci., 2008, 33, 77–83 CrossRef CAS.
- B. Ramos-Alvarado, A. Hernandez-Guerrero, F. Elizalde-Blancas and M. W. Ellis, Int. J. Hydrogen Energy, 2011, 36, 12965–12976 CrossRef CAS.
- C. Hou, S. Gheorghiu, M.-O. Coppens, V. H. Huxley and P. Pfeifer, Fractals in Biology and Medicine, Basel, 2005, pp. 17–30 Search PubMed.
- M. Sauermoser, G. Fossati, N. Kizilova and S. Kjelstrup, Electrochem. Soc. Trans., 2019, 92, 279–292 Search PubMed.
- A. Su, Y. C. Chiu and F. B. Weng, Int. J. Energy Res., 2005, 29, 409–425 CrossRef.
- J. Cho, T. Neville, P. Trogadas, Q. Meyer, Y. Wu, R. Ziesche, P. Boillat, M. Cochet, V. Manzi-Orezzoli, P. Shearing, D. Brett and M.-O. Coppens, Energy, 2019, 170, 14–21 CrossRef CAS.
- B. J. West, G. B. Brown and J. H. Enquist, Science, 1997, 276, 122–126 CrossRef PubMed.
| This journal is © the Owner Societies 2020 |

