
Room-temperature ultrafast synthesis, morphology and upconversion luminescence of K0.3Bi0.7F2.4:Yb3+/Er3+ nanoparticles for temperature-sensing application†
Xiaoli
Gao
ab,
Feng
Song
 *ab,
Dandan
Ju
c,
Aihua
Zhou
d,
Adnan
Khan
ab,
Ziyu
Chen
ab,
Xu
Sang
ab,
Ming
Feng
ab and
Lisa
Liu
ab
*ab,
Dandan
Ju
c,
Aihua
Zhou
d,
Adnan
Khan
ab,
Ziyu
Chen
ab,
Xu
Sang
ab,
Ming
Feng
ab and
Lisa
Liu
ab
aSchool of Physics, The Key Laboratory of Weak Light Nonlinear Photonics, Ministry of Education, Nankai University, Tianjin, 300071, PR China. E-mail: fsong@nankai.edu.cn
bCollaborative Innovation Center of Extreme Optics, Shanxi University, Taiyuan, Shanxi 030006, China
cSchool of Science, Tianjin Chengjian University, Tianjin 300384, PR China
dPhysics Department, School of Science, Tianjin University of Science & Technology, Tianjin 300457, People's Republic of China
First published on 7th October 2020
Abstract
An ultrafast route at room temperature has been developed for the first time to synthesize lanthanide ion (Yb3+/Er3+)-activated K0.3Bi0.7F2.4 fluorescent nanoparticles and hold the potential to be applied in luminescent temperature sensors. In addition, the crystal structure and morphology of the K0.3Bi0.7F2.4 nanoparticles prepared at different reaction conditions were studied in detail for the first time, including the reaction time and different mole ratios of Bi source and NH4F. Moreover, Yb3+/Er3+ doped in the K0.3Bi0.7F2.4 matrix using a luminescent thermometer based on the fluorescence intensity ratio technology was also investigated. Additionally, K0.3Bi0.7F2.4:Yb3+/Er3+ revealed excellent up-conversion luminescence performance, and the up-conversion mechanisms of samples are affirmed according to the up-conversion emission intensity as a function of the pump power density. Simultaneously, the optical thermometric performance of the samples was investigated in the temperature range of 323–523 K to indagate the temperature sensor performance. Significantly, the maximum sensor sensitivity of the studied nanoparticles were 0.0058 K−1 (Sa) at 523 K and 1.08 K−1 (Sr) at 323 K, which indicates that K0.3Bi0.7F2.4:20%Yb3+/2%Er3+ fluorescent nanoparticles can be exploited as a promising luminescent thermometer.
1. Introduction
Lanthanide ions (Ln3+) activated up-conversion luminescence materials have been applied in many fields including three-dimensional displays, white light-emitting diodes, biological imaging, temperature sensors and photocatalysts because of their unique optical merits.1–7 In particular, non-contact optical temperature sensing has attracted considerable attention in the past few years. Fluorescence intensity ratio (FIR) is regarded as the most promising approach for non-contact temperature detection because it is independent of the two thermally coupled levels of Ln3+ ions as a function of the temperature in the measurement process.8–10 Thereinto, the thermometric properties of Er3+ activated up-conversion materials were largely investigated because of their thermally compound levels of 2H11/2 and 4S3/2 with proper energy separation in the range of 200–2000 cm−1.4 It was demostrated that various Er3+-activated green emitting phosphors were proper FIR-based optical probers.4 However, the sensor sensitivity is still not high enough and it needs to be addressed despite these advantages. Thus, we need to search for new optical thermometers to overcome these weaknesses. Moreover, the strong up-conversion luminescence is conducive to improving the accuracy of the temperature sensor.11 Nevertheless, the fluorescence intensity is influenced by the host materials. Therefore, it is necessary to choose suitable host materials.12It is known that the low phonon energy of an ideal matrix material can reduce the rate of non-radiative relaxation and maximize the luminous efficiency. During the past few decades, Ln3+-doped fluoride as a research focus has attracted considerable attention. Because fluorides have good chemical stability and low phonon energy compared to other types of compounds, which is, therefore, often used as a matrix for effectively doping rare-earth ions.13–15
Bismuth is known as “green metal” with [Xe]4f145d106s26p3 electronic configuration because it possesses diverse oxidation states, multi-type electronic structures, nontoxic, and harmless properties.16–19 Hitherto, we consider that K0.3Bi0.7F2.4 may also be a suitable UC host material, which is inexpensive and thermodynamically stable at high temperatures. Until now, K0.3Bi0.7F2.4 nanoparticles, as the bismuth-based host, are rarely reported for achieving Ln3+ doping. Currently, for the K0.3Bi0.7F2.4 samples, there is only one published paper on Yb3+/Tm3+ doped K0.3Bi0.7F2.4 synthesized via a hydrothermal method as an UC luminescence material for deep-tissue optical imaging.20 Thus, there is still no report on Yb3+/Er3+ co-doped K0.3Bi0.7F2.4 matrix nanoparticles for temperature sensor applications. Moreover, Yb3+/Tm3+ doped K0.3Bi0.7F2.4 were synthesized by a hydrothermal method in this study, and we did not study the matrix synthesis in detail. In our work, the K0.3Bi0.7F2.4:Yb3+/Er3+ fluorescent nanomaterial was synthesized at room temperature and the morphology of the K0.3Bi0.7F2.4 nanoparticles prepared under different reaction conditions are studied for the first time in detail, such as reaction time and different mole ratios of Bi source and NH4F.
Herein, we report an ultrafast approach at room temperature to fabricate x%Yb3+/2%Er3+ activated K0.3Bi0.7F2.4 luminescent nanoparticles based on a chemical precipitation method in 1 min. This method is simple, efficient and low cost without the application of high temperature and pressure environment. Besides, the crystal structure and morphology of the K0.3Bi0.7F2.4 nanoparticles prepared under different reaction conditions are studied in detail. Moreover, the excitation and emission spectra of Yb3+/Er3+ doped K0.3Bi0.7F2.4 UC nanoparticles reveal excellent luminescence performance. In addition, we also investigated the UC mechanism according to the UC emission intensity as a function of the pump power density. The temperature dependence of photoluminescence intensities for the K0.3Bi0.7F2.4:20%Yb3+, 2%Er3+ sample was investigated at temperatures ranging from 323 K to 523 K. Furthermore, the potential application of the K0.3Bi0.7F2.4:20%Yb3+, 2%Er3+ sample used as a temperature sensor was studied.
2. Experimental
2.1 Materials
KF (>99.9%), NH4F (>99.9%), Bi(NO3)3·5H2O(>99%) were purchased from Tianjin Damao Chem. Ethylene glycol (EG) and rear-earth reagents Yb(NO3)3·6H2O (>99.99%), Er(NO3)3·6H2O (>99.99%) were supplied by HWRK Chemical Company. All the reagents were of analytical grade and used without further purification.2.2 Preparation of K0.3Bi0.7F2.4 nanoparticles and K0.3Bi0.7F2.4:20%Yb3+, 2%Er3+ nanoparticles
A room-temperature chemical precipitation method was used to synthesize the K0.3Bi0.7F2.4 nanoparticles. First, 0.222 g NH4F was dissolved in a 25 mL EG solution under magnetic stirring in a 50 mL glass breaker. Then, 0.58 g KF and 0.485 g Bi(NO3)3·5H2O were mixed into 10 mL of EG to form a homogeneous mixture. Whereafter, the NH4F solution was added to the above solution under magnetic stirring for different reaction times (1 min, 5 min, 30 min, 1 h, 3 h, and 6 h). Finally, the resulting white solid products were washed extensively three times with ethanol and dried at 80 °C for 12 h.To prepare K0.3Bi0.7F2.4:xYb3+/2%Er3+ nanoparticles, KF (1 mmol), Bi(NO3)3·5H2O (0.98–x mmol), Yb(NO3)3·5H2O (x = 0.05, 0.1, 0.15, 0.2, and 0.25 mmol) and Er(NO3)3·5H2O (0.02 mmol) were dissolved in 10 mL of EG. Then, a 25 mL NH4F solution was added to the above solution under magnetic stirring for 1 min. Finally, the products were washed extensively three times with ethanol and dried at 80 °C for 12 h.
2.3 Characterization
The crystal structure and purity of the as-synthesized K0.3Bi0.7F2.4 were examined using a PANalytical X'Pert Pro diffractometer with Cu Kα radiation (λ = 1.5406 Å) in the 2θ range from 10° to 90° at 40 mA and 40 kV. The morphology and composition of the products were observed on a scanning electron microscope (SEM) (JEOL JMS-7500F) attached with an energy-dispersive X-ray spectrometer (EDX). Transmission electron microscopy (TEM) was performed using a Tecnai G2 F20. The Fourier transform infrared spectrum (FT-IR) of the sample was recorded on a TENSOR II FTIR spectrometer. The photoluminescence excitation and emission spectra and decay curves of samples were recorded using a Horiba Fluorolog-3 luminescence spectrometer equipped with a continuous 980 nm laser as the excitation source. Besides, the spectrum on K0.3Bi0.7F2.4:20%Yb3+/2%Er3+ sample at the range of 323 K–523 K was recorded on a Nanolog luminescence spectrometer.3. Results and discussion
The K0.3Bi0.7F2.4 nanoparticles were synthesized using a chemical precipitation method at room temperature, and the corresponding schematic of the preparation process is shown in Fig. 1. The simple and facile synthetic method is suited for the fast production of K0.3Bi0.7F2.4 nanoparticles, which is beneficial for practical production and applications.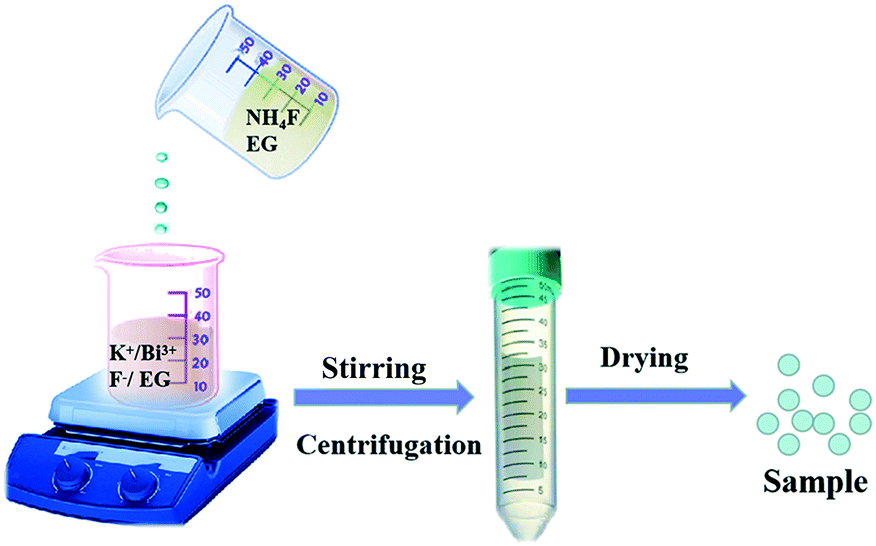 | ||
| Fig. 1 Schematic for the preparation process for K0.3Bi0.7F2.4 nanoparticles. | ||
3.1 Phase identification and morphology of the K0.3Bi0.7F2.4 products
To gain more information about the synthesis process, a series of time-dependent experiments were carried out to evaluate the influence of the reaction time on the structure of the K0.3Bi0.7F2.4 sample with a constant concentration of NH4F (10 mmol) in the reaction system. As revealed in Fig. 2, strong and sharp diffraction peaks can be observed for the as-prepared samples obtained at different reaction times, and all the diffraction peaks could be indexed to the standard card data of K0.3Bi0.7F2.4 (PDF#84-0534) without any trace of impurity phases, which demonstrate that the K0.3Bi0.7F2.4 crystal can be produced in a short time of one minute, and the products possess high crystallinity and phase purity. The SEM images of the K0.3Bi0.7F2.4 nanomaterials synthesized at different reaction times were recorded to observe the morphological evolution of products. As shown in Fig. 3 and S1,† the size distribution of the as-prepared nanoparticles is narrower and the average diameter is 50–60 nm. Moreover, there is almost no obvious difference in the morphology and size of the nanoparticles with the increase in the reaction time from 1 min to 1 h, even prolonging the reaction time to 3 and 6 h. The results indicate that the nucleation and growth of K0.3Bi0.7F2.4 nanoparticles can be quickly completed because the thermodynamic effect can reduce the huge surface energy of nanoparticles to achieve equilibrium of the whole system energy.21 | ||
| Fig. 2 XRD patterns of the K0.3Bi0.7F2.4 samples prepared at different reaction times. | ||
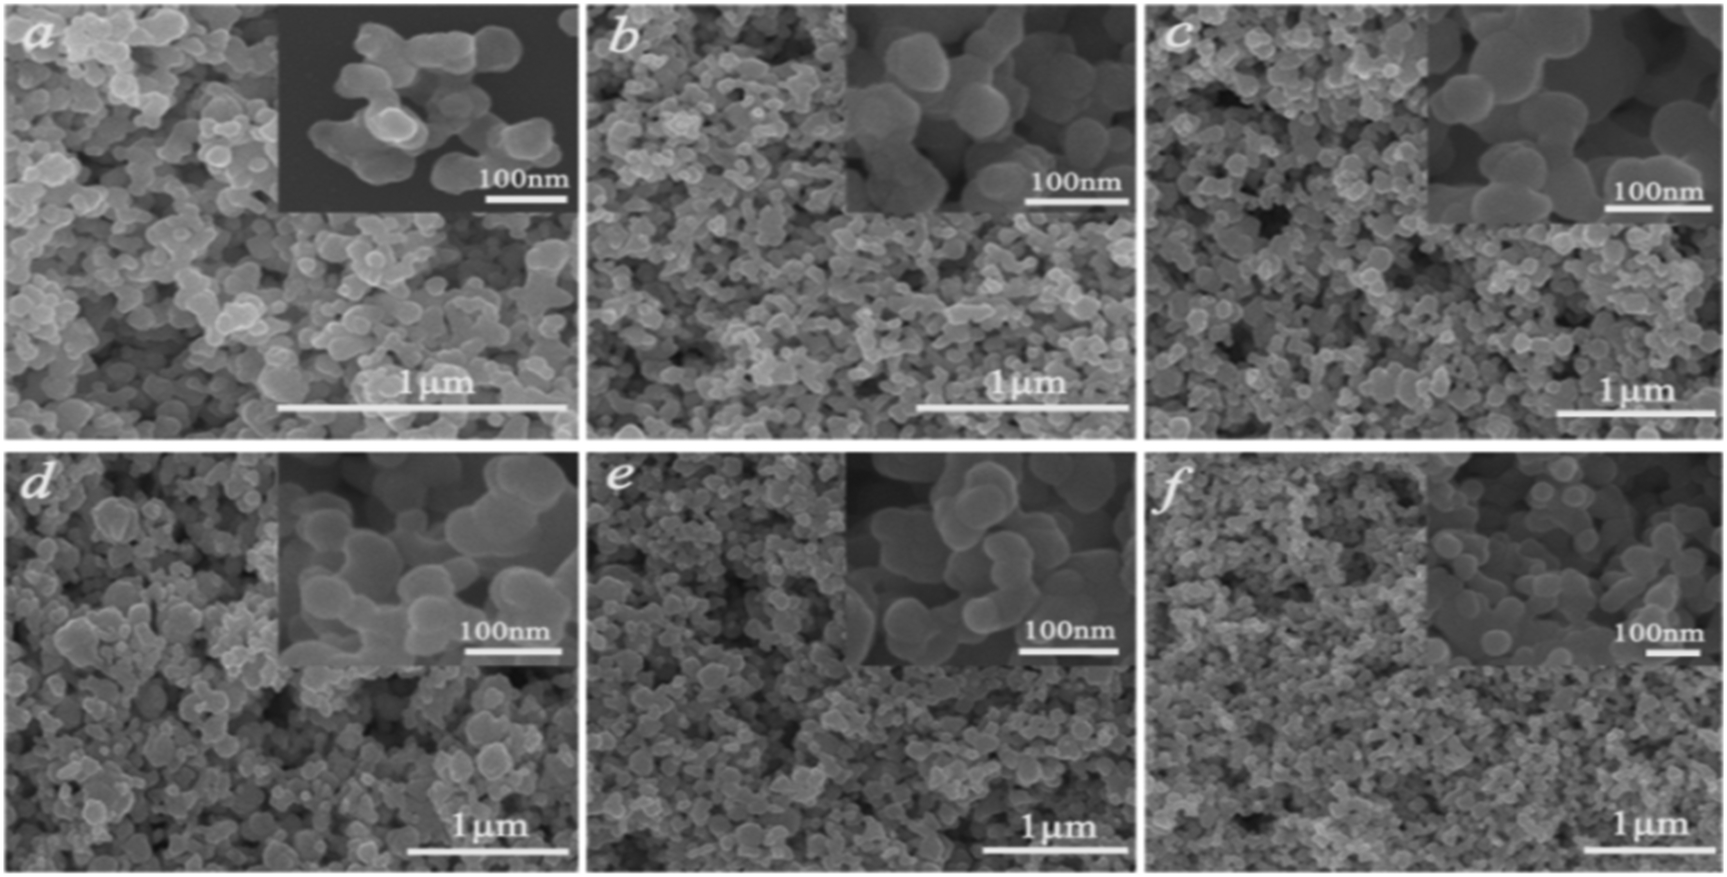 | ||
| Fig. 3 SEM images of the K0.3Bi0.7F2.4 samples at different reaction times. (a) 1 min, (b) 5 min, (c) 30 min, (d) 1 h, (e) 3 h, (f) 6 h. | ||
The XRD patterns plotted in Fig. 4 clearly show pure phase K0.3Bi0.7F2.4 for all the products synthesized at different mole ratios of Bi source and NH4F. In addition, when the mole ratio of the Bi source and NH4F is 1![[thin space (1/6-em)]](https://www.rsc.org/images/entities/char_2009.gif) :1, the yield of the precipitate in the reaction system significantly decreases, implying that the synthesis of the K0.3Bi0.7F2.4 is highly dependent on NH4F.
:1, the yield of the precipitate in the reaction system significantly decreases, implying that the synthesis of the K0.3Bi0.7F2.4 is highly dependent on NH4F.
 | ||
| Fig. 4 XRD patterns of the K0.3Bi0.7F2.4 samples synthesized at a reaction time of 30 min with the different mole ratios of Bi source and NH4F. | ||
In order to verify the aforementioned conjecture, a contrast experiment without using NH4F in the reaction solution was performed. We observed that precipitate is not generated in the solution after reacting for 6 h. The results demonstrate that NH4F plays a crucial role in the synthesis of K0.3Bi0.7F2.4 nanoparticles and the phase purity of K0.3Bi0.7F2.4 was not affected with the increase in the NH4F content.
Fig. 5 reveals the morphological evolution of K0.3Bi0.7F2.4 samples prepared by regulating the Bi:NH4F molar ratio. It is found from Fig. 5a that K0.3Bi0.7F2.4 samples obtained at a lower amount of NH4F (corresponding Bi:NH4F molar ratio of 1:1) are composed of smaller nanoparticles and the shape of the product presents quasispheres with a diameter of about 103 nm (Fig. S2a†), which is attributed to less nucleation due to the low concentration of NH4F in the reaction system. At the Bi:NH4F molar ratio of 1:2, the scale of spherical-like nanoparticles reduces to about 85 nm (Fig. S2b†). For the samples prepared at a Bi:NH4F molar ratio of 1:4, the diameter of the spheroidal nanoparticles is approximately 76 nm (Fig. S2c†). With further addition of NH4F to the synthesis system (Fig. 5d), the size of the nanoparticles was about 66 nm (Fig. S2d†). When the Bi:NH4F molar ratios are 1:8 (Fig. 5e) and 1:10 (Fig. 5f), the mean diameter of K0.3Bi0.7F2.4 decreases to 61 nm (Fig. S2e†) and 43 nm (Fig. S2f†), respectively. According to the experimental results, the change in the size of K0.3Bi0.7F2.4 presents a downward trend with the increase in the mole concentration of NH4F in the synthetic system due to the nucleation number induced by the concentration of NH4F. The results suggest that the presence of NH4F facilitates the preparation K0.3Bi0.7F2.4 samples with a smaller size.
 | ||
| Fig. 5 SEM images of the K0.3Bi0.7F2.4 samples at different mole ratios of Bi source and NH4F. (a) Bi:NH4F = 1:1, (b) Bi:NH4F = 1:2, (c) Bi:NH4F = 1:4, (d) Bi:NH4F = 1:6, (e) Bi:NH4F = 1:8, (f) Bi:NH4F = 1:10. | ||
It is well-known that fluoride as a fluorescent host can diminish the quenching of activator ions to generate effective radiative transition, particularly for UC luminescence. Thus, the Yb3+/Er3+ activated K0.3Bi0.7F2.4 nanoparticles with UC luminescence were synthesized.
The XRD patterns of as-synthesized K0.3Bi0.7F2.4:xYb3+, 2%Er3+ samples are illustrated in Fig. S3a.† It can be seen that all diffraction peaks of K0.3Bi0.7F2.4:xYb3+, 2%Er3+ crystals at different concentrations of Yb3+ correspond well with the pure phase K0.3Bi0.7F2.4 (PDF#: 84-0534). Fig. S3b† shows the photoluminescence emission spectra of K0.3Bi0.7F2.4:xYb3+, 2%Er3+ synthesized with different Yb3+ concentration and 2% Er3+. We note that the emission intensity of the samples increases at first with the increase in the Yb3+ concentration and then decreases when Yb3+ concentration reaches 20%. Hence, K0.3Bi0.7F2.4:20%Yb3+, 2%Er3+ was selected in the subsequent experiments to study its luminescence characteristics and temperature sensing performance.
3.2 Phase identification, morphology and luminescence properties of the K0.3Bi0.7F2.4:20% Yb3+, 2%Er3+ products
The structure, morphology, and UC luminescence properties of K0.3Bi0.7F2.4 nanoparticles were first investigated using Er3+ as an activator and Yb3+ as a sensitizer. K0.3Bi0.7F2.4:20%Yb3+, 2%Er3+ samples were prepared under 1 min reaction time at room temperature using the chemical precipitation method. As exhibited in Fig. 6a, all the diffraction peaks of the samples obtained are well-defined with the crystal structure of K0.3Bi0.7F2.4 (PDF#: 84-0534) with lattice parameters of a = b = c = 5.89 Å, α = β = γ = 90°, V = 204.34 Å3, and a space group of Fm![[3 with combining macron]](https://www.rsc.org/images/entities/char_0033_0304.gif) m(225). Fig. 6b reveals the SEM images of as-prepared K0.3Bi0.7F2.4:20%Yb3+, 2%Er3+ samples in 1 min. With the doping of Yb3+ and Er3+ ions, the morphology of products is consistent with that of pure K0.3Bi0.7F2.4 nanoparticles and maintains a relatively narrow size distribution. The results indicate that the introduction of Yb3+ and Er3+ as doped ions did not have a significant influence on the structure and morphology of the K0.3Bi0.7F2.4 nanoparticles. To determine the element composition, the EDX spectrum (Fig. 6c) of K0.3Bi0.7F2.4:20%Yb3+, 2%Er3+ nanoparticles was recorded. It can be seen that the chemical compositions of the as-synthesized samples include K, Bi, F, Yb and Er elements, and no impurity elements existed, suggesting that the Yb3+ and Er3+ ions are successfully doped into the K0.3Bi0.7F2.4 host lattice. Furthermore, the FT-IR spectrum of the K0.3Bi0.7F2.4:20%Yb3+, 2%Er3+ nanoparticles was recorded to confirm the existence of EG on the surface of nanoparticles. As displayed in Fig. 6d, the peaks located at 3233 cm−1 and 1657 cm−1 correspond to the stretching vibrations of the O–H. The sharp peak at 1439 cm−1 and 1084 cm−1 belongs to the H–O–H stretching vibration and C–O stretching mode, respectively. In addition, the characteristic absorption peaks at 2339 cm−1 can be ascribed to the CO2 derived from the surrounding environment.
m(225). Fig. 6b reveals the SEM images of as-prepared K0.3Bi0.7F2.4:20%Yb3+, 2%Er3+ samples in 1 min. With the doping of Yb3+ and Er3+ ions, the morphology of products is consistent with that of pure K0.3Bi0.7F2.4 nanoparticles and maintains a relatively narrow size distribution. The results indicate that the introduction of Yb3+ and Er3+ as doped ions did not have a significant influence on the structure and morphology of the K0.3Bi0.7F2.4 nanoparticles. To determine the element composition, the EDX spectrum (Fig. 6c) of K0.3Bi0.7F2.4:20%Yb3+, 2%Er3+ nanoparticles was recorded. It can be seen that the chemical compositions of the as-synthesized samples include K, Bi, F, Yb and Er elements, and no impurity elements existed, suggesting that the Yb3+ and Er3+ ions are successfully doped into the K0.3Bi0.7F2.4 host lattice. Furthermore, the FT-IR spectrum of the K0.3Bi0.7F2.4:20%Yb3+, 2%Er3+ nanoparticles was recorded to confirm the existence of EG on the surface of nanoparticles. As displayed in Fig. 6d, the peaks located at 3233 cm−1 and 1657 cm−1 correspond to the stretching vibrations of the O–H. The sharp peak at 1439 cm−1 and 1084 cm−1 belongs to the H–O–H stretching vibration and C–O stretching mode, respectively. In addition, the characteristic absorption peaks at 2339 cm−1 can be ascribed to the CO2 derived from the surrounding environment.
 | ||
| Fig. 6 XRD patterns of the K0.3Bi0.7F2.4:20%Yb3+, 2%Er3+ samples (a), SEM images (b), EDX spectrum (c), and FT-IR spectrum (d) of K0.3Bi0.7F2.4:20%Yb3+, 2%Er3+ samples prepared at 1 min. | ||
Fig. 7a reveals the TEM image of the sample, which further verifies that the K0.3Bi0.7F2.4:20%Yb3+, 2%Er3+ nanoparticles possess a spheroidal morphology. The high-resolution TEM (HRTEM) image of a selected area for K0.3Bi0.7F2.4:20%Yb3+, 2%Er3+ nanoparticles presents a highly crystalline nature, which is consistent with the XRD results, as illustrated in Fig. 7b. The clear lattice fringes with an interplanar distance of 0.29 nm can be detected, which is in good agreement with the (200) plane of K0.3Bi0.7F2.4.
 | ||
| Fig. 7 TEM images of the K0.3Bi0.7F2.4:20%Yb3+, 2%Er3+ samples obtained at 1 min (a), HRTEM image (b), intensity plot of interlayer distance for the (200) plane (c) and FFT pattern (d). | ||
Based on the HRTEM image of nanoparticles, a fast Fourier transform (FFT) pattern was obtained, which indicated a single-crystalline nature of the products and exhibited a well-defined structure with lattice fringe spacings of 0.21 and 0.34 nm corresponding to the (220) and (111) planes of K0.3Bi0.7F2.4.
Fig. 8a shows the UC emission spectra of 20%Yb3+/2%Er3+ doped K0.3Bi0.7F2.4 nanoparticles. Under 980 nm NIR excitation, the spectrum of K0.3Bi0.7F2.4:20%Yb3+/2%Er3+ nanoparticles exhibits the typical UC emissions of Er3+ ions. The result is consistent with previous literature.20 Hereinto, the green UC emissions located at 522 and 541 nm originate from the transitions 2H11/2 → 4I15/2 and 4S3/2 → 4I15/2, respectively, and the red UC emission located at 651 nm corresponds to the 4F9/2 → 4I15/2 transition. To study the UC mechanism, we measured the UC luminescence of the samples under a series of excitation pump power (Fig. 8b). It is well known that the relationship between the UC emission intensity (Iem) of the samples and excitation pump power intensity (IP) of the laser is expressed via the following formula: Iem ∝ IPn, where n is the number of pump photons absorbed in the UC process and can be calculated from the slope of the natural logarithmic plot.22,23 The experimental data in Fig. 8c are fitted by the function Ln(Iem) and Ln(IP), revealing that the slopes for 2H11/2–4I15/2, 2S3/2–4I15/2 and 4F9/2 → 4I15/2 (Er3+, 522 nm, 541 nm, 651 nm) are 2.03 ± 0.03, 1.89 ± 0.03 and 2.08 ± 0.08 corresponding to two-photon (green and red) energy transfer processes. These results are consistent with previous reports.24,25
 | ||
| Fig. 8 Photoluminescence emission spectra of (a) K0.3Bi0.7F2.4:20% Yb3+, 2% Er3+ under 980 nm excitation, (b) UC emission spectra of the K0.3Bi0.7F2.4:20% Yb3+, 2% Er3+ at the different pumping powers under 980 nm excitation, (c) Ln–Ln plots of the up-conversion emission intensity versus pump power for the K0.3Bi0.7F2.4:20%Yb3+, 2%Er3+ nanoparticles under 980 nm laser radiation. | ||
To clearly explain the UC mechanism, the detailed schematic energy level diagram and possible UC mechanism are shown in Fig. 9. Under the 980 nm laser diode excitation, the 4I15/2 level of Er3+ ions is excited to 4I11/2 and 4F7/2 levels by absorbing the energy from Yb3+ ions. Then, the 4F7/2 level nonradiatively relaxes to 2H11/2 and 4S3/2 states. Meanwhile, the 2H11/2 and 4S3/2 level can relax to the ground emitting green light near 522 nm and 541 nm.
 | ||
| Fig. 9 Energy level diagrams showing the UC of the K0.3Bi0.7F2.4:20%Yb, 2%Er upon excitation at 980 nm. | ||
Subsequently, the 4I11/2 state of Er3+ can also relax to 4I13/2 and then populate to the 4F9/2 energetic state by absorbing energy from Yb3+. Finally, the Er3+ in the 4F9/2 state transfers to the 4I15/2 state resulting in red light emission near 651 nm.26,27
3.3 Temperature sensing of samples
Aiming at exploring the probability of the thermometry application, the temperature sensing performance of the K0.3Bi0.7F2.4:20%Yb3+, 2%Er3+ nanoparticles has been investigated. It is known that the energy gap of the Er3+ between 2H11/2 and 4S3/2 states is about 750–850c m−1.28 Thus, the 2H11/2 states can be populated from 4S3/2 states because of the thermal coupling arising from this small energy separation. Finally, the emission intensity of 2H11/2–4I15/2 and 2S3/2–4I15/2 had variations under an elevated temperature. This characteristic indicates that K0.3Bi0.7F2.4:20%Yb3+, 2%Er3+ may be applied in the temperature sensor using the FIR technique. Fig. 10a shows the normalized green emission spectra of Er3+ ions by 980 nm excitation (laser power = 1.5 W) at the temperature range from 323 to 523 K. As plotted in Fig. 10a, it is clear that the emission intensity ratio of the 2H11/2–4I15/2/2S3/2–4I15/2 increases with the increase in temperature because of the Boltzmann-type distribution. According to the Boltzmann's equation, the fluorescence intensity ratio (R) can be defined as follows:29,30 | (1) |
R(I522nm/I541nm) can be well-fitted with relevant equations in Fig. 10(c) and (d) with good linear fitting degree values (r2 value is 0.99). The slope and intercept values given by the linear fitting result are 2.69 and 1271.96, respectively. At last, the ΔE and constant C are 0.11 eV and 16.79, respectively. Besides, sensitivity is also a significant parameter to evaluate the temperature sensing application. It is worth investigating, which can be determined by:31–33 | (2) |
 | (3) |
 | ||
| Fig. 10 (a) Temperature-dependent normalized green emission spectra of K0.3Bi0.7F2.4:20%Yb3+, 2%Er3+ nanoparticles under 980 nm excitation (laser power = 1.5 W). (b) Relationship between R and the absolute temperature. (c) Monolog plots of Ln(R) as a function of inverse absolute temperature. (d) The sensitivity of K0.3Bi0.7F2.4:20%Yb3+, 2%Er3+ nanoparticle as a function of absolute temperature. | ||
| Compounds | λ ex [nm] | T [K] | S a [K−1] | S r [K1] | Ref. |
|---|---|---|---|---|---|
| α-NaLuF4:Yb3+/Er3+ | 980 | 150–298 | 0.0022 | — | 36 |
| CaZnOS:Er3+ | 980 | 303–603 | 0.0033 | — | 37 |
| NaBiF4:Er3+/Yb3+/Fe3+ | 980 | 303–543 | 0.0053 | — | 38 |
| Bi4Ti3O12:Er3+ | 980 | 115–490 | 0.0043 | — | 39 |
| KEr3F10:Er3+ | 980 | 303–573 | 0.00398 | — | 40 |
| BiPO4:Er3+/Yb3+ | 980 | 313–573 | 0.00413 | 1.10% | 41 |
| BiOCl:Yb3+, Er3+ | 980 | 298–778 | 0.0028 | — | 42 |
| Bi3Ti1.5W0.5O9:Er3+ | 980 | 83–423 | 0.00314 | — | 43 |
| Na0.5Bi0.5TiO3:Er/Yb– | 980 | 93–613 | 0.0031 | — | 44 |
| Er, Yb:GdVO4@SiO2 | 980 | 297–343 | — | 1.01% | 45 |
| K0.3Bi0.7F2.4:Yb3+/Er3+ | 980 | 323–523 | 0.0058 | 1.08% | This work |
Pump power and time-dependent up-conversion luminescence spectra of K0.3Bi0.7F2.4:20%Yb3+, 2%Er3+ are plotted in Fig. 11a to verify the heating effect caused by 980 laser excitation. In addition, the luminescence spectra were recorded under 1.5 W (980 nm) excitation at persistent irradiation measured within 40 min in Fig. 11b.45,46 As it can be seen that for the different powers of 980 nm excitation the value of FIR barely changed. Therefore, no pump induced heating is observed.46 Furthermore, the value of FIR remained almost constant under persistent irradiation measured within 40 min, manifesting that the temperature of the material does not change greatly.
 | ||
| Fig. 11 (a) FIR of the K0.3Bi0.7F2.4:20%Yb3+, 2%Er3+ nanoparticles under 980 nm excitation at different power at room temperature, (b) FIR of the K0.3Bi0.7F2.4:20%Yb3+, 2%Er3+ nanoparticles under 1.5 W (980 nm) excitation at persistent irradiation measured within 40 min. | ||
4. Conclusions
In summary, we have successfully developed an ultrafast synthetic strategy to prepare K0.3Bi0.7F2.4 nanoparticles based on the facile chemical precipitation method at room temperature. The shape of the product is the spherical-like nanoparticles, and the average diameter of the samples decreased by regulating the mole ratio of the Bi source and NH4F. However, the average diameter of the samples is no longer changed based on different reaction times. Furthermore, we have investigated the UC Photoluminescence properties and UC mechanism. In addition, this new K0.3Bi0.7F2.4:20%Yb3+, 2%Er3+ phosphors could be used as a potentially useful temperature sensor utilizing the FIR technology due to the temperature-dependent property of K0.3Bi0.7F2.4:20%Yb3+, 2%Er3+ phosphors revealing a linear relation at 323–523 K under 980 nm excitation and relatively high sensitivity.Conflicts of interest
There are no conflicts to declare.Acknowledgements
This work is financially supported by Natural Science Foundation of Tianjin, Key Project (no. 17JCZDJC37800) and National Natural Science Foundation of China (no. 11674183).References
- S. Wu, X. Sun, Z. Meng and S. Zhang, CrystEngComm, 2017, 19, 3600–3606 RSC.
- X. Chen, C. Sun, S. Wu and D. Xue, Phys. Chem. Chem. Phys., 2017, 19, 8835–8842 RSC.
- L. Liu, Y. Liang, L. Li, L. Zou and S. Gan, CrystEngComm, 2015, 17, 7754–7761 RSC.
- L. Luo, W. Ran, P. Du, W. Li and D. Wang, Adv. Mater. Interfaces, 2020, 7, 1902208 CrossRef CAS.
- X. Li, M. Peng, J. Cao, Z. Yang and S. Xu, J. Mater. Chem. C, 2018, 6, 7814–7821 RSC.
- M. A. Antoniak, S. J. Zelewski, R. Oliva, A. Zak, R. Kudrawiec and M. Nyk, ACS Appl. Nano Mater., 2020, 3(5), 4209–4217 CrossRef CAS.
- P. Lei, R. An, X. Zhai, S. Yao, L. Dong, X. Xu, K. Du, M. Zhang, J. Feng and H. Zhang, J. Mater. Chem. C, 2017, 5, 9659–9665 RSC.
- D. Chen, Z. Wan and Y. Zhou, Sens. Actuators, B, 2016, 226, 14–23 CrossRef CAS.
- F. Li, J. Cai, F. Chi, Y. Chen, C. Duan and M. Yin, Opt. Mater., 2017, 66, 447–452 CrossRef CAS.
- L. Tong, X. Li, J. Zhang, S. Xu, J. Sun, H. Zheng, Y. Zhang, X. Zhang, R. Hua, H. Xia and B. Chen, Opt. Express, 2017, 25, 16047–16058 CrossRef CAS.
- R. Bao, N. An, L. Ye and L. Wang, Opt. Fiber Technol., 2019, 52, 101989 CrossRef CAS.
- G. Yi, H. Lu, S. Zhao, Y. Ge, W. Yang, D. Chen and L. Guo, Nano Lett., 2004, 4, 2191–2196 CrossRef CAS.
- S. Heer, K. Kömpe, H. U. Güdel and M. Haase, Adv. Mater., 2004, 16, 2102–2105 CrossRef CAS.
- L. Wang and Y. Li, Chem. Mater., 2007, 19, 727–734 CrossRef CAS.
- B. Zhou, B. Shi, D. Jin and X. Liu, Nat. Nanotechnol., 2015, 10, 924 CrossRef CAS.
- Y. Zhou, S. Ren, Q. Dong, Y. Li and H. Ding, RSC Adv., 2016, 6, 102875–102885 RSC.
- P. Lei, P. Zhang, Q. Yuan, Z. Wang, L. Dong, S. Song, X. Xu, X. Liu, J. Feng and H. Zhang, ACS Appl. Mater. Interfaces, 2015, 7, 26346–26354 CrossRef CAS.
- R. Mohan, Nat. Chem., 2010, 2, 336 CrossRef CAS.
- H. Li, R. Pang, G. Liu, W. Sun, D. Li, L. Jiang, S. Zhang, C. Li, J. Feng and H. Zhang, Inorg. Chem., 2018, 57, 12303–12311 CrossRef CAS.
- R. An, P. Lei, P. Zhang, X. Xu, J. Feng and H. Zhang, Nanoscale, 2018, 10, 1394–1402 RSC.
- P. Lei, R. An, S. Yao, Q. Wang, L. Dong, X. Xu, K. Du, J. Feng and H. Zhang, Adv. Mater., 2017, 29, 1700505 CrossRef.
- H. Li, G. Liu, J. Wang, X. Dong and W. Yu, Phys. Chem. Chem. Phys., 2016, 18, 21518–21526 RSC.
- R. Krishnan and J. Thirumalai, New J. Chem., 2014, 38, 3480–3491 RSC.
- S. Ye, G. Chen, W. Shao, J. Qu and P. Prasad, Nanoscale, 2015, 7, 3976 RSC.
- G. Chen, H. Liu, G. Somesfalean, H. Liang and Z. Zhang, Nanotechnology, 2009, 20, 385704 CrossRef.
- H. Dong, L. Sun and C. Yan, Chem. Soc. Rev., 2015, 44, 1608 RSC.
- L. Zhou, X. Zheng, Z. Gu, W. Yin, X. Zhang, L. Ruan, Y. Yang, Z. Hu and Y. Zhao, Biomaterials, 2014, 35, 7666–7678 CrossRef CAS.
- J. Zhang, B. Ji, G. Chen and Z. Hua, Inorg. Chem., 2018, 57, 5038–5047 CrossRef CAS.
- A. Zhou, F. Song, Y. Han, F. Song, D. Ju and X. Wang, CrystEngComm, 2018, 20, 2029–2035 RSC.
- A. Zhou, F. Song, W. Yao, Y. Han, F. Song, W. Wu, C. Ming, D. Ju and A. Khan, J. Alloys Compd., 2018, 775, 457–465 CrossRef.
- D. Chen, S. Liu, W. Xu and X. Li, J. Mater. Chem. C, 2017, 5, 11769–11780 RSC.
- P. Du, L. Luo and J. S. Yu, J. Alloys Compd., 2015, 632, 73–77 CrossRef CAS.
- J. Xue, H. Noh, B. Choi, S. Park, J. Kim, J. Jeong and P. Du, Chem. Eng. J., 2020, 382, 122861 CrossRef CAS.
- P. Du, L. Luo, H. Park and J. Yu, Chem. Eng. J., 2016, 306, 840–848 CrossRef CAS.
- P. Du, Y. Hou, W. Li and L. Luo, Dalton Trans., 2020, 49, 10224–10231 RSC.
- L. Hao, D. Xu, A. Li, S. Yang and Y. Zhang, J. Fluorine Chem., 2016, 192, 41–47 CrossRef.
- H. Zhang, D. Peng, W. Wang, L. Dong and C. Pan, J. Phys. Chem. C, 2015, 119, 28136–28142 CrossRef CAS.
- P. Du, Q. Zhang, X. Wang, L. Luo and W. Li, J. Alloys Compd., 2019, 805, 171 CrossRef CAS.
- T. Wei, T. Zhang, Y. Ma, Y. Xie, C. Zhao, F. Yang, H. Xiao and Y. Zhao, RSC Adv., 2016, 6, 7643–7652 RSC.
- P. Du, L. Luo, W. Li and Q. Yue, J. Appl. Phys., 2014, 116, 014102 CrossRef.
- N. Wang, Z. Fu, Y. Wei and T. Sheng, J. Alloys Compd., 2019, 772, 371 CrossRef CAS.
- P. Du, L. Luo and J. S. Yu, Microchim. Acta, 2017, 184, 2661 CrossRef CAS.
- Y. Zhang, J. Li, X. Chai, X. Wang, Y. Li and X. Yao, J. Appl. Phys., 2017, 121, 124102 CrossRef.
- P. Du, L. Luo, W. Li and Q. Yue, J. Appl. Phys., 2014, 116, 014102 CrossRef.
- J. Cai, L. Zhao, F. Hu, X. Wei, Y. Chen, M. Yin and C. Duan, Inorg. Chem., 2017, 56(7), 4039–4046 CrossRef CAS.
- A. Zhou, F. Song, F. Song, M. Feng, K. Adnan, D. Ju and X. Wang, Opt. Mater., 2018, 78, 438–444 CrossRef CAS.
Footnote |
| † Electronic supplementary information (ESI) available. See DOI: 10.1039/d0ce01231a |
| This journal is © The Royal Society of Chemistry 2020 |