 Open Access Article
p-Synephrine enantiomers: binary phase diagram, crystal structure and kinetic stability of a metastable conglomerate monitored by nonlinear optics†
Veronica
Ianno
a,
Simon
Clevers
 b,
Philippe
Négrier
c,
Valérie
Dupray
b,
Gérard
Coquerel
b and
Philippe
Espeau
b,
Philippe
Négrier
c,
Valérie
Dupray
b,
Gérard
Coquerel
b and
Philippe
Espeau
 *a
*a
aChemical and Biological Technologies for Health (UTCBS), CNRS UMR8258, INSERM U1022, Paris Descartes University, Sorbonne-Paris-Cité, Chimie ParisTech, PSL Research University, School of Pharmacy, 4 avenue de l'Observatoire, 75006 Paris, France. E-mail: philippe.espeau@u-paris.fr
bLaboratoire Ondes et Matière d'Aquitaine, Université de Bordeaux, UMR CNRS 5798, 351 cours de la Libération, 33405 Talence Cedex, France
cSMS Laboratory EA 3233, University of Rouen Normandie, 76821 Mont Saint Aignan, France
First published on 2nd September 2020
Abstract
The crystal structure of (S)-(+)-p-synephrine was refined at 296 K from X-ray powder diffraction. The compound crystallizes in the orthorhombic system P212121 with four molecules per unit cell and Z′ = 1. The cell parameters are equal to a = 6.5925(12) Å, b = 7.9915(14) Å, and c = 17.035(4) Å. The melting characteristics of the enantiomers were determined at high DSC scan rates. The pure enantiomers melt at Tfus = 176.6 ± 0.9 °C with a melting enthalpy equal to 234.2 ± 3.9 J g−1. Coupling DSC and crystallographic analysis, a stable binary phase diagram between these chiral molecules was established taking into account the racemic compound. Two symmetrical eutectic invariants at: 172.7 ± 0.5 °C for x = 0.05 and x = 0.95 were found pretty close to the melting temperature of the enantiomers. Additionally, the equimolar mechanical mixture of the two enantiomers led to a metastable conglomerate whose melting temperature was estimated to be 149 °C, thanks to the Schröder–van Laar relation. The activation energy of the transition from the metastable conglomerate toward the racemic compound was estimated to be Ea = 145 kJ mol−1 by a nonlinear optical method. This new isothermal second harmonic generation application performed at different temperatures is of general applicability for the assessment of the activation energy associated with the irreversible heterogeneous reaction: <R> + <S> → <RS>.
Introduction
p-Synephrine (C9H13NO2) is an alkaloid naturally contained in some plants.1p-Synephrine is the para isomer of synephrine (Scheme 1). It is a chiral molecule whose equimolar mixture of the two enantiomers (R)-(−) and (S)-(+) crystallizes as a racemic compound. | ||
| Scheme 1 Molecular structure of p-synephrine: (R)-(−)-4-[1-hydroxy-2-(methylamino)ethyl]phenol (left) and (S)-(+)-4-[1-hydroxy-2-(methylamino)ethyl]phenol (right). | ||
The crystal structure of the crystalline racemic compound was previously solved in a monoclinic system (space group P21/c, Z = 4 (Z′ = 1), with a = 8.8504(11) Å, b = 12.1166(15) Å, c = 9.7820(11) Å, and β = 122.551(2)°).2 The melting point of the racemic compound was found to be equal to 199.8 ± 1.3 °C with a melting enthalpy of 57 ± 3 kJ mol−1.2
Regarding the enantiomers, the melting point has been estimated at 169 °C (ref. 3) but no indication was given on the measurement technique of the melting point and no enthalpy value was determined. As for the racemic compound, the enantiomers degrade upon melting. To bypass the degradation process occurring upon melting, differential scanning calorimetry (DSC) can be conducted at high DSC scan rates, as has been previously demonstrated.2,4 Then, values of temperature and enthalpy of melting can be proposed with accuracy. As far as the crystal structure of the enantiomer is concerned, nothing was reported in the literature. So to complete the study on this chiral molecule, the crystal structure of the enantiomer was determined from X-ray powder diffraction data obtained at room temperature.
The relative stability between the racemic compound and the enantiomers was established by constructing a stable binary phase diagram between one of the two enantiomers and the racemic compound. This study also reports the study of the transition of a metastable conglomerate to the racemic compound by second harmonic generation temperature resolved microscopy (SHG-TR-M). From the results, the activation energy of the transition is then estimated.
Experimental
Chemicals
The samples of pure enantiomers were kindly provided to us by the pharmacognosy laboratory of the Faculty of Pharmacy of Paris 5, with an enantiomeric purity, established by chromatography, of 98% for the (R)-enantiomer and 99% for the (S)-enantiomer. The racemic compound was purchased from Sigma Aldrich, with purity higher than 98%. All the compounds were used without further purification.X-ray diffraction
X-ray powder diffraction experiments were performed with a horizontally mounted cylindrical position-sensitive detector CPS-120 (Debye–Scherrer geometry, transmission mode) from INEL, using monochromatic Cu Kα1 radiation (λ = 1.54056 Å), selected with an asymmetric focusing incident-beam curved quartz monochromator. The generator power was set to 1.0 kW (40 kV and 25 mA). The detector consisted of 4096 channels providing an angular step of 0.029° (2) between 4° and 120°. External calibration using the Na2Ca2Al2F14 (NAC) cubic phase mixed with silver behenate was performed by means of cubic spline fittings. From that, each channel was converted into a diffraction angle.The samples were gently crushed before being introduced into Lindemann glass capillaries with a 0.5 mm inner diameter, which were then rotated perpendicular to the X-ray beam direction in order to decrease as much as possible the effects of preferred orientations.
The crystal structure was determined with the reflex plus module of Materials Studio Modeling 5.5.5 First, the pattern was indexed by means of the peak picking option of the software package. Potential solutions for cell parameters and space group were found using the X-cell algorithm.6 Then, a Pawley profile-fitting procedure was applied including refined cell parameter experimental profile fitting with a pseudo-Voigt function, zero shift and asymmetry Finger–Cox–Jephcoat function.7 Distances, angles and torsions in the molecule were obtained via energy-minimization calculations with the Forcite module using the Dreiding force field.8 Then, a Monte-Carlo approach, included in the reflex plus module, was carried out in the direct space to solve the structure moving the molecule as a rigid-body and allowing the change of the chain torsion angles.9
Thermal analysis
Differential scanning calorimetry experiments were performed using an 822e thermal analyser, equipped with an FRS5 sensor, from Mettler-Toledo (Switzerland). The DSC experiments were carried out in the 25–200 °C temperature range at different scan rates from 5 to 100 °C min−1 under a constant nitrogen flow. Temperature and enthalpy calibration of the apparatus were carried out at 10 °C min−1 using indium and zinc as standards. The multiple thermocouple sensor technology of the device combined with furnace and sample tau lag calibration eliminates the influence of the heating rate on temperature and heat flux measurements.10 The tau lag was calibrated for scan rates ranging from 5 to 100 °C min−1, using the procedure described by the manufacturer. Regarding the enthalpy values, the relative standard uncertainty in the values (average of six independent values) was estimated at 5%. For all the experiments, an empty aluminum pan was used as the reference. The melting temperatures were determined at the onset of the corresponding endotherms. p-Synephrine samples (approximately 2.5 mg) were weighed with a microbalance sensitive to 1 μg and then introduced into a crucible with a perforated cover. The crystal size distributions of the samples were not taken into account. The standard uncertainty in the temperatures was determined from the standard deviation, with 0.68 level of confidence, of six independent measurements for each enantiomer performed for each scan rate. Mean values of melting temperatures and enthalpies were obtained by averaging the values of three independent measurements of each enantiomer.Second harmonic generation microscopy (SHG-M)
An Insight X3 single laser with automated dispersion compensation (Spectra-Physics, Santa Clara, USA) and a TCS SP8 MP confocal microscope (Leica Microsystems, Wetzlar, Germany) were used to perform confocal microscopy of the samples. The laser cavity had an average power of over 2.50 W at 900 nm and was tunable from 680 nm to 1300 nm. The repetition rate was 80 MHz and the temporal width at the output of the cavity was around 120 fs (<100 fs between 850 nm and 1050 nm). The laser was controlled with the LASX Leica software. Two Leica hybrid descanned detectors (HyD) were used to record images. Microscope objectives were long working distance dry Leica objectives (HC PL Fluotar 5× NA 0.15, HC PL Fluotar 10× NA 0.3 or HC PL APO 20× NA 0.4 CS2). An electro-optical modulator was used to adjust the laser power at the entrance of the confocal system.The spectral acquisition was performed using an internal hybrid detector. Collected photons were dispersed by a prism and a specific motorized split mirror selected the spectral detected band before the hybrid detector. Acquisitions were performed between 380 nm and 780 nm every 3 nm and a spectral bandwidth of 5 nm. Typically, the sample is excited at a given wavelength (e.g. 1200 nm or 900 nm) while scanned through the emission wavelength (e.g. in the 380–780 nm range). The SHG and THG should appear at the half and at the third of the excitation wavelength, respectively.
Temperature resolved SHG-M
The samples (few mg of powder in an amorphous silica crucible) were placed in a computer-controlled heating/cooling stage (Linkam THMS-600) and were irradiated with the femtosecond laser beam. The samples were cooled and heated between 20 °C and 160 °C at different heating rates. For isothermal monitoring, the sample was heated at the isothermal temperature at a heating rate of 100 °C min−1.Sample preparation of binary mixtures
The binary mixtures were prepared by mixing in different ratios the racemic compound and one of the enantiomers directly in the DSC pan and the homogenization was carried out by mechanical stirring for 15 minutes. The samples were then introduced at room temperature in DSC aluminum pans, which were hermetically sealed.Results and discussion
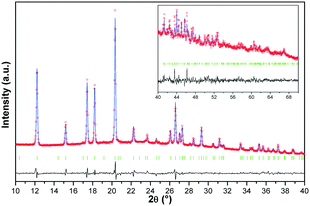
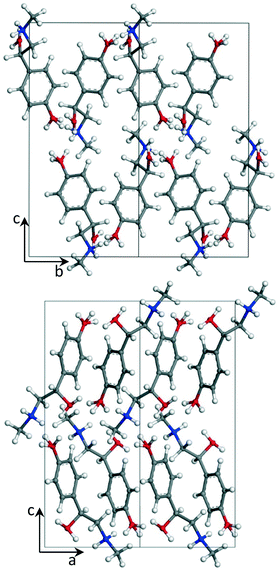
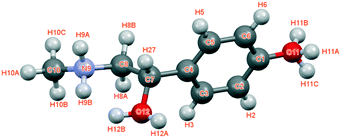
The crystal structure of the p-synephrine enantiomer was achieved from the (S)-(+)-enantiomer at 296 K. It crystallizes in the orthorhombic space group P212121 with a = 6.5925(12) Å, b = 7.9915(14) Å, and c = 17.035(4) Å with four molecules per unit cell (Z = 4, Z′ = 1). The agreement between the observed and computed diffraction patterns is estimated by an Rwp. The final Rietveld refinement (including Pawley refined parameters, rigid-body molecular units, torsions, preferred orientations and overall isotropic factor) converged to a final reliability factor Rwp value of 3.37 (Fig. 1). Rietveld refinement allowed us to propose the crystal structure presented in Fig. 2.The asymmetric unit with atom numbering is given in Fig. 3. The refinement was achieved by placing the hydrogen atoms in theoretical positions to get the best H-bonds. Then, as shown in Fig. 3, disorder has been introduced for the hydrogen atoms: two positions for the hydrogen atoms of the secondary amine (N9), two positions for the ones of the hydroxyl group (O12) and three positions for the ones of the hydroxyl group (O11). This leads to an occupancy factor of 0.33 for each hydrogen of the hydroxyl group (O11). The occupancy factors are equal to 0.67 for H9A and H12A and 0.33 for H9B and H12B.
The molecular structure is maintained through seven possible inter-molecular H-bonds (Table 1). The refinement also revealed two intra-molecular H-bonds via N9 and O12. This double interaction is caused by possible disorder of the hydrogen on the secondary amine and the hydroxyl group, as encountered for the racemic compound.2
| D | H | A | D–H (Å) | H⋯A (Å) | D⋯A (Å) | D–H⋯A (deg.) | Symmetry |
|---|---|---|---|---|---|---|---|
| (a) 1 − x, 1/2 + y, 1/2 − z; (b) 1/2 − x, 1 − y, −1/2 + z; (c) 1/2 − x, 1 − y, 1/2 + z; (d) 1 − x, −1/2 + y, 1/2 − z; (e) −x, −1/2 + y, 1/2 − z; (f) −x, 1/2 + y, 1/2 − z; (g) x, y, z. | |||||||
| N9 | H9A | O11 | 0.981(17) | 1.766(18) | 2.736(10) | 169.4(16) | a |
| N9 | H9B | O11 | 0.981(19) | 1.950(18) | 2.849(12) | 151.2(14) | b |
| O11 | H11A | N9 | 0.964(10) | 1.908(12) | 2.849(12) | 164.8(8) | c |
| O11 | H11B | N9 | 0.963(10) | 1.801(11) | 2.736(10) | 163.1(9) | d |
| O11 | H11C | O12 | 0.963(10) | 1.670(9) | 2.627(9) | 172.3(9) | e |
| O12 | H12A | O11 | 0.948(8) | 1.742(8) | 2.627(9) | 154.0(8) | f |
| O12 | H12B | O11 | 0.949(10) | 2.385(9) | 3.243(9) | 150.4(5) | b |
| N9 | H9B | O12 | 0.981(19) | 2.300(15) | 2.785(12) | 109.4(13) | g |
| O12 | H12B | N9 | 0.949(10) | 2.091(12) | 2.785(12) | 128.7(7) | g |
The main conformation differences between the asymmetric units of the enantiomer and the racemic form of p-synephrine are mainly noticeable for the hydroxy-methylamino-ethyl group (Fig. 4). The chain is therefore slightly more twisted in the enantiomer than that in the racemic compound (Table 2).
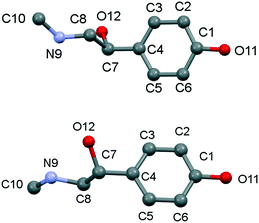 | ||
| Fig. 4 Conformation of (S)-(+)-p-synephrine asymmetric unit: enantiomer (top) and racemic compound (bottom). | ||
| Torsion angles | Enantiomer | Racemate | Difference |
|---|---|---|---|
| C3–C4–C7–O12 | −135.4 | −149.4 | 14 |
| C3–C4–C7–C8 | −69.6 | −87.6 | 18 |
| C4–C7–C8–N9 | −175.5 | 169.3 | 15.2 |
| C7–C8–N9–C10 | −162.4 | 180.0 | 17.6 |
DSC analyses were carried out at different heating rates on both enantiomers. Two independent samples of each enantiomer were analyzed for each heating rate. Then an average value was calculated for the melting temperature and enthalpy. On heating at low scan rates, both enantiomers of p-synephrine degrade upon and after melting, as can be seen in Fig. 5 for (R)-p-synephrine at 5 °C min−1. The apparent melting peak is then shifted to low temperatures due to mixing of the degraded product with the pure substance. The DSC signal shows an abrupt return to baseline followed by an exothermic peak characteristic of degradation. On increasing the DSC scan rate up to 100 °C min−1, the apparent melting temperature shifts to high temperatures and the degradation process moves to higher temperatures (Fig. 5). As previously reported, the decomposition reaction occurring upon melting is significantly shifted towards higher temperatures by increasing the heating rate.4,11,12
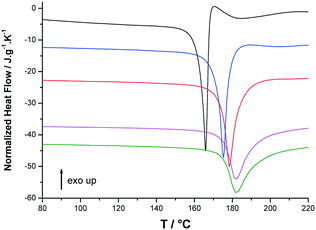 | ||
| Fig. 5 Selected normalized DSC curves of (R)-(−)-p-synephrine at 5 (black), 20 (blue), 40 (red), 80 (magenta) and 100 °C min−1 (green). | ||
The onset of the apparent melting temperature was reported as a function of the heating rate (Fig. 6A). The melting temperature increases with the scan rate to reach a plateau value at 176.6 ± 0.9 °C for high scan rates, much higher than the 169 °C reported in ref. 3.
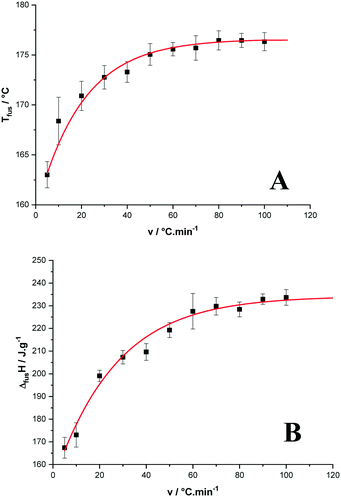 | ||
| Fig. 6 Temperature (A) and enthalpy (B) of melting of p-synephrine enantiomers as functions of the heating rate. | ||
As far as the apparent melting enthalpy is concerned, the same behavior was observed when the DSC scan rate increased. Then, the values plotted as a function of the scan rate led to a constant value at high scan rates equal to 234.2 ± 3.9 J g−1 (39.2 ± 0.7 kJ mol−1) as shown in Fig. 6B. By comparison, the racemic compound melts at a higher temperature with a higher enthalpy (199.8 ± 1.3 °C and 57 ± 3 kJ mol−1, respectively).2
Binary phase diagram between the racemic compound and enantiomers
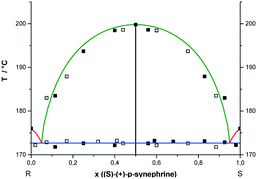
Different ratios between RS- and S- or R-enantiomers of p-synephrine were analyzed by DSC at different scan rates varying between 60 and 100 °C min−1. In Fig. 7, the experimental values determined from DSC experiments are presented. The representation takes into account that the points are doubled by symmetry with respect to x = 0.5, as explained in the caption of Fig. 6. The liquidus curves, obtained for the racemic compound using the Prigogine–Defay equation13 and for the enantiomers based on the Schröder–van Laar equation,14,15 are also presented in Fig. 7. The melting point characteristics of the racemic compound are from ref. 2 and from this work for the enantiomers. From these curves, the eutectic points were determined at x = 0.05 and 0.95 in the (S)-enantiomer. Those values fit reasonably well with our experimental data. The stable liquidi of the pure enantiomers are therefore pretty difficult to observe also because of the necessary fast heating rate. We acknowledge that the initial purity of the samples together with a certain chemical degradation on heating led us to propose a rather ‘rough’ binary phase diagram.The mean value of the eutectic temperature, obtained from the DSC curves, was determined at 172.7 ± 0.5 °C (445.7 ± 0.5 K). Moreover, no miscibility in the solid state between enantiomers nor any polymorphism was observed by powder X-ray diffraction (results not shown).
Metastable equilibria
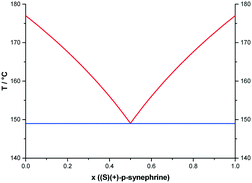
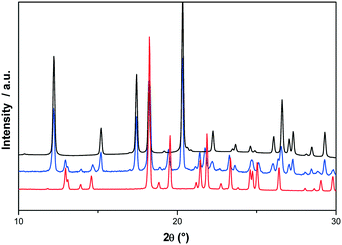
To consider the possibility of a metastable conglomerate, an attempt was made to draw the potential metastable phase diagram between the two enantiomers. Theoretically, the eutectic temperature should be obtained at circa 149 °C as assessed using the Schröder–van Laar relation14,15 and shown in Fig. 8.For that, the two enantiomers were directly mixed in equimolar proportions by mechanical stirring at room temperature. The diffraction pattern of a conglomerate was observed and remained unchanged even after several days of storage. Nevertheless, on heating the mixture, the X-ray diffraction experiments revealed that the equimolar physical mixture transformed into the racemic compound. As we can see in Fig. 9, the X-ray diffraction pattern of the equimolar mixture heated at 130 °C with a heating rate of 60 °C min−1 and quenched at room temperature is the superposition of the X-ray diffraction patterns of the pure enantiomer and the racemic compound.
DSC experiments were conducted on a 50/50 physical mixture of R- and (S)-p-synephrine with a scan rate of 60 °C min−1. Instead of obtaining a single peak, which corresponds to the melting of the eutectic composition, we obtained two peaks (Fig. 10), with an onset temperature corresponding to the eutectic temperature of the stable phase diagram (Fig. 7). This corroborates the fact that crystallization of the racemic compounds takes place when temperature is increased.
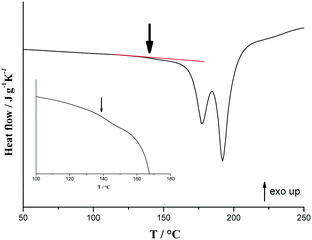 | ||
| Fig. 10 DSC curves of the 50/50 mixture of (R)-(−) and (S)-(+) p-synephrine obtained at 60 °C min−1. The inset corresponds to a zoom of the DSC trace of the metastable eutectic invariant. | ||
However, as indicated by the arrow in Fig. 10, a small endothermic event arises at around 145 °C. This signal could be the trace of the portion of the sample that remained as a conglomerate and therefore undergoes the eutectic reaction calculated at 149 °C. This suggests that the entire sample is not in the racemic compound form when the temperature of 172 °C is reached at 60 °C min−1. This is in line with the observation of the second peak in Fig. 10, which then corresponds to the crossing of the liquidus curve. Indeed, the composition which undergoes the eutectic reaction at 172 °C is no longer the equimolar composition.
Because of the weakness of the thermal event associated with the transition from the metastable conglomerate to the stable racemic compound, it is difficult or even impossible to monitor the kinetics of this phase transition by DSC.
Therefore, in order to determine the activation energy of this transformation, temperature resolved second harmonic generation microscopy (TR-SHG-M) was used. Among the various nonlinear effects, second harmonic generation (SHG) is certainly the most popular and can simply be viewed as the interaction of two electromagnetic waves (of the same frequency) in a material that gives rise to a third wave at twice the initial frequency. Nevertheless, SHG is only possible in non-centrosymmetric crystals. Therefore, this technique is of relevance to detect non-centrosymmetry and particularly dedicated to the monitoring of phase transitions involving at least one non-centrosymmetric phase. This technique is also thus useful when conglomerate and racemic compounds have to be differentiated.16
In order to quantify the SHG intensity emitted by (S)-(+)-p-synephrine and to check if the sample produces fluorescence (that can lead to misleading results), spectral emission scans at laser excitation wavelengths of 800 nm, 900 nm, 1000 nm, 1100 nm, 1200 nm and 1300 nm were performed and shown in Fig. S1.† The power of the laser was set to 0.12 W. Fig. S1† shows that (S)-p-synephrine produces a relatively strong SHG signal and (for excitation wavelengths of 800, 900 and 1000 nm) a very weak fluorescence. One can also notice that the SHG produced at an excitation wavelength of 900 nm is much higher than at other excitation wavelengths (e.g. 100 times higher compared to the second harmonic emitted at an excitation wavelength of 1300 nm). The small variation of the sensitivity of the detector with the wavelength does not change this ratio. This behavior is probably due to a greater phase mismatch for refractive indexes at 1300 nm and its second harmonic wavelength (650 nm).
To monitor the phase transition, the 900 nm excitation wavelength was selected. This choice is motivated by the weak fluorescence and the strong second harmonic signal at 450 nm that ensures good detection sensitivity.
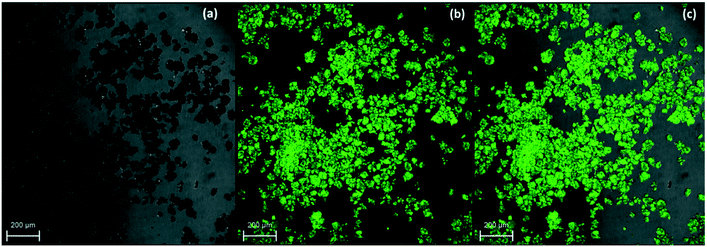
Fig. 11 shows the comparison between bright field and SHG images of an (S)-(+)-p-synephrine sample at the excitation wavelength of 900 nm. One can notice that each particle in the sample emits a second harmonic signal proving that each crystal is non-centrosymmetric.
Kinetic parameters
A common approach to determine the activation energy (Ea) is to track the conversion of the metastable phase by means of isothermal experiments at various temperatures. Isothermal transformation of p-synephrine racemic mixtures (i.e. mixture composition containing 50% of (R)-(−)-p-synephrine and 50% of (S)-(+)-p-synephrine) was studied by monitoring the time dependence of the SHG signal at different temperatures: 120 °C, 130 °C, 140 °C and 150 °C. The laser wavelength was 900 nm and the SHG signal was recorded at 450 nm ± 10 nm. The movies associated with each isotherm are available in ESI-1.† The movies show that the SHG signal progressively vanishes versus time during the solid–solid transformation (nevertheless, for a very long acquisition time, a liquid phase can appear, probably as a result of a slight chemical degradation). In Fig. 12, the SHG together with the BF and the overlays of both microscopy images are compared for acquisition times of 0 s (Fig. 12a) and 6700 seconds (Fig. 12b).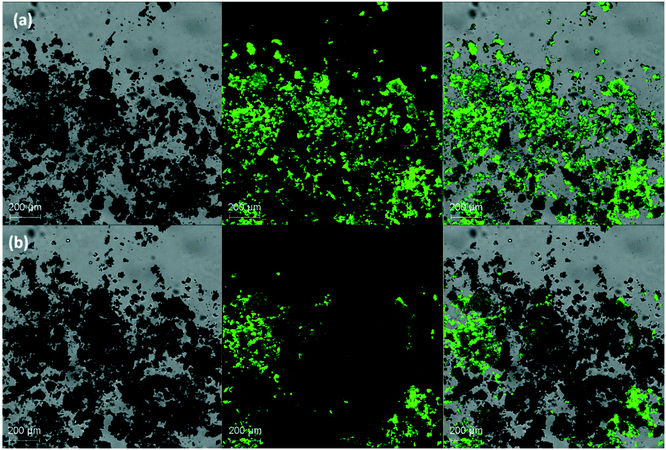 | ||
| Fig. 12 SHG-M, BF and overlay images of the p-synephrine physical racemic mixture of (R) and (S) crystals at 120 °C after 0 seconds (a) and circa 6700 seconds (b). | ||
The absence of signal means that the crystals evolved towards a centrosymmetric phase, most likely the racemic compound, as evidenced by thermal and XRPD analyses.
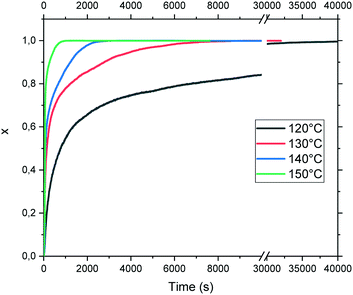
The evolution of the transformed fraction x versus time is plotted in Fig. 13: x is defined as the volume fraction of the stable phase (i.e. racemic compound) in the sample and is calculated from eqn (1):17
 | (1) |
The necessary time to complete the transition varies exponentially from circa 1100 seconds to 40![[thin space (1/6-em)]](https://www.rsc.org/images/entities/char_2009.gif) 000 seconds at 150 °C and 120 °C, respectively. The isothermal curves depicted in Fig. 13 exhibit a classical shape for the transformation profile. Nevertheless, the direct fit of these curves using the classical Avrami equation leads to an activation energy of circa 100 ± 10 kJ mol−1 with a relatively poor correlation factor of 0.983 (data not shown).
000 seconds at 150 °C and 120 °C, respectively. The isothermal curves depicted in Fig. 13 exhibit a classical shape for the transformation profile. Nevertheless, the direct fit of these curves using the classical Avrami equation leads to an activation energy of circa 100 ± 10 kJ mol−1 with a relatively poor correlation factor of 0.983 (data not shown).
The transition from the physical equimolar mixture of enantiomers to the racemic crystal involves three different crystal lattices and therefore belongs to a heterogeneous reaction. The kinetics will depend on the mobility of the components in the system where molecules are not readily available (in contrast to polymorphic transition for instance). Diffusion usually plays a role in the rates of reaction between reacting solids, when reactants are in separate crystal lattices (even if contact interfaces help the transition).
In diffusion-controlled reactions, the rate of formation of the new phase decreases proportionally with the growth because molecules must diffuse through the new solid. It can be shown (for spherical particles) in JMAEK models (which stands for Johnson, Mehl, Avrami, Erofeyev, and Kholmogorov) modified to account for diffusion (3D diffusion model) that the extent of reaction x is related to kinetic constant k(T) and time t by the following expression:18
 | (2) |
 versus the time is plotted in Fig. 14 for different isothermal temperatures. The curves were linearly fitted to determine the k(T) parameters for each temperature and the values are summarized in Table 3. One can notice that the fitting R-squared parameter is rather good (R2 > 0.99).
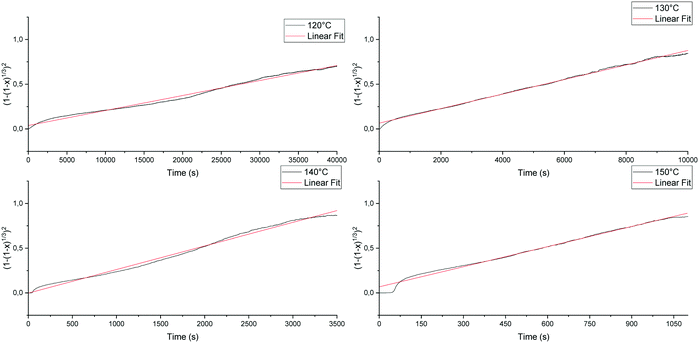 | ||
Fig. 14
 versus time and linear fit for 120 °C, 130 °C, 140 °C and 150 °C of the conglomerate to racemic compound transition.
 | ||
| T (°C) | k(T) × 105 (s−2) | R-Squared | Time to complete the reaction (s) |
|---|---|---|---|
| 120 | 1.678 ± 0.003 | 0.990 | 40![[thin space (1/6-em)]](https://www.rsc.org/images/entities/char_2009.gif) 000 000 |
| 130 | 8.082 ± 0.012 | 0.997 | 10![[thin space (1/6-em)]](https://www.rsc.org/images/entities/char_2009.gif) 000 000 |
| 140 | 26.61 ± 0.09 | 0.992 | 3500 |
| 150 | 72.05 ± 0.18 | 0.998 | 1100 |
Isothermal monitoring of the transition at higher temperatures was also conducted but the R2 values were lower (for fitting from eqn (2)). The main reasons could be the existence of competitive processes: (i) phase transformation, (ii) metastable heterogenous equilibria that participate to decrease the SHG signal faster over time and (iii) enhanced chemical degradation. For instance, rapidly after reaching 160 °C, a liquid phase appears (see the ESI†). This liquid phase could be associated with the cross of the metastable eutectic although it does not recrystallize in the stable phase, probably because of chemical degradation of the molecule in the liquid phase. It evidences the existence of the metastable eutectic in the range of 150–160 °C, close to the calculated temperature (149 °C).
The k(T) parameter follows the Arrhenius law and can be expressed as:
 | (3) |
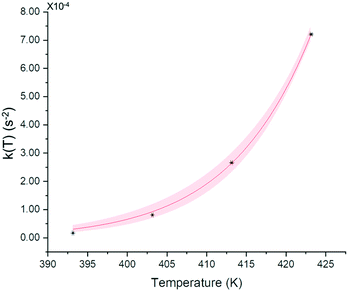 | ||
| Fig. 15 k(T) evolution upon temperature and fitted curve from eqn (3). Red zone corresponds to 95% confidence domain. | ||
The extracted activation energy is circa 145 ± 2 kJ mol−1 with a correlation factor R-squared of 0.999. The value of Ea is relatively high and could explain the kinetic stability of the conglomerate at room temperature. For instance, the conglomerate was kept for weeks at room temperature without any detection of the corresponding racemic compound.
Conclusion
Using the same thermal analysis protocol as that used for the racemic compound of (S)-(+)-p-synephrine, the melting characteristics of the enantiomers were determined with accuracy. The crystal structure of the enantiomer was also refined from X-ray powder diffraction. Then, a stable binary phase diagram between these chiral compounds was established through the coupling of DSC and crystallographic analyses.An attempt to construct a metastable binary phase diagram between the two enantiomers was undertaken. Unfortunately, by heating an equimolar mixture of the two enantiomers, the transformation towards the racemic compound was too fast to obtain a clear DSC trace of the metastable eutectic invariant.
In order to bypass the irreversible formation of the racemic compound, it should be possible to use flash-DSC devices that can reach very high heating rates. Unfortunately, those calorimeters work with tiny mass of crystals. It is therefore extremely difficult to introduce an exact equal mixture of enantiomers and on top of that to ensure a good contact between the particles. However, this spontaneous solid–solid reaction could be tracked by TR-SHG microscopy. This method is only based on several isothermal optical responses of the solid phases and thus overcomes the problem of low thermal trace of the transition and its slow kinetics for most of the temperature ranges investigated. It is therefore conceived as a general method to assess the activation energy of the irreversible heterogeneous reaction: <R> + <S> → <RS> in racemic compound forming systems. The activation energy of the transition from the metastable conglomerate toward the stable racemic compound was estimated to be 145 ± 2 kJ mol−1. This value explains the relative kinetic stability of the physical racemic mixture at room temperature. Microscopy also confirms the existence of the metastable eutectic invariant in the range of 150–160 °C.
Conflicts of interest
There are no conflicts of interest to declare.References
- M. D. Arbo, E. R. Larentis, V. M. Linck, A. L. Aboy, A. L. Pimentel, A. T. Henriques, E. Dallegrave, S. C. Garcia, M. B. Leal and R. P. Limberger, Concentrations of p-synephrine in fruits and leaves of Citrus species (Rutaceae) and the acute toxicity testing of Citrus aurantium extract and p-synephrine, Food Chem. Toxicol., 2008, 46, 2770–2775 CrossRef CAS.
- F. Rosa, P. Négrier, Y. Corvis and P. Espeau, Crystal structure determination and thermal behavior upon melting of p-synephrine, Thermochim. Acta, 2016, 632, 18–22 CrossRef CAS.
- K. Honda, Identification of host-plant chemicals stimulating oviposition by swallowtail butterfly, Papilio protenor, J. Chem. Ecol., 1990, 16, 325–337 CrossRef CAS.
- Y. Corvis, M.-C. Menet, P. Négrier, M. Lazerges and P. Espeau, The role of stearic acid in ascorbic acid protection from degradation: a heterogeneous system for homogeneous thermodynamic data, New J. Chem., 2013, 37, 761–768 RSC.
- Materials Studio Modeling 5.5., (http://accelrys.com/products/collaborative-science/biovia-materials-studio/) Search PubMed.
- M. A. Neumann, X-cell: a novel indexing algorithm for routine tasks and difficult cases, J. Appl. Crystallogr., 2003, 36, 356–365 CrossRef CAS.
- G. S. Pawley, Unit-cell refinement from powder diffraction scans, J. Appl. Crystallogr., 1981, 14, 357–361 CrossRef CAS.
- B. D. Mayo and W. A. Goddard III, DREIDING: a generic force field for molecular simulations, J. Phys. Chem., 1990, 94, 8897–8909 CrossRef.
- G. E. Engel, S. Wilke, O. König, K. D. M. Harris and F. J. J. Leusen, Powder Solve – a complete package for crystal structure solution from powder diffraction patterns, J. Appl. Crystallogr., 1999, 32, 1169–1179 CrossRef CAS.
- T. Kehl and G. van der Plaats, US Pat. 5.033.866, 1991 Search PubMed.
- G. F. M. Pinheiro, V. L. Lourenço and K. Iha, Influence of the heating rate in the thermal decomposition of HMX, J. Therm. Anal. Calorim., 2002, 67, 445–452 CrossRef CAS.
- M. Hurtta, I. Pitkänen and J. Knuutinen, Melting behaviour of d-sucrose, d-glucose and d-fructose, Carbohydr. Res., 2004, 339, 2267–2273 CrossRef CAS.
- I. Prigogine and R. Defay, Chemical Thermodynamics, 4th edn, Longmans, London, 1967 Search PubMed.
- I. Schröder, Dependence of the solubility of a solid on its melting point, Z. Phys. Chem., Stoechiom. Verwandtschaftsl., 1893, 11, 449–465 Search PubMed.
- J. J. Van Laar, Process of the fusion curves of firm alloys and amalgams, Arch. Neerl. Sci. Exactes Nat., 1903, 8, 264–284 Search PubMed.
- A. Galland, V. Dupray, B. Berton, S. Morin-Grognet, M. Sanselme, H. Atmani and G. Coquerel, Spotting Conglomerates by Second Harmonic Generation, Cryst. Growth Des., 2009, 9, 2713–2718 CrossRef CAS.
- S. Clevers, F. Simon, M. Sanselme, V. Dupray and G. Coquerel, Monotropic Transition Mechanism of m-Hydroxybenzoic Acid Investigated by Temperature-Resolved Second Harmonic Generation, Cryst. Growth Des., 2013, 13, 3697–3704 CrossRef CAS.
- A. Khawam and D. R. Flanagan, Solid-State Kinetic Models: Basics and Mathematical Fundamentals, J. Phys. Chem. B, 2006, 110, 17315–17328 CrossRef CAS.
- D. Wanapun, U. S. Kestur, D. J. Kissick, G. J. Simpson and L. S. Taylor, Selective Detection and Quantitation of Organic Molecule Crystallization by Second Harmonic Generation Microscopy, Anal. Chem., 2010, 82, 5425–5432 CrossRef CAS.
Footnote |
| † Electronic supplementary information (ESI) available: Emission spectra of the racemic physical mixture of p-synephrine at excitation wavelengths of 800 nm, 900 nm, 1000 nm, 1100 nm, 1200 nm and 1300 nm (Fig. S1). Movies of SHG signals at different temperatures (ESI-1). See DOI: 10.1039/d0ce00841a |
| This journal is © The Royal Society of Chemistry 2020 |

