 Open Access Article
Creative Commons Attribution 3.0 Unported Licence
Crystallization of BaF2 from droplets of phase separated glass – evidence of a core–shell structure by ASAXS
Armin
Hoell
 *a,
Vikram Singh
Raghuwanshi
a,
Christian
Bocker
b,
Andreas
Herrmann
c,
Christian
Rüssel
 *b and
Thomas
Höche
 d
d
aInstitute for Nanospectroscopy, Helmholtz-Zentrum Berlin für Materialien und Energie, Hahn-Meitner-Platz 1, D-14109 Berlin, Germany. E-mail: hoell@helmholtz-berlin.de
bOtto-Schott-Institut, Friedrich Schiller Universität Jena, Fraunhoferstraße 6, 07743 Jena, Germany. E-mail: ccr@uni-jena.de
cKazuo Inamori School of Engineering, New York State College of Ceramics, Alfred University, 2 Pine Street, Alfred, NY 14802, USA
dOptical Materials and Technologies, Fraunhofer Institute for Microstructure of Materials and Systems IMWS, Walter-Hülse-Straße 1, D-06120 Halle, Germany
First published on 29th June 2020
Abstract
Glasses with the mol% compositions 1.88 Na2O·15.04 K2O·7.52 Al2O3·69.56 SiO2·6.00 BaF2 and 1.88 Na2O·15.03 K2O·7.52 Al2O3·69.52 SiO2·6.00 BaF2·0.05 SmF3 were studied using X-ray diffraction, transmission electron microscopy, and anomalous small-angle X-ray scattering (ASAXS). While the glass doped with samarium showed liquid/liquid phase separation of droplets with sizes of around 100 nm, the glass without samarium did not. The samples were annealed at 580 °C or at 600 °C which led to the crystallization of cubic BaF2. The X-ray diffraction patterns showed strongly broadened lines. Hence, the BaF2 crystals possess sizes in the nm range. ASAXS gave evidence of a core shell structure. In agreement with earlier studies, it is assumed that the shell acts as a diffusion barrier that hinders crystal growth. Surprisingly, the cores and shells from the crystallization of the homogeneous glass and from the second glass, which is Sm-doped and shows liquid/liquid phase separation, both possess similar dimensions, even though the origin of the barrier is very different. The doped samples show long luminescence lifetimes of nearly 5 ms at a wavelength of 600 nm, which is nearly as long as those in fluoride phosphate glasses.
1. Introduction
In the past few years, the formation of nanocrystals from glasses was intensively studied.1–4 It has been shown that a prerequisite for the formation of nanocrystals is a core shell structure.5,6 This can be achieved if during the course of nucleation and subsequent crystal growth the core becomes successively enriched in network modifying oxides or other less mobile components, leading to increased viscosity in the depleted residual glassy phase.7–9 This results in a drastic decrease in the diffusion coefficients in the shell and in a deceleration of crystal growth. In some cases, the crystals do not grow any further within the time scale of the experiments of some ten hours.10–13 A very narrow crystal size distribution is observed, which is even narrower than the predicted Lifshitz–Slyozov–Wagner (LSW) distributions obtained from Ostwald ripening.14,15 Previously, these core shell structures were predicted based on the chemical composition of the glass and the formed crystalline phases as well as the measured changes in the glass transition temperatures of partially crystalline samples. In the past decade, new aberration-corrected transmission electron microscopes (TEMs) have been developed that are able to detect the shell directly using electron energy loss spectroscopy (EELS)16 or energy-dispersive X-ray spectrometry (EDXS).17–19 Moreover, the formed core shell structures were also confirmed with the data from anomalous small-angle X-ray scattering (ASAXS).20Up to now, core shell structures have been predominantly observed during homogeneous nucleation of rare earth fluorides18 and earth alkaline fluorides.8–16,20–23 These fluoride nanocrystals are good hosts for rare earth elements with interesting luminescence and up-conversion properties. Narrow size distribution is an important prerequisite for transparency in the visible light spectrum, which is required for applications in optics and photonics.
In lithium aluminosilicates, ZrTiO4 acts as a nucleation agent. The first step of the nucleation process is the formation of an amorphous droplet-like phase, and subsequently ZrTiO4 precipitates. This also leads to the formation of a core shell structure.7,24 The formation of liquid/liquid phase separation with a droplet structure is observed in the case of some oxyfluoride glasses.21,22 Already minor quantities of rare earth elements may lead to phase separation. It has been shown for an oxyfluoride glass from which BaF2 can be precipitated that addition of rare earth oxides in a concentration as small as 0.05 mol% leads already to the formation of droplet phase separation.23
In the present paper, the effect of 0.05 mol% SmF3 on the crystallization of a glass with a composition of 1.88 Na2O–15.04 K2O–7.52 Al2O3–69.56 SiO2–6 BaF2 is studied predominantly using the XRD, ASAXS and TEM methods.
2. Experimental procedure
Glasses with the compositions (in mol%) 1.88 Na2O·15.04 K2O·7.52 Al2O3·69.56 SiO2·6 BaF2 (denoted as sample A) and 1.88 Na2O·15.03 K2O·7.52 Al2O3·69.52 SiO2·6 BaF2·0.05 SmF3 (denoted as sample B) were studied (Table 1). They were melted from reagent grade Al(OH)3, K2CO3, Na2CO3, BaF2, BaCO3 and SiO2 (quartz) in quantities of 200 g in a platinum crucible at 1590 °C, kept for 1.5 h. The glass melt was cast on a copper block and transferred to a furnace preheated to 450 °C. The furnace was subsequently switched off and the glass samples were allowed to cool down slowly. This was done to reduce mechanical stresses. The temperature of 450 °C was below the glass transition temperatures of the studied glasses (473 °C for glass A and 485 °C for glass B) and hence nucleation should not occur. For crystallization, compact sample pieces of these glasses were annealed for 20 h at temperatures of 580 or 600 °C.| Chemical composition in mol% | ||||||
|---|---|---|---|---|---|---|
| Na2O | K2O | Al2O3 | SiO2 | BaF2 | SmF3 | |
| Sample A | 1.88 | 15.04 | 7.52 | 69.56 | 6.00 | — |
| Sample B | 1.88 | 15.03 | 7.52 | 69.52 | 6.00 | 0.05 |
From annealed and subsequently powdered samples, XRD patterns were recorded using a Siemens D5000 diffractometer with CuKα radiation (λ = 0.154 nm), a step size of 0.02° and a 10 s time/step ratio. The measurement was carried out with a grain size fraction of <63 μm.
The glass transition temperature Tg was measured by dilatometry on cylindrically shaped samples using a Netzsch DIL 402 PC equipped with a silica-glass measurement system. A heating rate of 5 K min−1 was applied. Differential scanning calorimetry (DSC) was performed with a Linseis DSC PT-1600 and a heating rate of 10 K min−1.
The microstructures of the glasses were further studied by transmission electron microscopy (TEM, Hitachi H 8100) using a replica technique. A carbon–platinum–iridium film was evaporated on the surface and subsequently removed by floating off on acid (a mixture of hydrofluoric and nitric acid) while the film retained the original topography.25 This technique is suitable to visualize liquid/liquid phase separation in glasses.
Additionally, TEM analyses from the bulk material were performed with an FEI TITAN3 G2 80–300 microscope equipped with a high-angle annular dark field detector (HAADF, Fischione Model 3000). For elemental analyses, energy-dispersive X-ray spectroscopy (EDXS) was performed using a Super-X EDX detector, equipped with four silicon drift detectors (FEI Company).
In order to prepare electron transparent samples, the mechanical wedge-polishing approach was applied. First, a dedicated grinding and polishing tool (Multiprep, Allied company) was used. After finishing this preparation, low-energy Ar+ ion broad-beam milling (precision ion polishing system PIPS, Gatan company) was performed followed by selective carbon coating for mitigation of electrostatic charging.26
The as-prepared and annealed glass samples were studied by SAXS and ASAXS. The thicknesses of the polished sample sheets on both sides varied between 30 and 50 μm, which is required to achieve a sufficiently high X-ray transmission. The SAXS measurements were conducted at 4900 eV, an energy far below the Barium L3 X-ray absorption edge (Ba L3). The ASAXS experiments were carried out on all the samples by using 4 different energies close to the Ba L3 absorption edge (5247 eV) at the 7T-MPW-SAXS beamline at BESSY II, Helmholtz Zentrum Berlin (HZB) Synchrotron, Berlin, Germany. X-ray energies of 4900, 5177, 5234 and 5244 eV were used. For data collection, we used a gas filled multi-wire proportional counter (MWPC) area detector with quadratic pixels having sizes of 207 mm2. The samples were measured at both long distance (3745 mm; detector far from the sample) and short distance (800 mm; detector close to the sample) in order to achieve the widest possible q range. The samples were measured under vacuum conditions, to reduce air scattering and to increase the mean free path length. The measured curves were corrected for transmission, photon flux and pixel sensitivities of the detector. Dead time correction for the detector and solid angle correction were applied. The magnitude of the q axis is calibrated with a silver-behenate standard sample (1st peak at q = 1.0763 nm−1). A glassy carbon standard sample was used to calibrate the SAXS curves into differential scattering cross section units.
UV-vis-NIR spectra were recorded with a Shimadzu UV-3102 PC spectrophotometer in a wavelength range from 200 to 3200 nm. Luminescence emission spectra were recorded with a spectrofluorometer RF 5301 PC (Shimadzu, Japan). The luminescence lifetimes were measured for the strongest luminescence transition of Sm3+ (600 nm) using a custom-made setup. It consists of a pulsed nitrogen laser at 337 nm (MSG 800, LTB Lasertechnik Berlin, Germany) for excitation, a monochromator (H.25, Jobin Yvon, France) for wavelength selection, a photomultiplier tube (R5929, Hamamatsu, Japan) as a detector and an oscilloscope (TDS2012, Tektronix, USA) for data acquisition. All measurements were conducted at room temperature.
3. Results
The prepared glasses were optically transparent without visible striae. The densities of both glasses were 2.603 g cm−3 and equal within the limits of error. The glass transition temperatures determined by dilatometry were 473 °C and 485 °C for glasses A and B, respectively. Unfortunately, exothermic peaks were not detected by DSC, supposedly due to the small volume concentrations of the formed crystals.3.1. XRD and electron microscopy
In a previous preliminary report,32 it has already been shown that the undoped glass is homogeneous, while the Sm-doped glass shows liquid/liquid phase separation. Fig. 1 shows the TEM replica micrographs of the SmF3-doped sample (B) and the undoped sample (A). In the sample with SmF3, heterogeneities are observed with sizes of around 100 nm. Since the non-thermally treated sample is X-ray amorphous (Fig. 2), these heterogeneities are liquid/liquid phase separation with a droplet structure. By contrast, the sample without SmF3 did not show any signs of heterogeneities and hence phase separation.20 The droplet size distribution in the SmF3 containing sample (B) is apparently narrow. This sample is transparent for visible light. It would already show notable light scattering in the case of droplets with sizes in the range of 200–400 nm.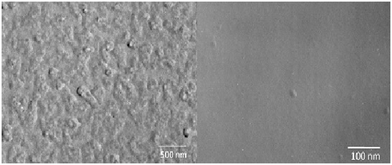 | ||
| Fig. 1 TEM micrographs (replicas from etched surface) of sample B with 0.05 mol% SmF3 (left) and glassy sample A without SmF3 (right) (see also ref. 23). | ||
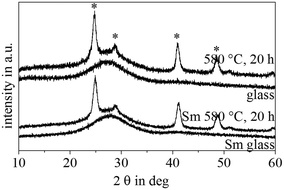
The thermally treated samples were also optically transparent. The attributed XRD patterns of samples A and B are shown in Fig. 2. Within the limitations of XRD, both the as-prepared glass samples were amorphous. Both samples heat treated at 580 °C for 20 h show similar XRD patterns. Besides an intense and broad background at around 2θ = 26° due to a high quantity of amorphous phase, distinct lines attributable to crystalline cubic BaF2 (JCPDS No. 4-452) are observed (marked by asterisks). The lines are notably broadened which is a hint for small crystallites with sizes in the few nm range. The mean crystallite size in the case of sample A is 12.3 ± 0.5 nm as calculated from the FWHM of the peaks using Scherrer's equation. For sample B with the addition of a small amount of samarium fluoride, the crystal size is 11.1 ± 0.4 nm and hence slightly smaller. The 2θ values of the XRD lines do not differ noticeably and hence the lattice constants are not different within the performed experiment. Thus, the XRD patterns do not allow us to conclude on the incorporation of samarium into the BaF2 lattice.
Fig. 3 presents the TEM micrographs of sample B (with Sm), thermally treated at 580 °C for 20 h. Discrete structures with sizes in the range from 20 to 40 nm are observed. These structures are homogeneously distributed within the sample.
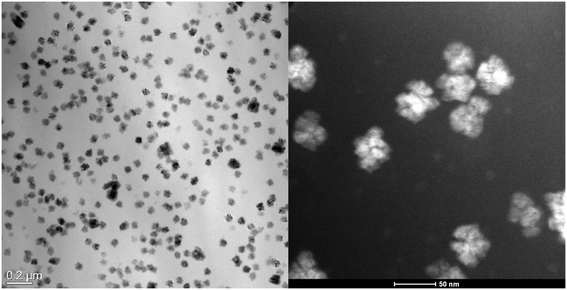 | ||
| Fig. 3 TEM micrograph of sample B annealed for 20 h at 580 °C. Left: Bright field image, right: HAADF image in a higher magnification. | ||
In Fig. 4, a HAADF micrograph recorded in STEM mode of sample B is shown together with the corresponding EDXS mappings of Sm, Ba and F. Concerning the EDXS mappings of Ba and F, it is clear that the crystalline structures observed in the HAADF micrographs shown in Fig. 3 and 4 are enriched in Ba and F. Considering the XRD patterns presented in Fig. 2, the heterogeneities consist of nanocrystalline BaF2. Concerning the EDXS mapping of Sm, a certain enrichment of Sm in the BaF2 crystals can be stated. Noteworthy is that SmF3 occurs in a concentration of only 0.05 mol%. Accordingly, the BaF2 crystals should be doped with Sm3+, which is assumed to be incorporated at the Ba2+ sites. Charge compensation should occur via Ba2+ vacancies.
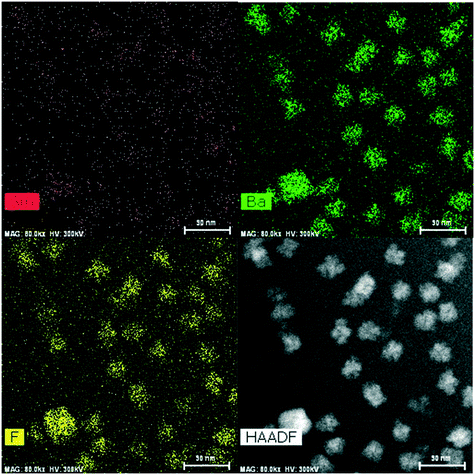 | ||
| Fig. 4 HAADF micrograph (bottom right) taken in STEM mode of sample B, thermally treated for 20 h at 580 °C and the corresponding EDXS mappings of Sm (top left), Ba (top right) and F (bottom left). | ||
3.2. Anomalous small-angle X-ray scattering
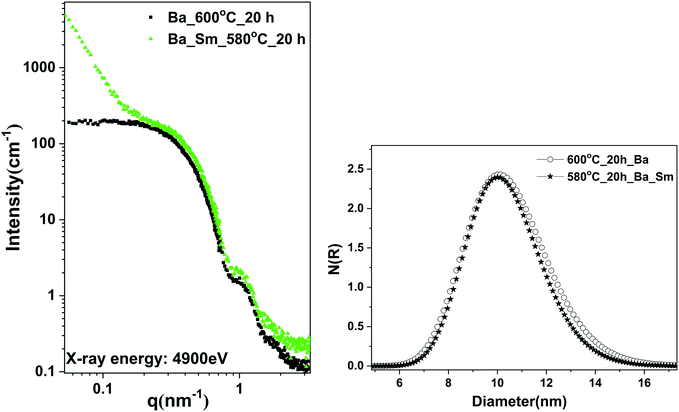
Fig. 5 (left) shows the SAXS curves calibrated to differential scattering cross sections for sample A, thermally treated at 600 °C for 20 h, and for sample B, crystallized at 580 °C for 20 h. Both SAXS curves show the same pattern between 0.2 < q < 3 nm−1, which indicates the size distribution of the BaF2 nanoparticles. However, the upturn in the SAXS curve (at q < 0.2 nm−1) for sample B (with Sm) reveals the formation of additional larger sized particles or aggregates of BaF2 nanoparticles or the formation of surface fractals. The upturn follows the power law of q−3.Further information from the SAXS curves was extracted by fitting the whole shapes of the curves with the spherical core shell model in combination with the Gaussian size distribution of particles, using the software SASfit. The evaluated fitting parameters on the particle core size and shell thickness are given in Table 2. The distribution of the core (BaF2) particles in both samples is shown in Fig. 5 (right). The volume weighted mean diameters are fairly similar and centred at 11.2 nm for crystallized sample A and at 11.0 nm for sample B (Table 2). The thicknesses of the shells are 2.7 and 2.5 nm, respectively.
| Sample A | Sample B | |
|---|---|---|
| Total particle radius in nm | 8.4 | 8.0 |
| Core radius in nm | 5.6 | 5.5 |
| Shell thickness in nm | 2.7 | 2.5 |
| Density of the core in g cm−3 | 4.5 | 4.5 |
| Density of the shell in g cm−3 | 2.3 | 2.3 |
| Density of the matrix in g cm−3 | 2.4 | 2.4 |
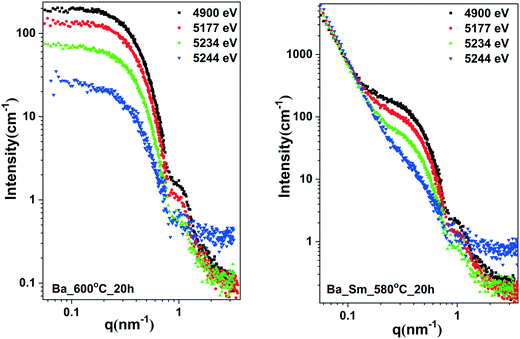
ASAXS measurements were conducted to reveal the elemental distribution of Ba atoms in the core, the composition of the shell and the densities of the core, shell and the remaining glass matrix. ASAXS experiments were performed on sample A and sample B near the Ba X-ray absorption edge (5247 eV), more precisely at the 4 energies: 4900, 5177, 5234 and 5244 eV (Fig. 6). Both samples show significant contrast variations (ASAXS effect) near the Ba absorption edge, which indicates the presence of Ba atoms in the nanoparticles, evidencing the core shell structure.
The contrast variation values from the ASAXS curves were evaluated by fitting them with a spherical core shell model using the SASfit program and a procedure published previously.20 Fitting the experimentally evaluated contrast values with the theoretically calculated values reveals the chemical composition and densities of the core, shell and the remaining glass matrix. The evaluated parameters are provided in Table 2.
Since the scattering curves strongly depend on the energy near the Ba-absorption edge, the particles that give rise to X-ray scattering are strongly enriched in Ba. According to the XRD patterns, they consist of BaF2. Therefore, the scattering curves were fitted assuming a BaF2 core and an SiO2 shell.
3.3. Spectroscopic measurements
Fig. 7 shows the UV-vis-NIR transmission spectra of the Sm-doped glass (B), not annealed (black curve) and thermally annealed at 580 °C for 20 h (red curve). In the spectral range from 1000 to 3200 nm, the spectra are practically identical and show the absorption lines typical for Sm3+ containing glasses. The wavelength and line widths attributed to the absorption lines did not obviously change noticeably during crystallization. At wavelengths in the range from 350 to 1000 nm, the transmission of the crystallized sample is somewhat smaller. The difference between the two curves increases with decreasing wavelength. This is a hint for a small extent of light scattering. The transmission at wavelengths of 350 and 500 nm of sample A is around 82 and 92%, while it is 70 and 87% for sample B, respectively. For most potential applications (besides as an active laser component for the visible range), the slight scattering is not of importance. For example, as light converters for blue LEDs to produce white light, slight scattering is not disadvantageous, and also for the use as an active laser material in the infrared, scattering of visible light does not have a negative effect.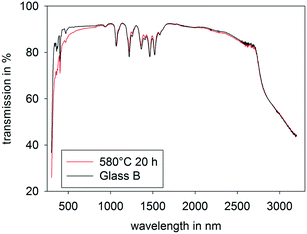 | ||
| Fig. 7 UV-vis-NIR transmission spectra of the as-cast glass B (black) and glass B after thermal treatment at 580 °C for 20 h (red). | ||
Fig. 8 shows the luminescence emission spectra (excitation at 402 nm) of the prepared glass B and sample B crystallized at 580 °C for 20 h in a wavelength range from 250 to 600 nm. Four emission lines typical for Sm3+ are observed at 562 nm: 4G5/2 → 6H5/2, at 600 nm: 4G5/2 → 6H7/2, at 645 nm: 4G5/2 → 6H9/2 and at 706 nm: 4G5/2 → 6H11/2. The most intense emission band was observed at 600 nm and the second most intense one at 645 nm, corresponding to the transitions 4G5/2 → 6H7/2 (orange) and 4G5/2 → 6H9/2 (red), respectively. The emission spectra of the glass and the crystallized sample do not differ much. All lines are located at the same wavelengths and the intensities are approximately the same.
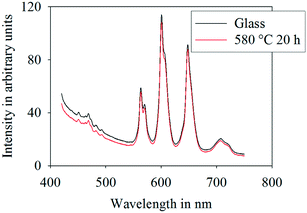 | ||
| Fig. 8 Luminescence emission spectra of the as-cast glass B (black) and glass B thermally treated at 580 °C for 20 h (red). | ||
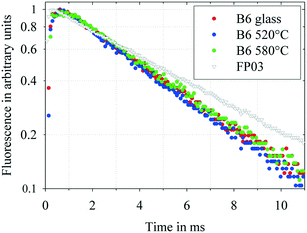
The semi-logarithmic plots of the luminescence emission decay curves of the 4G5/2 → 6H5/2 emission are shown in Fig. 9 for the as-cast sample B and samples with composition B crystallized at 520 °C for 20 h and at 580 °C for 20 h. Additionally, a decay curve for an almost pure fluoride glass (in the literature usually denoted as FP03) with a composition of 10 MgF2, 28 CaF2, 23 SrF2, 36 AlF3, and 3 Sr(PO3)2 is shown for comparison. All the samples have the same doping concentration of Sm3+ of 1 × 10¹⁹ Sm3+ per cm3. These curves provide information on the lifetime of the 4G5/2 excited state of the rare-earth ion in the respective host glass composition. A straight line in the semi-logarithmic scale represents a mono-exponential decay. The slope of these lines represents the reciprocal luminescence lifetimes. For all the studied samples, an approximately mono-exponential decay is observed, which indicates homogeneously distributed Sm3+ ions and low concentration quenching. The luminescence lifetimes of the studied samples and the fluoride phosphate glass sample FP03 for comparison are summarized in Table 3. The lifetimes of the investigated samples are somewhat shorter than that for the fluoride phosphate sample, an almost pure fluoride glass.
| Thermal treatment | Luminescence lifetime (ms) | |
|---|---|---|
| Glass B | No | 4.89 |
| Glass B | 520 °C/20 h | 4.60 |
| Glass B | 580 °C/20 h | 4.97 |
| FP03 | No | 6.20 |
4. Discussion
Although glass B contains only 0.05 mol% SmF3, the structure was very different from that of the sample without samarium (glass A). While the glass doped with samarium showed phase separation with droplets with sizes of around 100 nm, the glass without samarium did not. Thermal treatment leads to the crystallization of cubic BaF2 in both glasses. The XRD patterns show strongly broadened lines attributed to mean crystallite sizes of around 11 nm, as calculated from the XRD line broadening. These crystallite sizes are comparable with the size of the crystals observed in the TEM micrographs. The effect of time and temperature on the size of the crystals is comparably small as already discussed in ref. 12. However, the effect is notably more pronounced than in previously studied glasses, in which during annealing, CaF2 is precipitated.11,27 For sample A, previous studies using advanced TEM measurements gave evidence of the formation of core shell structures.20 Using SAXS and ASAXS, the existence of such a shell is confirmed. In the SmF3-doped sample annealed at 580 °C for 20 h, SAXS and ASAXS also show a core shell structure. In both cases, the shell is enriched in SiO2 and hence is attributed to a layer of higher viscosity with respect to the matrix. The size of the BaF2 cores is around 11 nm and approximately the same for both glasses A and B. The crystallite sizes as determined by XRD line broadening are 12.3 and 11.1 nm, for samples A and B, respectively. In this context, it should be noted that XRD measures the size of a particle with translational symmetry. SAXS and ASAXS analyse the whole shape of a small-angle scattering curve to obtain size distributions of regions having almost the same electron density and mean chemical composition, and do not require only crystalline regions. If a periodic lattice has a highly distorted outer layer (but approximately the same chemical composition), then XRD determines the periodic size. SAXS would determine the size including a distorted layer as an example. Hence, it cannot be expected that exactly the same results from these two methods are obtained.This is surprising because the as-melted glass A is not phase separated, while glass B shows phase separation. It can be assumed that in both cases, the shell acts as a diffusion barrier which hinders further crystal growth. In the case of sample B, first, a liquid droplet enriched in barium, fluoride, SiO2 and possibly Al2O3 is formed. During the course of the crystallization, BaF2 is formed inside the droplet and SiO2 as well as possibly Al2O3 is expelled. It should be noted that stresses appear simultaneously with the formation of the core shell structure. These stresses can hardly relax because the composition of the shell is attributed to a higher glass transition temperature which is above the crystallization temperature applied.
It is remarkable that addition of a SmF3 concentration as small as 0.05 mol% gives rise to drastic changes in the crystallization mechanism. It should further be mentioned that similar structures, in our case BaF2 nanocrystals with SiO2 enriched shells, do not allow us to conclude on similar crystallization mechanisms.
It is further surprising that the luminescence lifetimes for a Sm3+ emission at 600 nm are in the range of 5 ms. This is much longer than those in silicate glasses, which usually show luminescence lifetimes of about 2–3 ms depending on their chemical composition.28,32,33 For aluminosilicate glasses, fluorescence lifetimes are in the range of 2.2 to 3.8 ms,28,29 while for tellurite glasses, 0.6 to 1.8 ms (ref. 30) and for ZnO–Al2O3–BaO–B2O3 glasses, 0.9 to 2.7 ms (ref. 31) were determined. Up to now, only fluoride phosphate glasses have been reported to possess longer fluorescence lifetimes. Most probably, the coordination of Sm3+ by fluoride leads to a notable increase in the fluorescence lifetime. These fluoride phosphate glasses are very difficult to prepare in high homogeneity, while oxyfluorosilicate glasses are much easier to prepare. In the case of the phase separated glass B, both Sm and fluoride are enriched in the droplet phase which should favor the coordination of Sm3+ with fluoride. Long lifetimes are generally observed in fluoride glasses, however, at similar doping concentrations, their lifetimes are even somewhat longer.32 Two conclusions can be drawn from these observations: firstly, the Sm3+ ions are incorporated into a fluoride rich environment in the investigated samples, probably the fluoride rich droplets formed by phase separation. The somewhat shorter luminescence lifetime could be a hint to an increased local Sm3+ concentration and therefore could result from slight concentration quenching. Earlier investigations show that similar lifetimes of about 5 ms were measured for fluoride glasses with a doping concentration of 1 × 10²⁰ Sm3+ per cm3.32 This would imply that Sm3+ is accumulated in the droplets. Indeed, it is well known that rare earth ions prefer a fluoride rich environment over a silicate phase.34,35
The melting of glasses, with high fluoride concentrations such as fluoride phosphate glasses, however, is a serious technological challenge and a high homogeneity is very difficult to achieve, because of heavy fluoride evaporation. Hence, the preparation of fluoride containing nanoglass ceramics with similar spectroscopic properties is advantageous because they are much easier to produce.
It should be noted that the luminescence of transition or rare earth cations is an effect also observed in liquids and hence, not necessarily connected to the solid state. By contrast to luminescence caused by nano-size semiconductors, nano-size effects of rare earth containing compounds have never been reported.
5. Conclusions
Using X-ray diffraction, transmission electron microscopy and anomalous small-angle X-ray scattering, a glass with the mol% composition 1.88 Na2O·15.04 K2O·7.52 Al2O3·69.56 SiO2·6.00 BaF2 and a glass doped with only 0.05 mol% SmF3 were studied. While the undoped glass was homogeneous, the samarium doped glass showed droplet phase separation with a droplet size of around 100 nm as proved by TEM. Thermal treatment of the samples led to the crystallization of cubic BaF2. ASAXS gave evidence of a core shell structure. The spherical particles of the undoped and the doped samples had diameters of around 11 nm, while the shell had a thickness of 2.6 nm. Surprisingly, both the cores and the shells possess hence similar dimensions if crystallized from the homogeneous glass and the phase separated glass. It should be noted, however, that the origin of the barrier is very different. In both cases, it is assumed that the shell acts as a diffusion barrier that hinders crystal growth. The core sizes determined by ASAXS were in excellent agreement with the crystallite sizes calculated from the strongly broadened XRD lines using Scherrer's equation. The samarium doped sample shows strong luminescence. The luminescence lifetimes were nearly 5 ms at 600 nm and hence unusually long.Conflicts of interest
The authors declare no conflict of interest.Acknowledgements
We thank HZB for the allocation of synchrotron radiation beamtime for the ASAXS instrument at the 7T-MPW-SAXS beamline at BESSY II.References
- G. H. Beall and L. R. Pinckney, Nanophase Glass-Ceramics, J. Am. Ceram. Soc., 1999, 82, 5–16 CrossRef CAS.
- M. J. Dejneka, The luminescence and structure of novel transparent oxyfluoride glass-ceramics, J. Non-Cryst. Solids, 1998, 239, 149–155 CrossRef CAS.
- M. Mortier, A. Monteville, G. Patriarche, G. Maze and F. Auzel, New progresses in transparent rare-earth doped glass-ceramics, Opt. Mater., 2001, 16, 255–267 CrossRef CAS.
- Y. Yu, D. Chen, Y. Wang, F. Liu and E. Ma, A new transparent oxyfluoride glass ceramic with improved luminescence, J. Non-Cryst. Solids, 2007, 353, 405–409 CrossRef CAS.
- S. Hendy, Light scattering in transparent glass ceramics, Appl. Phys. Lett., 2002, 81, 1171–1173 CrossRef CAS.
- A. Edgar, Core-shell particle model for optical transparency in glass ceramics, Appl. Phys. Lett., 2006, 89, 041909 CrossRef.
- C. Patzig, T. Höche, M. Dittmer and C. Rüssel, Temporal Evolution of Crystallization in MgO–Al2O3–SiO2–ZrO2 Glass Ceramics, Cryst. Growth Des., 2012, 12, 2059–2067 CrossRef CAS.
- C. Bocker, C. Rüssel and I. Avramov, Transparent Nano Crystalline Glass-Ceramics by Interface Controlled Crystallization, Int. J. Appl. Glass Sci., 2013, 4, 174–181 CrossRef CAS.
- C. Bocker, I. Avramov and C. Rüssel, Viscosity and diffusion of barium and fluoride in Na2O/K2O/Al2O3/SiO2/BaF2 glasses, Chem. Phys., 2010, 369, 96–100 CrossRef CAS.
- K. Shinozaki, T. Honma, K. Oh-ishi and T. Komatsu, Morphology of CaF2 nanocrystals and elastic properties in transparent oxyfluoride crystallized glasses, Opt. Mater., 2011, 33, 1350–1356 CrossRef CAS.
- C. Rüssel, Nanocrystallization of CaF2 from Na2O/K2O/CaO/CaF2/Al2O3/SiO2 Glasses, Chem. Mater., 2005, 17, 5843–5847 CrossRef.
- C. Bocker and C. Rüssel, Self-organized nano-crystallisation of BaF2 from Na2O/K2O/BaF2/Al2O3/SiO2 glasses, J. Eur. Ceram. Soc., 2009, 29, 1221–1225 CrossRef CAS.
- R. Wurth and C. Rüssel, The crystallization of (Pb, Yb, Er)Fx nano particles from glasses with the composition 20 SiO2·13.5 B2O3·6 Al2O3·10 PbO·6.6 CdO 20 PbF2·13.3 CdF2·10 YbF3·0.5 ErF3, Solid State Sci., 2011, 13, 1132–1136 CrossRef CAS.
- C. Bocker, I. Avramov and C. Rüssel, The effect of stresses during crystallization on the crystallite size distributions, J. Eur. Ceram. Soc., 2011, 31, 2861–2866 CrossRef CAS.
- C. Bocker, S. Bhattacharyya, T. Höche and C. Rüssel, Size distribution of BaF2 nanocrystallites in transparent glass ceramics, Acta Mater., 2009, 57, 5956–5963 CrossRef CAS.
- C. Bocker, I. Avramov and C. Rüssel, Experimental evidence of high pressure during crystallization of glass – The formation of an orthorhombic high-pressure BaF2 phase, Scr. Mater., 2010, 62, 814–817 CrossRef CAS.
- E. Kleebusch, C. Rüssel, C. Patzig and T. Höche, Evidence of epitaxial growth of high-quartz solid solution on ZrTiO4 nuclei in a Li2O-Al2O3-SiO2 glass, J. Alloys Compd., 2018, 748, 73–79 CrossRef CAS.
- A. de Pablos-Martín, F. Muñoz, G. C. Mather, C. Patzig, S. Bhattacharyya, J. R. Jinschek, Th. Höche, A. Durán and M. J. Pascual, KLaF4 Nanocrystallisation in Oxyfluoride Glass-Ceramics, CrystEngComm, 2013, 15, 10323–10332 RSC.
- A. de Pablos-Martin, C. Patzig, Th. Höche, A. Duran and M. J. Pascual, Distribution of Thulium in Tm3+-Doped Oxyfluoride Glasses and Glass-Ceramics, CrystEngComm, 2013, 15, 6979–6985 RSC.
- V. S. Raghuwanshi, A. Hoell, C. Bocker and C. Rüssel, Experimental evidence of a diffusion barrier around BaF2 nanocrystals in a silicate glass system by ASAXS, CrystEngComm, 2012, 14, 5215 RSC.
- S. Bhattacharyya, T. Höche, N. Hemono, M. J. Pascual and P. A. van Aken, Nano-crystallization in LaF3–Na2O–Al2O3–SiO2 glass, J. Cryst. Growth, 2009, 311, 4350–4355 CrossRef CAS.
- C. Bocker, J. Wiemert and C. Rüssel, The formation of strontium fluoride nano crystals from a phase separated silicate glass, J. Eur. Ceram. Soc., 2013, 33, 1737–1745 CrossRef CAS.
- J. R. Barros, C. Bocker and C. Rüssel, The effect of Er3+ and Sm3+ on phase separation and crystallization in Na2O/K2O/BaF2/BaO/Al2O3/SiO2 glasses, Solid State Sci., 2010, 12, 2086–2090 CrossRef CAS.
- V. S. Raghuwanshi, C. Rüssel and A. Hoell, Crystallization of ZrTiO4 Nanocrystals in Lithium-Alumino-Silicate Glass Ceramics: Anomalous Small-Angle X-ray Scattering Investigation, Cryst. Growth Des., 2014, 14, 2838–2845 CrossRef CAS.
- W. Vogel, Glass Chemistry, Springer, Berlin, 1994 Search PubMed.
- T. Höche, J. W. Gerlach and T. Petsch, Static-Charging Mitigation and Contamination Avoidance by Selective Carbon Coating of TEM Samples, Ultramicroscopy, 2006, 106, 981–985 CrossRef PubMed.
- A. Hoell, Z. Varga, V. S. Raghuwanshi, M. Krumrey, C. Bocker and C. Rüssel, ASAXS study of CaF2 nanoparticles embedded in a silicate glass matrix, J. Appl. Crystallogr., 2014, 47, 60–66 CrossRef CAS.
- A. Herrmann, M. Tewelde, S. Kuhn, M. Tiegel and C. Rüssel, The Effect of Glass Composition on the Luminescence Properties of Sm3+ doped Alumino Silicate Glasses, J. Non-Cryst. Solids, 2018, 502, 190–197 CrossRef CAS.
- R. Turki, M. Zekri, A. Herrmann, C. Rüssel, R. Maalej and K. Damak, Optical properties of peralkaline aluminosilicate glasses doped with Sm3+, J. Alloys Compd., 2019, 806, 1339–1347 CrossRef CAS.
- P. Yasaka, R. Rajaramakrishna, W. Wongwan, P. Yamchumporn, H. J. Kim and J. Kaewkhao, Development of ZnO–BaO–B2O3–TeO2 glass doped with Sm3+ for orange emitting material, Solid State Sci., 2019, 98, 106041 CrossRef CAS.
- L. Yuliantini, R. Hidayat, M. Djamal, K. Boonin, P. Yasaka, E. Kaewnuam and J. Kaewkhao, Development of Sm3+ doped ZnO-Al2O3-BaO-B2O3 glasses for optical gain medium, J. Non-Cryst. Solids, 2018, 482, 86–92 CrossRef CAS.
- A. Herrmann and D. Ehrt, Time-resolved fluorescence measurements on Dy3+ and Sm3+ doped glasses, J. Non-Cryst. Solids, 2008, 354, 916–926 CrossRef CAS.
- D. Ehrt, H. T. Vu, A. Herrmann and G. Völksch, Luminescent ZnO-Al2O3-SiO2 glasses and glass ceramics, Adv. Mater. Res., 2008, 39(40), 231–236 Search PubMed.
- A. Herrmann, M. Tylkowski, C. Bocker and C. Rüssel, Preparation and Luminescence Properties of Glass-Ceramics Containing Sm3+-Doped Hexagonal NaGdF4 Crystals, J. Mater. Sci., 2013, 48, 6262–6268 CrossRef CAS.
- A. Herrmann, M. Tylkowski, C. Bocker and C. Rüssel, Cubic and Hexagonal NaGdF4 Crystals Precipitated from an Aluminosilicate Glass: Preparation and Luminescence Properties, Chem. Mater., 2013, 25, 2878–2884 CrossRef CAS.
| This journal is © The Royal Society of Chemistry 2020 |

