 Open Access Article
Unraveling the origin of the “Turn-On” effect of Al-MIL-53-NO2 during H2S detection†
Zan
Zhu
,
Xiang
He
and
Wei-Ning
Wang
 *
*
Department of Mechanical and Nuclear Engineering, Virginia Commonwealth University, Richmond, Virginia 23219, USA. E-mail: wnwang@vcu.edu; Fax: +1 804 827 7030; Tel: +1 804 827 4306
First published on 20th November 2019
Abstract
Nitro-functionalized metal–organic frameworks (MOFs), such as Al-MIL-53-NO2, have been widely used in quantitative hydrogen sulfide (H2S) detection based on the “turn-on” effect, where fluorescence enhancements were observed upon contact with H2S. This was believed to be caused by the fact that the electron-withdrawing –NO2 groups in the initial non-luminescent MOFs were reduced to electron-donating –NH2 groups in the sensing process. However, since most H2S detection is conducted in a suspension system consisting of MOFs and solvents, it is still unclear whether these –NH2 groups are on MOFs or in the liquid. Using Al-MIL-53-NO2 as a model MOF, this work aims to answer this question. Specifically, the supernatant and undissolved particles separated from the Al-MIL-53-NO2 suspensions after being exposed to H2S were analyzed systematically. The results showed that it is the free BDC-NH2 (2-aminobenzene-1,4-dicarboxylic acid) in the solution rather than the formation of Al-MIL-53-NH2 that really caused the fluorescence enhancement. In particular, the formed BDC-NH2 was reduced from the shedded BDC-NO2 (2-nitrobenzene-1,4-dicarboxylic acid) during the decomposition of Al-MIL-53-NO2, which was attacked by OH− in the NaHS solution. We anticipate that this work will offer new ways of tracing fluorophores for MOF-based sensing applications in aqueous systems.
1. Introduction
Hydrogen sulfide (H2S), known by its characteristic odor of rotten eggs, has been receiving considerable attention because it is highly associated with the physiological and pathological processes in biological systems.1,2 Abnormal levels of H2S have been identified to be related to many complex diseases such as Alzheimer's disease,3 diabetes,4 Down's syndrome,5 arterial and pulmonary hypertension,6 Parkinson's disease,7 and periodontal disease,8 which makes H2S detection significant in disease prevention and diagnosis. Various methods towards H2S sensing have been proposed, including semiconductor-based electrochemical tests,9 direct gas chromatography measurements,8 and piezoelectric transducer detection.10 However, the development of these methods is hampered by expensive instruments, complexity in sample preparation, and complicated operating procedures. The fluorescence-based detection method has grown rapidly in recent years because of its high selectivity and sensitivity, short response time, simplicity of operation, and easy observation in real-time imaging.11,12 Up till now, plenty of fluorescent materials have been designed and used for H2S sensing.13–15Among these fluorescent materials, metal–organic frameworks (MOFs), a class of porous crystalline materials composed of bridged organic linkers and centered metal ions/clusters,16 are interesting candidates because the great abundance of functional ligands and metals endow MOFs with very promising physical and chemical properties.17–20 Several luminescent MOFs have been used for H2S detection in aqueous or real physiological systems.21–37 Among these explored mechanisms of H2S sensing, the “turn-on” effect is the most popular one, where the original non-luminescent MOFs in the “turn-off” state are activated and enhanced upon being exposed to H2S. Nitro-functionalized MOFs have been proven to be effective probes for H2S detection based on the “turn-on” effect.22,23,35 Specifically, the nitro groups (–NO2) in nitro-functionalized MOFs decrease the electron density of the aromatic ring because of the unpaired electrons on nitrogen, which makes MOFs emit very weak fluorescence and stay in the “turn-off” state. After being treated by H2S, electron-donating –NH2 groups are obtained and the “turn-on” fluorescence signal is captured.
Based on this mechanism, Zr-UiO-66-NO2 was first synthesized by Ghosh et al. to realize the “turn-on” response towards 0.0–4.0 mM H2S through the transformation of Zr-UiO-66-NO2 to Zr-UiO-66-NH2.21 Later on, Biswas et al. reported Ce-UiO-66-NO2,23 DUT-52-(NO2)2,26 and Zr-UiO-66-(NO2)2 (ref. 32) for quantitative H2S detection in physiological systems and living cells. The lowest detection limit at 92.31 × 10⁻⁹ M was recently reported by Qian et al. using polymer mixed-matrix membranes (MMM) developed by the combination of Al-MIL-53-NO2 nanoparticles and PVDF (polyvinylidene fluoride).35 Among all these nitro-functionalized MOF compounds, linear relationships were obtained in the different ranges of H2S concentrations with the fluorescence intensity, which can be applied for real quantitative H2S sensing.
As most of these “turn-on” assays have been conducted in a suspension system, where the solid-state nitro-functionalized MOFs were dispersed in NaHS/Na2S solutions, the fluorescence obtained was actually attributed to the combined effects of real fluorophores and non-luminescent particles in the suspension. Even though the researchers ascribed the fluorescence enhancement in the suspension to the formation of NH2-functionalized MOFs, the direct evidence of –NH2 existence within the MOFs after H2S treatment is still lacking. In addition, misinterpretation of fluorescent signals may also arise for the following reasons: 1. the precipitation of undissolved particles in the suspension will change the pathway of excitation radiation, which further leads to fluctuations in the fluorescence intensity; 2. the irradiation could be absorbed by the non-luminous undissolved particles in the suspensions, which decreases the effective light for absorption by real fluorophores. This phenomenon is called inner-filter effect and the existence of high concentrations of non-luminous undissolved particles can reduce the fluorescence intensity; 3. except for absorption, the irradiation light is also scattered in all directions from the small molecules in the suspensions. In a case of a suspension with a small Stokes shift, the broad scattering peak near the excitation wavelength sometimes may overlap with the emission peak, which makes the fluorescence intensity from fluorophores difficult to separate. Therefore, it is sometimes difficult to identify the real fluorophores in such a complex suspension system.
To further explore the mechanism of the “turn-on” effect, Al-MIL-53-NO2 was utilized in this study to react with H2S in an aqueous system. Furthermore, the supernatant and the undissolved particles were isolated for the first time to locate the possibly formed –NH2 groups. Meanwhile, the effect of the undissolved MOF particles on the fluorescence intensity in the sensing application was also analyzed. Interestingly, after being treated with H2S (0.1–1.0 mM), the undissolved nanoparticles that remained in the suspension were proved to be Al-MIL-53-NO2 rather than Al-MIL-53-NH2 and no –NH2 groups were formed at the surface of the residual solids, which made no contribution to fluorescence enhancement. The fluorescence “turn-on” effect was actually caused by the free BDC-NH2 in the solution, which was reduced from BDC-NO2 in the collapse of Al-MIL-53-NO2 when exposed to H2S. With the existence of the fluorophore BDC-NH2 in the aqueous system, both the supernatant (limit of detection, LOD = 69.7 μM) and suspension (i.e., Al-MIL-53-NO2 particles were dispersed evenly in aqueous solutions of NaHS by ultrasonication) (LOD = 69.3 μM) can be used to realize quantitative H2S sensing within 0–0.7 mM H2S. The result of this work unravels the origin of the “turn-on” effect of Al-MIL-53-NO2 in H2S sensing and explores new ways (separation of suspension into supernatant and undissolved residues) of fluorophore tracing in MOF-based detection.
2. Materials and methods
2.1 Chemicals
Sodium hydrosulfide hydrate (NaHS·xH2O, ∼70%), 2-nitrobenzene-1,4-dicarboxylic acid (C8H5NO6, BDC-NO2, ≥99%), 2-aminobenzene-1,4-dicarboxylic acid (C8H7NO4, BDC-NH2, ≥99%), and aluminum chloride hexahydrate (AlCl3·6H2O, ≥99%) were obtained from Sigma Aldrich. N-Dimethylformamide (HCON(CH3)2, DMF) was purchased from VWR Corporation. Ethanol (C2H5OH, 190 proof) was obtained from Gold Shield. Deionized (DI) water was used to prepare the solutions. All chemicals were used without further purification.2.2 Synthesis of Al-MIL-53-NO2 and Al-MIL-53-NH2
![[thin space (1/6-em)]](https://www.rsc.org/images/entities/char_2009.gif) 000 rpm for 10 minutes and washed with 15 mL DMF and 15 mL ethanol three times to remove unreacted chloride species and BDC-NO2. Finally, the collected particles were dried in air at 200 °C for 6 hours to completely remove the attached DMF molecules.
000 rpm for 10 minutes and washed with 15 mL DMF and 15 mL ethanol three times to remove unreacted chloride species and BDC-NO2. Finally, the collected particles were dried in air at 200 °C for 6 hours to completely remove the attached DMF molecules.
2.3 Materials' characterization
The morphologies of the samples were analyzed using a scanning electron microscope (SEM) with energy dispersive X-ray (EDX) spectroscopy (Su-70, Hitachi). The structure and crystallinity of Al-MIL-53-NO2 were determined by powder X-ray diffraction (PXRD) (PANalytical X'Pert Pro MPD). The analysis of vibrations of the functional groups was carried out with a Fourier transform infrared (FT-IR) spectrometer (Nicolet iS50, Thermo Scientific). The photoluminescence properties of the samples were characterized by a fluorospectrometer (PTI QuantaMaster-400). X-ray photoelectron spectroscopic (XPS) measurement was conducted with a Thermo Scientific ESCALAB 250 to investigate the chemical state of the element on the surface of Al-MIL-53-NO2. The pore size and surface area of Al-MIL-53-NO2 were measured by using Autosorb iQ (Quantachrome Instruments).2.4 H2S fluorescence sensing measurements
NaHS was used as the H2S source and dissolved in DI water to form a transparent solution.23,25,35 In this paper, “H2S treated” or “H2S treatment” means that Al-MIL-53-NO2 is suspended in NaHS solution with a specific concentration. In a typical experiment, 1.5 mg Al-MIL-53-NO2 was suspended into the cuvette containing 3.0 mL NaHS solution with various concentrations (0.0–5.0 mM) for 2 hours before centrifugation. The corresponding supernatant and the suspended undissolved particles were separated by centrifugation at 12![[thin space (1/6-em)]](https://www.rsc.org/images/entities/char_2009.gif) 000 rpm for 10 minutes. The re-collected particles were washed with water three times and re-dispersed into 3.0 mL DI water for further photoluminescence measurement. For all the fluorescence measurements, the excitation wavelength (λex) was 339 nm and the emission spectra were recorded in the range of 380–580 nm. Both the emission and excitation slits were set to be 2 nm.
000 rpm for 10 minutes. The re-collected particles were washed with water three times and re-dispersed into 3.0 mL DI water for further photoluminescence measurement. For all the fluorescence measurements, the excitation wavelength (λex) was 339 nm and the emission spectra were recorded in the range of 380–580 nm. Both the emission and excitation slits were set to be 2 nm.
3. Results and discussion
3.1 Characterization of Al-MIL-53-NO2
The crystallinity and structure of Al-MIL-53-NO2 were determined by PXRD. As shown in Fig. 1a, all the peaks are consistent with those as reported in the previous references, where Al-MIL-53-NO2 has a monoclinic crystal structure.35,39,40 The main peak was located at ∼8.5°, which is ascribed to the (100) plane.39 The crystals and morphologies were also characterized by scanning electron microscopy (SEM). It was found that the Al-MIL-53-NO2 powders are composed of irregular nanoparticles with sizes ranging from 20 nm to 300 nm (Fig. 1b), which is also similar to that reported previously.35 In addition to the crystallinity and morphology, the vibrational analysis of the surface functional groups was directly carried out by FT-IR. The absorption peak at 1542 cm−1 (Fig. 1c) originated from the N![[double bond, length as m-dash]](https://www.rsc.org/images/entities/char_e001.gif) O stretching vibration of the nitro groups attached to the coordinated ligands, which demonstrated the successful incorporation of –NO2 group into the MOF crystals.26 The strong absorption bands at 1421 cm−1 and 1619 cm−1 are attributed to the symmetric and asymmetric –CO2 stretching vibrations from the coordinated BDC-NO2 linkers, respectively. It should be noted that the small peak at 3662 cm−1 is ascribed to the μ2-OH group.39 The porosity of Al-MIL-53-NO2 was further confirmed by the N2 sorption measurements at 77 K. As shown in Fig. 1d, the rapid increase in the low relative pressure regions demonstrated the existence of micropores in Al-MIL-53-NO2. The surface area of Al-MIL-53-NO2 based on the Brunauer–Emmett–Teller (BET) theory was calculated to be 1157 m2 g−1, which provides a large number of active sites to interact with H2S in the sensing process (detailed BET surface area calculation and plots are shown in ESI† S1 and Fig. S1).41–44 Overall, the above results indicated that Al-MIL-53-NO2 was synthesized successfully.
O stretching vibration of the nitro groups attached to the coordinated ligands, which demonstrated the successful incorporation of –NO2 group into the MOF crystals.26 The strong absorption bands at 1421 cm−1 and 1619 cm−1 are attributed to the symmetric and asymmetric –CO2 stretching vibrations from the coordinated BDC-NO2 linkers, respectively. It should be noted that the small peak at 3662 cm−1 is ascribed to the μ2-OH group.39 The porosity of Al-MIL-53-NO2 was further confirmed by the N2 sorption measurements at 77 K. As shown in Fig. 1d, the rapid increase in the low relative pressure regions demonstrated the existence of micropores in Al-MIL-53-NO2. The surface area of Al-MIL-53-NO2 based on the Brunauer–Emmett–Teller (BET) theory was calculated to be 1157 m2 g−1, which provides a large number of active sites to interact with H2S in the sensing process (detailed BET surface area calculation and plots are shown in ESI† S1 and Fig. S1).41–44 Overall, the above results indicated that Al-MIL-53-NO2 was synthesized successfully.
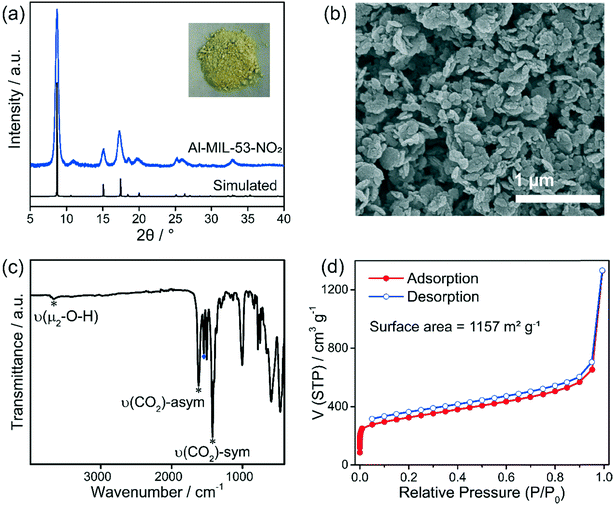 | ||
| Fig. 1 (a) PXRD patterns and digital image (inset), (b) SEM image, (c) FT-IR spectrum, and (d) gas sorption isotherms of the Al-MIL-53-NO2 nanoparticles. | ||
3.2 H2S sensing performance
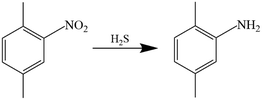
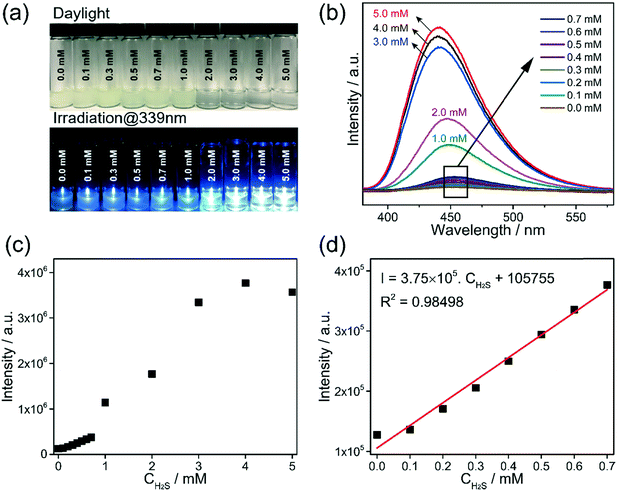
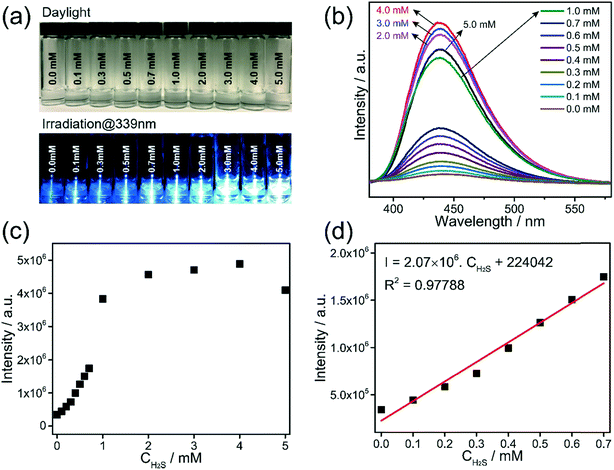
The detection capability of Al-MIL-53-NO2 for H2S was investigated by performing fluorescence “turn-on” experiment in the aqueous suspension system. NaHS was used as the source of H2S in this study.25,35 Owing to the existence of electron-withdrawing nitro groups in the coordinated BDC-NO2 ligand, Al-MIL-53-NO2 is non-luminous and remains in the fluorescence “turn-off” state.35 Once exposed to H2S, –NO2 is reduced to the electron-donating –NH2 groups and fluorescence enhancement was observed based on the following reaction:For H2S sensing quantification, 1.5 mg Al-MIL-53-NO2 was suspended in 3 mL DI water with various NaHS concentrations from 0.0 mM to 5.0 mM. To ensure the complete conversion of –NO2 to –NH2 in the sensing process, the suspension was kept in a sealed glass vial for 2 hours and then shaken to form a uniform suspension for photoluminescence measurement. The excitation wavelength was determined at 339 nm by scanning 1.0 mM H2S treated Al-MIL-53-NO2 suspension from 380 nm to 580 nm with the maximum emission peak located at 450 nm, as shown in Fig. S2.† All the fluorescence emission spectra were recorded in the range from 380 nm to 550 nm at the excitation wavelength of 339 nm in this study. It is found that H2S showed a significant “turn-on” response to the Al-MIL-53-NO2 suspensions (Fig. 2a–c). An excellent linear correlation (R2 = 0.98498) was obtained between the fluorescence intensities and H2S concentrations within 0.7 mM (Fig. 2d). Moreover, the limit of detection (LOD) was calculated to be 69.3 μM (detailed LOD calculations are shown in ESI† S2), which indicated that Al-MIL-53-NO2 can be used for the quantitative detection of H2S in the aqueous suspension system. It is noteworthy that the fluorescence intensity was vastly enhanced when the H2S concentration was larger than 1.0 mM and tended to be constant within the range from 2.0 mM to 5.0 mM. The possible mechanisms for such significant “turn-on” fluorescence increment will be discussed in the next section.
3.3 Exploration of the “Turn-On” effect
Most studies ascribe the “turn-on” effect to the conversion of –NO2 to –NH2 groups by “MOF transformation” and fluorescence signals of MOFs in the suspension were used for quantitative H2S detection. Few researchers separated the undissolved particles to give direct evidence of –NH2 groups on the surface of MOF after exposure to H2S. In order to determine whether luminescence enhancement comes from the –NH2 groups in MOF or the free ones in the solution, the suspensions were centrifuged at 12![[thin space (1/6-em)]](https://www.rsc.org/images/entities/char_2009.gif) 000 rpm for 10 minutes to separate the undissolved particles and supernatant for further analysis (see Scheme 1). The exploration of the “Turn-On” effect was carried out through the analysis of both undissolved nanoparticles (section 3.3.1) and supernatant (section 3.3.2).
000 rpm for 10 minutes to separate the undissolved particles and supernatant for further analysis (see Scheme 1). The exploration of the “Turn-On” effect was carried out through the analysis of both undissolved nanoparticles (section 3.3.1) and supernatant (section 3.3.2).
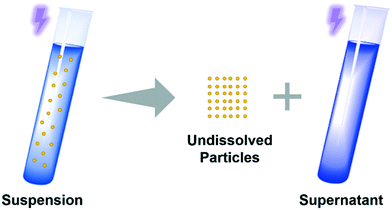 | ||
| Scheme 1 Undissolved particles and supernatant were separated by centrifugation for further analysis. | ||
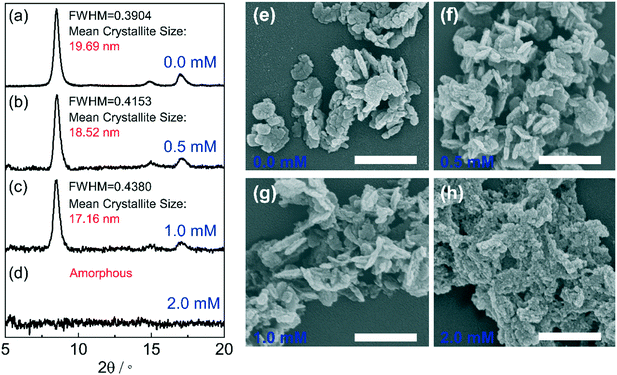
where τ is the mean size of the crystallite; K is the dimensionless shape factor (K = 0.89); λ is the X-ray wavelength (λ = 1.5406 Å); β is the line broadening at the maximum intensity or the so-called full width at half maximum (FWHM); θ is the Bragg angle, it was found that with H2S concentration increased from 0.0 mM to 0.5 mM, and 1.0 mM, the FWHM of the peak at 8.5° becomes broader, and the corresponding calculated mean crystallite size within the (100) domain is reduced from 19.69 nm to 18.52 nm and 17.16 nm, respectively (Fig. 3(a–c)). The small shrinkage of the Al-MIL-NO2 crystals could be caused by the original Al-MIL-53-NO2 being degraded from outside to the core, where the peripheral bridged Al–O bonds were broken in the alkaline NaHS solution.45 Similar morphologies of the recollected Al-MIL-53-NO2 nanoparticles treated with 0.5 mM and 1.0 mM H2S as compared to the pristine Al-MIL-53-NO2 (Fig. 3(e–g)) confirmed that the residual Al-MIL-53-NO2 nanoparticles kept the same shapes with the 1.0 mM H2S treatment. When the H2S concentration increased to 2.0 mM, the initial Al-MIL-53-NO2 crystalline materials collapsed and an amorphous PXRD pattern was obtained (Fig. 3d). The large crystals disappeared, leaving much smaller amorphous particles, as shown in Fig. 3h. Interestingly, similar peak broadening phenomena were also observed in other nitro-functionalized MOFs (Zr-UiO-66-NO2, Ce-UiO-66-NO2, and Zr-UiO-66-(NO2)2) during H2S detection,22,23,32 which indicated that all these MOFs could be partially consumed and the particle sizes became smaller after being treated with H2S. The particles with reduced crystal size and the released species into the solution could cause a dramatic change in the fluorescence intensity, which will be further discussed using Al-MIL-53-NO2 in the next section (section 3.3.2).
The functional groups of the undissolved Al-MIL-53-NO2 nanoparticles treated with 0.5 mM and 1.0 mM H2S were analyzed by an FT-IR spectrometer. As shown in Fig. S4,† two major peaks were observed for Al-MIL-53-NH2 at 3387 and 3499 cm−1, corresponding to symmetric and asymmetric N–H stretching vibration, respectively. However, no apparent peaks were observed for the undissolved particles, which indicated that –NO2 groups on undissolved Al-MIL-53-NO2 nanoparticles were not reduced to –NH2 groups after H2S sensing.
Al-MIL-53-NO2 before and after 1.0 mM H2S treatment was further analyzed by X-ray photoelectron spectroscopy (XPS) (Fig. 4). For pristine Al-MIL-53-NO2, the high-resolution spectrum of N 1s can be divided into two peaks located at 399.1 eV and 405.5 eV (Fig. 4a), which are attributed to N–C and –NO2 groups within Al-MIL-53-NO2, respectively.46 After being exposed to 1.0 mM H2S, no other peaks related to N 1s appeared (Fig. 4b) and the ratio of the peak area of N–O to C–N remained almost the same (before: 1.71![[thin space (1/6-em)]](https://www.rsc.org/images/entities/char_2009.gif) :
:![[thin space (1/6-em)]](https://www.rsc.org/images/entities/char_2009.gif) 1; after 1.62
1; after 1.62![[thin space (1/6-em)]](https://www.rsc.org/images/entities/char_2009.gif) :
:![[thin space (1/6-em)]](https://www.rsc.org/images/entities/char_2009.gif) 1), indicating that the undissolved Al-MIL-53-NO2 nanoparticles in 1.0 mM H2S solution shared similar surface chemical properties with the pristine unreacted Al-MIL-53-NO2. Similar survey XPS pattern was also obtained for Al-MIL-53-NO2 treated with 1.0 mM H2S (Fig. S5†), where the peaks of binding energy at ∼532 eV, ∼405 eV, ∼285 eV, ∼119 eV, and ∼74 eV are ascribed to C 1s, N 1s, O 1s, Al 2s, and Al 2p, respectively. Moreover, the as-synthesized Al-MIL-53-NH2 was used for comparison (Fig. S6†). The high-resolution N 1s spectrum of Al-MIL-53-NH2 exhibits two peaks at 399.3 eV and 398.5 eV, which can be assigned to C–N bonds and NH2 groups, respectively (Fig. S6†).47 It is not surprising that this N 1s information related to Al-MIL-53-NH2 cannot be observed in Fig. 4b since the 1.0 mM H2S treated Al-MIL-53-NO2 shared almost the same chemical properties with the unreacted one.
1), indicating that the undissolved Al-MIL-53-NO2 nanoparticles in 1.0 mM H2S solution shared similar surface chemical properties with the pristine unreacted Al-MIL-53-NO2. Similar survey XPS pattern was also obtained for Al-MIL-53-NO2 treated with 1.0 mM H2S (Fig. S5†), where the peaks of binding energy at ∼532 eV, ∼405 eV, ∼285 eV, ∼119 eV, and ∼74 eV are ascribed to C 1s, N 1s, O 1s, Al 2s, and Al 2p, respectively. Moreover, the as-synthesized Al-MIL-53-NH2 was used for comparison (Fig. S6†). The high-resolution N 1s spectrum of Al-MIL-53-NH2 exhibits two peaks at 399.3 eV and 398.5 eV, which can be assigned to C–N bonds and NH2 groups, respectively (Fig. S6†).47 It is not surprising that this N 1s information related to Al-MIL-53-NH2 cannot be observed in Fig. 4b since the 1.0 mM H2S treated Al-MIL-53-NO2 shared almost the same chemical properties with the unreacted one.
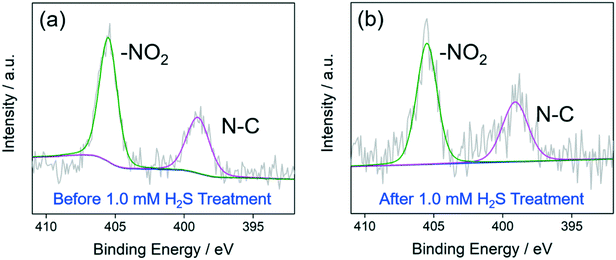 | ||
| Fig. 4 High-resolution spectra of N 1s of Al-MIL-53-NO2 before (a) and after (b) being treated with 1.0 mM H2S. | ||
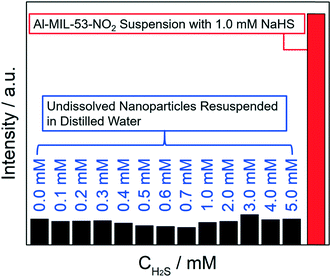
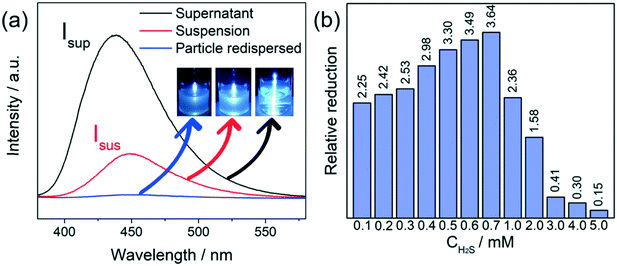
Additionally, the recollected Al-MIL-53-NO2 nanoparticles after interaction with various concentrations of H2S were resuspended in 3.0 mL DI water for further photoluminescence measurement. It turns out that all the undissolved Al-MIL-53-NO2 nanoparticles dispersed in water showed no fluorescence intensity and stayed in the “turn-off” mode (Fig. 5), which further confirmed that there were no –NH2 groups at the surface of the undissolved H2S-treated Al-MIL-53-NO2 nanoparticles.
Overall, the recollected particles from H2S treatment suspension were analyzed by XRD, SEM, FT-IR, PL, and XPS, and these nanoparticles were proved to be almost identical to the unreacted Al-MIL-53-NO2 (0.1–1.0 mM). In addition, there were no –NH2 groups attached to these remaining Al-MIL-53-NO2 based on the FT-IR and XPS data, indicating that –NO2 on the surface of Al-MIL-53-NO2 were not converted to –NH2. Therefore, it can be concluded that these remaining unreacted suspended Al-MIL-53-NO2 particles made no contribution to the fluorescence enhancement in the H2S sensing process.
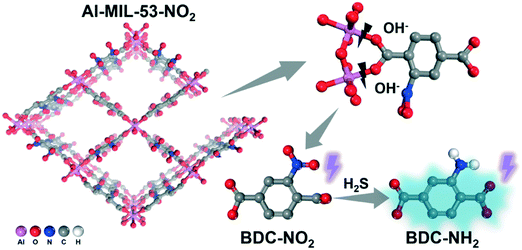
To analyze the fluorophores in the supernatant, the transparent supernatant from 1.0 mM H2S treated Al-MIL-53-NO2 suspension was heated at 120 °C in air to evaporate the solvent and the extracts were characterized by FT-IR. Sodium 2-aminoterephthalate, which serves as the real fluorophore in the solution, was detected in the FT-IR spectrum of the residues (Fig. S7†).48 The broad peak with a maximum at 3370 cm−1 can be assigned to the amino groups interacting with the metal sodium after evaporation.48,49 The completely deprotonated asymmetric and symmetric COO− vibrations were observed at 1590 cm−1 and 1371 cm−1, respectively.48 Moreover, a very small amount of –NO2 groups was also detected, indicating that BDC-NO2 from Al-MIL-53-NO2 existed in the supernatant after 1.0 mM H2S treatment (Fig. S7†). Considering that no –NH2 groups were observed on the undissolved Al-MIL-53-NO2 nanoparticles (section 3.3.1), these results suggest that the linker BDC-NO2 was first released because of Al-MIL-53-NO2 degradation in the solution and then reduced to BDC-NH2 by H2S treatment. Such partial structural decomposition of the initial Al-MIL-53-NO2 (Al–(OOC–NO2−) → Al–OH− + NO2–COO− (BDC-NO2)) could stem from the replacement of the linkers by hydroxide ions (OH−), which competitively bind to metal cations from the MOF clusters in the basic NaHS solution.45,50 The conversion of –NO2 to –NH2 that occurs in the solution rather than on the MOF is probably because free BDC-NO2 in the aqueous solution is more easily reduced by NaHS while the center of the Al–O clusters in solid-state Al-MIL-53-NO2 increase the resistance towards NaHS attack. Therefore, it can be concluded that after H2S treatment, a part of Al-MIL-53-NO2 collapsed and the released BDC-NO2 was reduced to BDC-NH2, which gave rise to the fluorescence “turn-on” effect (Scheme 2).
The results of the above supernatant analysis matched well with the peak broadening in the XRD pattern, as discussed in the previous section (section 3.3.1). The remaining particles with reduced crystal size and the released fluorophores in the solution could also have an effect on the fluorescence signal. It is noteworthy that, for Al-MIL-53-NO2 treated with 1.0 mM H2S, a much greater fluorescence intensity at 450 nm of the supernatant was achieved, as compared to that of the suspension (Fig. 7a). Such an enhancement in the emission of the supernatants can be also observed for Al-MIL-53-NO2 upon treatment with H2S at other concentrations (Fig. S8†). The reduced fluorescence of the suspension, as compared to the supernatant, is mainly caused by the unreacted non-luminescent Al-MIL-53-NO2 dispersed in the aqueous system. The unreacted Al-MIL-53-NO2 would absorb and scatter the incident excitation light and hence, decrease the photoluminescence intensity.51 To further understand the emission difference between the supernatant and the suspension, we define relative reduction (η) as the ratio of fluorescence intensity difference between the supernatant and the suspension to that of the suspension,
4. Conclusion
In summary, the photoluminescence properties of Al-MIL-53-NO2 for H2S sensing have been systematically analyzed in both the suspension and the supernatant system. The mechanism of Al-MIL-53-NO2 probe for H2S detection unraveled that the fluorescence enhancement was ascribed to BDC-NH2 reduction from BDC-NO2 with the collapse of Al-MIL-53-NO2 on exposure to H2S. The undissolved nanoparticles treated with 0.1–1.0 mM H2S were proved to be Al-MIL-53-NO2 rather than Al-MIL-53-NH2 with XRD, FT-IR, and XPS measurements, and these non-luminescence nanoparticles make no contribution to fluorescence enhancement in the “turn-on” process. In particular, both the suspension (LOD = 69.3 μM) and the supernatant (LOD = 69.7 μM) can be used for quantitative H2S detection within 0–0.7 mM. This work provides a new insight into the ways of fluorophore location exploration in probe-consuming sensing applications.Conflicts of interest
There are no conflicts to declare.Acknowledgements
We are very grateful for the financial support from National Science Foundation (CMMI-1727553).References
- C. Szabó, Nat. Rev. Drug Discovery, 2007, 6, 917 CrossRef PubMed.
- G. Yang, L. Wu, B. Jiang, W. Yang, J. Qi, K. Cao, Q. Meng, A. K. Mustafa, W. Mu, S. Zhang, S. H. Snyder and R. Wang, Science, 2008, 322, 587 CrossRef CAS PubMed.
- K. Eto, T. Asada, K. Arima, T. Makifuchi and H. Kimura, Biochem. Biophys. Res. Commun., 2002, 293, 1485–1488 CrossRef CAS PubMed.
- P. Kamoun, M.-C. Belardinelli, A. Chabli, K. Lallouchi and B. Chadefaux-Vekemans, Am. J. Med. Genet., Part A, 2003, 116A, 310–311 CrossRef PubMed.
- W. Yang, G. Yang, X. Jia, L. Wu and R. Wang, J. Physiol., 2005, 569, 519–531 CrossRef CAS PubMed.
- J. Polhemus David and J. Lefer David, Circ. Res., 2014, 114, 730–737 CrossRef CAS PubMed.
- W. Zhao, J. Zhang, Y. Lu and R. Wang, EMBO J., 2001, 20, 6008 CrossRef CAS.
- T. Amou, D. Hinode, M. Yoshioka and D. Grenier, Int. J. Dent. Hyg., 2014, 12, 145–151 CrossRef CAS PubMed.
- X. Liang, Y. He, F. Liu, B. Wang, T. Zhong, B. Quan and G. Lu, Sens. Actuators, B, 2007, 125, 544–549 CrossRef CAS.
- M. T. S. R. Gomes, P. S. T. Nogueira and J. A. B. P. Oliveira, Sens. Actuators, B, 2000, 68, 218–222 CrossRef CAS.
- C. Liu, J. Pan, S. Li, Y. Zhao, L. Y. Wu, C. E. Berkman, A. R. Whorton and M. Xian, Angew. Chem., Int. Ed., 2011, 50, 10327–10329 CrossRef CAS.
- F. Yu, X. Han and L. Chen, Chem. Commun., 2014, 50, 12234–12249 RSC.
- G.-J. Mao, T.-T. Wei, X.-X. Wang, S.-y. Huan, D.-Q. Lu, J. Zhang, X.-B. Zhang, W. Tan, G.-L. Shen and R.-Q. Yu, Anal. Chem., 2013, 85, 7875–7881 CrossRef CAS PubMed.
- Y. Qian, J. Karpus, O. Kabil, S.-Y. Zhang, H.-L. Zhu, R. Banerjee, J. Zhao and C. He, Nat. Commun., 2011, 2, 495 CrossRef PubMed.
- S. K. Bae, C. H. Heo, D. J. Choi, D. Sen, E.-H. Joe, B. R. Cho and H. M. Kim, J. Am. Chem. Soc., 2013, 135, 9915–9923 CrossRef CAS PubMed.
- O. M. Yaghi, M. O'Keeffe, N. W. Ockwig, H. K. Chae, M. Eddaoudi and J. Kim, Nature, 2003, 423, 705–714 CrossRef CAS.
- T. Tian, Z. Zeng, D. Vulpe, M. E. Casco, G. Divitini, P. A. Midgley, J. Silvestre-Albero, J.-C. Tan, P. Z. Moghadam and D. Fairen-Jimenez, Nat. Mater., 2017, 17, 174 CrossRef PubMed.
- H. Wang, X. Dong, E. Velasco, D. H. Olson, Y. Han and J. Li, Energy Environ. Sci., 2018, 11, 1226–1231 RSC.
- X.-Y. Xu, X. Lian, J.-N. Hao, C. Zhang and B. Yan, Adv. Mater., 2017, 29, 1702298 CrossRef PubMed.
- I. Abánades Lázaro and R. S. Forgan, Coord. Chem. Rev., 2019, 380, 230–259 CrossRef.
- S. S. Nagarkar, T. Saha, A. V. Desai, P. Talukdar and S. K. Ghosh, Sci. Rep., 2014, 4, 7053 CrossRef CAS PubMed.
- S. S. Nagarkar, A. V. Desai and S. K. Ghosh, Chem. – Eur. J., 2015, 21, 9994–9997 CrossRef CAS PubMed.
- A. Buragohain and S. Biswas, CrystEngComm, 2016, 18, 4374–4381 RSC.
- X. Zhang, Q. Hu, T. Xia, J. Zhang, Y. Yang, Y. Cui, B. Chen and G. Qian, ACS Appl. Mater. Interfaces, 2016, 8, 32259–32265 CrossRef CAS PubMed.
- Y.-Y. Cao, X.-F. Guo and H. Wang, Sens. Actuators, B, 2017, 243, 8–13 CrossRef CAS.
- R. Dalapati, S. N. Balaji, V. Trivedi, L. Khamari and S. Biswas, Sens. Actuators, B, 2017, 245, 1039–1049 CrossRef CAS.
- Y. Li, X. Zhang, L. Zhang, K. Jiang, Y. Cui, Y. Yang and G. Qian, J. Solid State Chem., 2017, 255, 97–101 CrossRef CAS.
- S. Nandi, H. Reinsch, S. Banesh, N. Stock, V. Trivedi and S. Biswas, Dalton Trans., 2017, 46, 12856–12864 RSC.
- X. Zheng, R. Fan, Y. Song, A. Wang, K. Xing, X. Du, P. Wang and Y. Yang, J. Mater. Chem. C, 2017, 5, 9943–9951 RSC.
- Q. Gao, S. Xu, C. Guo, Y. Chen and L. Wang, ACS Appl. Mater. Interfaces, 2018, 10, 16059–16065 CrossRef CAS PubMed.
- G. Lin, W. Meng and C. Dapeng, Small, 2018, 14, 1703822 CrossRef PubMed.
- S. Nandi, S. Banesh, V. Trivedi and S. Biswas, Analyst, 2018, 143, 1482–1491 RSC.
- H. Wang, J. Cui, A. Arshad, S. Xu and L. Wang, Sci. China: Chem., 2018, 61, 368–374 CrossRef CAS.
- Y. Zhan, L. Shen, C. Xu, W. Zhao, Y. Cao and L. Jiang, CrystEngComm, 2018, 20, 3449–3454 RSC.
- X. Zhang, Q. Zhang, D. Yue, J. Zhang, J. Wang, B. Li, Y. Yang, Y. Cui and G. Qian, Small, 2018, 14, 1801563 CrossRef PubMed.
- X. Zheng, R. Fan, Y. Song, K. Xing, P. Wang and Y. Yang, ACS Appl. Mater. Interfaces, 2018, 10, 32698–32706 CrossRef CAS PubMed.
- X. Zhang, L. Fang, K. Jiang, H. He, Y. Yang, Y. Cui, B. Li and G. Qian, Biosens. Bioelectron., 2019, 130, 65–72 CrossRef CAS PubMed.
- D. Zhang, Y. Guan, E. J. M. Hensen, T. Xue and Y. Wang, Catal. Sci. Technol., 2014, 4, 795–802 RSC.
- S. Biswas, T. Ahnfeldt and N. Stock, Inorg. Chem., 2011, 50, 9518–9526 CrossRef CAS PubMed.
- A. S. Munn, R. S. Pillai, S. Biswas, N. Stock, G. Maurin and R. I. Walton, Dalton Trans., 2016, 45, 4162–4168 RSC.
- K. S. Walton and R. Q. Snurr, J. Am. Chem. Soc., 2007, 129, 8552–8556 CrossRef CAS PubMed.
- T. Xu, Z. Jiang, M. He, X. Gao and Y. He, CrystEngComm, 2019, 21, 4820–4827 RSC.
- S. Li, J. Wu, X. Gao, M. He, Y. Wang, X. Wang and Y. He, CrystEngComm, 2018, 20, 7178–7183 RSC.
- X. He and W.-N. Wang, Dalton Trans., 2019, 48, 1006–1016 RSC.
- S. Yuan, L. Feng, K. Wang, J. Pang, M. Bosch, C. Lollar, Y. Sun, J. Qin, X. Yang, P. Zhang, Q. Wang, L. Zou, Y. Zhang, L. Zhang, Y. Fang, J. Li and H.-C. Zhou, Adv. Mater., 2018, 30, 1704303 CrossRef PubMed.
- W. Li, M. Li, Y. Liu, D. Pan, Z. Li, L. Wang and M. Wu, ACS Appl. Nano Mater., 2018, 1, 1623–1630 CrossRef CAS.
- X.-X. Zheng, L.-J. Shen, X.-P. Chen, X.-H. Zheng, C.-T. Au and L.-L. Jiang, Inorg. Chem., 2018, 57, 10081–10089 CrossRef CAS PubMed.
- J. Sienkiewicz-Gromiuk, L. Mazur, A. Bartyzel and Z. Rzączyńska, J. Inorg. Organomet. Polym. Mater., 2012, 22, 1325–1331 CrossRef CAS.
- G. F. Oliveira, R. C. Andrade, A. B. Fortunato, E. S. Camargo and C. T. De Carvalho, Brazilian Journal of Thermal Analysis, 2015, 4, 01–06 CrossRef.
- X. Qian, B. Yadian, R. Wu, Y. Long, K. Zhou, B. Zhu and Y. Huang, Int. J. Hydrogen Energy, 2013, 38, 16710–16715 CrossRef CAS.
- A. P. Demchenko, Introduction to Fluorescence Sensing, Springer, New York, 2015 Search PubMed.
Footnote |
| † Electronic supplementary information (ESI) available. See DOI: 10.1039/c9ce01595g |
| This journal is © The Royal Society of Chemistry 2020 |

