 Open Access Article
Creative Commons Attribution 3.0 Unported Licence
Electrochemical formation protocols for maximising the life-time of a sodium ion battery†
Brij
Kishore‡
 a,
Lin
Chen‡
 a,
Claire E. J.
Dancer
 b and
Emma
Kendrick
 *a
*a
aSchool of Metallurgy and Materials, University of Birmingham, Edgbaston B15 2TT, UK. E-mail: e.kendrick@bham.ac.uk
bWarwick Manufacturing Group, University of Warwick, Gibbet Hill Road, Coventry, CV4 7AL, UK
First published on 18th September 2020
Abstract
Electrochemical protocols for reducing formation time and maximising cycle life in a sodium ion battery are proposed. The formation protocols comprise low current cycles within a targeted voltage window. After accelerated cell aging tests, the impedance and cycle life are evaluated. Maximum life time is obtained for formation within the 3.6–3.8 V window. 250 cycles are observed to 80% of initial capacity with accelerated ageing, compared to 90 cycles with no formation.
Na-ion batteries (NIBs) are catching up with Li-ion batteries (LIBs) with regards to commercialization. The similarities between LIBs and NIBs in terms of material components and manufacturing methodologies make NIBs a “drop-in” technology to LIBs.1 Although, a further fine tuning of the active materials, electrode, cell manufacturing techniques, and electrolytes are required before NIBs will emerge as a low cost alternative to LIBs. In terms of NIB cell development, several advances have been made and prototypes have been demonstrated by the likes of Faradion Ltd,2 Novasis Energies Inc.,2 Tiamat3 and Natron energy.4 Along with the efforts to identify novel electrode materials, research is also required to understand the manufacturability of NIBs compared to LIBs. One of the least understood processes in LIB is formation and conditioning, even less is known or understood for NIB. Formation is where the creation of the solid electrolyte interface (SEI) occurs, and is particular to each cell chemistry. In LIB various chemical and electrochemical (side) reactions occur at the electrode/electrolyte interfaces to form the interface layer, this is also observed for NIBs which contain similar chemistries.5,6 The process is time consuming, and can often take several weeks, depending upon the cell type.7 These interfaces are best known as the SEI formed at the negative electrode (anode) and cathode electrolyte interface (CEI) formed at the positive electrode (cathode). These interfaces form as a result of the electrolyte decomposition. An optimised formation protocol results in a good SEI/CEI which ideally provides fast transport for the intercalating Li+/Na+ ions across the interface, plays as a good electronic insulator which would protect the electrolyte from further degradation and should be stable under both cycling and ageing conditions.8
The formation process for LIBs can involve a complex interplay of various factors such as voltage,9 temperature10 and time. Typically, a few cycles of galvanostatic charge–discharge at low current, with various resting periods at elevated temperatures are carried out to ensure a uniform and stable SEI/CEI layer has formed. This process may take 2–4 weeks depending on the battery type.7 This requires electrochemical battery cyclers, environmental chambers and degassing stations to be employed, which is not only time consuming but also increases the cost of battery manufacturing with regard to equipment and floor space requirements.1,11 Wood et al. highlighted that cell formation is a capital intensive part of the battery manufacturing process and that there is a scope for more than 50% cost reduction by reducing formation time which would lead to cheaper LIBs.12 Therefore, to reduce cost, the formation process during battery manufacturing must be optimised to reduce the time without sacrificing the performance. So far there are no reports on NIBs formation. More recently accelerated formation has been shown in LIB using an active formation protocol with low current cycling.9,13 This was achieved by narrowing the potential range and bypassing the intercalation step during formation, reducing the formation time to half from the conventional formation procedure. The optimum formation cut-off voltage for LiCoO2|C cells in 1 M LiClO4 in ethylene carbonate (EC) and diethyl carbonate (DEC) (1![[thin space (1/6-em)]](https://www.rsc.org/images/entities/char_2009.gif) :
:![[thin space (1/6-em)]](https://www.rsc.org/images/entities/char_2009.gif) 1, v/v) cells is 3.7 V. In another study by An et al.,11 a fast formation protocol was developed for a ∼1.5 A h pouch cell graphite|NMC 532 in 1.2 M LiPF6 in EC:DEC. These cells were cycled using a higher voltage window (3.9–4.2 V) for the charge–discharge cycles and fewer (full depth of discharge) cycles below 3.9 V. By using a modified formation procedure, they managed to shorten formation time by a factor of 3× without compromising specific capacity and long term capacity retention. An appreciable reduction in charge transfer resistance with the new formation procedure was observed. A study by Pathan et al.14 carried out in CR2032 coin cell for C|NMC 111 in 1 M LiPF6 in EC and ethyl methyl carbonate (EMC) (3
1, v/v) cells is 3.7 V. In another study by An et al.,11 a fast formation protocol was developed for a ∼1.5 A h pouch cell graphite|NMC 532 in 1.2 M LiPF6 in EC:DEC. These cells were cycled using a higher voltage window (3.9–4.2 V) for the charge–discharge cycles and fewer (full depth of discharge) cycles below 3.9 V. By using a modified formation procedure, they managed to shorten formation time by a factor of 3× without compromising specific capacity and long term capacity retention. An appreciable reduction in charge transfer resistance with the new formation procedure was observed. A study by Pathan et al.14 carried out in CR2032 coin cell for C|NMC 111 in 1 M LiPF6 in EC and ethyl methyl carbonate (EMC) (3![[thin space (1/6-em)]](https://www.rsc.org/images/entities/char_2009.gif) :
:![[thin space (1/6-em)]](https://www.rsc.org/images/entities/char_2009.gif) 7, v/v) with 1 wt% vinyl carbonate (VC) showed that higher voltage formation (3.65–4.00 V) leads to the formation of stable SEI/CEI, reduced formation time and achieved better capacity retention.
7, v/v) with 1 wt% vinyl carbonate (VC) showed that higher voltage formation (3.65–4.00 V) leads to the formation of stable SEI/CEI, reduced formation time and achieved better capacity retention.
Considering the significance and the success of the formation optimization in LIBs, in this work we have trialled several possible formation protocols for a sodium ion cell. Different charge and discharge currents were utilised within specified voltage windows to optimize the most efficient formation potential window in order to reduce the formation time while maintaining the electrochemical performance. The materials utilised were a sodium transition metal layered oxide cathode and a hard carbon anode.15
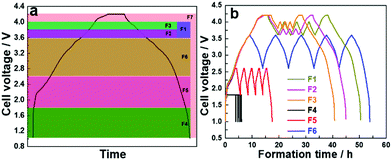
To compare the cycle life of a sodium-ion cell with different electrochemical formation protocols, a cell with no formation (F0) was compared to several formation voltage windows. Protocols were established where a low current density of 0.12 mA cm−2 (10 mA gcat−1) was applied on the full cells and five cycles of charge/discharge were carried over the voltage windows described in Table 1. A galvanostatic charge/discharge was carried out in constant current–constant voltage mode (CC–CV), where the cells were held at a maximum voltage until the current dropped to 1/10th of the applied current for the CC process, followed by a discharge process, and the process repeated. The formation protocols are categorized as: (i) high voltage formation (>3.6 V) (F1–F3) and (ii) low voltage formation (<3.6 V) (F4–F6), and are compared to a full voltage window formation F7, where the maximum voltage is 4.2 V and lower limit is 1.0 V. Fig. 1a and b show the voltage formation window, voltage profiles and the time taken for formation. The same current density and CC–CV charge protocol was applied to all formation procedures. For the high voltage formation an upper voltage V1 was followed by a lower voltage limit (V2), and then cycled between a second set of voltages (V3, V4) before a final upper voltage (V5) and at the end of formation the cell was always fully discharged to 1.0 V (V6). For the lower voltage region 5 cycles were performed between V3 and V4 before fully discharging the cell. Fig. 1a shows the chosen voltage windows for formation, and Fig. 1b shows formation protocols F1–F6. Voltage profile of F7 formation protocol is presented in Fig. S1 (ESI†).
| Protocol | V1 (V) | V2 (V) | V3 (V) | V4 (V) | V3–V4 repeat no. | V5 (V) | V6 (V) | F’tion time (h) |
|---|---|---|---|---|---|---|---|---|
| F0 | — | — | — | — | — | — | — | 0 |
| F1 | 4.2 | 3.6 | 4.0 | 3.6 | 3 | 4.2 | 1.0 | 51 |
| F2 | 4.2 | 3.6 | 3.8 | 3.6 | 3 | 4.2 | 1.0 | 45 |
| F3 | 4.2 | 3.8 | 4.0 | 3.8 | 3 | 4.2 | 1.0 | 41 |
| F4 | — | — | 3.6 | 2.6 | 4 | 3.6 | 1.0 | 6 |
| F5 | — | — | 2.6 | 1.8 | 4 | 2.6 | 1.0 | 17 |
| F6 | — | — | 1.8 | 1.0 | 5 | — | — | 54 |
| F7 | — | — | 4.2 | 1.0 | 5 | — | — | 131 |
 | ||
| Fig. 1 (a) First cycle of standard formation protocol depicting various voltages of other formation protocols and (b) voltage profiles of F1–F6 formations. | ||
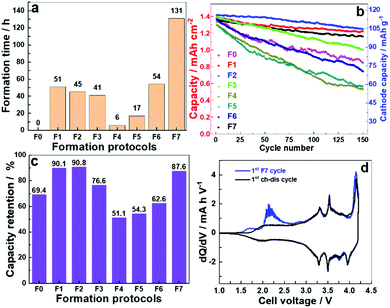
The cycling was carried out in CC–CV mode and time required to finish the formation process are presented in Fig. 2a. As shown in Table 1, the formation time was drastically reduced when we switched to the narrow voltage window from the standard voltage window. Protocols F4 and F5 were carried out in the voltage window 1.0–1.8 and 1.8–2.6 V, respectively, and registered the minimum formation time of 6 and 17 h. The formation protocols F1, F2, F3 and F6 reduced the formation time to less than half of F7. For comparison, an experiment was conducted where cells were cycled without undergoing any formation and is represented as F0.
To determine the effectiveness of these formation process, 150 charge/discharge cycles were performed on these cells after applying different formation protocols. The galvanostatic cycling was carried out in CC–CV mode with a current density of 1.2 mA cm−2 (100 mA gcat−1) between 1.0–4.2 V. The cycling data is presented in Fig. 2b. The cycling stability for cells after low rate formation at high voltages; F7, F1–F3 is significantly improved over no formation (F0) and low voltage formation (F4–F6) protocols. Along with the reduced formation time as observed in the Fig. 2a, F1 and F2 exhibit 9.9 and 9.2% capacity fade, respectively, compared to 12.4% for F7 and 39% for F0 after 150 cycles (Fig. 2c). The trend indicates that low voltage formation protocol (<3.6 V) was not sufficient to offer an appropriate formation process even though they made contributions in saving time. The possible reasons can be understood from the dQ/dV vs. V plot (Fig. 2d). The differential plot has two irreversible peaks observed in the 1st formation cycle (at 1.7 and 2.2 V) in the low voltage region of the charging profile, which is associated with the decomposition of the electrolyte (solvent).16 The peak at 2.2 V corresponds to the decomposition of FEC which has been used as an electrolyte additive in current experiments.17 The peaks between 3.3 V and 3.9 V can be attributed to the Ni2+/3+/4+ redox couples.18 The redox process involving two electrons also introduces changes in the layer alignment in the material. This phase transition may be associated with residual Ni3+/Ni4+ oxidation as suggested in the literature.19 Upon sodiation the hard carbon exhibits a sloping voltage profile and a subsequent low voltage vs. Na/Na+ plateaux, in a full cell this will occur at the high voltage between 4.0 and 4.2 V.20
When low voltage formation was carried on the cells, it primarily led to the decomposition of solvent molecules and the SEI layer formed is more insulating in nature, as illustrated through impedance measurements. This is likely due to the SEI containing fewer conducting sodium ions (Na+) as less shuttling of Na+ across the interface occurs in these voltage windows, and no subsequent ‘conditioning’ to allow for the rearrangement of the interface layer has occurred. It is known that during SEI formation in LIBs, the solvent molecules first decompose to form the organic layer and then further (electro)chemical reactions occur to make the corresponding organic/inorganic salts which make the SEI ionically conducting.16 In the low voltage formation region (<3.6 V) the high voltage where further (electro)chemical reactions take place is not reached. This indicates that for NIB as well as LIB the high voltage formation protocols offers the chance for both solvent decomposition and the formation of an ionic conducting SEI layer. The higher cell voltages relate to the lower plateau observed at ∼0.1 V for hard carbon vs. Na/Na+. This very reducing voltage is often described as being the level at which the Na+ ions become more metallic and pool within the particles of hard carbon.21–23 At this low hard carbon half-cell voltage, Na+ ions shuttle across the interface intercalating/de-intercalating into the hard carbon. As Na+ shuttles across the interface it reacts with the decomposed organic species of electrolyte (outer layer of SEI which is porous and permeable to both Na+ and electrolyte solvent molecule) making the interface more ionically conductive and forming the inner layer of the SEI which allows Na+ ion transport.24 This helps to establish a stable low impedance interface layer.
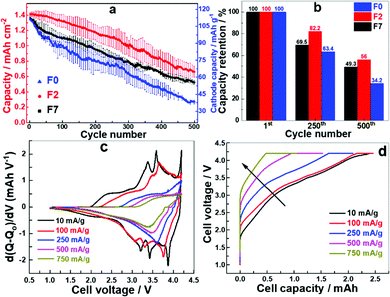
Cells with F7, F2 and F0 formation were selected for further testing due to their superior electrochemical behaviour compared to the other formation protocols. The selected cells were cycled with a current density of 1.2 mA cm−2 in CC–CV mode. The cell after F2 formation delivered a higher specific capacity at all stages of charge/discharge cycling whereas the cell with F0 delivered the least (Fig. 3a). All the cells maintained a coulombic efficiency of approximately 100% for all cycles (Fig. S2, ESI†). The capacity retention for the F2 formation cell is about 82 and 56% after 250 and 500 cycles, respectively (Fig. 3b), whereas for the cell with F0 the capacity drops to 34% after 500 cycles. A faster accelerated ageing test was designed where the specific currents and number of cycles were linearly varied (Fig. S3 (left), ESI†). The specific current was increased from 1.2 mA cm−2 (100 mA gcat−1) to 12 mA cm−2 (1000 mA gcat−1) and number of cycles were increased from 10 to 100. The whole set was then repeated on the same cell. The cell with the F2 formation process performs better at all current densities (Fig. S3 (right), ESI†). We observe significant aging at these increased rates, and the capacity retention is significantly reduced. After high rate aging the capacity at 100 mA g−1 (0.8C) is approximately 50%, indicating inaccessible Na inventory after cycling at these high rates. The capacity observed after high rate aging at 750 mA g−1 and 1000 mA g−1 is however very similar. In addition we also note that the fade rate per cycle increases with an increasing rate up to 500 mA g−1, and the fade rate is higher for F0 compared to F7 and F2, (Table S1, ESI†) again indicating that the formation has a large effect upon the cycling performance of a cell. As the rate increases and the cells age, and the ability to extract the sodium from the lower voltage plateau on the hard carbon is likely reduced, partially due to the increase in the internal charge transfer resistance from the interface layer resistance (Fig. 4b). We can therefore conclude that with the increased resistance in the cell, at high rates the full capacity is not realised as the polarisation is too great to extract the Na+ ions from the lower voltage plateau on the hard carbon, as the cells age this resistance increases and even when returning to lower rates the polarisation in the cell is still too large to extract all the Na+ ions fully. This is also illustrated by the change in the dQ/dV plots with increasing rate (Fig. 3c). As the rate increases past 500 mA g−1 the high voltage capacity is not observed, and the increase in the polarisation is very apparent in the charge profiles in particular (Fig. 3d).
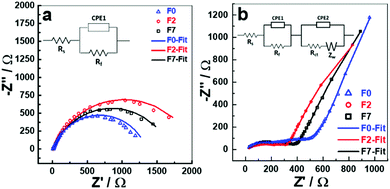
The electrochemical impedance spectra (EIS) for the fresh cells (Fig. S4, ESI†) were taken after cell assembly at open circuit voltage (OCV) and are very similar representing the capacitor behaviour evident from the long tail parallel to the y-axis. The cells were then subjected to F7 and F2 formations, sufficient rest time to achieve a stable OCV after the final discharge and then EIS was recorded. From Fig. 4a, and non-linear least square (NLLS) fitting of an equivalent circuit model (Fig. 4a inset) was performed, and the value of the resistances and constant phase elements tabulated (Table S2, ESI†). The Rs value of ∼12 Ω is very similar for all the three cells which represents the total or series resistance of the cell. Rs only varies slightly indicating the impedance parameters obtained are reliable. The Rf value is maximised for the cell after F2 protocol suggesting that a more resistive SEI layer is formed after F2 than in the cells which underwent F7 or 5 charge/discharge cycles (F0), Rf in this case is likely a combination of charge transfer resistances across the anode and cathode interfaces. The CPE components are included to account for the capacitive behaviour and residual currents arising due to the SEI formation. The theoretical spectrum generated from the fit procedure is shown as smooth curves in Nyquist plots and the experimental data points are presented as open circles (Fig. 4). The EIS of the cells after 500 charge–discharge cycles (Fig. 4b), also shows that F0 cell has a greater total impedance when compared to F7 or F2 cells suggesting that although a more resistive film was formed initially for F7 and F2, which has a greater stability upon cycling when compared to F0 and no formation.
In conclusion, various high and low voltage formation protocols were applied on full NIBs. While low voltage formation (<3.6 V) was not sufficient to form a stable SEI layer, high voltage formation protocols yielded better results by reducing formation time and improving capacity retention. The cell formation process with low current and voltage between 3.6–3.8 V (F2) led to 65% reduction in formation time compared to the F7 protocol. A capacity retention of 82 and 56% was obtained for the F2 cell which was 15.49 and 12.05% higher than the corresponding F7 cell after 250 and 500 cycles, respectively. F2 cells also demonstrated the maximum increase in the impedance of the cell after formation.
To summarise; we show for the first time a formation study for a sodium-ion cell comprised of a layered oxide positive electrode and hard carbon negative electrode. The cell which underwent an active formation protocol at room temperature gave a much improved capacity and cycle life at accelerated ageing than low rate cycling, indicating greater stability of the SEI. Significant further work investigating electrolyte additives, temperatures, currents and voltage is required to understand the formation, composition and the stability of the interface layers in sodium-ion batteries further.
The authors LC, BK, CEJD and EK thank Innovate UK for funding (IUK Project 104179).
Conflicts of interest
There are no conflicts to declare.Notes and references
- S. Roberts and E. Kendrick, Nanotechnol., Sci. Appl., 2018, 11, 23–33 Search PubMed.
- A. Bauer, J. Song, S. Vail, W. Pan, J. Barker and Y. Lu, Adv. Energy Mater., 2018, 8, 1702869 Search PubMed.
- Sodium to boost batteries by 2020, https://ra2017cnrs.fr/en/en-2020-des-batteries-dopees-au-sodium/, (accessed 14 January 2020).
- Natron Energy, https://natron.energy/technology/, (accessed 14 January 2020).
- J. B. Robinson, T. M. M. Heenan, J. R. Jervis, C. Tan, E. Kendrick, D. J. L. Brett and P. R. Shearing, J. Power Sources, 2018, 400, 360–368 Search PubMed.
- J. B. Robinson, D. P. Finegan, T. M. M. Heenan, K. Smith, E. Kendrick, D. J. L. Brett and P. R. Shearing, J. Electrochem. Energy Convers. Storage, 2018, 15(1), 011010 Search PubMed.
- E. Kendrick, Future Lithium-ion Batteries, The Royal Society of Chemistry, 2019, pp. 262–289 Search PubMed.
- E. Peled, J. Electrochem. Soc., 1979, 126, 2047 Search PubMed.
- H. H. Lee, Y. Y. Wang, C. C. Wan, M. H. Yang, H. C. Wu and D. T. Shieh, J. Power Sources, 2004, 134, 118–123 Search PubMed.
- Z. Chen and J. R. Dahn, Electrochem. Solid-State Lett., 2004, 7, 11–14 Search PubMed.
- S. J. An, J. Li, Z. Du, C. Daniel and D. L. Wood, J. Power Sources, 2017, 342, 846–852 Search PubMed.
- D. L. Wood, J. Li and C. Daniel, J. Power Sources, 2015, 275, 234–242 Search PubMed.
- P. C. J. Chiang, M. S. Wu and J. C. Lin, Electrochem. Solid-State Lett., 2005, 8, 423–427 Search PubMed.
- T. S. Pathan, M. Rashid, M. Walker, W. D. Widanage and E. Kendrick, J. Phys. Energy, 2019, 1, 044003 Search PubMed.
- Faradion Ltd., United States, US20150243983A1, 2015.
- V. A. Agubra and J. W. Fergus, J. Power Sources, 2014, 268, 153–162 Search PubMed.
- L. Chen, B. Kishore, M. Walker, C. E. J. Dancer and E. Kendrick, Chem. Commun., 2020 10.1039/D0CC03976D.
- I. Hasa, D. Buchholz, S. Passerini, B. Scrosati and J. Hassoun, Adv. Energy Mater., 2014, 4, 2–8 Search PubMed.
- D. Yuan, X. Hu, J. Qian, F. Pei, F. Wu, R. Mao, X. Ai, H. Yang and Y. Cao, Electrochim. Acta, 2014, 116, 300–305 Search PubMed.
- K. Smith, J. Treacher, D. Ledwoch, P. Adamson and E. Kendrick, ECS Trans., 2017, 75, 13–24 Search PubMed.
- E. Irisarri, A. Ponrouch and M. R. Palacin, J. Electrochem. Soc., 2015, 162, A2476–A2482 Search PubMed.
- D. A. Stevens and J. R. Dahn, J. Electrochem. Soc., 2000, 147, 4428 Search PubMed.
- D. A. Stevens and J. R. Dahn, J. Electrochem. Soc., 2000, 147, 1271–1273 Search PubMed.
- A. Wang, S. Kadam, H. Li, S. Shi and Y. Qi, npj Comput. Mater., 2018, 4, 15 Search PubMed.
Footnotes |
| † Electronic supplementary information (ESI) available. See DOI: 10.1039/d0cc05673a |
| ‡ These authors contributed equally to this work. |
| This journal is © The Royal Society of Chemistry 2020 |


