
 Open Access Article
 This Open Access Article is licensed under a
 Creative Commons Attribution 3.0 Unported Licence
Metastable crystalline phase formation in deep eutectic systems revealed by simultaneous synchrotron XRD and DSC†
Charlie L.
Hall
 a,
Jason
Potticary
a,
Victoria
Hamilton
a,
Simon
Gaisford
b,
Asma
Buanz
b and
Simon R.
Hall
*a
a,
Jason
Potticary
a,
Victoria
Hamilton
a,
Simon
Gaisford
b,
Asma
Buanz
b and
Simon R.
Hall
*a
aSchool of Chemistry, Cantock's Cl., Bristol, BS8 1TS, UK. E-mail: simon.hall@bristol.ac.uk
bUCL School of Pharmacy, University College London, 29-39 Brunswick Square, London, WC1N 1AX, UK
First published on 6th August 2020
Abstract
The phase behaviour of various deep eutectic systems was analysed using concurrent synchrotron powder X-ray diffraction and differential scanning calorimetry. Deep eutectic systems containing the pharmaceuticals metacetamol, 2-ethoxybenzamide or benzamide as binary mixtures with phenol revealed new crystalline phases melting either before or with crystals of phenol, highlighting their lower stabilities. Furthermore, in the phenol![[thin space (1/6-em)]](https://www.rsc.org/images/entities/char_2009.gif) :2-ethoxybenzamide system it was shown that multiple metastable phases can form, highlighting the potential for the separation of a hierarchy of crystal structures with differing stabilities from eutectic systems. Through these experiments, we strengthen the idea that eutectic systems can be described by understanding the formation and stabilities of metastable co-crystalline structures. These novel results lead to a deeper understanding of the structure and thermodynamics of deep eutectic solvents, with relevance for analagous systems across materials science.
:2-ethoxybenzamide system it was shown that multiple metastable phases can form, highlighting the potential for the separation of a hierarchy of crystal structures with differing stabilities from eutectic systems. Through these experiments, we strengthen the idea that eutectic systems can be described by understanding the formation and stabilities of metastable co-crystalline structures. These novel results lead to a deeper understanding of the structure and thermodynamics of deep eutectic solvents, with relevance for analagous systems across materials science.
Deep eutectic solvents (DESs) are now a widely accepted class of ionic liquid, studied due to their applicability in a broad array of fields such as metal extraction,1 catalysis2 and pharmaceutical formulation.3 Since they were first categorised by Abbott et al. in 2001,4 both the number of known DESs and their potential applications has rapidly expanded.5
In general, the formation of a DES is mediated via hydrogen bonding between a hydrogen bond donating (HBD) and hydrogen bond accepting (HBA) species.6 Many of the DESs studied to date contain an ammonium cation as the HBA, which can hydrogen bond with a range of metal salts and molecules with HBD like properties. More recently, the group of molecules found to form DESs has grown to include numerous amines, amino acids, sugars and carboxylic acids, which include the group of natural deep eutectic solvents (NADES)7 and therapeutic deep eutectic solvents (THEDES).8
One recent application of DESs is their use as a medium for evaporative crystal growth of pharmaceuticals, by utilising a system where one of the components is inherently volatile.9 These systems, generally consisting of phenol acting as the HBD, are known as volatile deep eutectic solvents (VODESs) and have been shown to give polymorphic control between the common form I and the elusive form II of paracetamol. The metastable form III benzamide (BZM) was also isolated for the first time, crystallising stochastically from a phenol:BZM VODES of ratios 4:1–10:1. Additionally, a phenol:metacetamol (MAP) VODES facilitated morphological control, switching from fibrous to a more easily processed granular morphology, when crystallised from VODES of molar ratio below 7:1. In general, these eutectic systems contain a high percentage of phenol, with many only forming a eutectic at ratio of 4:1–10:1 (phenol:HBA). Of interest here is how the hydrogen bonding networks present in the DESs10 may be mediating the formation of particular crystal structures. It is suggested that this mediation may be through the desolvation of phenol co-crystal intermediates, or via unique pre-nucleation clusters caused by extensive hydrogen bonding networks. Indeed, analysis of such mixtures has allowed for the isolation and structure solution of phenol co-crystal structures of 2-ethoxybenzamide (2EB) and harmine, which were found to act as intermediates during the evaporation of their respective phenol VODESs.9 Furthermore, in the phenol:metaxalone VODES system it was shown that the formation of a phenol co-crystal with a ratio of 3:1 is a necessary intermediate to the metastable conglomerate form A-R/S.11
The depression in melting point of a DES compared to the isolated constituents is commonly attributed to charge delocalisation, caused by the formation of a network of hydrogen bonding motifs between the constituent species.12 However, low-temperature powder X-ray diffraction (pXRD) studies of the choline chloride:urea DES uncovered the formation of a low-melting co-crystalline phase of the mixture.13 It was therefore suggested that in such cases it may be more revealing to study the differences between the energy of the co-crystalline and eutectic liquid phases when trying to understand the cause of the melting point depression. To-date, crystallographic analysis of such complex phase behaviour in DESs has yet to be performed. In systems where these phases exist, a complex set of transitions must occur as the temperature of the system is changed, including the separation of deep eutectics and co-crystals of varying stoichiometries (Fig. 1).
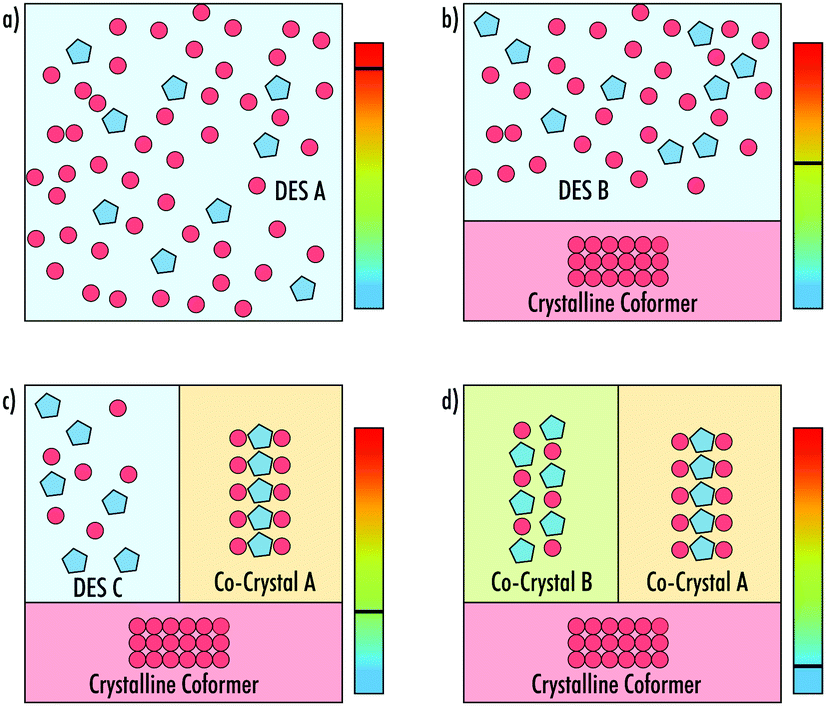 | ||
| Fig. 1 Schematic showing how a DES could separate into phases as it is cooled from (a–d). In this example, (a) depicts a homogeneous liquid DES A, (b) one coformer crystalises out, leaving a liquid DES B with an altered stoichiometry, (c) co-crystal A forms, leaving a liquid DES C with a third stoichiometry. Finally, (d) a third crystalline phase forms as co-crystal B, with a different stochiometry to co-crystal A, leaving the whole system as a three-phase solid. | ||
In this work, we concurrently study the thermal and structural properties of particular VODES mixtures of phenol:MAP, phenol:2EB and phenol:BZM, and show that the root of the unique crystallisation behaviours they exhibit from VODESs is a hitherto unobserved sequence of novel crystalline phases.
The simultaneous collection of thermal and structural data with synchronous pXRD and differential scanning calorimetry (DSC) has been used to assess polymorphic changes of drug molecules with temperature.14–17 The use of a synchrotron X-ray source allows for well-defined 2-dimensional X-ray patterns of organic samples to be collected in 1 °C intervals at scan speeds of 10 °C min−1. Peaks attributed to the aluminium pan can easily be disregarded as they tend to have little overlap with the area of interest for organic crystal structures.
For all samples, DSC cycles were run using the same method. The initial heating cycle was run at 10 °C min−1 from 30 °C to 70 °C, followed by a cooling cycle to −70 °C at ∼30 °C min−1, and finally the system was heated to 100 °C at 10 °C min−1. The initial heating ramp was to ensure the homogeneity of the eutectic.
Fig. 2a shows data from the cooling and secondary heating of the phenol:MAP VODES. At the start of the cooling a broad peak due to the amorphous liquid phase can be seen, with the peak centered on 19° 2θ. On further cooling, crystallisation of phenol occurs at Tc = −12 °C, 52 °C below the reported melting point, which was confirmed via Rietveld refinement using the ambient-pressure (P21221) crystal structure.18 At this point, a large percentage of the amorphous component at 19° 2θ is seen to reduce, highlighting the depletion of a large fraction of the VODES. On heating, new peaks appear at Tt = 18 °C, alongside the phenol peaks, indicating a phase transformation to a second crystalline phase, which does not match any of the known structures for MAP or phenol (ESI† Fig. S1–S3).19,20 Analysis of the peak integrals of this new phase and the known phenol phase shows a decrease in the amount of crystalline phenol present during the transformation, suggesting that the phase transition is likely the formation of a MAP phenol co-crystal structure (Fig. 2b). All integrals throughout were taken after background subtraction, to remove any contribution of the amorphous phase. During this second phase transition there is also an increase of the amorphous fraction, showing the reformation of the VODES. Both the new phase and the phenol continue to melt at the same rate until Tm = 45 °C where the crystalline material has been fully depleted.
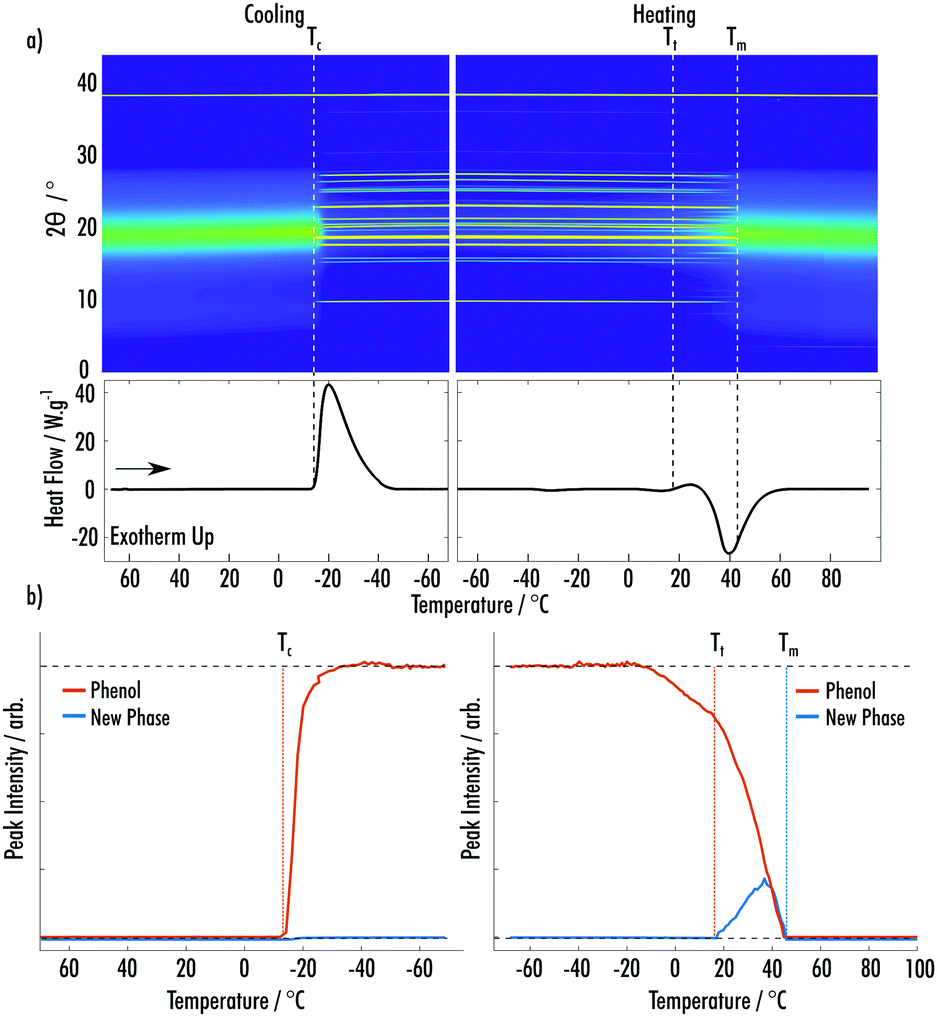 | ||
| Fig. 2 (a) (Top) Surface plot of pXRD patterns of an 8:1 phenol:MAP VODES as a function of temperature. (Bottom) DSC trace for the temperature cycle shown in the pXRD surface plot. (b) Integrated peak intensities of phenol and the new phase of phenol:MAP as a function of temperature during the cycle shown in (a). | ||
Fig. 3a shows data from the cooling and secondary heating of the phenol:2EB VODES. The predominant crystalline phase, which occurred on cooling at Tc1 = −10 °C, is easily indexed as the ambient crystal structure of phenol. Upon heating, a clear cold-crystallisation takes place at Tc2 = −21 °C, indicating the formation of a highly metastable new phase. Much like the phenol:MAP system, this phase could not be associated with any known phases of phenol, 2EB or the known phenol:2EB (1:2) co-crystal (ESI† Fig. S4–S7).21 Contrasting to the MAP system, the amount of crystalline phenol increases when the new phase appears (Fig. 3b). This is likely due to the crystallisation of the new phase resulting in excess phenol in the system, which is amenable to further crystallisation. Fig. 3a highlights that the amorphous component is at a minimum when both the phenol and new phase are crystalline. The new phase melts (Tm1 = 18 °C) before the complete melting of the phenol phase (Tm2 = 38 °C), indicating that it is less stable than the phenol crystal.
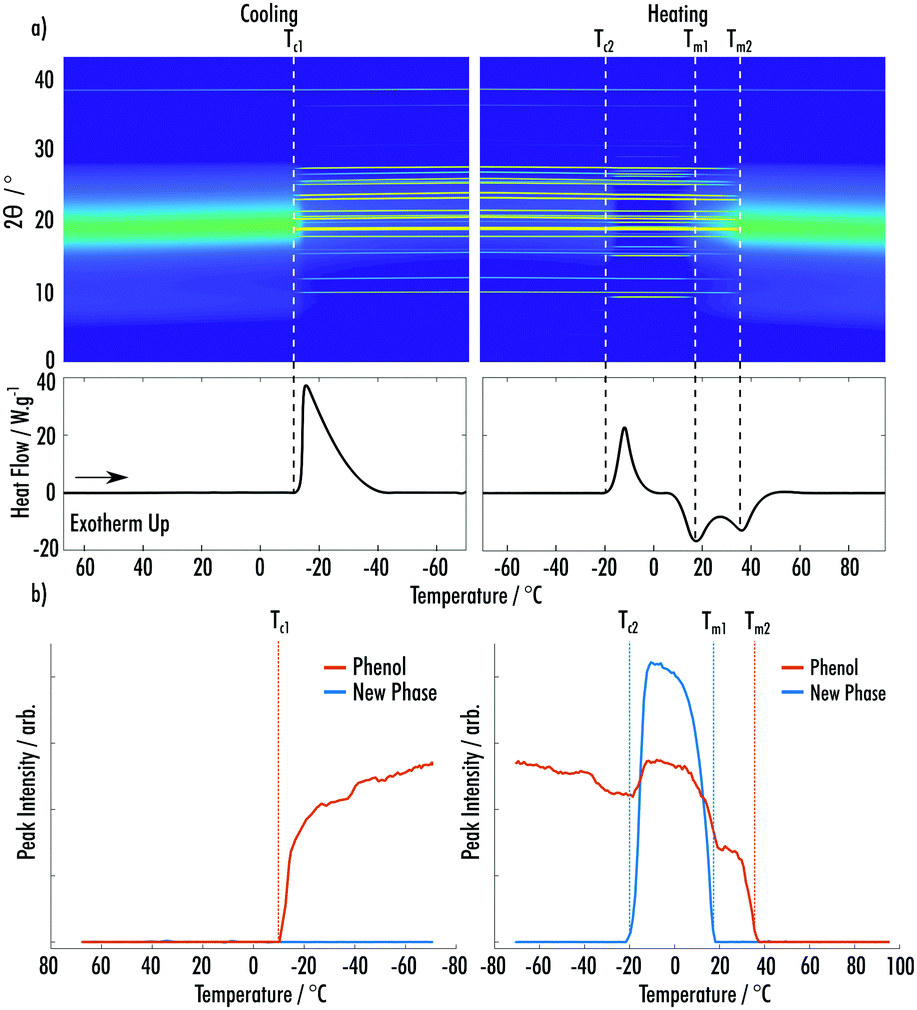 | ||
| Fig. 3 (a) (Top) Surface plot of pXRD patterns of an 8:1 phenol:2EB VODES as a function of temperature. (Bottom) DSC trace for the temperature cycle shown in the pXRD surface plot. (b) Integrated peak intensities of phenol and the new phase of phenol:2EB as a function of temperature during the cycle shown in (a). | ||
Subsequent DSC measurements, run at 10 °C min−1, were performed holding the temperature at Tc2, where the new phase was observed during the synchrotron-DSC measurements, to analyse further the formation of the new phenol:2 EB phase. After the formation of this phase, the system was cooled back to −70 °C, which subsequently led to the formation of a third phase (Fig. 4). This third phase is likely the crystallisation of residual phenol and 2EB, which remained liquid after the formation of the second phase. The heating ramp following the crystallisation of the third phase has a modified baseline and shows no glass transition, which is likely highlighting that there is a minimal amount of liquid VODES left in the system at this point. Each subsequently appearing phase has a lower melting point, highlighting a hierachy of structures with a relative decline in stability. This heirarchal phase behaviour is counterintuative when considering normal crystallisation from solvent systems, where less stable structures would be expected to form first. However, it appears that the formation of each phase is facilitating the crystallisation of subsequent phases, which in turn are less stable.
 | ||
| Fig. 4 DSC of an 8:1 phenol:2EB VODES. At the point “start” the sample has been cooled to −70 °C from 70 °C. The thermogram follows the solid line and then dashed lines. The numbers highlight the crystallisation and melts of the different phases. 3 is the phase formed on cooling the sample after it had been held at Tc2. 2 is the new phase that formed during synchrotron-DSC analysis. 1 is the ambient crystal structure of phenol, which had already crystallised during the initial cool from 70 °C. | ||
Data for the cooling and secondary heating of the phenol:BZM 9:1 VODES system are shown in Fig. 5a. Two crystallisation exotherms are seen on cooling at Tc1 = −8 °C and Tc2 = −24 °C. The first relates to the ambient crystal structure of phenol and the second again to a phase that does not match any known structures of BZM or phenol (ESI† Fig. S8–S10).22,23 On heating, two distinct melting endotherms are seen, which can be matched to the change in pXRD peaks of the respective phases. All peaks related to the new phase are depleted by Tm1 = 29 °C, which is followed by the melting of the phenol phase, which is completed by Tm2 = 44 °C (Fig. 5b).
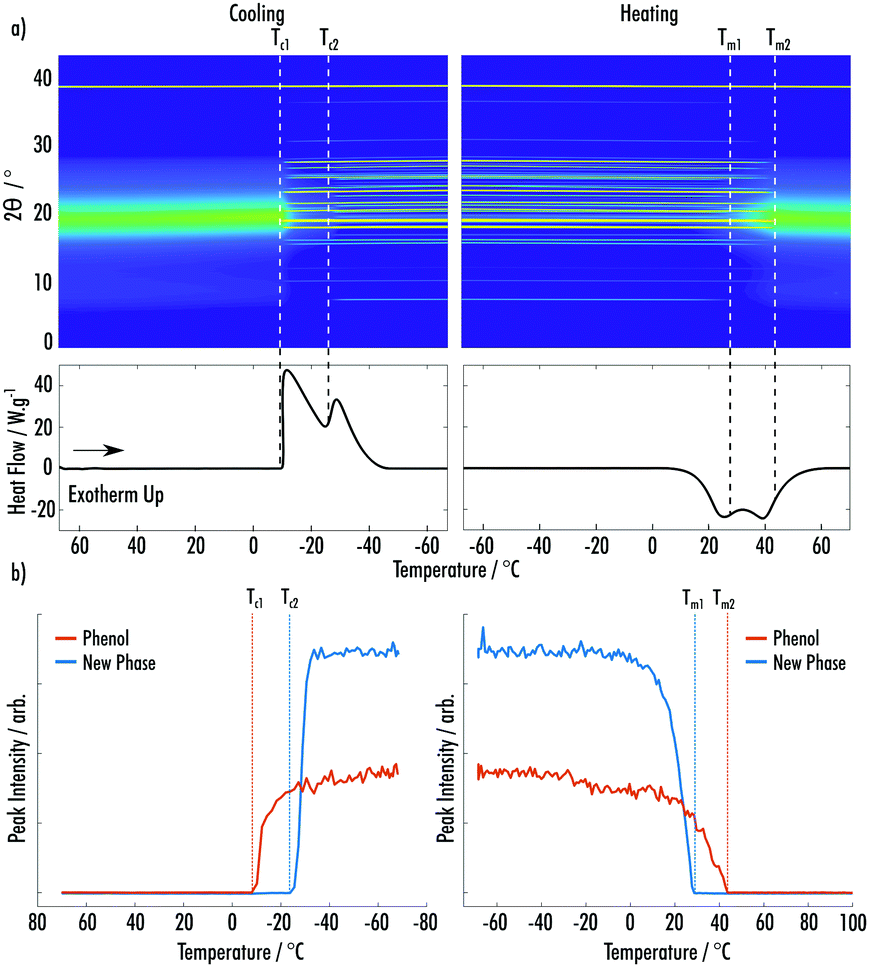 | ||
| Fig. 5 (a) (Top) Surface plot of pXRD patterns of a 9:1 phenol:BZM VoDES as a function of temperature. (Bottom) DSC trace for the temperature cycle shown in the pXRD surface plot. (b) Integrated peak intensities of phenol and the new phase of phenol:BZM as a function of temperature during the cycle shown in (a). | ||
The use of concurrent pXRD during the thermal cycling allows for the unambiguous observation that in each system a new metastable phase is formed, alongside the formation of the ambient crystalline form of phenol. In each system the crystallisation of phenol occurs between −8 °C and −12 °C. The melting point of each of the new phases can be observed by matching the disappearance of the diffraction peaks to a melting endotherm. Each of the new phases is less stable than crystalline phenol.
The isolation of the particular structure and stoichiometry of the new phases from the pXRD data presents an issue, due to the low volume fraction and peak overlap of the multiple crystalline structures. The 8:1 phenol:2EB system highlighted how multiple crystals of different stabilities can form from a single system. This suggests that there is a hierarchy of phases that can form from the cooling of a VODES, which explains why eutectics that form due to these metastable structures can appear from a variety of different HBD:HBA ratios.9 It does appear that at all points during the synchrotron-DSC experiments an amorphous component is present (ESI† Fig. S11). Analysis of the background gives an indication as to the amount of amorphous component in the VODES at any one time, however, this analysis becomes difficult when there is a significant amount of crystalline sample present. For a complete understanding of the systems discussed it will be necessary to identify the structure of each of the phases present at all times, along with analysing how a change in the ratio of the overall mixture changes the phases that can form.
In conclusion, it has been shown that the three VODES systems: an 8:1 phenol:MAP, an 8:1 phenol:2EB and a 9:1 phenol:BZM each show the formation of new crystalline phases upon thermally cycling from 70 °C to −70 °C. Each system shows that the co-crystals can form in differing manners (phase transition, cold crystallisation and crystallisation), and each new phase melts either before or with crystals of pure phenol, highlighting their lower stabilities. These VODESs exemplify the phase transformations presented in Fig. 1a–d. It is, however, clear the direct linear cooling will not in all cases result in the final system of crystalline forms depicted in Fig. 1d. To reach this scenario, the process may require multiple predetermined heating and cooling cycles, but in turn will reveal a full crystalline landscape of the VODES. Utilising knowledge from the synchrotron-DSC data, predetermined cycles of the 2EB VODES system allowed for an additional crystalline phase to be formed. Nevertheless, additional work is needed to identify the exact structure of each of the crystalline states. The new crystalline phases discovered in this work add weight to the idea that the formation of many DESs may be understood due to the existence of highly metastable low-melting point co-crystals.
S. R. H., J. P., C. H., and V. H. acknowledge the EPSRC UK (grants EP/L016648/1 and EP/L015544/1), MagnaPharm, a project funded by the European Union's H2020 Research and Innovation program (grant No. 736899). We thank Diamond Light Source for access to Beamline I12 under experiment MG23947, Dr Oxana Magdysyuk for her assistance during DSC-XRD experiments, TA Instruments (Waters, LLC) for use of the Q20 DSC equipment and Dr Richard Telford (University of Bradford) for the DSC cooling accessory RSC90.
Conflicts of interest
There are no conflicts to declare.Notes and references
- N. Osowska and L. Ruzik, Food Anal. Methods, 2019, 12, 926–935 CrossRef.
- F. Liu, Z. Xue, X. Zhao, H. Mou, J. He and T. Mu, Chem. Commun., 2018, 54, 6140–6143 RSC.
- S. Emami and A. Shayanfar, Pharm. Dev. Technol., 2020, 1–18 Search PubMed.
- A. P. Abbott, G. Capper, D. L. Davies, H. L. Munro, R. K. Rasheed and V. Tambyrajah, Chem. Commun., 2001, 2010–2011 RSC.
- H. Qin, X. Hu, J. Wang, H. Cheng, L. Chen and Z. Qi, Green Energy Environ., 2019, 5, 8–21 CrossRef.
- C. R. Ashworth, R. P. Matthews, T. Welton and P. A. Hunt, Phys. Chem. Chem. Phys., 2016, 18, 18145 RSC.
- Y. H. Choi, J. van Spronsen, Y. Dai, M. Verberne, F. Hollmann, I. W. C. E. Arends, G. J. Witkamp and R. Verpoorte, Plant Physiol., 2011, 156, 1701–1705 CrossRef CAS PubMed.
- I. M. Aroso, J. C. Silva, F. Mano, A. S. D. Ferreira, M. Dionísio, I. Sá-Nogueira, S. Barreiros, R. L. Reis, A. Paiva and A. R. C. Duarte, Eur. J. Pharm. Biopharm., 2016, 98, 57–66 CrossRef CAS PubMed.
- J. Potticary, C. Hall, V. Hamilton, J. F. McCabe and S. R. Hall, Cryst. Growth Des., 2020, 20, 2877–2884 CrossRef CAS.
- O. S. Hammond, D. T. Bowron and K. J. Edler, Green Chem., 2016, 18, 2736 RSC.
- V. Hamilton, I. Andrusenko, J. Potticary, C. Hall, R. Stenner, E. Mugnaioli, A. E. Lanza, M. Gemmi and S. R. Hall, Cryst. Growth Des., 2020, 20, 4731–4739 CrossRef CAS.
- E. L. Smith, A. P. Abbott and K. S. Ryder, Chem. Rev., 2014, 114, 11060–11082 CrossRef CAS PubMed.
- H. G. Morrison, C. C. Sun and S. Neervannan, Int. J. Pharm., 2009, 378, 136–139 CrossRef CAS PubMed.
- A. E. Clout, A. B. M. Buanz, S. Gaisford and G. R. Williams, Chem. – Eur. J., 2018, 24, 13573–13581 CrossRef CAS PubMed.
- S. Askin, J. K. Cockcroft, L. S. Price, A. D. Gonçalves, M. Zhao, D. A. Tocher, G. R. Williams, S. Gaisford and D. Q. M. Craig, Cryst. Growth Des., 2019, 19, 2751–2757 CrossRef CAS.
- Y. Pang, A. Buanz, R. Telford, O. V. Magdysyuk, S. Gaisford and G. R. Williams, J. Appl. Crystallogr., 2019, 52, 1264–1270 CrossRef CAS.
- A. Clout, A. B. M. Buanz, T. J. Prior, C. Reinhard, Y. Wu, D. O’Hare, G. R. Williams and S. Gaisford, Anal. Chem., 2016, 88, 10111–10117 CrossRef CAS PubMed.
- V. E. Zavodnik, V. K. Bel'skii and P. M. Zorkii, J. Struct. Chem., 1988, 28, 793–795 CrossRef.
- L. McGregor, D. A. Rychkov, P. L. Coster, S. Day, V. A. Drebushchak, A. F. Achkasov, G. S. Nichol, C. R. Pulham and E. V. Boldyreva, CrystEngComm, 2015, 17, 6183–6192 RSC.
- D. R. Allan, S. J. Clark, A. Dawson, P. A. McGregor and S. Parsons, Acta Crystallogr., Sect. B: Struct. Sci., 2002, 58, 1018–1024 CrossRef PubMed.
- S. Pagola and P. W. Stephens, Acta Crystallogr., Sect. C: Cryst. Struct. Commun., 2009, 65, o583–o586 CrossRef CAS PubMed.
- N. Blagden, R. Davey, G. Dent, M. Song, W. I. F. David, C. R. Pulham and K. Shankland, Cryst. Growth Des., 2005, 5, 2218–2224 CrossRef CAS.
- J. Thun, L. Seyfarth, J. Senker, R. E. Dinnebier and J. Breu, Angew. Chem., Int. Ed., 2007, 46, 6729–6731 CrossRef CAS PubMed.
Footnote |
| † Electronic supplementary information (ESI) available. See DOI: 10.1039/d0cc04696e |
| This journal is © The Royal Society of Chemistry 2020 |