 Open Access Article
High-throughput characterisation of supramolecular gelation processes using a combination of optical density, fluorescence and UV-Vis absorption measurements†
Lisa J.
White
a,
Catherine
Wark
b,
Lorraine
Croucher
b,
Emily R.
Draper
 c and
Jennifer R.
Hiscock
 *a
*a
aSchool of Physical Sciences, University of Kent, Canterbury, Kent, CT2 7NH, UK. E-mail: J.R.Hiscock@Kent.ac.uk; Tel: +44 (0)1227 823043
bBMG Labtech, 8 Bell Business Park, Buckinghamshire, HP19 8JR, UK
cSchool of Chemistry, University of Glasgow, Glasgow, G12 8QQ, UK
First published on 13th July 2020
Abstract
Herein, we showcase the use of high-throughput microplate reader methodologies for the characterisation of supramolecular gels. We demonstrate how UV-Vis absorption, optical density and fluorescence measurements can selectively define gel fibre assembly/disassembly processes, casting a new light on the construction of these materials.
Supramolecular gels are a class of soft material, formed through non-covalent interactions between the monomeric units of low molecular weight gelators.1 These monomeric units self-associate to produce a fibrous network, trapping any residual solvent.2 The scalability3 and regenerative properties4 has increased the popularity of these materials, making them of interest for a variety of applications which include chemosensors,5 biomedicines6 and drug delivery vehicles.7
To enable the characterisation and effective comparison of supramolecular organo/hydrogels, elucidation of a minimum gelation concentration through inversion testing is often obtained.8 In addition, a variety of other complementary techniques are often employed to confirm the presence, or further investigate the properties of the material. However, all these experimental techniques exhibit some limitations which include: the removal of solvent to produce a xerogel; expensive often specialised equipment; low potential for accurate data interpretation; large sample sizes; and/or long experimental time frames. Examples of these methods include the use of conventional UV-Vis absorption spectroscopy to identify organogel formation,9 dynamic light scattering to monitor fibre construction,10 rheology to observe bulk material properties,11 solution12/HRMAS13/solid14 state NMR and confocal15 or fluorescence16 microscopy to observe the gel fibres in the native material state. Furthermore, transmission and scanning electron microscopy,17 in addition to powder X-ray diffraction techniques,18,19 have been used to define the structure of gel fibres obtained from xerogels. Finally, it has been shown that neutron diffraction techniques may be developed for selectively deuterated gels,19 to observe molecular packing arrangements in aggregated and gelated materials.20
Herein, we introduce a toolkit containing a series of high-throughput characterisation methods utilising microplate reader instrumentation. This methodology toolkit will be demonstrated using a molecular example from our extensively well characterised supramolecular self-associating amphiphile (SSA) systems.16,21 Use of this instrumentation for supramolecular gel characterisation affords: (i) low sample evaporation; (ii) in situ gel–sol/sol–gel measurement; (iii) low sample volume ≈ 200 μL; (iv) multiple experimental measurements per sample; (v) retention of sample integrity; and (vi) up to 384 experiments to be performed simultaneously. Additionally, we identify new properties of this model SSA gel, previously unobservable by traditional methodologies.16
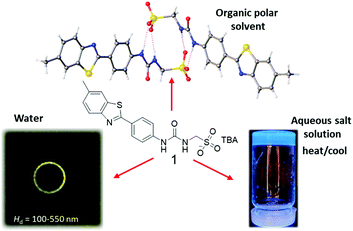
SSA 1 (Fig. 1) is an intrinsically fluorescent amphiphilic salt that has previously been shown to form anionic, hydrogen bonded dimeric species in DMSO (≈1.4 nm in diameter),21b spherical aggregates in H2O or H2O![[thin space (1/6-em)]](https://www.rsc.org/images/entities/char_2009.gif) :
:![[thin space (1/6-em)]](https://www.rsc.org/images/entities/char_2009.gif) EtOH 19
EtOH 19![[thin space (1/6-em)]](https://www.rsc.org/images/entities/char_2009.gif) :
:![[thin space (1/6-em)]](https://www.rsc.org/images/entities/char_2009.gif) 1 mixtures (≈55–350 nm in diameter),21b and hydrogels in aqueous salt solutions.16 Within the toolkit produced here, we describe the use of UV-Vis absorption, optical density and fluorescence measurements for the selective study of supramolecular gel formation/solvation. To demonstrate the applicability of each method we present comparative data for 1 (1.5 mg mL−1) in DMSO, H2O and in two aqueous salt solutions (NaCl and Na2CO3 at 0.505 M), where molecular self-association events result predominately in dimerization, spherical aggregates and gel or incomplete gel formation respectively.
1 mixtures (≈55–350 nm in diameter),21b and hydrogels in aqueous salt solutions.16 Within the toolkit produced here, we describe the use of UV-Vis absorption, optical density and fluorescence measurements for the selective study of supramolecular gel formation/solvation. To demonstrate the applicability of each method we present comparative data for 1 (1.5 mg mL−1) in DMSO, H2O and in two aqueous salt solutions (NaCl and Na2CO3 at 0.505 M), where molecular self-association events result predominately in dimerization, spherical aggregates and gel or incomplete gel formation respectively.
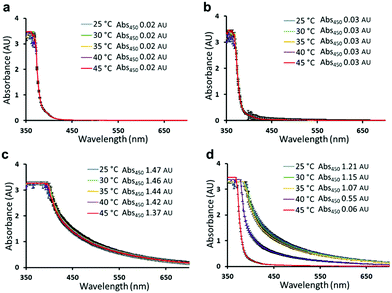
Initially, we study the self-associative structures formed by 1 using UV-Vis absorbance microplate reader measurements over a range of temperatures from 25 °C to 45 °C. Fig. 2 shows those results obtained for a solution of 1 containing: (a) anionic dimers; (b) spherical aggregates; (c) a hydrogel; (d) an incomplete hydrogel. Here, as for all UV-Vis, optical density and fluorescence microplate reader studies detailed within this work, the type of self-associated structure (dimer, spherical aggregate or gel fibre) present within the sample studied was verified through comparison with published bulk material/solution data.16,21b,c For that sample containing the self-associated dimer (Fig. 2a) or spherical aggregate form of 1 (Fig. 2b), when heated from 25 °C to 45 °C no observable difference between spectra was observed. Although, we know from previous studies that these self-associated spherical aggregates are destabilised at temperatures >40 °C.21b However, where a hydrogel or incomplete hydrogel of 1 is known to form (Fig. 2c and d respectively) we observe an increase in absorbance at 450 nm (Abs.450). Comparing the Abs.450 values for spectra shown in Fig. 2, we see they remain ≤0.03 AU for those solutions with no gel fibres present. However, where gel fibres are known to form – in the presence of NaCl (Fig. 2c) or Na2CO3 (Fig. 2d) we record Abs.450 values of 1.47 AU and 1.21 AU respectively at 25 °C. We hypothesise that these higher Abs.450 values are due to the presence of gel fibres that can absorb this wavelength and/or cause the observable scattering of the incident light. Interestingly, as the sample containing the incomplete hydrogel is heated to 45 °C, the Abs.450 value is found to decrease by ≈50% to 0.61 AU. This same decrease in Abs.450 value is not observed for the NaCl containing hydrogel, which was only found to decrease to 1.37 AU at 45 °C. Consequently, we hypothesise that the fibrous structures of 1 (1.5 mg mL−1) disassemble, in the case of the incomplete hydrogel (Fig. 2d) however, remain stable in the case of the hydrogel (Fig. 2c) at 45 °C. It is, therefore, possible that comparison of these Abs.450 measurements may also be used to estimate the proportional amount of gel fibres present within a given sample at a particular temperature.
As shown, these UV-Vis Abs.450 measurements could be used to verify the presence of gel fibres within a sample of 1 (Abs.450 > 0.05 AU), when compared to other self-associated species such as dimers or spherical aggregates (Abs.450 < 0.05 AU) at comparable concentrations within a microplate well. We next explored the use of optical density measurements at 450 nm (OD450) to further characterise this system. Spectral scanning experiments performed for those same samples of 1 as shown in Fig. 2, allow us to further observe any self-associated structures of 1 within a microplate well, over a 25 °C to 45 °C temperature range. Here, as shown in Fig. 3, the surface area of each well was divided into 177 sections, with an OD450 measurement obtained for each. When only small dimeric self-associated species are known to exist (Fig. 3a) OD450 measurements obtained for each section of the microplate well are shown to be uniformly low. However, moving into H2O only (Fig. 3b), we observe evidence of 1 primarily self-associating at the microplate well periphery. Amphiphilic compounds such as 1, that are shown to lower the surface tension of aqueous solutions,21 are known to preferentially self-associate at the interface until the critical micelle concentration (CMC) is reached.22 Therefore, by observing and/or comparing the OD450 spectral scan data, it is possible to observe any self-associated structures of 1 existing at the interface as opposed to those spherical aggregates which exist in the bulk solution. This is indicated by the comparatively high OD450 measurements recorded at the periphery of the microplate well over the central regions. Where gel fibres are known to form (Fig. 3c), uniformly higher OD450 measurements are recorded across the entirety of the microplate well.
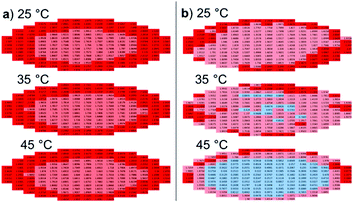
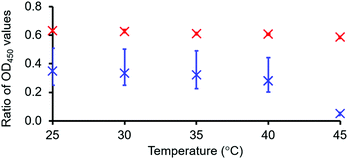
To further enable the analysis of these spectral scan data, two-dimensional OD450 maps were also produced (Fig. 4). This representation of those data shown in Fig. 3 demonstrates lower OD450 values occurring towards the centre of the well, with higher values towards the periphery, where 1 is present as a hydrogel or incomplete hydrogel (Fig. 4a and b). As for those Abs.450 measurements (Fig. 2c and d), we observed no notable change for these data displayed within the intensity map produced for the hydrogel of 1 containing NaCl as the temperature was raised from 25 °C to 45 °C. However, for the incomplete hydrogel formed in the presence of Na2CO3, we observe a decrease in OD450 values across the majority of the 177 microplate well segments with increasing temperature. Through ratioing the OD450 maximum and minimum values (the highest and lowest OD values recorded for a single well of a single sample at a single temperature) Table 1, it becomes possible to screen these data for the presence/amount of gel fibres, validated by those previously published data for the ‘bulk’ material summarised in Table 2, and obtain a gel–sol/gel fibre melting temperature (Tm), as illustrated in Fig. 5. This proof-of-principle dataset indicates that at a ratio value <0.06, unless the material is uniformly gelled, proportionally very few if any gel fibres will be present. Here, 1 instead acts as an amphiphile, with only extensive self-associated structures observable at the microplate well interface. This data also suggests there is a different density of structures and/or different structures present at the surface–gel interface, as reported previously by Marlow and Zelzer.23
| Soln | Temperature | Soln | Temperature | Soln | Temperature | |||
|---|---|---|---|---|---|---|---|---|
| 25 | 45 | 25 | 45 | 25 | 45 | |||
| DMSO | 0.01 | 0.02 | Na2CO3 | 0.35 | 0.05 | NaF | 0.55 | 0.48 |
| H2O | 0.02 | 0.02 | Na2SO4 | 0.62 | 0.56 | NaCl | 0.63 | 0.59 |
| Na2HPO4 | 0.31 | 0.03 | NaHCO3 | 0.57 | 0.48 | NaNO3 | 0.62 | 0.60 |
| NaH2PO4 | 0.55 | 0.05 | NaOAc | 0.70 | 0.65 | NaOBz | 0.64 | 0.58 |
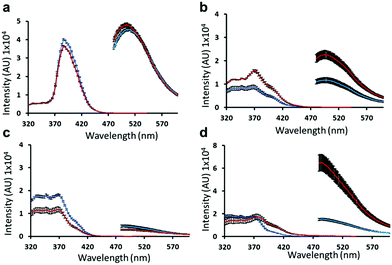
Due to the intrinsic fluorescent nature of 1, we were also able to investigate the self-assembly processes of this SSA using fluorescence spectroscopy. Interestingly, although this method was able to distinguish between the presence of dimers (Fig. 6a) and larger self-associated aggregates (Fig. 6b–d). This method could not verify the presence of spherical aggregates (Fig. 6b) over gel fibres (Fig. 6c and d), due to the lack of distinguishing spectral features observed for these samples. However, comparison of emission profiles we are able to follow the disassembly of those larger self-associated structures formed with increasing temperature (Fig. 6b and d). Here the disassembly process can be identified through increasing intensity of the emission spectrum maxima when excited at 435 nm. The lack of change in the emission spectra of that sample shown in Fig. 6c is due to the Tm for this sample being > 45 °C. We hypothesise that both the decrease in experimental sensitivity towards aggregate identification and observation of the aggregate disassembly process can be explained as a result of incident light scattering by the sample.
Finally, we detail the additional self-associative system information generated for 1 using this combination of plate reader methodologies, unobtainable through our previous characterisation of these systems.16 As shown in Table 2 when supplied at a concentration of 5 mg mL−1, 1 gelated all salt solutions listed, apart from Na2HPO4. This enabled the elucidation of comparative gel–sol Tm values. However, those same samples presented to the microplate reader for analysis proved too concentrated for accurate measurements to be obtained. For this reason, in the case of these microplate reader studies, the concentration of 1 was reduced to 1.5 mg mL−1 for all samples. This resulted in a mixture of gels, incomplete gels and solutions. However, as confirmed by the results of both comparative UV-Vis absorption and optical density measurements, the fibre assembly temperature range (Tfa) calculated using these methods at 1.5 mg mL−1 was found to correlate with the results of gel–sol Tm studies conducted at 5 mg mL−1. This leads us to hypothesise that the Tm is not only representative of the gel–sol transition temperature but also gelator monomer dissociation, resulting in fibre solvation and is concentration-independent between 1.5 and 5.0 mg mL−1. Additionally, the OD450 intensity maps produced for hydrogels/incomplete hydrogels of 1 show a greater proportion of gel fibres to exist at the sample periphery in comparison to the well interior, giving us new information about material formation and construction.
We have introduced a toolkit of high-throughput gel characterisation methods using microplate reader technology. It is envisioned that this toolkit maybe used for standard supramolecular gel characterisation, removing those limitations overviewed herein. Using UV-Vis absorption measurements we have shown that for solutions/gels/incomplete hydrogels of 1, increased Abs.450 values selectively indicate gel fibre formation. OD450 measurements may also be used to selectively observe the formation of gel fibres. Interestingly, spectral well-scans confirmed SSA self-assembly processes at the interface in the presence and absence of gel fibre formation in aqueous solutions. The use of the well scan measurements could be used to illustrate uniformity of gelation or be used to characterise gel patterning or gradients. This would be a huge advantage as it is non-destructive and is carried out in-situ. We also established that although fluorescence spectroscopy is an incredibly sensitive technique for molecular/complex characterisation, here this technique is unable to reliably distinguish between spherical aggregate and gel fibre formation. Finally, we propose that the Tm of a supramolecular gel may be due to fibre disassembly and therefore concentration-independent to the point of solution saturation, although verification of this hypothesis remains the subject of ongoing investigation.
Conflicts of interest
There are no conflicts to declare.References
- J. W. Steed, Chem. Commun., 2011, 47, 1379–1383 RSC.
- P. R. A. Chivers and D. K. Smith, Nat. Rev. Mater., 2019, 4, 463–478 CrossRef CAS.
- B. O. Okesola and D. K. Smith, Chem. Soc. Rev., 2016, 45, 4226–4251 RSC.
- Z. Yang, G. Liang, Z. Guo, Z. Guo and B. Xu, Angew. Chem., Int. Ed., 2007, 46, 8216–8219 CrossRef CAS PubMed.
- Q. Lin, T.-T. Lu, X. Zhu, B. Sun, Q.-P. Yang, T.-B. Wei and Y.-M. Zhang, Chem. Commun., 2015, 51, 1635–1638 RSC.
- L. Yu and J. Ding, Chem. Soc. Rev., 2008, 37, 1473 RSC.
- C. Liu, C. Ruan, R. Shi, B.-P. Jiang, S. Ji and X.-C. Shen, Biomater. Sci., 2019, 7, 1705–1715 RSC.
- G. Yu, X. Yan, C. Han and F. Huang, Chem. Soc. Rev., 2013, 42, 6697–6722 RSC.
- O. Kotova, R. Daly, C. M. G. dos Santos, M. Boese, P. E. Kruger, J. J. Boland and T. Gunnlaugsson, Angew. Chem. Int. Ed., 2012, 51, 7208–7212 CrossRef CAS PubMed.
- X. Liao, G. Chen, X. Liu, W. Chen, F. Chen and M. Jiang, Angew. Chem. Int. Ed., 2010, 122, 4511–4515 CrossRef.
- E. R. Draper, E. G. B. Eden, T. O. McDonald and D. J. Adams, Nat. Chem., 2015, 7, 848–852 CrossRef CAS PubMed.
- B. Escuder, M. Llusar and J. F. Miravet, J. Org. Chem., 2006, 71, 7747–7752 CrossRef CAS PubMed.
- S. Iqbal, F. Rodríguez-LLansola, B. Escuder, J. F. Miravet, I. Verbruggen and R. Willem, Soft Matter, 2010, 6, 1875–1878 RSC.
- N. Nonappa and E. Kolehmainen, Soft Matter, 2016, 12, 6015–6026 RSC.
- M. Ahearne, Y. Yang, A. J. El Haj, K. Y. Then and K. K. Liu, J. R. Soc., Interface, 2005, 2, 455–463 CrossRef CAS PubMed.
- L. J. White, J. E. Boles, N. Allen, L. S. Alesbrook, J. M. Sutton, C. K. Hind, K. L. F. Hilton, L. R. Blackholly, R. J. Ellaby, G. T. Williams, D. P. Mulvihill and J. R. Hiscock, J. Mater. Chem. B, 2020, 8, 4694–4700 RSC.
- N. S. S. Kumar, S. Varghese, G. Narayan and S. Das, Angew. Chem., Int. Ed., 2006, 45, 6317–6321 CrossRef CAS PubMed.
- S. Basak, J. Nanda and A. Banerjee, J. Mater. Chem., 2012, 22, 11658 RSC.
- V. A. Mallia, P. Terech and R. G. Weiss, J. Phys. Chem. B, 2011, 115, 12401–12414 CrossRef CAS PubMed.
- E. R. Draper, B. Dietrich, K. McAulay, C. Brasnett, H. Abdizadeh, I. Patmanidis, S. J. Marrink, H. Su, H. Cui, R. Schweins, A. Seddon and D. J. Adams, Matter, 2020, 2, 764–778 CrossRef.
- (a) G. Townshend, G. S. Thompson, L. J. White, J. R. Hiscock and J. L. Ortega-Roldan, Chem. Commun., 2020, 56, 4015–4018 RSC; (b) L. J. White, N. J. Wells, L. R. Blackholly, H. J. Shepherd, B. Wilson, G. P. Bustone, T. J. Runacres and J. R. Hiscock, Chem. Sci., 2017, 8, 7620–7630 RSC; (c) L. J. White, S. N. Tyuleva, B. Wilson, H. J. Shepherd, K. K. L. Ng, S. J. Holder, E. R. Clark and J. R. Hiscock, Chem. – Eur. J., 2018, 24, 7761–7773 CrossRef CAS PubMed.
- D. Chandler, Nature, 2005, 437, 640–647 CrossRef CAS PubMed.
- M. G. F. Angelerou, A. Sabri, R. Creasey, P. Angelerou, M. Marlow and M. Zelzer, Chem. Commun., 2016, 52, 4298–4300 RSC.
Footnote |
| † Electronic supplementary information (ESI) available: Experimental details, uniformity and validation experiments as well as absorbance, optical density and fluorescence data. See DOI: 10.1039/d0cc04033a |
| This journal is © The Royal Society of Chemistry 2020 |

