 Open Access Article
Creative Commons Attribution 3.0 Unported Licence
A large axial magnetic anisotropy in trigonal bipyramidal Fe(II)†
Moya A.
Hay
 a,
Arup
Sarkar
 b,
Gavin A.
Craig‡
 a,
Katie E. R.
Marriott
a,
Claire
Wilson
a,
Katie E. R.
Marriott
a,
Claire
Wilson
 a,
Gopalan
Rajaraman
 *b and
Mark
Murrie
 *a
*a
aSchool of Chemistry, University of Glasgow, University Avenue, Glasgow, G12 8QQ, UK. E-mail: mark.murrie@glasgow.ac.uk
bDepartment of Chemistry, Institute of Technology Bombay, Powai, Mumbai, Maharashtra 400 076, India. E-mail: rajaraman@chem.iitb.ac.in
First published on 6th May 2020
Abstract
The first trigonal bipyramidal Fe(II) complex to display slow relaxation of magnetisation has been isolated, with this behaviour found to arise through a combination of a large magnetic anisotropy (D = −27.5 cm−1) and a pseudo-D3h symmetry at the Fe(II) centre, as investigated through ab initio and magnetic studies.
The continuing demand for the miniaturisation of technology to maximise data storage density drives research into molecular magnetic materials. One class of such materials are single-molecule magnets (SMMs), which show slow relaxation of the magnetisation.1,2 Engineering SMM properties to maximise the retention of magnetisation has led to molecular magnetic hysteresis up to 80 K.3–5 Initially increasing the spin ground state S was the focus, however maximising the axial magnetic anisotropy has become more extensively investigated.6,7 For example in cases where an uneven number of electrons reside in degenerate orbitals, as is the case with Ni(II) [or Fe(II)] in a trigonal bipyramidal (TBP) coordination environment, if antagonistic Jahn–Teller distortions can be minimised through the judicious choice of ligands a ‘giant’ magnetic anisotropy can be induced.8,9 This strategy was used successfully for the TBP Ni(II) complex [NiCl3(MDABCO)2][ClO4] ([MDABCO]+ = 1-methyl-4-aza-1-azoniabicyclo[2.2.2]octanium cation).10–12 In light of the potential to induce a large magnetic anisotropy in TBP Fe(II) using this strategy, and the interest in the magnetic properties of monometallic Fe(II) complexes,13–17 we report the synthesis of [FeCl3(MDABCO)2][ClO4] (1). In conjunction with ab initio calculations, experimental investigations of the magnetic properties of 1 have confirmed it to be the first example of a TBP Fe(II) coordination complex to display slow relaxation of the magnetisation.
For the synthesis of 1 see Section S1, ESI.† [FeCl3(MDABCO)2]·[ClO4] (1) is isomorphous with the previously reported Ni(II) analogue possessing two axial [MDABCO]+ ligands and three equatorial chloride ligands, and crystallises in the orthorhombic Pca21 space group (Fig. 1).10 In the unit cell there are four different orientations of the [Fe(MDABCO)2Cl3]+ cation that result in intermolecular Fe⋯Fe distances between 8.4996(2) and 13.185(3) Å. Continuous shape measures (CShMs) were used to quantify the distortion around the Fe(II) centre, with a value of 0 assigned when the experimentally obtained atomic positions match the ideal TBP coordination environment.18–20 The CShM value of 0.057 shows that there is only a very small deviation from the ideal TBP environment.
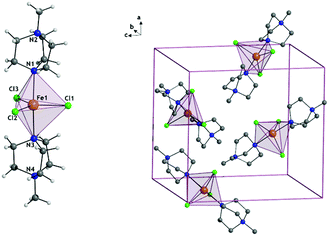 | ||
| Fig. 1 The structure of 1+ cation (left) and the unit cell (right) where anions and hydrogen atoms have been omitted for clarity. | ||
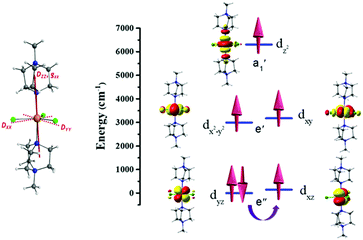
CASSCF/NEVPT2 calculations have been performed on 1 to probe the origin of the magnetic anisotropy, as this method is found to yield good numerical estimates of zero-field splitting (ZFS) parameters for transition metal complexes.21,22 These calculations give an axial ZFS (D) of −27.5 cm−1 with a minimal transverse, or rhombic, E/D value of 0.02. This is in sharp contrast to a recently reported Fe(II) trigonal bipyramidal complex where a small positive D value resulted, which can be attributed to the differences in geometric distortion (CShM value of 0.057 for 1vs. 1.050 for [Fe(MST)(OH2)]− where [H3MST] = N,N′,N′′-[2,2′,2′′-nitrilotris-(ethane-2,1-diyl)]tris(2,4,6-trimethylbenzenesulfonamide)).13 The computed Dzz or gzz anisotropy axes for 1 lie very close to the N–Fe–N axis of the complex (see Fig. 2). The large negative D value is primarily due to mixing with the 1st excited state (5Ey′′), which corresponds to the same ML level dyz → dxz electronic transition (see Table S4, ESI† and Fig. 2). In ideal D3h symmetry the 5Ex′′ and 5Ey′′ states are degenerate, but a small Jahn–Teller distortion results in the 1st excited state in 1 lying 137 cm−1 above the ground state (see Table S4, ESI†). While this 1st excited state provides the largest contribution to the overall D value, mixing of other quintet excited states also provide small (positive) contributions to D (see Table S4, ESI†). As was observed with the Ni(II) analogue, the significant steric bulk of the axial ligands prevents the Jahn–Teller distortion modes. This retains a high-order pseudo-D3h symmetry around Fe(II) centre, which is reflected in the negligible E/D value.11,12 The spin–orbit coupling analysis reveals a very small tunnel splitting (0.08 cm−1) for the MS = ±2 levels but the reduced weightage in the spin–orbit states (|±2〉) suggests strong ground state quantum tunnelling (see Table S5, ESI†), which rationalises the observation of field-induced (rather than zero field) slow magnetic relaxation (vide infra), despite the favourable D and E/D parameters.
The variable-temperature magnetic susceptibility data for 1 were collected between 290 K and 2 K under an applied direct-current (dc) field of 1000 Oe (Fig. 3). At 290 K, the χMT value of 4.10 cm3 mol−1 K is substantially higher than that expected for a spin-only model (S = 2, g = 2, χMT = 3.0 cm3 mol−1 K) indicating a significant residual orbital moment. χMT remains almost constant until approximately 50 K after which a sharp decrease is observed, reaching a minimum value of 3.08 cm3 mol−1 K at 2 K. The magnetisation measurements (M vs. H) were carried out between 0 and 5 T at 2, 4 and 6 K (Fig. 3 inset) and in each case did not reach saturation.
 | (1) |
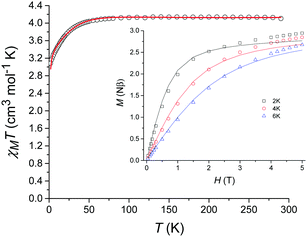 | ||
| Fig. 3 Temperature dependence of χMT for 1 from 290 K to 2 K in a dc field of 1000 Oe (magnetization vs. field shown inset). The solid lines correspond to the fit (see text for details). | ||
The χMT vs. T and M vs. H data were fitted simultaneously using the program Phi23 using the Hamiltonian presented in eqn (1). Some parameters were fixed based on the results obtained from the ab initio calculations (vide supra): the axial and rhombic ZFS parameters, D and E, were fixed at values of −27.5 cm−1 and 0.58 cm−1, respectively as well as gx = 1.90 and gy = 1.98. The gz value however was fixed at 2.61 considering the local minimum in the residual determined via a survey of the χMT vs. T data, although it should be noted that this is close to the ab initio determined gz value of 2.53. TIP and zJ terms were determined from the fit (further details can be found in the ESI† along with additional fits and survey plots (see Fig. S2 and S3)).
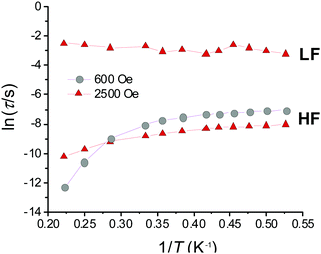
Initial investigations of the dynamic susceptibility were carried out as a function of field with Hdc ranging between 0 and 5000 Oe at a fixed temperature of 2 K (see Fig. 4 and Fig. S4, ESI†). No out-of-phase ac χ′′ response was observed in zero applied dc field, as is common for monometallic 3d complexes where spin-phonon relaxation and quantum tunnelling of magnetisation (QTM) can be particularly efficient,24–26 but on applying dc fields of above 500 Oe a frequency dependence was observed.8 At Hdc ≤ 1500 Oe, a single high frequency (HF) relaxation pathway is apparent. On increasing Hdc above 1500 Oe, a second low frequency (LF) relaxation path emerges (see Fig. 4). The co-existence of two relaxation regimes has been previously attributed to relaxation originating from the individual complexes for the HF pathway, with the LF pathway arising due to intermolecular interactions.27–31 This leads to a difference in behaviour as a function of temperature, with the signal arising from the HF pathway exhibiting a temperature dependence and that from the LF path remaining temperature independent. We therefore chose to investigate the variable temperature ac susceptibility at two fields; 600 Oe where only the HF relaxation mode is observable, and 2500 Oe where the LF pathway emerges, and the HF mode is under an optimal field (see Fig. S6 and S7, ESI†). Under an Hdc of 600 Oe clear maxima are observed in the out-of-phase signal, which move beyond the frequency limit of the SQUID above 3.5 K (Fig. 4). When probed under an Hdc up to 2500 Oe, the HF signal is now maximised and once again moves out of the frequency range above 3.5 K (Fig. S7, ESI†). Additionally, the LF mode is now observable and exhibits no obvious temperature dependence. This is more apparent on consideration of the respective Arrhenius plots (ln![[thin space (1/6-em)]](https://www.rsc.org/images/entities/char_2009.gif) τ vs. 1/T) shown in Fig. 5 constructed using the relaxation rates, τ, extracted from the fit of the Argand diagrams (Fig. S8, ESI†). At 600 Oe the HF relaxation channel shows a crossover to temperature independent relaxation when tending to lower temperatures. At 2500 Oe, a larger contribution from temperature independent relaxation processes is evident for the HF relaxation channel. As expected, the τ values for the LF pathway show no clear temperature dependence.
τ vs. 1/T) shown in Fig. 5 constructed using the relaxation rates, τ, extracted from the fit of the Argand diagrams (Fig. S8, ESI†). At 600 Oe the HF relaxation channel shows a crossover to temperature independent relaxation when tending to lower temperatures. At 2500 Oe, a larger contribution from temperature independent relaxation processes is evident for the HF relaxation channel. As expected, the τ values for the LF pathway show no clear temperature dependence.
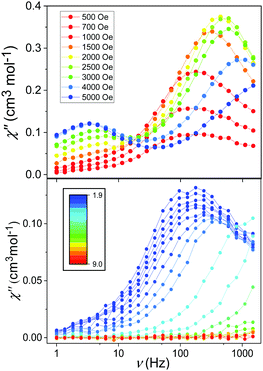 | ||
| Fig. 4 Frequency-dependence of the χ′′ response in Hdc ranging between 500 and 5000 Oe at 2 K (upper) and in Hdc = 600 Oe between 1.9 and 9 K (lower). | ||
Given that the HF relaxation regime is that arising from the isolated Fe(II) complex, and that the strongest temperature dependence of τ is observed above 3.5 K, a crude estimate of the barrier to spin reversal using the corresponding relaxation rates was made in accordance with the Arrhenius law given by the first term in eqn (2) (see Fig. S9, ESI†).
For the data collected at 600 Oe, the gradient of the straight-line approximation, corresponding to ΔE/kB, was estimated to be 52.9 (±4.6) K (36.7 (±3.2) cm−1), which is substantially lower than that estimated based on the D parameter obtained from the ab initio calculations (4|D| = 110 cm−1). At 2500 Oe ΔE/kB is even lower at 13.8 (±0.3) K (9.6 (±0.2) cm−1). This suggests that other relaxation processes short-cut the thermal energy barrier, and discounts a model including the Orbach term as this process must occur via ‘real’ states (e.g. ∼3|D| (82.5 cm−1) for MS ±2 and ±1). The fit was then reconsidered to account for spin–lattice direct processes
 | (2) |
To avoid over-parameterisation, the field dependence of the relaxation rate was initially fitted using the field-dependent processes (see Fig. S10, ESI†). This allowed us to extract parameters relating to both direct relaxation and QTM (A, B1 and B2) giving A = 182.35 (±0.05) × 102 s−1 kOe−2 K−1, B1 = 109.60 (±0.04) × 10 s−1 and B2 = 355.57 (±2.56) × 10−2 kOe−2. Once obtained, these parameters were fixed in the fits of the temperature dependence of the relaxation rates at both 600 Oe and 2500 Oe. For data collected at Hdc = 600 Oe, the fit fixing A, B1 and B2 and n = 7 for an integer spin ion is shown in Fig. S11 (ESI†) where C = 5.64 (±0.06) s−1 K−n. The fit can be improved by including an Orbach term but as discussed earlier it is not appropriate to include this term based on the estimated energy gap between ‘real’ states. For relaxation rates obtained under 2500 Oe the data could be fitted by fixing A but it was not possible to do this for the QTM terms B1 and B2. The Raman parameters obtained were C = 1.31 (±0.01) s−1 K−n, n = 6.39 (±0.01). The general QTM term obtained from the fit (1.34 (±0.01) × 103 s−1) was close to that obtained based on the field dependent relaxation rates ((B1/1 + B2H2) ∼ 9 × 10² s−1).
[FeCl3(MDABCO)2][ClO4] (1) is the first monometallic trigonal bipyramidal Fe(II) complex to show slow relaxation of the magnetisation. Rigorous control of the coordination environment produces a large axial magnetic anisotropy as confirmed by dc magnetic measurements and supported by ab initio calculations. Due to the rarity of slow magnetic relaxation in TBP Fe(II), even under an applied dc field, we stress the importance of minimising the geometric distortion in order to generate a large axial magnetic anisotropy while also minimising the rhombic magnetic anisotropy.
The UK Engineering and Physical Sciences Research Council are thanked for financial support (grant ref. EP/J018147/1). GR thanks SERB (CRG/2018/000430) and UGC-UKEIRI (Grant number 184-4/2018(IC)) for funding. AS thanks NPSF CDAC Pune for providing access to the supercomputing facility and CSIR for an SRF fellowship.
Conflicts of interest
There are no conflicts to declare.Notes and references
- C. Benelli and D. Gatteschi, Introduction to Molecular Magnetism: From Transition Metals to Lanthanides, Wiley-VCH, Florence, 1st edn, 2015 Search PubMed.
- R. Sessoli, D. Gatteschi, A. Caneschi and M. A. Novak, Nature, 1993, 365, 141–143 CrossRef CAS.
- C. A. P. Goodwin, F. Ortu, D. Reta, N. F. Chilton and D. P. Mills, Nature, 2017, 548, 439–442 CrossRef CAS PubMed.
- F.-S. Guo, B. M. Day, Y.-C. Chen, M.-L. Tong, A. Mansikkamäki and R. A. Layfield, Angew. Chem., Int. Ed., 2017, 56, 11445–11449 CrossRef CAS PubMed.
- F.-S. Guo, B. M. Day, Y.-C. Chen, M.-L. Tong, A. Mansikkamäki and R. A. Layfield, Science, 2018, 362, 1400–1403 CrossRef CAS PubMed.
- N. Ishikawa, M. Sugita, T. Ishikawa, S. Y. Koshihara and Y. Kaizu, J. Am. Chem. Soc., 2003, 125, 8694–8695 CrossRef CAS PubMed.
- W. H. Harman, T. D. Harris, D. E. Freedman, H. Fong, A. Chang, J. D. Rinehart, A. Ozarowski, M. T. Sougrati, F. Grandjean, G. J. Long, J. R. Long and C. J. Chang, J. Am. Chem. Soc., 2010, 132, 18115–18126 CrossRef CAS PubMed.
- G. A. Craig and M. Murrie, Chem. Soc. Rev., 2015, 44, 2135–2147 RSC.
- S. Gomez-Coca, E. Cremades, N. Aliaga-Alcalde and E. Ruiz, J. Am. Chem. Soc., 2013, 135, 7010–7018 CrossRef CAS PubMed.
- K. E. R. Marriott, L. Bhaskaran, C. Wilson, M. Medarde, S. T. Ochsenbein, S. Hill and M. Murrie, Chem. Sci., 2015, 6, 6823–6828 RSC.
- G. A. Craig, A. Sarkar, C. H. Woodall, M. A. Hay, K. E. R. Marriott, K. V. Kamenev, S. A. Moggach, E. K. Brechin, S. Parsons, G. Rajaraman and M. Murrie, Chem. Sci., 2018, 9, 1551–1559 RSC.
- M. Gruden-Pavlović, M. Perić, M. Zlatar and P. García-Fernández, Chem. Sci., 2014, 5, 1453–1462 RSC.
- K. A. Schulte, K. R. Vignesh and K. R. Dunbar, Chem. Sci., 2018, 9, 9018–9026 RSC.
- X. Liu, J. Zhou, X. Bao, Z. Yan, G. Peng, M. Rouzières, C. Mathonière, J.-L. Liu and R. Clérac, Inorg. Chem., 2017, 56, 12148–12157 CrossRef CAS PubMed.
- C. Baldé, N. Paradis, C. Desplanches and G. Chastanet, Eur. J. Inorg. Chem., 2018, 14741–14750 Search PubMed.
- P. Stock, E. Deck, S. Hohnstein, J. Korzekwa, K. Meyer, F. W. Heinemann, F. Breher and G. Hörner, Inorg. Chem., 2016, 55, 5254–5265 CrossRef CAS PubMed.
- A. Urtizberea and O. Roubeau, Chem. Sci., 2017, 8, 2290–2295 RSC.
- M. Pinsky and D. Avnir, Inorg. Chem., 1998, 37, 5575–5582 CrossRef CAS PubMed.
- D. Casanova, J. Cirera, M. Llunell, P. Alemany, D. Avnir and S. Alvarez, J. Am. Chem. Soc., 2004, 126, 1755–1763 CrossRef CAS PubMed.
- S. Alvarez, Chem. Rev., 2015, 115, 13447–13483 CrossRef CAS PubMed.
- A. Sarkar, G. Velmurugan, T. Rajeshkumar and G. Rajaraman, Dalton Trans., 2018, 47, 9980–9984 RSC.
- T. Gupta and G. Rajaraman, Chem. Commun., 2016, 52, 8972–9008 RSC.
- A. Soncini, K. S. Murray, N. F. Chilton, R. P. Anderson and L. D. Turner, J. Comput. Chem., 2013, 34, 1164–1175 CrossRef PubMed.
- A. Lunghi, F. Totti, S. Sanvito and R. Sessoli, Chem. Sci., 2017, 8, 6051–6059 RSC.
- D. Gatteschi and R. Sessoli, Angew. Chem., Int. Ed., 2003, 42, 268–297 CrossRef CAS PubMed.
- A. Lunghi, F. Totti, R. Sessoli and S. Sanvito, Nat. Commun., 2017, 8, 14620 CrossRef PubMed.
- J. Miklovic, D. Valigura, R. Boča and J. Titiš, Dalton Trans., 2015, 44, 12484–12487 RSC.
- D. Valigura, C. Rajnak, J. Moncol, J. Titiš and R. Boča, Dalton Trans., 2017, 46, 10950–10956 RSC.
- R. Boča, C. Rajnák, J. Titiš and D. Valigura, Inorg. Chem., 2017, 56, 1478–1482 CrossRef PubMed.
- A. Świtlicka, B. Machura, M. Penkala, A. Bieńko, D. C. Bieńko, J. Titiš, C. Rajnák, R. Boča, A. Ozarowski and M. Ozerov, Inorg. Chem., 2018, 57, 12740–12755 CrossRef PubMed.
- C. Rajnák, F. Varga, J. Titiš, J. Moncol and R. Boča, Inorg. Chem., 2018, 57, 4352–4358 CrossRef PubMed.
- K. Shrivastava, Phys. Status Solidi B, 1983, 117, 437–458 CrossRef CAS.
Footnotes |
| † Electronic supplementary information (ESI) available: Synthetic procedures, crystallographic data, powder X-ray diffraction (PXRD) patterns, and additional magnetic measurements. CCDC 1992135. For ESI and crystallographic data in CIF or other electronic format see DOI: 10.1039/d0cc02382e |
| ‡ Present address: Department of Pure and Applied Chemistry, University of Strathclyde, Glasgow, UK. |
| This journal is © The Royal Society of Chemistry 2020 |

