
High-resolution probing of early events in amyloid-β aggregation related to Alzheimer's disease
Bikash R.
Sahoo
 ,
Sarah J.
Cox
and
Ayyalusamy
Ramamoorthy
*
,
Sarah J.
Cox
and
Ayyalusamy
Ramamoorthy
*
Biophysics Program, Department of Chemistry, University of Michigan, Ann Arbor, MI 48109-1055, USA. E-mail: ramamoor@umich.edu
First published on 9th April 2020
Abstract
In Alzheimer's disease (AD), soluble oligomers of amyloid-β (Aβ) are emerging as a crucial entity in driving disease progression as compared to insoluble amyloid deposits. The lacuna in establishing the structure to function relationship for Aβ oligomers prevents the development of an effective treatment for AD. While the transient and heterogeneous properties of Aβ oligomers impose many challenges for structural investigation, an effective use of a combination of NMR techniques has successfully identified and characterized them at atomic-resolution. Here, we review the successful utilization of solution and solid-state NMR techniques to probe the aggregation and structures of small and large oligomers of Aβ. Biophysical studies utilizing the commonly used solution and 19F based NMR experiments to identify the formation of small size early intermediates and to obtain their structures, and dock-lock mechanism of fiber growth at atomic-resolution are discussed. In addition, the use of proton-detected magic angle spinning (MAS) solid-state NMR experiments to obtain high-resolution insights into the aggregation pathways and structures of large oligomers and other aggregates is also presented. We expect these NMR based studies to be valuable for real-time monitoring of the depletion of monomers and the formation of toxic oligomers and high-order aggregates under a variety of conditions, and to solve the high-resolution structures of small and large size oligomers for most amyloid proteins, and therefore to develop inhibitors and drugs.
 Bikash R. Sahoo | Bikash R. Sahoo obtained his BSc degree in physics from the Fakir Mohan University and MSc degree from Orissa University of Agriculture and Technology, India. In September 2016, he received his PhD from Osaka University (Japan) in Chemistry with a major in Molecular Biophysics studying design of novel anticancer peptide. He then joined the University of Michigan as a post-doctoral research fellow and currently working with Professor Ayyalusamy Ramamoorthy. His main research focus is structural and functional investigation of toxic amyloid intermediates associated with Alzheimer's disease and Type II Diabetes. |
 Sarah J. Cox | Sarah J. Cox received her bachelor's degree in biology from Alma College in 2015. She received her PhD from the University of Michigan in the laboratory of Professor Ayyalusamy Ramamoorthy in December 2019. Her thesis research focused on the interplay between small molecules, membranes, and amyloid peptides and dissecting those using biophysical techniques. Currently, she is a research fellow at the National University of Singapore in the Bazan laboratory investigating antimicrobial resistance. |
 Ayyalusamy Ramamoorthy | Ayyalusamy Ramamoorthy joined the faculty at the University of Michigan, Ann Arbor, after getting his PhD in Chemistry from the Indian Institute of Technology (Kanpur, India), working in the Central Leather Research Institute (Chennai, India) and JEOL Ltd (Tokyo, Japan), and completing postdoctoral training at the University of Pennsylvania, Philadelphia. His current research focuses on the structural biophysics of amyloid proteins and membrane proteins and on the development and applications of solid-state NMR spectroscopy. |
1. Background
1.1 Amyloid proteins and their implications in diseases
Amyloidogenic proteins are implicated in over 30 different disease states.1 The self-assembly process, which produces highly stable beta-sheet fibers, proves to be highly conserved over many different proteins which are known to deposit as plaques in different tissues.2 Diseases such as Alzheimer's disease (AD), Parkinson's, Type II Diabetes (T2D) or cataracts are specifically implicated by the misfolding and subsequent aggregation of a protein expressed in the diseased area.3 One specific protein which will be the focus of this review is amyloid-β (Aβ), which is implicated as a causative factor in AD by its deposit in the extracellular space of neurons.4 AD is the most common form of dementia with over 5 million Americans affected by the disease, and this is expected to rise with the aging population. Aβ, cleaved form its Amyloid Precursor Protein (APP) by β- and γ-secretases abundantly exists with either 40 or 42 residues, each isoform with unique properties.5 Familial mutations in the peptide sequence creating quicker aggregating peptides, or mutations in the secretases to prefer the 42-residue length, are known to increase the risk for early onset AD.6,7 While much effort has been made towards the treatment of the underlying causes of AD, unfortunately, no treatments other than palliative have been approved by the FDA, which is often attributed to our lack of understanding of the structures and function of Aβ.1.2 Mechanism of amyloid formation and importance of oligomers
Amyloid formation is generally thought to occur by a self-seeding mechanism in a sigmoidal fashion, in which there are three distinct steps (Fig. 1).8,9 During the lag-phase a hydrophobic core, also known as the amyloidogenic core, can self-associate with the same sequence on another monomer via hydrophobic and aromatic π–π interactions.10 Commonly, the monomers start with a random-coil structure before self-association to form oligomers, but it is unknown what exact structures are formed during these oligomer interactions.11–13 Once enough of these monomers and oligomers come together, protofibrils are formed, in which the final highly ordered beta-sheet structure is obtained and then very quickly full fiber elongation takes place which is known as the nucleation phase.14 Lastly the plateau phase in which all of the monomers are depleted in solution to be fully incorporated in mature fibers. Amyloids can create fibers which can be up to microns in length, composed of many monomers aligned with a highly repetitive orientation.15 Previously formed fibers can act as seeds or a catalyst for the polymerization of fiber formation.16 Once amyloid fibers are formed, they are very stable and are highly resistant to denaturants of many types including heat, sonication, pH and some organic solvents.1,17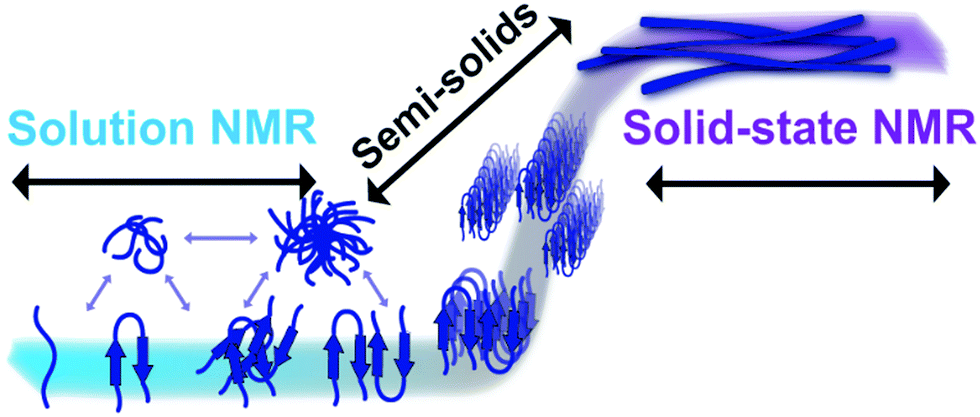 | ||
| Fig. 1 Detection of amyloid species by NMR. Solution NMR spectroscopy is well suited for high-resolution structural and dynamical studies of fast tumbling monomers and small molecular weight amyloid species like oligomers formed in the early lag phase (blue). On the other hand, magic-angle spinning (MAS) solid-state NMR techniques can be used to investigate the high-resolution structures of anisotropic, larger aggregates such as large oligomers, protofibers and fibers (purple). In addition, as discussed in the main text, semi-solids that are not isotropic such as small to large size oligomers can also be investigated using high-resolution magic angle spinning (HR-MAS) experiments. Use of a combination of solution and solid-state NMR experiments and peptides judiciously labelled with isotopes (13C, 15N, 2H, 19F or a combination of them) can provide piercing atomic-resolution insights into the self-assembly process of amyloid aggregation, the formation of toxic oligomers, polymorphism of fibers and the dynamic exchange among the different species. | ||
Studies have shown that both the beginning (rich in monomers) and the end (rich in mature fibers) of this self-assembly process of amyloid aggregation can be characterized at high-resolution.18 However, the intermediate stages of aggregation in which oligomers are transiently forming and dynamically interchanging, is believed to be where the toxic species are generated in most amyloid related diseases, which elude characterization due to heterogeneity and short-lived lifetime of conformation states.11,19 Aβ peptide has also shown to form hetero-oligomers by interacting with its isoforms or other proteins.20–24 For Aβ, oligomers have been shown to be toxic in a variety of ways including membrane disruption, binding and inactivating cell surface receptors, and interactions with intracellular machinery.25–27 While specific oligomer preparation and isolation have been demonstrated, many of these preparations contain non-native mutations or crosslinking are off-pathway, do not form fibers, and are not lived sufficiently long enough for high-resolution structural characterization.11,13,25,28–32
1.3 Experimentally following amyloid aggregation
Many biophysical techniques are commonly employed to monitor the aggregation of an amyloid peptide under various conditions.33,34 The commonly used thioflavin T (ThT) based fluorescent assays to monitor the kinetics of aggregation are solely based on fiber content. Circular Dichroism (CD) can monitor protein folding but the heterogeneity of oligomers can be lost and small differences can go undetected. Mass spectrometry has been instrumental in providing oligomer sizes as well as ligand binding interactions.35 Atomic Force Microscopy (AFM) can provide a macroscopic view of aggregation over a range of sizes including large oligomers up to fibers in real time. While these biophysical experiments are used to obtain high-throughput information on the kinetics of aggregation and to better understand the experimental/sample conditions for further studies, obtaining atomic-resolution structural or mechanistic information of amyloid aggregation are extremely difficult using these techniques. On the other hand, transmission electron microscopy (TEM) and cryo-EM are useful in observing different fibers and their morphologies. X-ray crystallography has also been useful in the amyloid field for solving fiber and fragment fiber structures.Nuclear magnetic resonance (NMR) is a very powerful tool for studying many facets of amyloid aggregation in both solution and solid states.36–42 Solution NMR is typically used for characterizing the beginning stages of amyloid formation while solid-state NMR is well suited for characterizing intermediates and the end stages of amyloid fiber formation (Fig. 1).36,41 Solution based experiments can be used for looking at monomers and low order oligomers. Monomer–monomer as well as monomer ligand interactions are commonly studied using simple two-dimensional experiments such as HSQC or HMQC in which chemical shift perturbation or line broadening observations can reveal specific individual residues’ chemical environments.43 NOE based 2D and 3D experiments can be used to produce three-dimensional structures of aggregates and monomers in the early stages of aggregation.44 While solution NMR techniques are quite valuable, the large size aggregates (such as large oligomers, protofibers and fibers) cannot be observed due to their slow tumbling rates that result in severe line-broadening and extremely low signal-to-noise ratio.45 On the other hand, solid-state NMR techniques have been widely used in studying high-resolution structures of fully mature amyloid fibers as well as very large oligomers/protofibers that are either quite stable or stabilized by freezing.39,46 However, detection and high-resolution probing of the formation of early oligomer intermediates and dispersion of oligomers in solution by NMR have been a challenge. This review highlights some of the recent studies to probe early events on Aβ aggregation using a combination of solution and solid-state NMR techniques.
2. Studying Aβ intermediates by solid state NMR
2.1 Effect of MAS on amyloid aggregation
One limitation in monitoring the aggregation of the selected amyloidogenic proteins using NMR, including Aβ, is the relatively slow aggregation kinetics under static conditions at low micromolar concentrations. This difficulty is typically overcome for other biophysical characterization techniques by using shaking and stirring beads.35 However, these agitation methods are not possible in normal solution NMR conditions. Recent NMR studies that successfully demonstrated the feasibility of using pressure as a variable to monitor protein folding and aggregation are not covered in this review article.47–50 A recent study has shown a method in which Aβ aggregation can be accelerated and monitored in real-time using NMR spectroscopy by utilizing Magic Angle Sample (MAS) spinning.51 In this technique, the sample is loaded into a small rotor and spun at the magic angle (54.74° relative to the magnetic field axis). MAS is commonly used to obtain “solution-like” high-resolution isotropic NMR spectra of solids.Wang et al.51 demonstrated the feasibility of using MAS experiments to induce amyloid aggregation. This mechanical rotation of the sample increases the aggregation rate so that it is more appropriate for investigation at the residue specific level by high-resolution solid-state NMR techniques (Fig. 2A), as well as to help to replicate conditions used in other biophysical assays to study amyloid proteins. Typically, under quiescent conditions a sample of Aβ does not show any changes in the observed proton NMR spectra over the course of 24 hours. However, spinning under 5 kHz MAS at 298 K inside the NMR probe causes the NMR peaks to decay by ∼20% after 24 hours and ∼50% after 72 hours. 5 kHz MAS induced substantial decay in NMR signal intensities both in aliphatic and aromatic protons highlighting mechanical rotation accelerate Aβ aggregation (Fig. 2A). What is so powerful about this technique is that residue specific information can be obtained as function of amyloid aggregation. Specifically, the regions in which the aromatic vs. aliphatic resonances can be detected and have been shown to decay at different rates. An interesting observation is the effect of MAS on Aβ aggregation is concentration dependent, but contradicts the conventional observation i.e. concentration ∝ aggregation. As shown in Fig. 2B, Aβ under MAS aggregates faster at low concentration (15 μM) as compared to that observed at a higher concentration (150 μM). This study further demonstrated the feasibility of measuring the effect of amyloid inhibitors like EGCG, a polyphenolic compound found in green tea extract, which is known to generate large off-pathway oligomers of Aβ under MAS conditions. In this example, the decrease of aliphatic and aromatic peak intensity, and the increase of oligomer peak intensity (denoted as O1 and O2) were shown to happen very quickly (Fig. 2C and F); whereas under quiescent conditions in the presence of EGCG, no change was detected even after almost 3 days. This successful demonstration opens avenues for NMR monitoring of the residue specific aggregation information for amyloid proteins with a variety of ligands including lipids, small molecules, proteins, or other chemical tools. EGCG binding promoted the decay of Aβ's aromatic proton signals under MAS that reveals the site-specific interaction that is difficult to resolve using conventional solution NMR (Fig. 2D and E). By obtaining residue specific information, mechanistic insights on early interactions of aggregation can be obtained for a better understanding on the formation of the most toxic oligomer intermediates of amyloid proteins. In addition, the experimentally measured structural constraints and molecular dynamics simulations can be used to determine high-resolution structures of the oligomers, a much-needed strategy for the development of amyloid inhibitors or chemical tools.
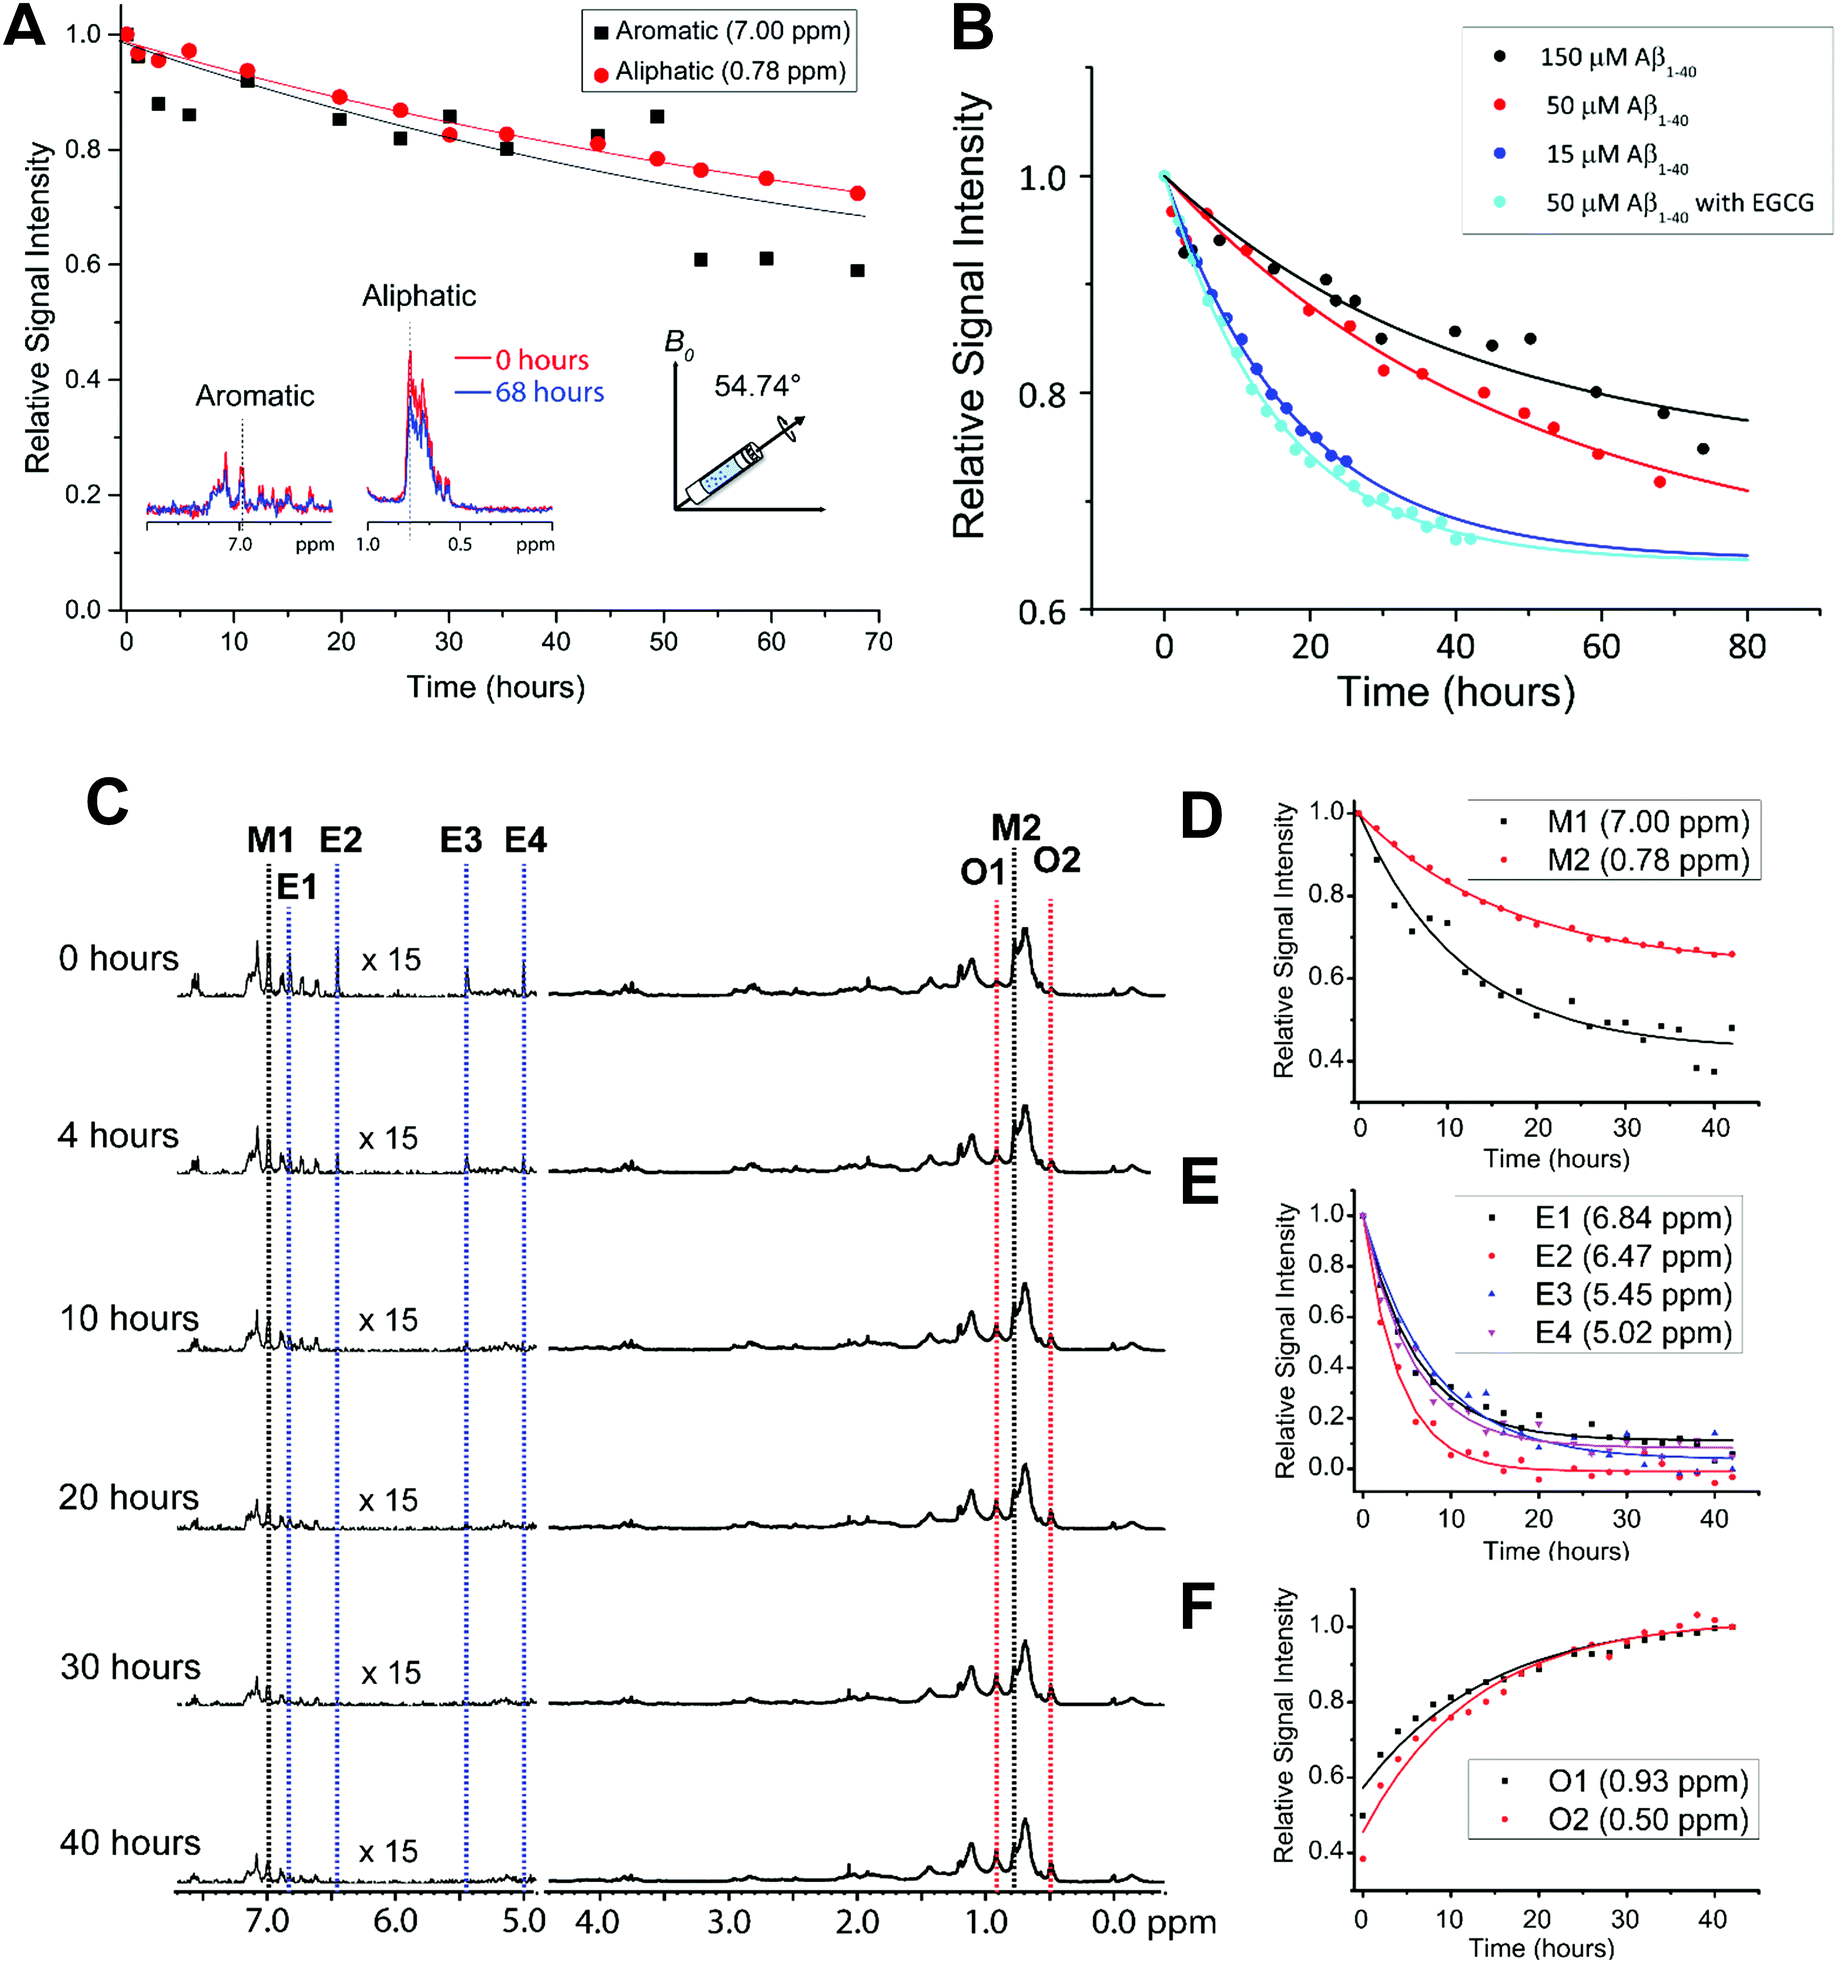 | ||
| Fig. 2 Effect of MAS on the aggregation kinetics of Aβ1–40. (A) Depletion in Aβ1–40 monomer population under MAS (5 kHz MAS at 298 K) as indicated by the decay of 1H NMR signal intensity for selected aliphatic and aromatic resonances of freshly prepared 50 μM Aβ1–40 as a function of time (time = 0 refers the data acquired in <10 minutes from the sample preparation). (B) Relative 1H NMR signal intensity decay of methyl resonance (0.78 ppm) under 5 kHz MAS as a function of Aβ1–40 monomer concentration in the absence or presence of EGCG. The curves were fitted using the equation y = (1 − A) × exp(−b × x) + A, where A is the proportion that remains as monomer after saturation and b is the rate of decay or aggregation. (C) The polyphenolic EGCG compound promotes Aβ1–40 aggregation (50 μM) under MAS (under 5 kHz MAS and 298 K) as observed from the decay of 1H NMR signal as a function of time. (D–F) The aromatic 1H signals decay faster as compared to aliphatic protons in Aβ1–40 (50 μM) in the presence of EGCG indicating the role of predominant π–π interactions. The aromatic proton signals of EGCG also show a rapid depletion in intensity (D) indicating a strong interaction with Aβ1–40. The appearance of new peaks O1 and O2 indicates the formation of new oligomer species (F). An increase in the oligomer populations over time is revealed by an increasing 1H signal intensities O1 and O2 species. This figure is reproduced with permission from the Royal Society of Chemistry (DOI: 10.1039/C8CC00167G). Further details can be found in the referenced work.51 | ||
2.2 Transient Aβ oligomers are disordered like monomers
Structural polymorphism has remained as a significant feature in the amyloid cascade hypothesis and has been recently explored for mature fibers as well.52–55 On the other hand, for the amyloid intermediates that are characterized by toxic phenotypes, transient structural morphology and heterogeneity have led to their limited understanding.52,56–59 To this extent, the many classical high-resolution structure determination techniques fall short due to the inherent heterogeneous nature of Aβ oligomers and their growing size during aggregation. Nevertheless, several methods such as chemical crosslinking, metal binding, small-molecule binding, and protein engineering or variation in the solvent environmental condition to stabilize Aβ oligomers have been used.59–68 Even from these experiments, there exist few structural models that are proposed to be an intermediate structure of Aβ isolated from on-pathway aggregation.59,62,66,69–72 The formation of oligomers starting from monomers has also been reported using computational molecular dynamics simulations.73–77 But, the lack of a high-resolution structural model for Aβ oligomers isolated directly from an AD brain78 limits the long-standing aim to correlate the existing amyloid cascade hypothesis for a successful therapeutic development against these cytotoxins. Considering the mounting evidence showing the toxic nature of amyloid intermediates, there is a need for methodological developments that are able to dig into the atomistic details of the intermediates.Recent solid-state NMR studies have reported high-resolution structural models for amyloid-fibrils including Aβ fibers.46,79–83 As a result, several polymorphic atomic-resolution structures of Aβ fibers and very large oligomers/protofibers are now available in the Biological Magnetic Resonance Bank (BMRB) and Protein Data Bank (PDB).79 Other techniques such as X-ray diffractions, small angle X-ray scattering (SAXS) and cryo-EM have also successfully delivered atomic-resolution structural information for Aβ fibrils and oligomers.62,63,84–87 However, the advances in solid-state NMR spectroscopy in studying biological solids in a heterogeneous sample environment attract further attention as a mean to look into amyloid oligomers at real-time during their on-pathway amyloid aggregation. The isolation of transient oligomers is hindered by sample preparation and purification techniques that subject the oligomers to pass via harsh conditions which could affect the morphology and are beyond the experimental control.88–90 For example, a 56 kDa soluble Aβ oligomer species has been isolated from an AD mouse brain and purified using immunoaffinity chromatography and size-exclusion chromatography (SEC).91 Similarly, small size Aβ oligomers (such as dimers and trimers) have been isolated directly from AD brains or naturally secreted by cultured cells have been purified using electrophoresis and chromatography methods, and have also been shown to be toxic.92,93 Remarkably, a study by Yang et al.78 showed the size dependent toxic characteristics of soluble Aβ oligomers. This study isolated high-molecular weight Aβ oligomers using non-denaturing SEC that have been found to be non-toxic or slightly toxic. Interestingly, alkaline medium treatment of these Aβ oligomers led the dissociation and formation of low-molecular weight oligomers that were found to be cytotoxic.78
Coupled with NMR, atomistic simulations also have been a useful technique in revealing the structural and dynamical information of Aβ intermediates at atomic-resolution. It is difficult to obtain a high-resolution 3D structure of Aβ intermediates using a single technique like NMR. This is mainly due to the limitations in obtaining a sufficient number of distance constraints to obtain a 3D structure. For example, a recent study succeeded in providing a unique β-strand structure for hIAPP (human islet amyloid polypeptide) trapped by lipid-membrane nanodiscs.44 Such structural characterization required integration of NMR distance constraints, ab initio modelling and molecular dynamics (MD) simulations to generate a 3D structure. In absence of NMR derived distance constraints, MD simulations have been proven to be useful in retrieving intermediate structural and dynamical information and the fiber elongation for several amyloidogenic proteins at atomic-resolution.94–96 Such structural and dynamic information have been reported for Aβ species such as monomer, dimer, trimer, tetramer, pentamer, and hexamer.73,95,97–102
Here, we review the high-resolution structural details of Aβ oligomers that coexist with fibers, or filtered without rigorous purification techniques (no additives), using MAS solid-state NMR techniques.103 Previously, solid-state NMR methods demonstrated the use of MAS-induced sedimentation that act as an ultracentrifuge to separate Aβ monomers from oligomers.104 The aggregation of Aβ has been known to form a polymorphic and a heterogeneous sample mixture that includes reversible and irreversible formation of oligomeric and fibrillary aggregates; aggregate from monomers depending on the solvent, pH, temperature and concentration.105 When incubating monomers over several days with or without shaking, Aβ typically forms heterogeneous fibrils along with globular oligomers.45,59,103 As reported, the Aβ oligomers coexist with fibers (Fig. 3) when incubated at low59 or high concentration103 (2 × 10⁻⁵ mg mL−1 or 1 mg mL−1). The oligomers can be separated from monomers and show a spherical morphology (Fig. 3A). Further, the stability of these oligomers provides a conceivable platform for the application of NMR experiments to retrieve high-resolution structural insights (Fig. 3C–E). However, the abundance of these oligomers is too small (≈7–10%) for detection and increasing the sample concentration for NMR studies is quite challenging.103 Another limitation for structural characterization of these low populated oligomers is the use of NMR sensitive isotope labelling (15N/13C/19F). In this context, proton-detected NMR measurements highlighting the high-resolution structural details are remarkably important. Application of such cost-effective methods with dipolar recoupling MAS experiments, such as the radio frequency driven dipolar recoupling (RFDR), enabled the acquisition of 2D homonuclear 1H/1H correlation spectra (Fig. 3 and 4).106 As demonstrated, these experiments do not detect signals from amyloid fibers as the sample spinning speed is not very fast enough to suppress the very large 1H–1H dipolar couplings present in fibers. On the other hand, since the dipolar couplings among protons in monomers are averaged out by their fast tumbling, their signals are suppressed by the dipolar recoupling. Thus, the RFDR based 2D NMR experiments successfully distinguished the low abundant oligomers from monomers and fibers that are otherwise not amenable for solution or other solid-state NMR characterization (Fig. 3 and 4). The detection of these oligomers is limited by conventional heteronuclear NMR techniques. For example, as shown in Fig. 4D, 2D 1H/15N HSQC presents a well dispersed NMR spectrum for Aβ monomers, but fails to provide substantial detectable residue information to probe the oligomers. In addition, although homonuclear (1H/1H) solution NMR experiments such as TOCSY and NOESY can provide atomic correlation, these atomistic information are greatly sacrificed due to line-broadening (Fig. 4).103 The NMR spectrum of isolated oligomers differs substantially from that of monomers, but interestingly share a disordered conformation as revealed by CD spectroscopy (Fig. 3B).
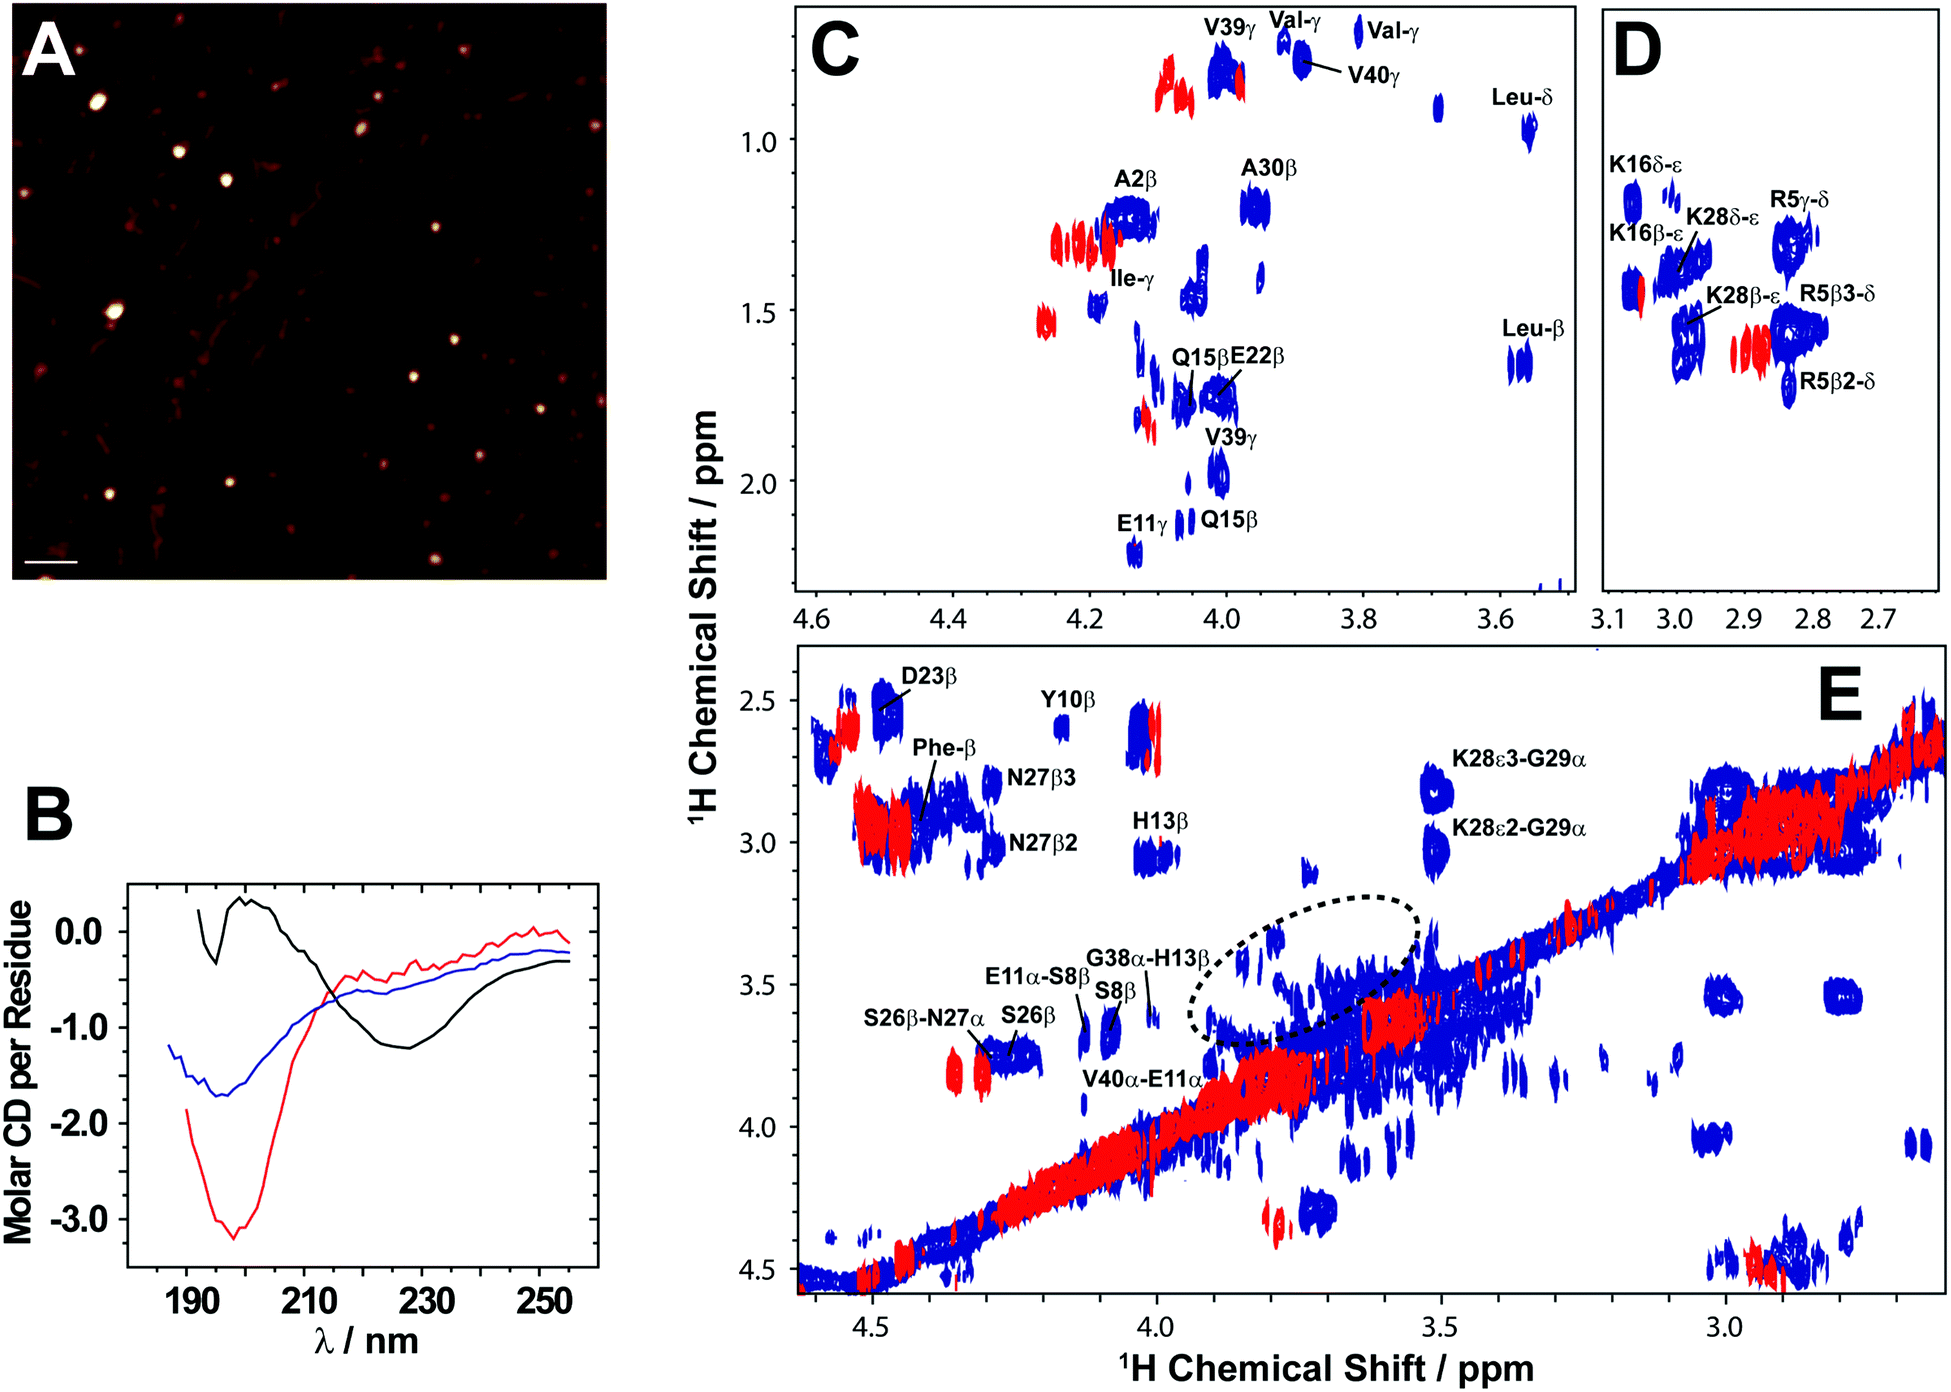 | ||
Fig. 3 Solid state NMR allows characterization of growing low abundance Aβ1–40 oligomers. (A) AFM image showing the presence of Aβ1–40 oligomers after separation from fibers after 4 days (scale bar is 100 nm). (B) CD spectra show that the filtered Aβ1–40 oligomers (blue) are disordered, similar to the freshly dissolved monomers (red), and differ from the β-sheet rich fibers (black). (C–E) 2D 1H/1H NMR spectra obtained via RFDR recoupling of 1H–1H dipolar couplings show high-resolution cross-peaks for oligomers (blue) and freshly dissolved Aβ1-40 monomers (red); spectra recorded at 25![[thin space (1/6-em)]](https://www.rsc.org/images/entities/char_2009.gif) °C under 2.7kHz MAS on a 600 MHz solid-state NMR spectrometer. The spectrum highlights the observation of cross-peaks due to the recoupled 1H–1H dipolar couplings for (C) side-chain to Hα, (D) side-chain, and (E) Hβ–Hα and Hα–Hα regions. The acquisition time was 4 days. The 2.7kHz MAS and RFDR mixing enabled the suppression of signals from monomers and fibers and selective observation of low molecular weight oligomers in a non-perturbative manner. The NMR samples were prepared in 10mM phosphate buffer, pH 7.4, and 10% D2O. Copyright © 2015, Springer Nature. This figure is reproduced from Scientific Reports: DOI: 10.1038/srep11811. Further details can be found in the referenced work.103 °C under 2.7kHz MAS on a 600 MHz solid-state NMR spectrometer. The spectrum highlights the observation of cross-peaks due to the recoupled 1H–1H dipolar couplings for (C) side-chain to Hα, (D) side-chain, and (E) Hβ–Hα and Hα–Hα regions. The acquisition time was 4 days. The 2.7kHz MAS and RFDR mixing enabled the suppression of signals from monomers and fibers and selective observation of low molecular weight oligomers in a non-perturbative manner. The NMR samples were prepared in 10mM phosphate buffer, pH 7.4, and 10% D2O. Copyright © 2015, Springer Nature. This figure is reproduced from Scientific Reports: DOI: 10.1038/srep11811. Further details can be found in the referenced work.103 | ||
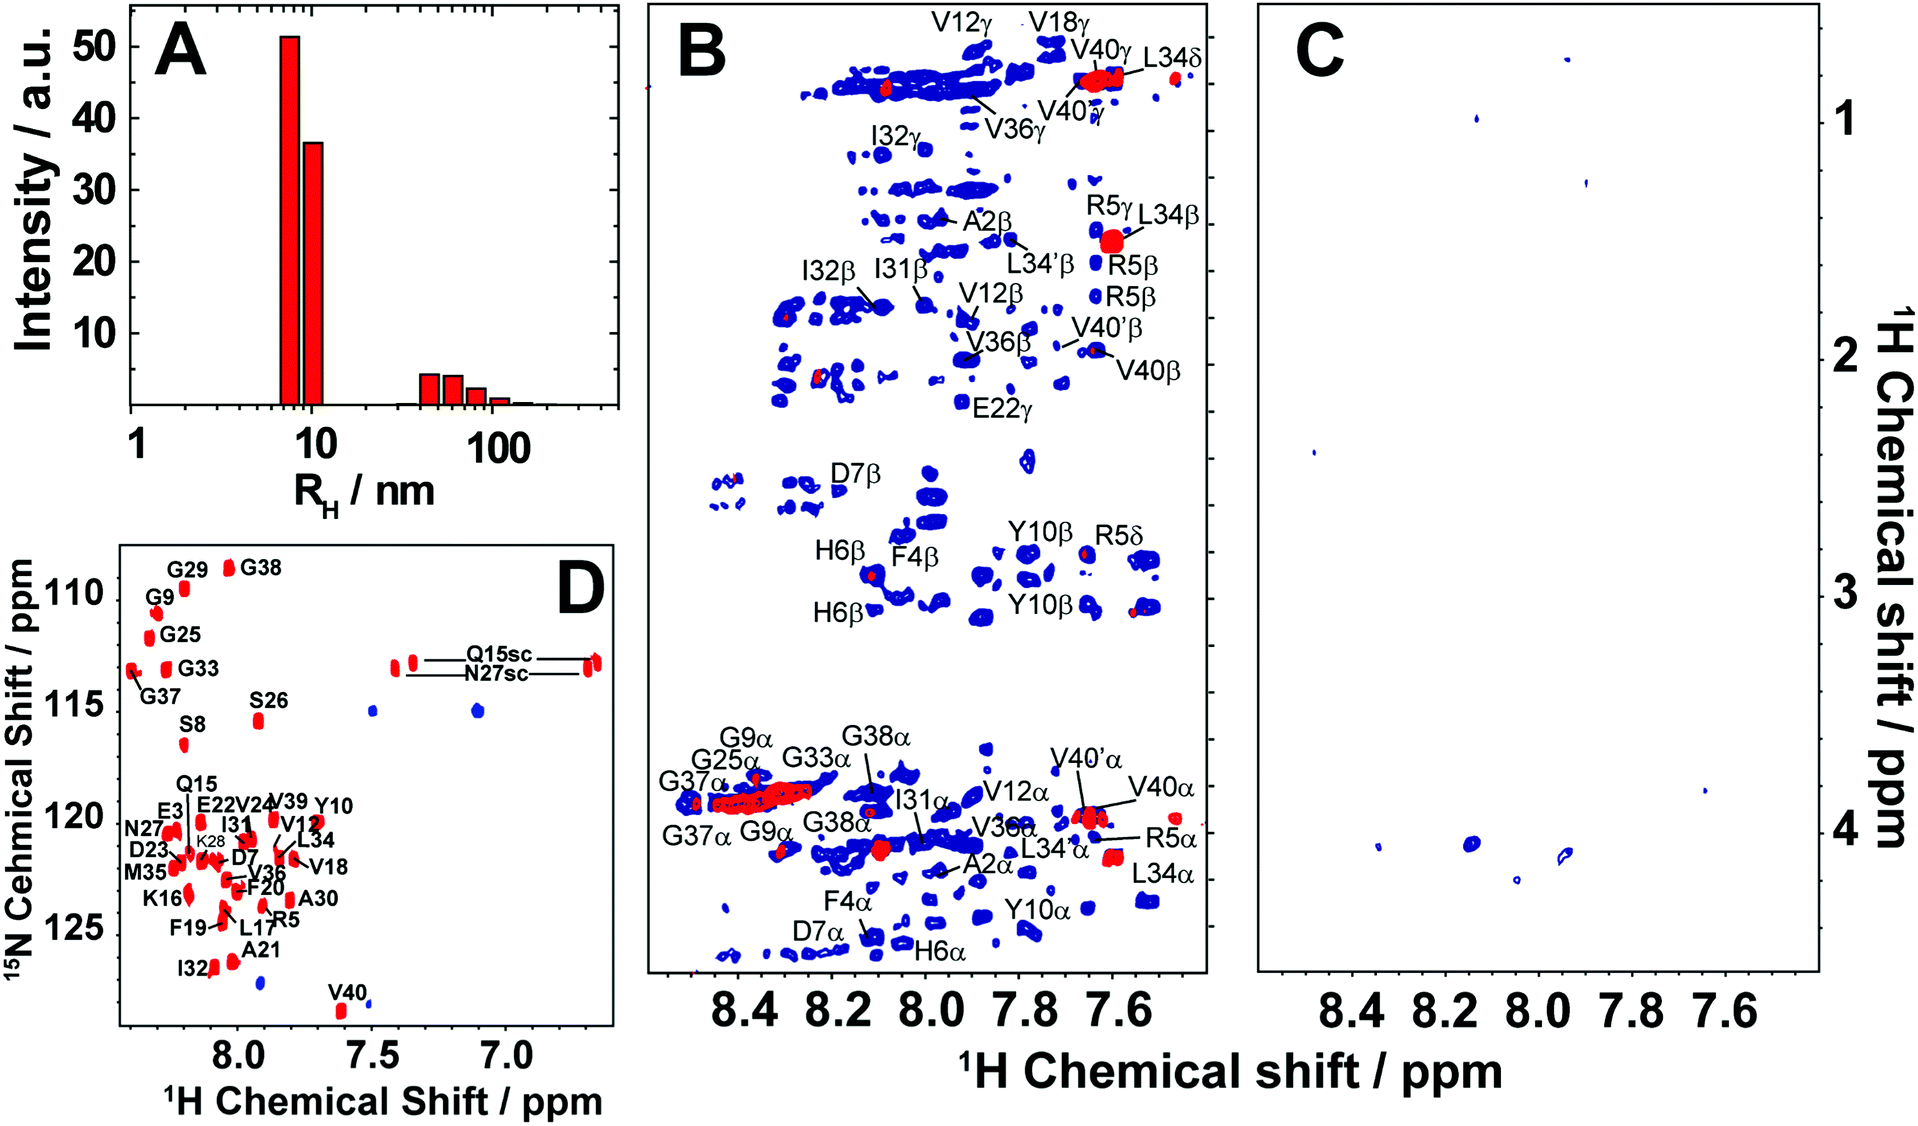 | ||
| Fig. 4 Monitoring time-lapse growth of Aβ1–40 oligomers by NMR. (A) Dynamic light scattering reveals the growth of Aβ1–40 oligomers from 8.6 nm and 65.3 nm over the course of 19 days. 2D TOCSY (B) and 2D NOESY (C) spectra of the disordered Aβ1–40 oligomers recorded at 4 days (blue) and 19 days (red). Both TOCSY and NOESY spectra show line-broadening on day-19 indicating the growth of oligomer size that are beyond the detection limit of solution NMR. (D) 2D 1H/15N HSQC spectra of the freshly dissolved (red) Aβ1–40 recorded on a 900MHz NMR spectrometer show well resolved NMR peaks. In contrast, 1H/15N HSQC spectra of the filtered disordered oligomers (blue) obtained after 4 days show substantial line broadening. The NMR samples were prepared in 10mM phosphate buffer, pH 7.4, and 10% D2O and NMR spectra were recorded at 25°C. Copyright © 2015, Springer Nature. This figure is reproduced from Scientific Reports: DOI: 10.1038/srep11811. Further details can be found in the referenced study.103 | ||
2.3 Why do we care about on-pathway Aβ oligomers?
While experimental characterization of transient oligomeric structures of Aβ at atomic-resolution is tedious, their globular morphology can be easily distinguished from protofibrils or matured fibers. A study using SAXS showed the formation of cylindrical or ellipsoidal shaped Aβ protofibers or oligomers induced by copper ions.63 Similarly, Rezaei-Ghaleh et al.107 proposed that zinc binding to N-terminus of Aβ induces off-pathway amorphous like aggregates using NMR. Unlike off-pathway oligomers, on-pathway oligomers have been shown to share a disordered conformation that resembles monomers and can grow in size over time (Fig. 4A–C). While off-pathway oligomers can be highly stable and vary in structural heterogeneity, pathological phenotype and size, on-pathway oligomers grow in size and can serve as seeds to nucleate the self-assembling seeding reaction. Thus, therapeutic development has often concentrated on restricting this aggregation pathway of Aβ to generate non-toxic species.108 The design of therapeutics is highly dependent on the chemical properties of the Aβ surface that are significantly different for disordered monomers and oligomers. As an example, solid-state NMR studies have identified inter-residue contacts between aliphatic and alpha protons of K28–G29, S26–N27, H13–G38, and S8–E11 in on-pathway oligomers that are absent in Aβ monomers (Fig. 3C–E). Such inter-residue interactions restrict the degrees of freedom of side-chains in oligomers, and therefore could hinder the potential binding of designed inhibitors screened using Aβ monomers. In this context, an argument can be made for looking into the role of a potent Aβ inhibitor, EGCG that significantly reduces Aβ's neurotoxicity when treated with monomers. In contrary, metal-bound Aβ species (oligomers) treated with EGCG exhibited a relatively low rescuing of neurotoxicity indicating EGCG's preferential binding to Aβ monomers.109 Thus, our understanding of Aβ oligomer structures derived from on-pathway aggregation not only help in understanding the aggregation pathways, but also provide substantial atomistic insights to optimize an array of currently available anti-amyloidogenic inhibitors.3. Studying Aβ intermediates by solution NMR
3.1 Structure of a small molecular weight Aβ intermediate
As discussed above, traditional solution NMR spectroscopy, relying on NOE based distance constraints obtained from NOESY experiments, has limitations on providing structural details for high molecular weight oligomers (≈100 kDa). On the other hand, a lowly populated early on-pathway intermediate of Aβ peptide, distinct from a disordered monomer, was detected and its high-resolution three-dimensional structure has been determined using NOE constraints measured from solution NMR experiments. Traditional 2D 1H/1H NOESY and TOCSY experiments were used to resolve a partially folded Aβ (1–40) intermediate characterized by a 310 helix spanning the central hydrophobic regions H13 to D23 (Fig. 5A and B).69 While uniform labelling for structure determination is expensive, these traditional methods not only provide high-resolution structural insights, but also able to isolate an early intermediate structure of Aβ that is difficult to probe using solid-state NMR as described in Section 2.2. The 310 helix folding of Aβ(1–40) intermediate served as an important feature for Aβ's aggregation and β-sheet formation. The 310 helix satisfies an intermediate conformation during α → β folding that triggers the transition of a compressed α-helix to an extended β-sheet needed for amyloid formation. Such structural transitions facilitated by a 310 helix is also identified in a water-soluble amphipathic short peptide that forms amyloid.110 This study demonstrated the feasibility of solving the structure of lowly populated very early intermediate amyloid-beta peptide. This is in contrast to perturbative methods for stabilizing such helical intermediates (Fig. 5C) on a time-scale desired for solution NMR monitoring; non-perturbative methods like optimization of sample temperature is very useful as it traps the intermediate structures during the on-pathway peptide aggregation as shown in Fig. 5C. Another solution NMR study reported an alpha-helical conformation of Aβ(1–40) and its destabilization by the oxidation of Met35, which is also shown to restrict β-sheet structural transition.111 Computational simulations also identify differently populated species of Aβ(1–40) monomers. Zheng et al.112 showed two distinguished structures for Aβ(1–40) that includes a major disordered structure with a short-helix in the central hydrophobic core and a β-hairpin structure between the central hydrophobic core and A30–V36 from MD simulation. Notably, the MD simulation at 300 K showed that Aβ(1–40) favors mostly a stable helical conformation as compared to an unstable β-hairpin structure, which becomes prominent and increasingly stable when Aβ(1–40) forms an oligomer. Similarly, another MD simulation study identified a transient 310 helix in Aβ(1–42) by varying the ionic strength.113 Thus, non-physiological conditions such as low temperature sample preparation can stabilize the early intermediates of Aβ(1–40) and could provide high-resolution structural characterization for Aβ(1–40) intermediates (Fig. 5C).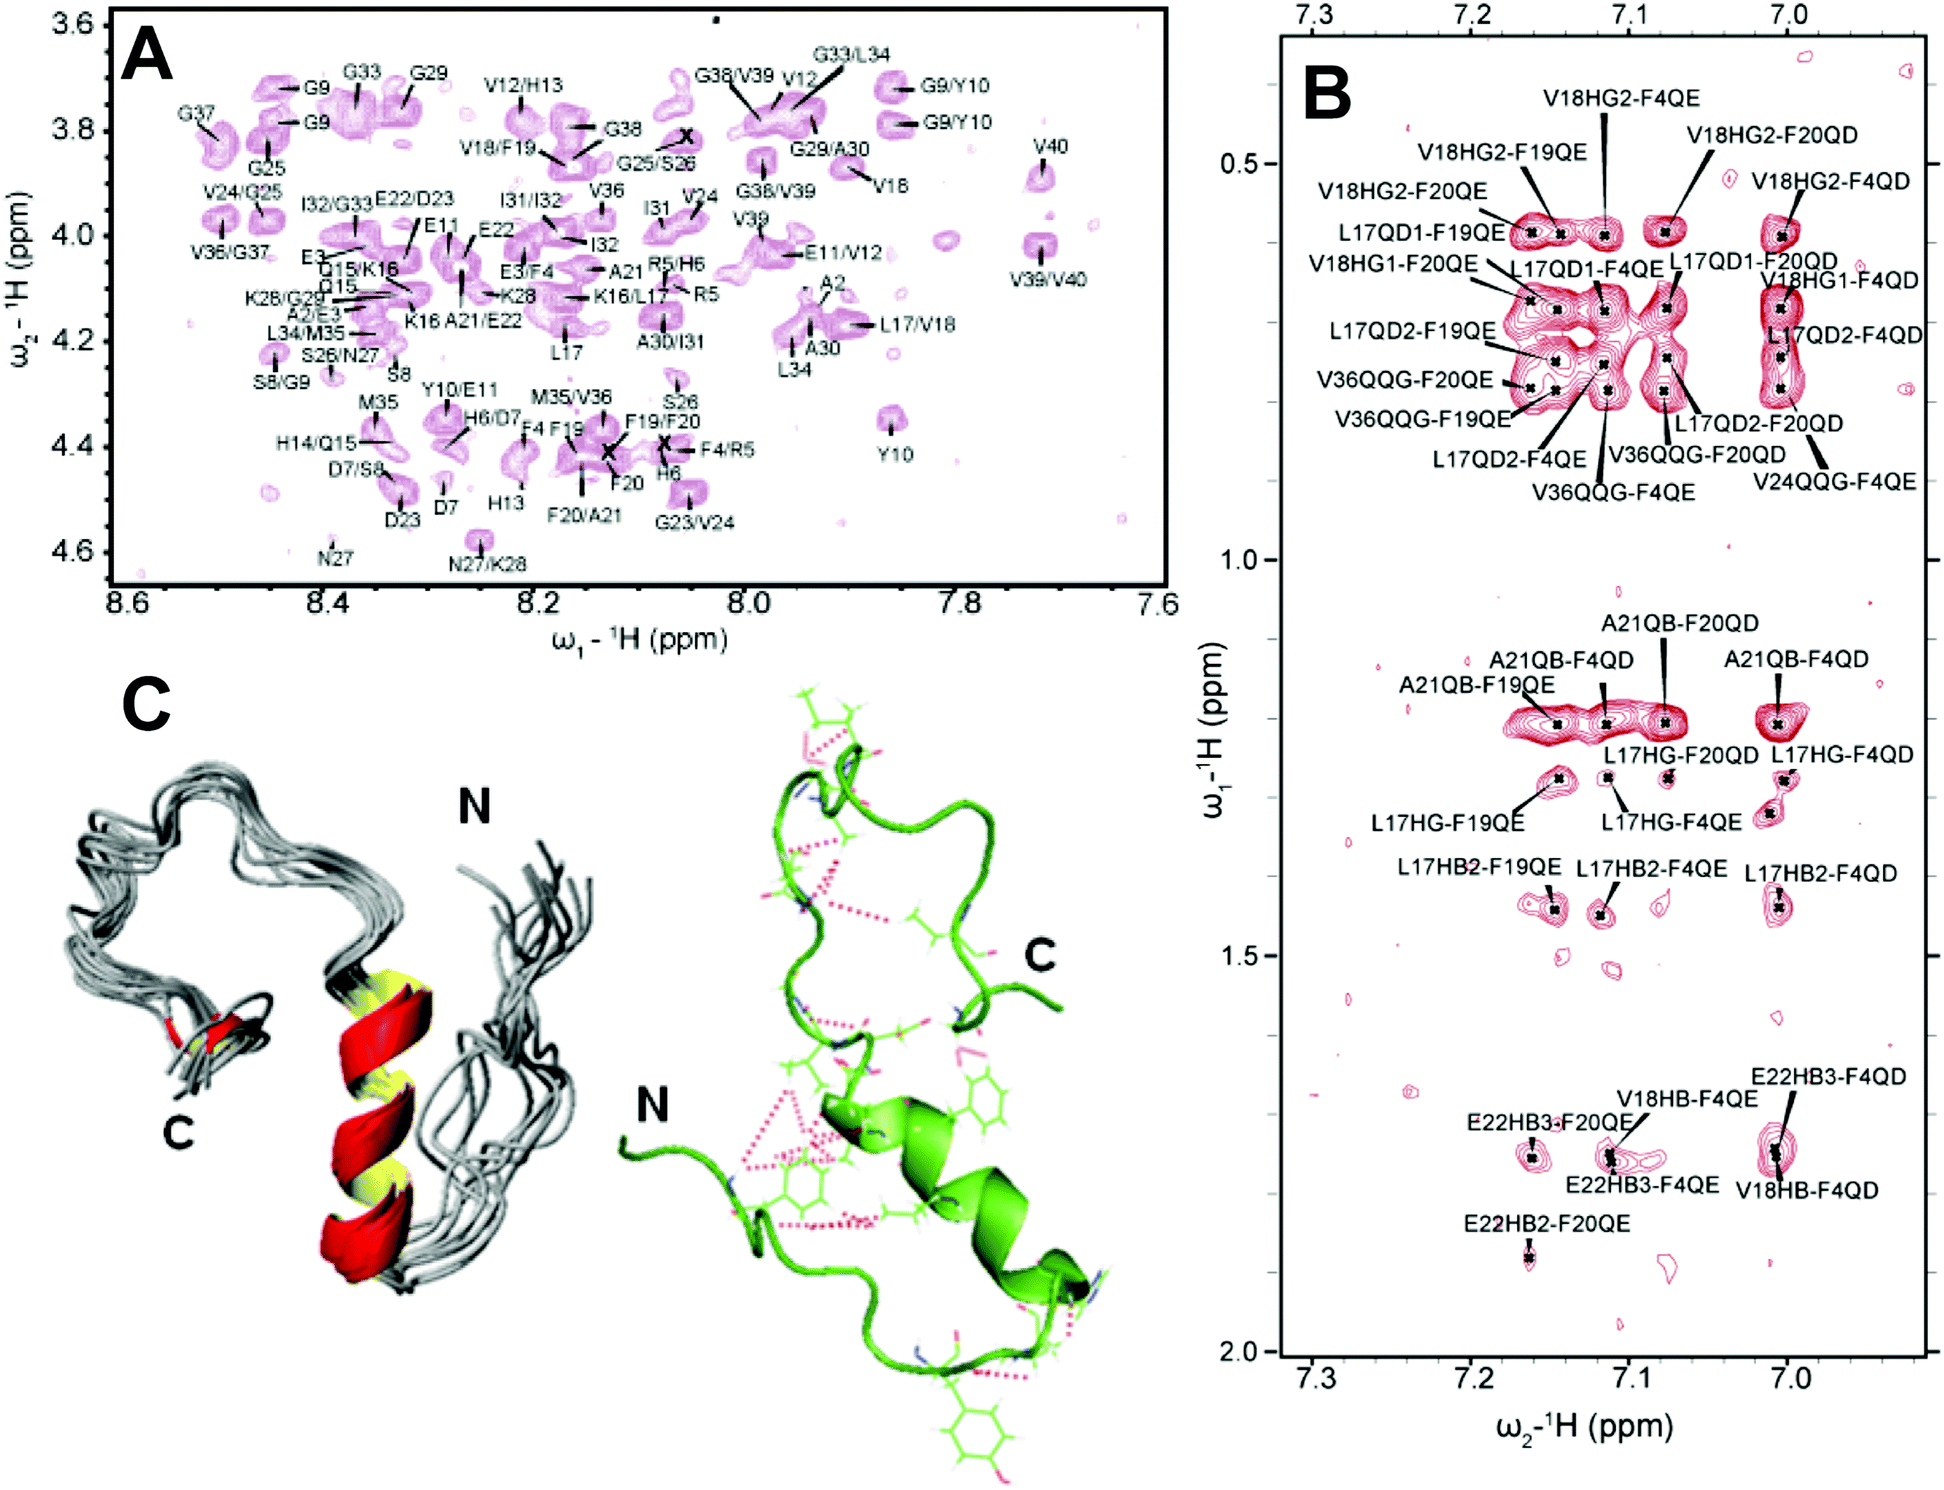 | ||
| Fig. 5 3D structure of a small molecular weight Aβ1–40 intermediate determined by solution NMR. (A) 2D NOESY spectrum of 77 μM Aβ1–40 dissolved in 20 mM potassium phosphate, 50 mM NaCl, pH 7.3 containing 93% H2O and 7% D2O recorded at 15 °C on a 900 MHz NMR spectrometer. The selected regions show NOEs that corresponds to the sequential assignment of Hαi–NHi+1. (B) The aromatic region of the NOESY spectrum showing cross-peaks between F19 and F20 residues, the C-terminus and F4 residue, and the central helical region of the peptide. (C) 3D NMR structures of Aβ1–40 calculated from NOEs and backbone dihedral angle restraints. The cartoon structure shown on the right in green shows the long-range NOEs that stabilizes the formation of the hairpin structure and the bends in the N- and C-termini (red dashed lines). Copyright © 2011 Elsevier Inc. This figure is reproduced with permission from Biochemical and Biophysical Research Communications: DOI: 10.1016/j.bbrc.2011.06.133. Further details can be found in the published article.69 | ||
3.2 Real time monitoring the formation of Aβ intermediates by 19F NMR
In addition to sample heterogeneity and interconversion among amyloid intermediates, spectral overlapping has been an obstacle for obtaining high-resolution structural information from NMR experiments. The structure elucidation using solution NMR greatly relies on the sequential assignment and backbone connectivity that are often limited by the signal overlapping and line-broadening (in both 1D and 2D NMR measurements) especially when the size of the targeted molecule grows. To this extent, development of alternative solution NMR methods apart from the traditional homonuclear (TOCSY/NOESY) NMR experiments would be useful in studying amyloid intermediates growing on-pathway during aggregation. As an example, solution 19F NMR offers an ideal alternative114 to probe amyloid intermediates as fluorine serves as an extremely rare nucleus that does not interfere with other NMR active nuclei such as 1H/15N/13C in biological samples. The sensitivity of 19F chemical environment during the conformational alteration in amyloids following the fibrillation pathway can be selectively correlated even for a small change in the 19F chemical shifts. Moreover, for amyloids a key feature is their aggregation propensity that relies on the initial concentration. That said, early oligomers are expected when the Aβ peptide samples are prepared at high concentration. To this extent, 19F NMR is useful as compared to 1H NMR as it renders a single distinct peak (Fig. 6A).115 Like 1H NMR, 19F NMR spectra can be compared considering two different factors to discriminate oligomers from non-aggregated samples115 that include chemical shift changes and line-broadening (in oligomers) measured by acquiring NMR spectra as a function of time (Fig. 6B). Similarly, 19F NMR include limitations in resolving the peaks for large species such as protofibrils, but could able to resolve low molecular weight intermediates of different size at high-resolution with distinct spectral peaks separated by tens of Hz (Fig. 6B).115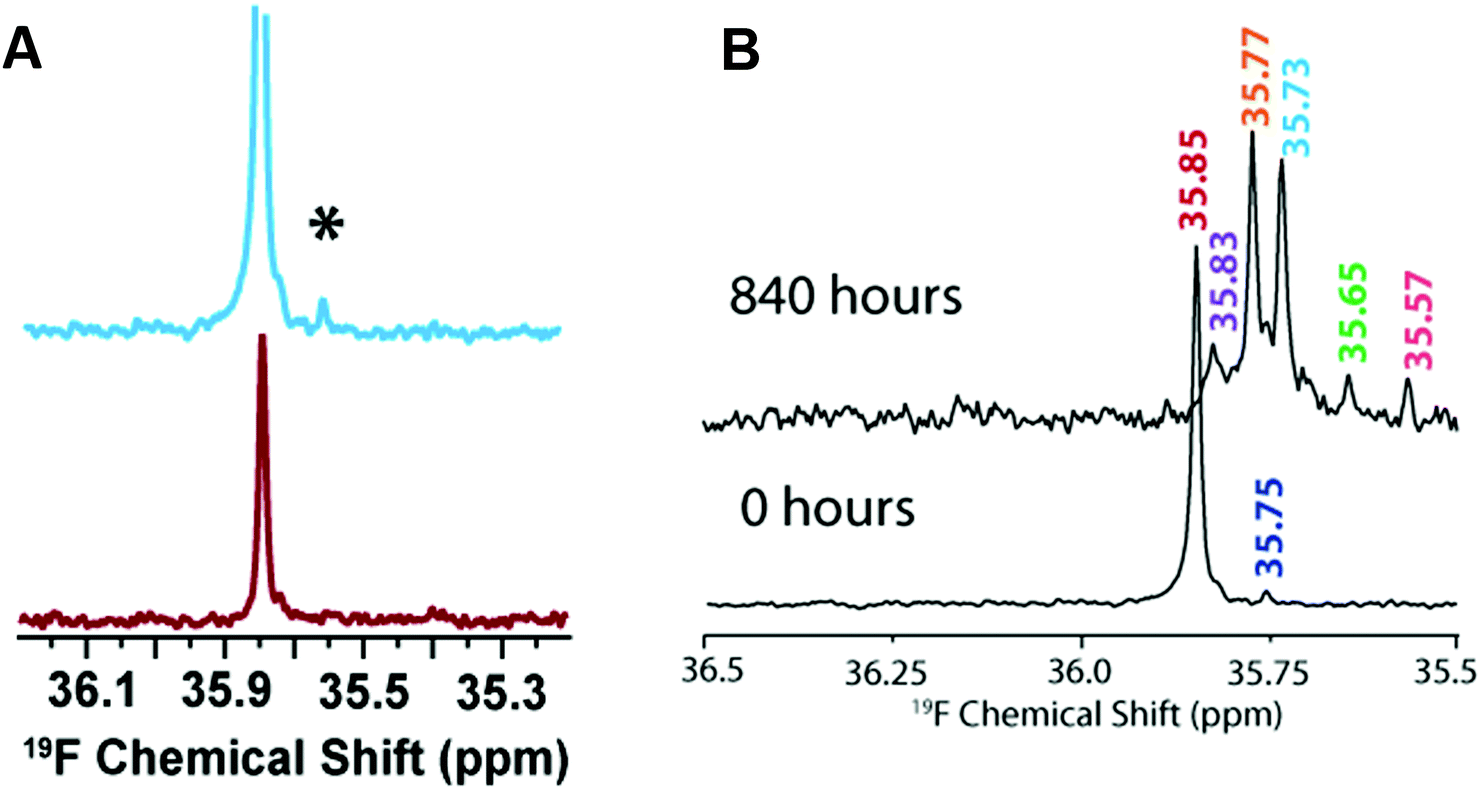 | ||
| Fig. 6 (A) Characterization of Aβ1–40 oligomers using 19F NMR. Fluorinated Aβ1–40-tfM35 showing the presence of an additional peak (denoted as *) for a freshly prepared 182 μM peptide sample (blue) as compared to 46 μM sample (red). The small additional peak indicates Aβ1–40-tfM35 oligomerization. The intensities of both samples are normalized to an internal TFE standard. (B) Monitoring the aggregation behavior of 182 μM Aβ1–40-tfM35 by 19F NMR at two different time intervals. The appearance of multiple peaks at 840 hours indicates the presence of variable sized Aβ1–40-tfM35 species. Copyright © 2013, American Chemical Society. This figure is reproduced with permission from DOI: 10.1021/bi400027y: Biochemistry 2013, 52, 1903–1912. Further details can be found in the published study.115 | ||
4. Mapping local ordered and disordered regions in non-aggregated Aβ docked with aggregated species
Besides the effort in characterizing the high-resolution structure of Aβ intermediates as discussed above, understanding their molecular mechanism in proceeding the fibrillation is important. This molecular process involves generation of intermediates during the seeding reaction where a monomer docks with preformed fibers. As discussed in Section 2.2 (Fig. 4), on-pathway intermediates are important target that grow in size (Fig. 4A–C) and proceed the self-assembly process to yield metastable fibers and identification of such molecular processes at atomic level is important. Thus, a breakthrough for therapeutic advancement urges the need for real time mapping of residues specific binding interface during the course of the seeding reaction that generates intermediate species. Realization of this goal requires both local and global structural information for long-time spans and with shorter time intervals of experimental measurements. Although, this is one of the most challenging tasks that remains unexplored and experimentally daunting, a recent study used NMR experiments to obtain such mechanistic insights (Fig. 7).116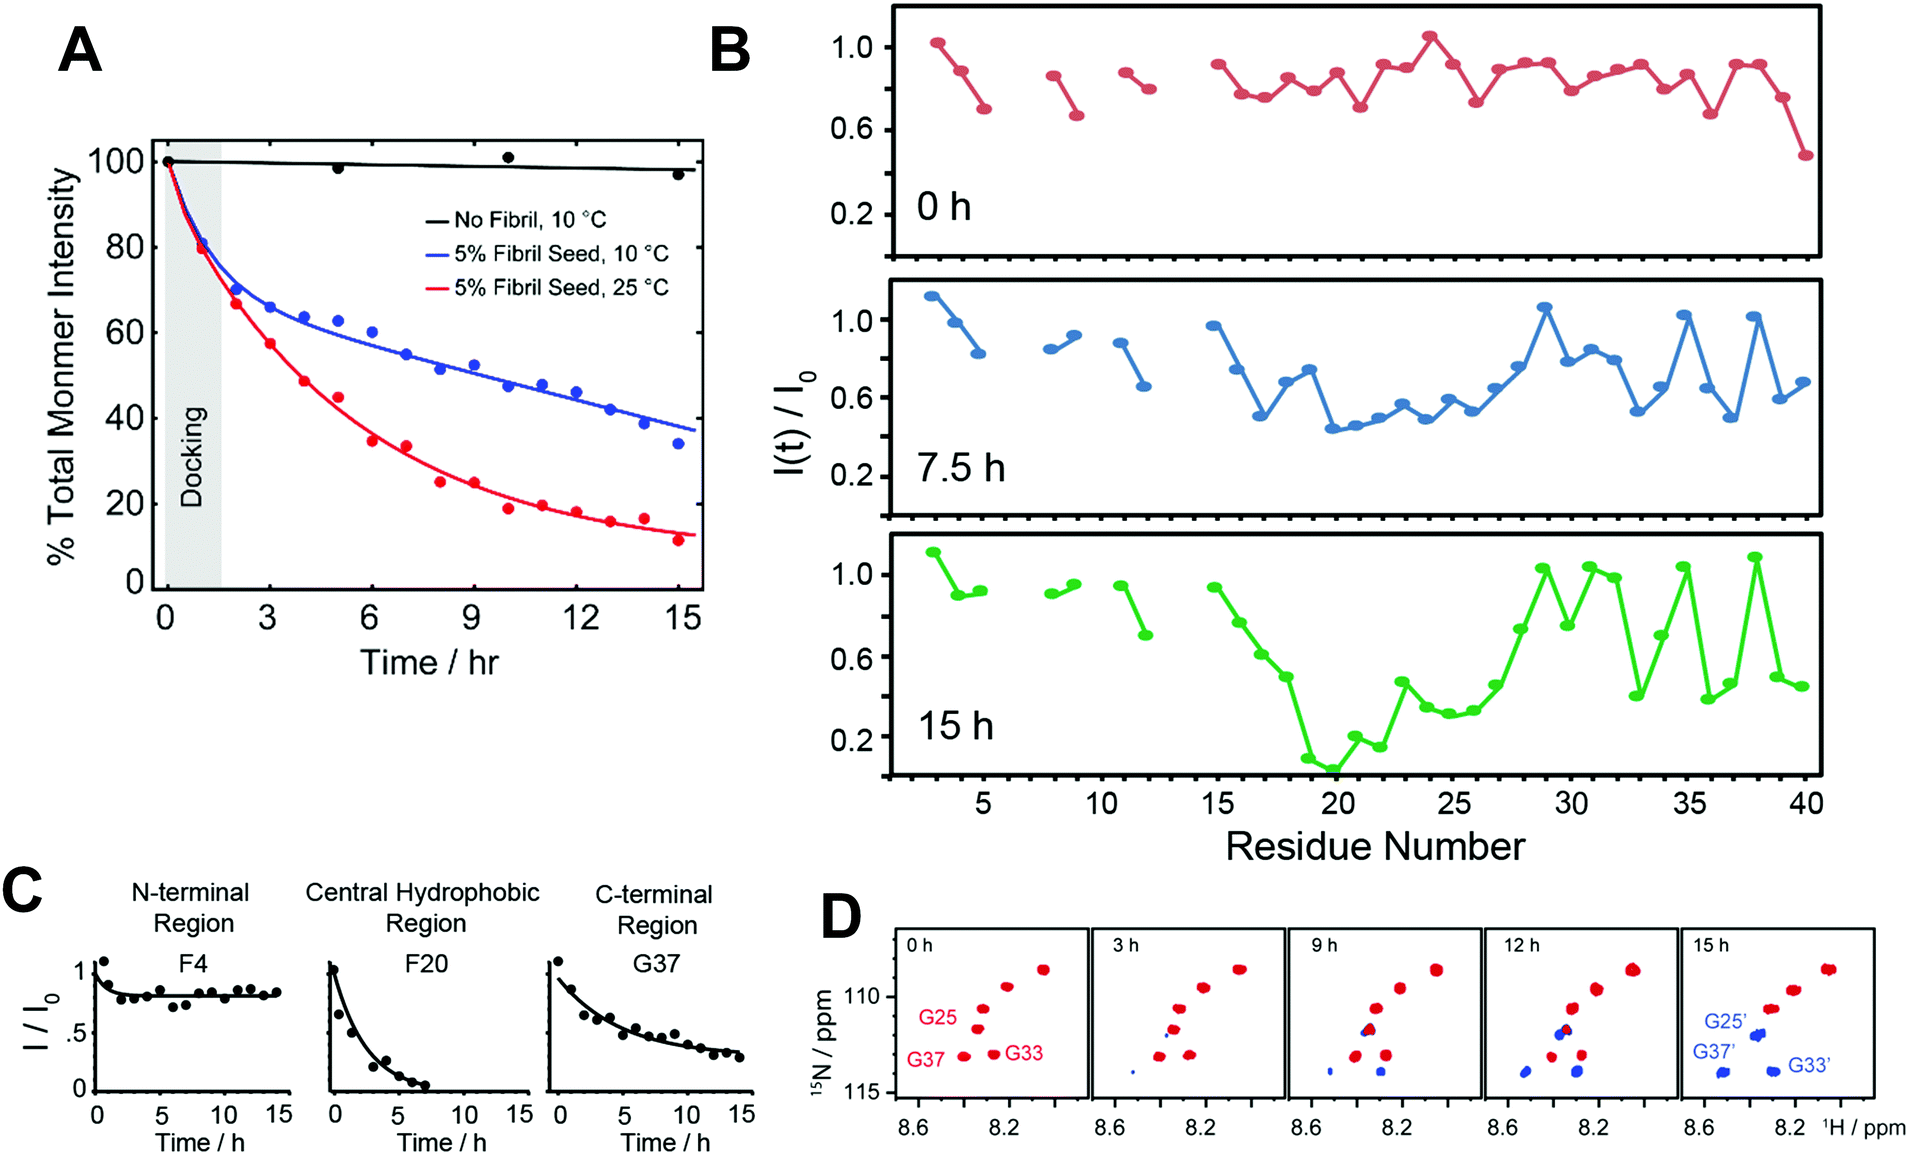 | ||
| Fig. 7 Probing dock-lock mechanism in Aβ1–40 by solution NMR. (A) Monitoring the depletion of total intensity obtained from 2D 1H–15N SOFAST-HMQC spectra during a self-seeding reaction at 10 °C. The observed distinguished kinetic phase (black vs. blue curve) indicates the dominant docking phase (grey shade) within a time-scale of first couple of hours. (B and C) Time-interval measurement highlights a substantial drop in NMR signal intensities of the central hydrophobic residues (F20 as a representative residue) as compared to N- or C-terminal residues (F4 and G37 as representative residues) indicating a possible docking site in monomer onto fully matured fibers. (D) NMR self-seeding reaction identified appearance of new peaks in the SOFAST-HMQC spectrum indicating the origin of new oligomer species. Copyright © 2019 Royal Society of Chemistry. Reproduced by permission from the Royal Society of Chemistry DOI: 10.1039/C9CC01067J. Further details are available in the referenced work.116 | ||
Solution NMR experiments, such as Band-Selective Optimized Flip Angle Short Transient-Heteronuclear Multiple Quantum Correlation (SOFAST-HMQC),117 make it feasible to retrieve both local and global folding information during a seeding reaction. Using SOFAST-HMQC,117 the structural and binding site information were obtained through mapping the regions of monomers interacting with seeded fibers in a solution sample by periodically monitoring the Aβ backbone 1H/15N resonances. The fast 2D NMR data acquisition (typically in minutes) makes it feasible to plot residue specific mapping as Aβ monomers dock to matured or sonicated short fibers (Fig. 7A). The results reported in the reviewed study extended our current understanding of transient association steps involved in the fibrillation at atomic level. For example, residue specific NMR parameters measured from SOFAST-HMQC experiments as a function of aggregation time revealed a substantial difference between Aβ monomer binding to protofibers and fibers due a significant difference in the surface of the large supramolecular structure. While the amyloidogenic segment in Aβ, comprised of sequence 16KLVFFA21, preferentially binds to protofibers,40 Brender et al.116 showed the central domain spanning residues 19–27 prefer binding to fully matured Aβ fibers (Fig. 7B and C). An important and interesting observation in this study is the identification of new oligomer species that generate and coexist with the fully matured fibers (Fig. 7D). Several new minor peaks were identified in the vicinity of C-terminal residues such as G33 and V40 when Aβ monomers are docked with matured or sonicated fibers. This study proposed that the appearance of these new peaks could be from the new oligomers that are generated at the fiber end. Moreover, their findings also provide mechanistic insight to underlining the secondary nucleation process during the seeding reaction. Overall, this study sheds light on the importance of determining the differential binding modes of Aβ monomers to aggregated species that are not monomorphic. The slight shift in the binding interface could provide additional insights for the design of peptide inhibitors as reported by Brender et al.116 A peptoid inhibitor designed from Aβ sequence (30–34) AIIAL was shown to inhibit Aβ fibrillation by selectively binding to the hydrophobic region 17LVFFA21.118 An optimal binding sequence is needed to design successful peptide inhibitors in order to arrest the fibrillation, as the targeted sequence motif ‘KLVFF’ binding to protofibers showed a moderate effect on suppressing fiber elongation and toxicity.119,120 An octapeptide derived from activity dependent neuroprotective protein has been shown to form amyloid fibers, but capable of inhibiting Aβ fibrillation. This highlights a competitive seeding reaction can be achieved to suppress self-assembled Aβ aggregates.121 Thus, a successful therapeutic development for AD requires the identification and mapping of an optimal local domain of Aβ that dock to on-pathway aggregates to proceed the seeding reaction homogenously or cross-seed to less toxic fibrillogenic peptide segments. In this direction, computational simulations also have demonstrated a dock-lock mechanism in which docking of a disordered monomer to an oligomer/fiber induce a structural rearrangement (form β-structure) following the elongation/growth of the complex.96
5. Limitations of NMR techniques and alternative approaches
As discussed in the previous sections, both solution and solid-state NMR are able to track the transient and heterogeneous species of Aβ providing atomic-resolution details. Nevertheless, a major limitation of these NMR techniques is the elucidation of a 3D structural model due to the lack of sufficient distance restraints as shown in Fig. 2–4. In addition, the driving molecular forces that govern structural transitions and oligomerization are difficult to probe using NMR. These limitations require involvement of other approaches to build structural models of Aβ oligomer for the successful design of potent drug/inhibitor. MD simulations, as briefly discussed in Section 2.2, can be used in combination with NMR to obtain structural models. We refer the readers to the published review articles on MD simulation studies.122,123 All-atom MD simulations provide insights into structural transition on a time-scale of picoseconds to microseconds. MD simulation has been shown that electrostatic interactions are the major source for the structural fluctuation and stability in Aβ peptides when compared to the wild-type Aβ10–35 with its Dutch mutant (E22Q).124 The simulations probed the early events of structural transition where the E22Q mutant was found to be more flexible as compared to the wild-type and adopts predominantly α-helical conformation that is in line with experimental observations. The MD simulation predicted conformational changes in the Dutch mutant could be due to an increase in the hydrophobic solvation resulting in an enhancement of desolvation and aggregation propensity as compared to the wild-type Aβ peptide.98 As discussed in Section 3, identification and characterization of early amyloid intermediates are of significant importance to better understand the mechanism of amyloid aggregation and the formation of toxic intermediates. In studying this, it was proposed that hydrophobic interactions between monomers primarily stabilize Aβ10–35 dimers and the peptide molecules experience a substantial conformational change during dimerization.97 By comparing two dimer models (which are mentioned as ε-dimer and ϕ-dimer) differing in their monomer packing, Tarus et al. revealed that the ε-dimer stabilized by electrostatic interaction is energetically less stable as compared to the ϕ-dimer that is stabilized by hydrophobic interactions. These results revealed a differential energy landscape preceding nucleation, which is mostly due to peptide–peptide and peptide–water interactions. Such information are not easy to obtain from NMR. MD simulation has also been successful in generating an array of different planar β-strand dimer conformations for Aβ(1–40) and Aβ(1–42).76 Another simulation study identified significantly more number of dimers in Aβ(1–40), whereas Aβ(1–42) has been shown to generate pentamers which correlates to the difference in the aggregation propensities of these two isoforms.125Following the discussion in Section 4, MD simulation has been successful in establishing a model to explain the dock–lock mechanism during a seeding reaction.94 Massi et al. proposed two different pathways for the deposition of Aβ or its mutants that includes a fast deposition through nucleation and deposition of Aβ to pre-existing fibers undergoing structural reorganization. Using microseconds all-atom MD simulations, Nguyen et al. showed the docking of Aβ monomers to water-soluble oligomers.95 The simulation results showed that the trimers of an Aβ fragment (16–22), with an anti-parallel structure, undergo structural reorganization and on a time scale of hundreds of nanoseconds when added with monomers; the trimers are shown to grow in size to form tetramers, pentamers and hexamers with a relatively more ordered (β-sheet) conformation.95 The added monomer was observed to follow a two-step mechanism where it first docks to the anti-parallel trimer leading to an extension of the chain followed by a substantial change in its conformation with a growing β-sheet content.95
Recent advancement in electron paramagnetic resonance (EPR) spectroscopy provides structural insights into Aβ oligomers. Using site-directed spin-labelling, Gu et al. showed a site-specific mobility and rigidity in Aβ oligomer. The order of rigidity increases from N- to C-terminus with the residues 29–40 tightly packed.126 A monomer unit in the model structure of Aβ(1–42) oligomers, built using EPR distance restraints, is comprised of three anti-parallel β-strands forming a single β-sheet.127 While such structural information is difficult to obtain using solution NMR, solid-state NMR is capable of providing these information but at the cost of relatively a large amount of sample and residue specific selective isotope labelling.128,129 X-ray crystallography shown to be an alternative method in resolving Aβ oligomers; however require peptide chemical modifications for crystallization. Using chemically modified Aβ mimetic peptides, Nowick et al. reported Aβ trimer, hexamer and dodecamer structures.61,130 The tight packing of C-terminal residues influencing oligomer formation correlate to NMR observation that identified several inter-residue cross-peaks (K28–G29, S26–N27, H13–G38 and S8–E11) in the 2D RFDR measurement suggesting their involvement in the oligomer formation (Fig. 3). Nevertheless, mutagenesis analysis further suggested that the C-terminal hydrophobic residues (I31, I32, L34, V39, V40, and I41) are key determinants of Aβ oligomerization.131 RFDR experiments also indicated the important involvement of serine and glycine fingerprint regions influencing the formation of disordered oligomers. Taken together, the suggested regions are potential target sites for designing inhibitors to suppress Aβ toxicity.132,133
6. Concluding remarks
Although obtaining atomic-resolution structural details of Aβ intermediate species continues to be a major challenge, a combination of solution and solid-state NMR techniques and MD simulations can be used to overcome some of these challenges. As described in this review article, recent studies have successfully developed 3D structural models of amyloid intermediates transitioning from a disordered state to partially folded state. Of particular interest, these structural models established a platform for both experimental and computational biophysicists to develop or optimize anti-amyloidogenic inhibitors. However, bridging the structural gap between disordered and ordered (β-sheet rich) states of Aβ requires further attention and methodological advancements where NMR is a promising technique. In addition, the recent advancement of cryo-EM in picturing molecules of several hundred kDa further brings hope to visualize atomic resolution of Aβ globular oligomers. In parallel, the recent advances in hardware such as very fast MAS, MAS CryoProbe134 and sub-milligram sample rotors etc. could enable high throughput structural studies of Aβ oligomers in the near future.Conflicts of interest
There are no conflicts to declare.Acknowledgements
A. R. acknowledge funding from the National Institutes of Health (AG048934). We thank Dr John Staub and Dr Devarajan Thirumalai for fruitful discussions. A. R. also thanks Dr Jeffrey Brender (NIH) for the valuable contributions to the amyloid research in the lab.References
- R. S. Harrison, P. C. Sharpe, Y. Singh and D. P. Fairlie, Rev. Physiol. Biochem. Pharmacol., 2007, 159, 1–77 CAS.
- F. Chiti and C. M. Dobson, Annu. Rev. Biochem., 2006, 75, 333–366 CrossRef CAS PubMed.
- T. P. J. Knowles, M. Vendruscolo and C. M. Dobson, Nat. Rev. Mol. Cell Biol., 2014, 15, 384–396 CrossRef CAS PubMed.
- I. W. Hamley, Chem. Rev., 2012, 112, 5147–5192 CrossRef CAS PubMed.
- R. J. O’Brien and P. C. Wong, Annu. Rev. Neurosci., 2011, 34, 185–204 CrossRef PubMed.
- A. S. DeToma, S. Salamekh, A. Ramamoorthy and M. H. Lim, Chem. Soc. Rev., 2012, 41, 608–621 RSC.
- K. Ono, M. M. Condron and D. B. Teplow, J. Biol. Chem., 2010, 285, 23186–23197 CrossRef CAS PubMed.
- A. M. Morris, M. A. Watzky and R. G. Finke, Biochim. Biophys. Acta, Proteins Proteomics, 2008, 1794, 375–397 CrossRef PubMed.
- G. Meisl, J. B. Kirkegaard, P. Arosio, T. C. T. Michaels, M. Vendruscolo, C. M. Dobson, S. Linse and T. P. J. Knowles, Nat. Protoc., 2016, 11, 252–272 CrossRef CAS PubMed.
- S. I. A. Cohen, M. Vendruscolo, C. M. Dobson and T. P. J. Knowles, J. Mol. Biol., 2012, 421, 160–171 CrossRef CAS PubMed.
- L. Nagel-Steger, M. C. Owen and B. Strodel, ChemBioChem, 2016, 17, 657–676 CrossRef CAS PubMed.
- L. M. Young, L. H. Tu, D. P. Raleigh, A. E. Ashcroft and S. E. Radford, Chem. Sci., 2017, 8, 5030–5040 RSC.
- L. Breydo, D. Kurouski, S. Rasool, S. Milton, J. W. Wu, V. N. Uversky, I. K. Lednev and C. G. Glabe, Biochem. Biophys. Res. Commun., 2016, 477, 700–705 CrossRef CAS PubMed.
- M. Algamal, R. Ahmed, N. Jafari, B. Ahsan, J. Ortega and G. Melacini, J. Biol. Chem., 2017, 292, 17158–17168 CrossRef CAS PubMed.
- R. Riek, Cold Spring Harb. Perspect. Biol., 2017, 9, a023572 CrossRef PubMed.
- A. M. Ruschak and A. D. Miranker, Proc. Natl. Acad. Sci. U. S. A., 2007, 104, 12341–12346 CrossRef CAS PubMed.
- E. Chuang, A. M. Hori, C. D. Hesketh and J. Shorter, J. Cell Sci., 2018, 131, 131 CrossRef PubMed.
- F. Chiti and C. M. Dobson, Annu. Rev. Biochem., 2017, 86, 27–68 CrossRef CAS PubMed.
- I. Benilova, E. Karran and B. De Strooper, Nat. Neurosci., 2012, 15, 349–357 CrossRef CAS PubMed.
- M. Baldassarre, C. M. Baronio, L. A. Morozova-Roche and A. Barth, Chem. Sci., 2017, 8, 8247–8254 RSC.
- S. Ly, R. Altman, J. Petrlova, Y. Lin, S. Hilt, T. Huser, T. A. Laurence and J. C. Voss, J. Biol. Chem., 2013, 288, 11628–11635 CrossRef CAS PubMed.
- A. Mouchard, M. C. Boutonnet, C. Mazzocco, N. Biendon and N. Macrez, Sci. Rep., 2019, 9, 3989 CrossRef PubMed.
- S. S. Muñoz, B. Garner and L. Ooi, Neurochem. Res., 2018, 0, 0 Search PubMed.
- B. R. Sahoo, M. E. Bekier, Z. Liu, V. Kocman, A. K. Stoddard, G. M. Anantharamaiah, J. Nowick, C. A. Fierke, Y. Wang and A. Ramamoorthy, J. Mol. Biol., 2020, 432, 1020–1034 CrossRef PubMed.
- V. Cavallucci, M. D’Amelio and F. Cecconi, Mol. Neurobiol., 2012, 45, 366–378 CrossRef CAS PubMed.
- L. N. Zhao, H. Long, Y. Mu and L. Y. Chew, Int. J. Mol. Sci., 2012, 13, 7303–7327 CrossRef CAS PubMed.
- B. R. Sahoo, T. Genjo, S. J. Cox, A. K. Stoddard, G. M. Anantharamaiah, C. Fierke and A. Ramamoorthy, J. Mol. Biol., 2018, 430, 4230–4244 CrossRef CAS PubMed.
- E. Y. Hayden, J. L. Conovaloff, A. Mason, G. Bitan and D. B. Teplow, Anal. Biochem., 2016, 518, 78–85 CrossRef PubMed.
- M. Querol-Vilaseca, M. Colom-Cadena, J. Pegueroles, R. Nuñez-Llaves, J. Luque-Cabecerans, L. Muñoz-Llahuna, J. Andilla, O. Belbin, T. L. Spires-Jones, E. Gelpi, J. Clarimon, P. Loza-Alvarez, J. Fortea and A. Lleó, Sci. Rep., 2019, 9, 5181 CrossRef PubMed.
- H. Jang, J. Zheng, R. Lal and R. Nussinov, Trends Biochem. Sci., 2008, 33, 91–100 CrossRef CAS PubMed.
- R. Riek and D. S. Eisenberg, Nature, 2016, 539, 227–235 CrossRef PubMed.
- D. E. Ehrnhoefer, J. Bieschke, A. Boeddrich, M. Herbst, L. Masino, R. Lurz, S. Engemann, A. Pastore and E. E. Wanker, Nat. Struct. Mol. Biol., 2008, 15, 558–566 CrossRef CAS PubMed.
- Peptide Self-Assembly, ed. B. L. Nilsson and T. M. Doran, Springer New York, New York, NY, 2018, vol. 1777 Search PubMed.
- M. G. Iadanza, M. P. Jackson, E. W. Hewitt, N. A. Ranson and S. E. Radford, Nat. Rev. Mol. Cell Biol., 2018, 19, 755–773 CrossRef CAS PubMed.
- A. Abdolvahabi, Y. Shi, S. Rasouli, C. M. Croom, A. Chuprin and B. F. Shaw, Biophys. J., 2017, 112, 250–264 CrossRef CAS PubMed.
- T. K. Karamanos, A. P. Kalverda, G. S. Thompson and S. E. Radford, Prog. Nucl. Magn. Reson. Spectrosc., 2015, 88–89, 86–104 CrossRef CAS PubMed.
- M. Kovermann, P. Rogne and M. Wolf-Watz, Q. Rev. Biophys., 2016, 49, e6 CrossRef PubMed.
- R. Mishra, M. Geyer and R. Winter, ChemBioChem, 2009, 10, 1769–1772 CrossRef CAS PubMed.
- B. H. Meier, R. Riek and A. Böckmann, Trends Biochem. Sci., 2017, 42, 777–787 CrossRef CAS PubMed.
- N. L. Fawzi, J. Ying, R. Ghirlando, D. A. Torchia and G. M. Clore, Nature, 2011, 480, 268–272 CrossRef CAS PubMed.
- B. Sarkar, V. S. Mithu, B. Chandra, A. Mandal, M. Chandrakesan, D. Bhowmik, P. K. Madhu and S. Maiti, Angew. Chem., Int. Ed., 2014, 53, 6888–6892 CrossRef CAS PubMed.
- R. Ahmed and G. Melacini, Chem. Commun., 2018, 54, 4644–4652 RSC.
- J. Schleucher, M. Schwendinger, M. Sattler, P. Schmidt, O. Schedletzky, S. J. Glaser, O. W. Sorensen and C. Griesinger, A general enhancement scheme in heteronuclear multidimensional NMR employing pulsed field gradients, 1994, vol. 4 Search PubMed.
- D. C. Rodriguez Camargo, K. J. Korshavn, A. Jussupow, K. Raltchev, D. Goricanec, M. Fleisch, R. Sarkar, K. Xue, M. Aichler, G. Mettenleiter, A. K. Walch, C. Camilloni, F. Hagn, B. Reif and A. Ramamoorthy, eLife, 2017, 6, e31226 CrossRef PubMed.
- B. R. Sahoo, T. Genjo, T. W. Nakayama, A. K. Stoddard, T. Ando, K. Yasuhara, C. A. Fierke and A. Ramamoorthy, Chem. Sci., 2019, 10, 3976–3986 RSC.
- R. Tycko, Annu. Rev. Phys. Chem., 2011, 62, 279–299 CrossRef CAS PubMed.
- J. L. Silva, D. Foguel and C. A. Royer, Trends Biochem. Sci., 2001, 26, 612–618 CrossRef CAS PubMed.
- M. B. Erlach, H. R. Kalbitzer, R. Winter and W. Kremer, ChemistrySelect, 2016, 1, 3239–3243 CrossRef CAS.
- D. J. Rosenman, N. Clemente, M. Ali, A. E. García and C. Wang, Chem. Commun., 2018, 54, 4609–4612 RSC.
- C. E. Munte, M. Beck-Erlach, W. Kremer, J. Koehler and H. R. Kalbitzer, Angew. Chem., Int. Ed., 2013, 52, 8943–8947 CrossRef CAS PubMed.
- J. Wang, T. Yamamoto, J. Bai, S. J. Cox, K. J. Korshavn, M. Monette and A. Ramamoorthy, Chem. Commun., 2018, 54, 2000–2003 RSC.
- O. N. Antzutkin, Modern Magnetic Resonance, 2018, pp. 333–347 Search PubMed.
- M. Landau, D. Eisenberg, D. Flot, A. Laganowsky, M. Zhao, M. R. Sawaya, D. Cascio, L. Goldschmidt, A. B. Soriaga and J.-P. Colletier, Proc. Natl. Acad. Sci. U. S. A., 2011, 108, 16938–16943 CrossRef PubMed.
- J. Rasmussen, J. Mahler, N. Beschorner, S. A. Kaeser, L. M. Häsler, F. Baumann, S. Nyström, E. Portelius, K. Blennow, T. Lashley, N. C. Fox, D. Sepulveda-Falla, M. Glatzel, A. L. Oblak, B. Ghetti, K. P. R. Nilsson, P. Hammarström, M. Staufenbiel, L. C. Walker and M. Jucker, Proc. Natl. Acad. Sci. U. S. A., 2017, 114, 13018–13023 CrossRef CAS PubMed.
- R. Tycko, Neuron, 2015, 86, 632–645 CrossRef CAS PubMed.
- J. D. Pham, B. Demeler and J. S. Nowick, J. Am. Chem. Soc., 2014, 136, 5432–5442 CrossRef CAS PubMed.
- S. J. C. Lee, E. Nam, H. J. Lee, M. G. Savelieff and M. H. Lim, Chem. Soc. Rev., 2017, 46, 310–323 RSC.
- U. Sengupta, A. N. Nilson and R. Kayed, EBioMedicine, 2016, 6, 42–49 CrossRef PubMed.
- B. R. Sahoo, T. Genjo, M. Bekier, S. J. Cox, A. K. Stoddard, M. Ivanova, K. Yasuhara, C. A. Fierke, Y. Wang and A. Ramamoorthy, Chem. Commun., 2018, 54, 12883–12886 RSC.
- Y. Irie, K. Murakami, M. Hanaki, Y. Hanaki, T. Suzuki, Y. Monobe, T. Takai, K. I. Akagi, T. Kawase, K. Hirose and K. Irie, ACS Chem. Neurosci., 2017, 8, 807–816 CrossRef CAS PubMed.
- A. G. Kreutzer and J. S. Nowick, Acc. Chem. Res., 2018, 51, 706–718 CrossRef CAS PubMed.
- J. C. Stroud, C. Liu, P. K. Teng and D. Eisenberg, Proc. Natl. Acad. Sci. U. S. A., 2012, 109, 7717–7722 CrossRef CAS PubMed.
- T. M. Ryan, N. Kirby, H. D. T. Mertens, B. Roberts, K. J. Barnham, R. Cappai, C. L. L. Pham, C. L. Masters and C. C. Curtain, Metallomics, 2015, 7, 536–543 RSC.
- Y. Miller, B. Ma and R. Nussinov, Proc. Natl. Acad. Sci. U. S. A., 2010, 107, 9490–9495 CrossRef CAS PubMed.
- T. M. Ryan, B. R. Roberts, G. McColl, D. J. Hare, P. A. Doble, Q.-X. Li, M. Lind, A. M. Roberts, H. D. T. Mertens, N. Kirby, C. L. L. Pham, M. G. Hinds, P. A. Adlard, K. J. Barnham, C. C. Curtain and C. L. Masters, J. Neurosci., 2015, 35, 2871–2884 CrossRef CAS PubMed.
- J. Wang, T. Yamamoto, J. Bai, S. J. Cox, K. J. Korshavn, M. Monette and A. Ramamoorthy, Chem. Commun., 2018, 54, 2000–2003 RSC.
- W. B. Stine, L. Jungbauer, C. Yu and M. J. Ladu, Methods Mol. Biol., 2011, 670, 13–32 CrossRef CAS PubMed.
- M. Fa, I. J. Orozco, Y. I. Francis, F. Saeed, Y. Gong and O. Arancio, J. Visualized Exp., 2010, 1884 Search PubMed.
- S. Vivekanandan, J. R. Brender, S. Y. Lee and A. Ramamoorthy, Biochem. Biophys. Res. Commun., 2011, 411, 312–316 CrossRef CAS PubMed.
- M. Ahmed, J. Davis, D. Aucoin, T. Sato, S. Ahuja, S. Aimoto, J. I. Elliott, W. E. Van Nostrand and S. O. Smith, Nat. Struct. Mol. Biol., 2010, 17, 561–567 CrossRef CAS PubMed.
- S. Chimon, M. A. Shaibat, C. R. Jones, D. C. Calero, B. Aizezi and Y. Ishii, Nat. Struct. Mol. Biol., 2007, 14, 1157–1164 CrossRef CAS PubMed.
- M. Serra-Batiste, M. Ninot-Pedrosa, M. Bayoumi, M. Gairí, G. Maglia and N. Carulla, Proc. Natl. Acad. Sci. U. S. A., 2016, 113, 10866–10871 CrossRef CAS PubMed.
- A. M. Brown and D. R. Bevan, Biophys. J., 2016, 111, 937–949 CrossRef CAS PubMed.
- B. R. Sahoo, T. Genjo, S. J. Cox, A. K. Stoddard, G. M. Anantharamaiah, C. Fierke and A. Ramamoorthy, J. Mol. Biol., 2018, 430, 4230–4244 CrossRef CAS PubMed.
- J. E. Straub and D. Thirumalai, Curr. Opin. Struct. Biol., 2010, 20, 187–195 CrossRef CAS PubMed.
- B. Urbanc, L. Cruz, F. Ding, D. Sammond, S. Khare, S. V. Buldyrev, H. E. Stanley and N. V. Dokholyan, Biophys. J., 2004, 87, 2310–2321 CrossRef CAS PubMed.
- G. Wei, N. Mousseau and P. Derreumaux, Prion, 2007, 1, 3–8 CrossRef PubMed.
- T. Yang, S. Li, H. Xu, D. M. Walsh and D. J. Selkoe, J. Neurosci., 2017, 37, 152–163 CrossRef CAS PubMed.
- A. Loquet, N. El Mammeri, J. Stanek, M. Berbon, B. Bardiaux, G. Pintacuda and B. Habenstein, Methods, 2018, 138–139, 26–38 CrossRef CAS PubMed.
- M. T. Colvin, R. Silvers, Q. Z. Ni, T. V. Can, I. Sergeyev, M. Rosay, K. J. Donovan, B. Michael, J. Wall, S. Linse and R. G. Griffin, J. Am. Chem. Soc., 2016, 138, 9663–9674 CrossRef CAS PubMed.
- M. A. Wälti, F. Ravotti, H. Arai, C. G. Glabe, J. S. Wall, A. Böckmann, P. Güntert, B. H. Meier and R. Riek, Proc. Natl. Acad. Sci. U. S. A., 2016, 113, E4976–E4984 CrossRef PubMed.
- I. Bertini, L. Gonnelli, C. Luchinat, J. Mao and A. Nesi, J. Am. Chem. Soc., 2011, 133, 16013–16022 CrossRef CAS PubMed.
- Z. Niu, W. Zhao, Z. Zhang, F. Xiao, X. Tang and J. Yang, Angew. Chem., Int. Ed., 2014, 53, 9294–9297 CrossRef CAS PubMed.
- K. L. Morris and L. C. Serpell, Methods Mol. Biol., 2012, 849, 121–135 CrossRef CAS PubMed.
- D. Eisenberg and M. Jucker, Cell, 2012, 148, 1188–1203 CrossRef CAS PubMed.
- L. Gremer, D. Schölzel, C. Schenk, E. Reinartz, J. Labahn, R. B. G. Ravelli, M. Tusche, C. Lopez-iglesias, W. Hoyer, H. Heise, D. Willbold and G. F. Schröder, Science, 2017, 358, 116–119 CrossRef CAS PubMed.
- M. Schmidt, A. Rohou, K. Lasker, J. K. Yadav, C. Schiene-Fischer, M. Fändrich and N. Grigorieff, Proc. Natl. Acad. Sci. U. S. A., 2015, 112, 11858–11863 CrossRef CAS.
- T. J. Esparza, N. C. Wildburger, H. Jiang, M. Gangolli, N. J. Cairns, R. J. Bateman and D. L. Brody, Sci. Rep., 2016, 6, 1–16 CrossRef PubMed.
- D. Sehlin, H. Englund, B. Simu, M. Karlsson, M. Ingelsson, F. Nikolajeff, L. Lannfelt and F. E. Pettersson, PLoS One, 2012, 7, e32014 CrossRef CAS PubMed.
- A. Rostagno and J. Ghiso, Curr. Protoc. Cell Biol., 2009, 44, 3.33.1–3.33.33 Search PubMed.
- S. Lesné, T. K. Ming, L. Kotilinek, R. Kayed, C. G. Glabe, A. Yang, M. Gallagher and K. H. Ashe, Nature, 2006, 440, 352–357 CrossRef PubMed.
- M. Townsend, G. M. Shankar, T. Mehta, D. M. Walsh and D. J. Selkoe, J. Physiol., 2006, 572, 477–492 CrossRef CAS PubMed.
- G. M. Shankar, S. Li, T. H. Mehta, A. Garcia-Munoz, N. E. Shepardson, I. Smith, F. M. Brett, M. A. Farrell, M. J. Rowan, C. A. Lemere, C. M. Regan, D. M. Walsh, B. L. Sabatini and D. J. Selkoe, Nat. Med., 2008, 14, 837–842 CrossRef CAS.
- F. Massi and J. E. Straub, Proteins: Structure, Function and Genetics, 2001, vol. 42, pp. 217–229 Search PubMed.
- P. H. Nguyen, M. S. Li, G. Stock, J. E. Straub and D. Thirumalai, Proc. Natl. Acad. Sci. U. S. A., 2007, 104, 111–116 CrossRef CAS PubMed.
- G. Reddy, J. E. Straub and D. Thirumalai, Proc. Natl. Acad. Sci. U. S. A., 2009, 106, 11948–11953 CrossRef CAS PubMed.
- B. Tarus, J. E. Straub and D. Thirumalai, J. Mol. Biol., 2005, 345, 1141–1156 CrossRef CAS PubMed.
- F. Massi and J. E. Straub, Biophys. J., 2001, 81, 697–709 CrossRef CAS.
- G. Reddy, J. E. Straub and D. Thirumalai, J. Phys. Chem. B, 2009, 113, 1162–1172 CrossRef CAS PubMed.
- R. A. Rodriguez, L. Y. Chen, G. Plascencia-Villa and G. Perry, Biochem. Biophys. Res. Commun., 2017, 487, 444–449 CrossRef CAS PubMed.
- M. Wolff, B. Zhang-Haagen, C. Decker, B. Barz, M. Schneider, R. Biehl, A. Radulescu, B. Strodel, D. Willbold and L. Nagel-Steger, Sci. Rep., 2017, 7, 2493 CrossRef PubMed.
- M. F. Masman, U. L. M. Eisel, I. G. Csizmadia, B. Penke, R. D. Enriz, S. J. Marrink and P. G. M. Luiten, J. Phys. Chem. B, 2009, 113, 11710–11719 CrossRef CAS PubMed.
- S. A. Kotler, J. R. Brender, S. Vivekanandan, Y. Suzuki, K. Yamamoto, M. Monette, J. Krishnamoorthy, P. Walsh, M. Cauble, M. M. B. Holl, E. N. G. Marsh and A. Ramamoorthy, Sci. Rep., 2015, 5, 11811 CrossRef PubMed.
- I. Bertini, G. Gallo, M. Korsak, C. Luchinat, J. Mao and E. Ravera, ChemBioChem, 2013, 14, 1891–1897 CrossRef CAS.
- G. Bellomo, S. Bologna, L. Gonnelli, E. Ravera, M. Fragai, M. Lelli and C. Luchinat, Chem. Commun., 2018, 54, 7601–7604 RSC.
- A. E. Bennett, J. H. Ok, R. G. Griffin and S. Vega, J. Chem. Phys., 1992, 96, 8624–8627 CrossRef CAS.
- N. Rezaei-Ghaleh, K. Giller, S. Becker and M. Zweckstetter, Biophys. J., 2011, 101, 1202–1211 CrossRef CAS PubMed.
- S. Makin, Nature, 2018, 559, S4–S7 CrossRef CAS PubMed.
- S. J. Hyung, A. S. DeToma, J. R. Brender, S. Lee, S. Vivekanandan, A. Kochi, J. S. Choi, A. Ramamoorthy, B. T. Ruotolo and M. H. Lim, Proc. Natl. Acad. Sci. U. S. A., 2013, 110, 3743–3748 CrossRef CAS PubMed.
- Y. Singh, P. C. Sharpe, H. N. Hoang, A. J. Lucke, A. W. McDowall, S. P. Bottomley and D. P. Fairlie, Chem. – Eur. J., 2011, 17, 151–160 CrossRef CAS PubMed.
- A. A. Watson, D. P. Fairlie and D. J. Craik, Biochemistry, 1998, 37, 12700–12706 CrossRef CAS PubMed.
- W. Zheng, M.-Y. Tsai, M. Chen and P. G. Wolynes, Proc. Natl. Acad. Sci. U. S. A., 2016, 113, 11835–11840 CrossRef CAS PubMed.
- F. Bossis and L. L. Palese, Biochim. Biophys. Acta, Proteins Proteomics, 2013, 1834, 2486–2493 CrossRef CAS PubMed.
- M. A. Danielson and J. J. Falke, Annu. Rev. Biophys. Biomol. Struct., 2003, 25, 163–195 CrossRef PubMed.
- Y. Suzuki, J. R. Brender, M. T. Soper, J. Krishnamoorthy, Y. L. Zhou, B. T. Ruotolo, N. A. Kotov, A. Ramamoorthy and E. N. G. Marsh, Biochemistry, 2013, 52, 1903–1912 CrossRef CAS PubMed.
- J. R. Brender, A. Ghosh, S. A. Kotler, J. Krishnamoorthy, S. Bera and V. Morris, Chem. Commun., 2019, 55, 4483–4486 RSC.
- P. Schanda and B. Brutscher, J. Am. Chem. Soc., 2005, 127, 8014–8015 CrossRef CAS PubMed.
- K. Pradhan, G. Das, P. Mondal, J. Khan, S. Barman and S. Ghosh, ACS Chem. Neurosci., 2018, 9, 2929–2940 CrossRef CAS PubMed.
- J. Ghanta, C. L. Shen, L. L. Kiessling and R. M. Murphy, J. Biol. Chem., 1996, 271, 29525–29528 CrossRef CAS PubMed.
- M. M. Pallitto, J. Ghanta, P. Heinzelman, L. L. Kiessling and R. M. Murphy, Biochemistry, 1999, 38, 3570–3578 CrossRef CAS PubMed.
- A. Biswas, P. Kurkute, B. Jana, A. Laskar and S. Ghosh, Chem. Commun., 2014, 50, 2604–2607 RSC.
- J. Nasica-Labouze, P. H. Nguyen, F. Sterpone, O. Berthoumieu, N. V. Buchete, S. Coté, A. De Simone, A. J. Doig, P. Faller, A. Garcia, A. Laio, M. S. Li, S. Melchionna, N. Mousseau, Y. Mu, A. Paravastu, S. Pasquali, D. J. Rosenman, B. Strodel, B. Tarus, J. H. Viles, T. Zhang, C. Wang and P. Derreumaux, Chem. Rev., 2015, 115, 3518–3563 CrossRef CAS PubMed.
- J. E. Straub and D. Thirumalai, Annu. Rev. Phys. Chem., 2011, 62, 437–463 CrossRef CAS PubMed.
- F. Massi and J. E. Straub, Protein Sci., 2002, 11, 1639–1647 CrossRef CAS PubMed.
- B. Urbanc, L. Cruz, S. Yun, S. V. Buldyrev, G. Bitan, D. B. Teplow and H. E. Stanley, Proc. Natl. Acad. Sci. U. S. A., 2004, 101, 17345–17350 CrossRef CAS PubMed.
- L. Gu, C. Liu and Z. Guo, J. Biol. Chem., 2013, 288, 18673–18683 CrossRef CAS PubMed.
- L. Gu, C. Liu, J. C. Stroud, S. Ngo, L. Jiang and Z. Guo, J. Biol. Chem., 2014, 289, 27300–27313 CrossRef CAS PubMed.
- D. Huang, M. I. Zimmerman, P. K. Martin, A. J. Nix, T. L. Rosenberry and A. K. Paravastu, J. Mol. Biol., 2015, 427, 2319–2328 CrossRef CAS PubMed.
- W. M. Tay, D. Huang, T. L. Rosenberry and A. K. Paravastu, J. Mol. Biol., 2013, 425, 2494–2508 CrossRef CAS PubMed.
- R. K. Spencer, H. Li and J. S. Nowick, J. Am. Chem. Soc., 2014, 136, 5595–5598 CrossRef CAS PubMed.
- S. Ngo and Z. Guo, Biochem. Biophys. Res. Commun., 2011, 414, 512–516 CrossRef CAS PubMed.
- X. Zheng, C. Wu, D. Liu, H. Li, G. Bitan, J. E. Shea and M. T. Bowers, J. Phys. Chem. B, 2016, 120, 1615–1623 CrossRef CAS PubMed.
- J. Lu, Q. Cao, C. Wang, J. Zheng, F. Luo, J. Xie, Y. Li, X. Ma, L. He, D. Eisenberg, J. Nowick, L. Jiang and D. Li, Front. Mol. Neurosci., 2019, 12, 1–10 CrossRef PubMed.
- A. Hassan, C. M. Quinn, J. Struppe, I. V. Sergeyev, C. Zhang, C. Guo, B. Runge, T. Theint, H. H. Dao, C. P. Jaroniec, M. Berbon, A. Lends, B. Habenstein, A. Loquet, R. Kuemmerle, B. Perrone, A. M. Gronenborn and T. Polenova, J. Magn. Reson., 2020, 311, 106680 CrossRef PubMed.
| This journal is © The Royal Society of Chemistry 2020 |