 Open Access Article
Creative Commons Attribution 3.0 Unported Licence
Photoinduced intersystem crossing in DNA oxidative lesions and epigenetic intermediates†
Antonio
Francés-Monerris
 *ab,
Mauricio
Lineros-Rosa
c,
Miguel Angel
Miranda
 c,
Virginie
Lhiaubet-Vallet
 *c and
Antonio
Monari
 *a
*a
aUniversité de Lorraine and CNRS, LPCT UMR 7019, F-54000 Nancy, France. E-mail: antonio.frances@univ-lorraine.fr; antonio.monari@univ-lorraine.fr
bDepartament de Química Física, Universitat de València, 46100 Burjassot, Spain
cInstituto Universitario Mixto de Tecnologia Química UPV-CSIC, Universitat Politècnica de València, Avda de los Naranjos s/n, 46022 Valencia, Spain. E-mail: lvirgini@itq.upv.es
First published on 1st April 2020
Abstract
The propensity of 5-formyluracil and 5-formylcytosine, i.e. oxidative lesions and epigenetic intermediates, in acting as intrinsic DNA photosensitizers is unraveled by using a combination of molecular modeling, simulation and spectroscopy. Exploration of potential energy surfaces and non-adiabatic dynamics confirm a higher intersystem crossing rate for 5-formyluracil, whereas the kinetic models evidence different equilibria in the excited states for both compounds.
The accumulation of DNA lesions threatens the correct cell function and is associated to genomic instability, cell death, and carcinogenesis.1–5 Ultraviolet light is known to trigger different photophysical and photochemical processes leading to the development of the so-called DNA photolesions,3,6–8 widely recognized as one of the major causes of malignant skin cancer.8 Understanding the subtle mechanisms leading to DNA lesions is fundamental to assure better public health protection strategies and therefore answer to a fundamental societal call. However, the photophysical and photochemical pathways leading to DNA lesion production are complex, and can be altered by the coupling with the complex inhomogeneous environment.9,10 DNA photolesions can be obtained by direct UV light absorption or by photosensitization. Direct absorption of mainly UVB light leads to the dominant production of cyclobutane pyrimidine dimers (CPD), along with 6-4 photoproduct (64-PP) or 8-oxoguanine as minor components (see Fig. S1, ESI†).8,11–15 Photosensitization proceeds through the initial absorption of UVA or visible light by a chromophore followed by different photochemical pathways.16–23 It often requires the population of the triplet manifold of the photosensitizers, hence an efficient intersystem crossing (ISC) is a crucial prerequisite.18,19,24–26 Recently, it has been proposed that the 64-PP DNA photolesion can by itself act as a photosensitizer leading to triplet energy transfer to nearby thymine, in what has been styled the “Trojan Horse” effect.27–29 The same concept has been extended to oxidative lesions such as 5-formyluracil (ForU, see Fig. 1),30,31 that is the principal product of pyrimidine oxidation and is potentially mutagenic.32–34 The photosensitizing properties of ForU have been confirmed in vitro by UVA irradiation of supercoiled DNA,31 whereas molecular modeling and simulation has evidenced the possibility of ISC and a feasible energy transfer to thymine.30
Molecular modeling studies35 have suggested that 5-formylcytosine (ForC, Fig. 1), i.e. the oxidized form of the 5-methylcytosine, could lead to DNA photosensitization. ForC is an intermediate along the demethylation process of 5-methylcytosine essential for the epigenetic regulation of genes expression.34,36–39 Moreover, formyl pyrimidine derivatives have been recognized as cancer biomarkers,40 and recent biochemical evidence also notes the role of ForC as a stable epigenetic marker,34,41 involved in chromatin remodeling.42
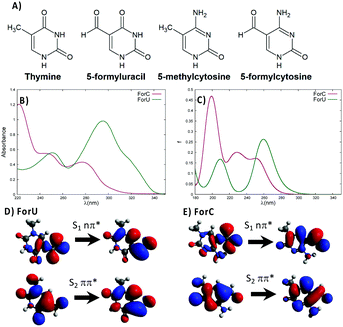
In this communication, in addition to the full characterization of the excited state manifold via the determination of the natural transition orbitals (NTO) and ϕS index,43 we provide a comparison of the photophysical behavior of ForU and ForCvia non-adiabatic molecular dynamics (NAMD)44,45 through the SHARC 2.0 code.45,46 The absorption spectra of ForU and ForC have been measured in different solvents, and simulated at time-dependent density functional theory (TD-DFT) level (Fig. 1 and ESI†), and are globally similar. In PBS, the absorption of ForU is red-shifted with respect to ForC, showing a maximum at around 300 nm and a tail reaching up to 340–350 nm (Fig. 1B). Conversely, the absorption maximum for ForC peaks at around 275 nm while the tail stops at 320–330 nm. The TD-DFT spectra (Fig. 1C) reproduce well the global band shapes both in the maximum and the tail regions, however, a systematic blue-shift is observed, most probably due to the use of polarizable continuum model (PCM) method to represent water solvation, hence neglecting specific solvent–chromophore interactions. NTO analysis (Fig. 1D and E)47 shows that, for both nucleobases, the lowest transition giving rise to the long-wavelength tail is of 1nπ* nature, while the S2 state corresponds to 1ππ* with electronic density reorganization delocalized over the full aromatic ring.
The gap between the two lowest-lying singlet states is larger for ForU, amounting to 1.1 eV at Franck–Condon geometry, while it decreases to 0.6 eV in the case of ForC. The calculated energy gaps between these two excited states are also in good agreement with the Milli-Q absorption spectra recorded in water (Fig. S2, ESI†) that yield a gap of 0.9 eV for ForU and 0.6 eV for ForC. Experimental and simulated spectra in different solvents (see ESI†) confirm that while the absorption of ForC is almost solvent independent, ForU exhibits slight solvatochromism.
The triplet excited states have been characterized from the low temperature phosphorescence spectra of the two oxidized nucleobases in ethanol (see Fig. S5, ESI†). Both compounds exhibit a shapeless emission, with a maximum at a λem of ca. 425 nm for ForC, whereas the phosphorescent emission of ForU is slightly red shifted and peaks at λem = ∼445 nm (Table 1). Additionally, from the wavelength corresponding to the 20% of the emission, we have estimated the adiabatic energy levels of the lowest triplet state, that amount to 3.15 and 3.38 eV for ForU and ForC, respectively, indicating a lower triplet energy level for ForU.
| Compound | State | Band origin (TD-DFT) | Band origin (exp.) | Band maximum (TD-DFT) | Band maximum (exp.) |
|---|---|---|---|---|---|
| ForU | 3nπ* | 3.23 (384) | 3.15 (394) | 2.99 (427) | ∼2.79 (445) |
| 3ππ* | 3.03 (409) | 2.42 (513) | |||
| ForC | 3ππ* | 3.38 (367) | 3.38 (367) | 3.01 (411) | ∼2.92 (425) |
To identify the emissive triplet states, the band origin and the band peak have been calculated with the TD-DFT method (see ESI†). The 3nπ* state is identified as the most likely emissive state for ForU, whereas the 3ππ* state is responsible of the ForC phosphorescence. This assignment is based on the good agreement between the calculated band maximum of the 3n,π* state and the experimental band peak (see Table 1), whereas the vertical emission wavelength of the 3ππ* state of ForU is predicted at 513 nm, far from the 445 nm peak recorded experimentally, which matches much better the 3nπ* vertical emission (427 nm). The CASPT2 method provides consistent results that support this interpretation (461 nm for 3nπ* and 549 nm for 3ππ* vertical emissions, respectively).
Even though the experimental and theoretical data presented in this work indicate that phosphorescence emerges from the 3nπ* state, certain phosphorescence from the 3ππ* state cannot be fully discarded also considering previous works on other modified nucleobases48,49 and the energy degeneracy of both 3nπ* and 3ππ* states. Given the small oscillator strengths between n,π* states and the ground state, longer phosphorescence lifetimes are expected for ForU with respect to ForC.
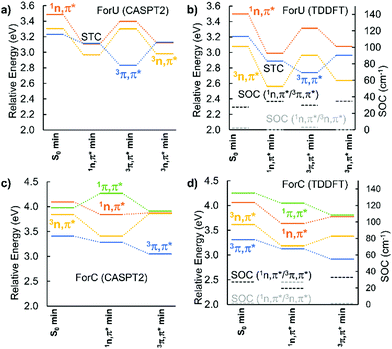
The PES of the two chromophores have been explored at CASPT2 and TD-DFT/B3LYP level, as reported in Fig. 2. In the case of ForU, the initially populated S1 state (1nπ*), evolves to its equilibrium geometry (1nπ* min) that also represents a singlet–triplet crossing (STC) region with the T2 state (3ππ*). An inversion of the diabatic triplet state ordering, compared with the Franck–Condon region, is evidenced at the ForU1nπ* minimum. Further exploration of the PES in the triplet manifold reveals the existence of two well defined minima for the 3nπ* and 3ππ* states separated by less than 0.2 eV in favor of the former, hence suggesting a possible coexistence of the two spectroscopic states. Note that both triplet minima can be considered as energetically degenerated independently of the specific theoretical method.
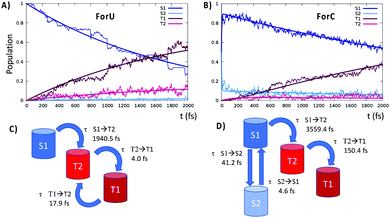
In contrast, ForC presents not only a larger singlet–triplet gap at the S1 equilibrium geometry (about 0.3 eV), but also a lack of inversion between the 3nπ* and the 3ππ* states. SOC values are larger between 1nπ* and 3ππ* with respect to 1nπ* and 3nπ*, providing a further argument in favor of a more efficient ISC for ForU than ForC. A good agreement between CASPT2 and B3LYP TD-DFT is observed validating the forthcoming NAMD performed at the TD-B3LYP level of theory. The time evolution of the population of the different states is reported in Fig. 3, confirming that, under the same simulation conditions, ISC is much more efficient for ForU than ForC. While the absolute values of the ISC rates could be overestimated,44 also due to gas-phase conditions, the tendencies between the two systems are correctly reproduced. Thus, after 2 ps the triplet manifold of ForU has a population exceeding 60%, whereas the population of the triplet state in ForC only reaches 40%. While in the case of ForU, a persistent population of T2 is observed all along the NAMD, in ForC T1 is the only significantly populated triplet state.
This difference can be better understood from the analysis of the hopping transitions between the states: in ForU, back and forward hops between the two lowest lying triplet states are observed, while in ForC only hops from T2 to T1 are present. Hence, in ForU, an equilibrium in the triplet state manifold is established leading to the persistent population of T2, as was already observed in the case of benzophenone.50 Analysis of the hopping transitions also allows to sketch the kinetic models reported in Fig. 3C and D for ForU and ForC, respectively.
The fitting of the population to the kinetic model provides the characteristic time constants for ForU, which are of about 1950 fs for the S1 → T2 transition, representing the ISC rate limiting step, and of 4 and 17 fs for the T2 → T1 and T1 → T2 transitions, respectively. Instead, the kinetic model for ForC reveals a very rapid initial equilibrium in the singlet manifold with characteristic time constants of 41 and 5 fs for S1 → S2 and S2 → S1, respectively, followed by the rate limiting step S1 → T2 transition that has a time constant of 3559 fs, i.e. almost double than the one of ForU. The subsequent internal conversion in the triplet manifold is fast and the time constant for the T2 → T1 transition is of 150 fs.
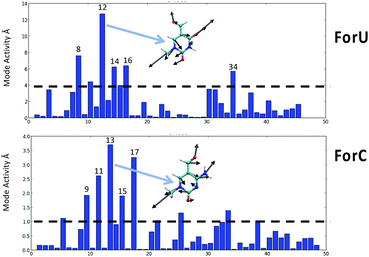
Despite the different mechanism, and the different ISC rate limiting time, the behavior of the two oxidized nucleobases in terms of the vibrational normal modes leading to the triplet population are quite similar. The most active normal modes (Fig. 4) show that the displacements driving the ISC are related to ring breathing and deformation, coupled with some stretching and in plane bending of the aromatic ring substituents, their harmonic vibrational frequencies are comprised in the range 500–800 cm−1 for both systems. Out-of-plane deformations of the aromatic ring are totally absent, as confirmed by analysis of the ring puckering parameters (see ESI†) that only slightly deviates from the ideal planarity.
 | ||
| Fig. 4 Coherent activity of the vibrational normal modes for ForU (top) and ForC (bottom). The most active mode for ForU and ForC is also represented as an inset. | ||
Our results confirm that ForU has the lowest triplet energy, of 3nπ* nature, whereas the emissive state of ForC has 3ππ* character. Both oxidized nucleobases can undergo ISC, and hence assure the first step of photosensitization, albeit with a different efficiency and with two different mechanisms, with ForU being much more efficient. The analysis of the non-adiabatic dynamic trajectories has confirmed that the normal modes driving the ISC are related to in-plane ring deformation. The absence of ring puckering modes, that could be hampered in the more confined DNA environment, suggests the maintaining of the favorable conditions for the triplet photosensitization in complex biological environments such as DNA double strands. Our work confirms the role of Trojan Horse bases, that could also involve biologically relevant epigenetic intermediates. In the future, we plan to extend this study by performing, on the one hand, non-adiabatic dynamics in the DNA environment to also evidence the triplet transfer to thymine, and on the other hand, to precisely measure the DNA photolesions induction by the two different chromophores.
Support from the Université de Lorraine, CNRS and Spanish Government (PGC2018-096684-B-I00) is kindly acknowledged. A. F.-M. is grateful to Generalitat Valenciana (CTQ2017-87054-C2-2-P) and the European Social Fund for a postdoctoral contract (APOSTD/2019/149), M. L.-R. acknowledges the Universitat Politècnica de València for the FPI grant. Calculations have been performed on the local LPCT computer center and on the Explor regional center in the framework of the project “Dancing under the light”.
Conflicts of interest
There are no conflicts to declare.References
- R. Madabhushi, L. Pan and L. H. Tsai, Neuron, 2014, 83, 266–282 CrossRef CAS PubMed.
- E. Sage, Photochem. Photobiol., 1993, 57, 163–174 CrossRef CAS PubMed.
- J. Cadet, E. Sage and T. Douki, Mutat. Res., Fundam. Mol. Mech. Mutagen., 2005, 571, 3–17 CrossRef CAS PubMed.
- G. T. Wondrak, Skin stress response pathways: Environmental factors and molecular opportunities, Springer, 2016 Search PubMed.
- J. Nakamura, E. Mutlu, V. Sharma, L. Collins, W. Bodnar, R. Yu, Y. Lai, B. Moeller, K. Lu and J. Swenberg, DNA Repair, 2014, 19, 3–13 CrossRef CAS PubMed.
- L. Esposito, A. Banyasz, T. Douki, M. Perron, D. Markovitsi and R. Improta, J. Am. Chem. Soc., 2014, 136, 10838–10841 CrossRef CAS PubMed.
- H. Ikehata, T. Mori, Y. Kamei, T. Douki, J. Cadet and M. Yamamoto, Photochem. Photobiol., 2020, 96, 94–104 CrossRef CAS PubMed.
- J. Cadet and T. Douki, Photochem. Photobiol. Sci., 2018, 17, 1816–1841 RSC.
- E. Dumont and A. Monari, Front. Chem., 2015, 3, 43 Search PubMed.
- J. Cadet and J. R. Wagner, Cold Spring Harbor Perspect. Biol., 2013, 5, a012559 Search PubMed.
- A. Banyasz, T. Douki, R. Improta, T. Gustavsson, D. Onidas, I. Vayá, M. Perron and D. Markovitsi, J. Am. Chem. Soc., 2012, 134, 14834–14845 CrossRef CAS PubMed.
- C. Rauer, J. J. Nogueira, P. Marquetand and L. González, J. Am. Chem. Soc., 2016, 138, 15911–15916 CrossRef CAS PubMed.
- H. Ikehata and T. Ono, J. Radiat. Res., 2011, 52, 115–125 CrossRef CAS PubMed.
- M. Gomez-Mendoza, A. Banyasz, T. Douki, D. Markovitsi and J. L. Ravanat, J. Phys. Chem. Lett., 2016, 7, 3945–3948 CrossRef CAS PubMed.
- A. Banyasz, L. Martínez-Fernández, C. Balty, M. Perron, T. Douki, R. Improta and D. Markovitsi, J. Am. Chem. Soc., 2017, 139, 10561–10568 CrossRef CAS PubMed.
- B. Epe, Photochem. Photobiol. Sci., 2012, 11, 98–106 RSC.
- M. C. Cuquerella, V. Lhiaubet-Vallet, J. Cadet and M. A. Miranda, Acc. Chem. Res., 2012, 45, 1558–1570 CrossRef CAS PubMed.
- M. C. Cuquerella, V. Lhiaubet-Vallet, F. Bosca and M. A. Miranda, Chem. Sci., 2011, 2, 1219–1232 RSC.
- V. Lhiaubet-Vallet and M. A. Miranda, in CRC handbook of organic photochemistry and photobiology, ed. F. Ghetti, A. G. Griesbeck and M. Oelgemöller, CRC Press, 2012, pp. 1541–1555 Search PubMed.
- J. Cadet, T. Douki and J. L. Ravanat, Acc. Chem. Res., 2008, 41, 1075–1083 CrossRef CAS PubMed.
- E. Dumont, R. Grüber, E. Bignon, C. Morell, Y. Moreau, A. Monari and J.-L. Ravanat, Nucleic Acids Res., 2016, 44, 56–62 CrossRef CAS PubMed.
- M. S. Baptista, J. Cadet, P. Di Mascio, A. A. Ghogare, A. Greer, M. R. Hamblin, C. Lorente, S. C. Nunez, M. S. Ribeiro, A. H. Thomas, M. Vignoni and T. M. Yoshimura, Photochem. Photobiol., 2017, 93, 912–919 CrossRef CAS PubMed.
- E. Dumont, M. Wibowo, D. Roca-Sanjuán, M. Garavelli, X. Assfeld and A. Monari, J. Phys. Chem. Lett., 2015, 6, 576–580 CrossRef CAS PubMed.
- É. Dumont and A. Monari, J. Phys. Chem. B, 2015, 119, 410–419 CrossRef PubMed.
- K. Hirakawa and T. Hirano, Photochem. Photobiol., 2008, 84, 202–208 CAS.
- J. J. Nogueira, M. Oppel and L. González, Angew. Chem., Int. Ed., 2015, 54, 4375–4378 CrossRef CAS PubMed.
- V. Vendrell-Criado, G. M. Rodriguez-Muniz, M. C. Cuquerella, V. Lhiaubet-Vallet and M. A. Miranda, Angew. Chem., Int. Ed., 2013, 52, 6476–6479 CrossRef CAS PubMed.
- V. Vendrell-Criado, G. M. Rodríguez-Muñiz, V. Lhiaubet-Vallet, M. C. Cuquerella and M. A. Miranda, ChemPhysChem, 2016, 17, 1979–1982 CrossRef CAS PubMed.
- E. Bignon, H. Gattuso, C. Morell, E. Dumont and A. Monari, Chem. – Eur. J., 2015, 21, 11509–11516 CrossRef CAS PubMed.
- A. Francés-Monerris, C. Hognon, M. A. Miranda, V. Lhiaubet-Vallet and A. Monari, Phys. Chem. Chem. Phys., 2018, 20, 25666–25675 RSC.
- I. Aparici-Espert, G. Garcia-Lainez, I. Andreu, M. A. Miranda and V. Lhiaubet-Vallet, ACS Chem. Biol., 2018, 13, 542–547 CrossRef CAS PubMed.
- P. Liu, A. Burdzy and L. C. Sowers, DNA Repair, 2003, 2, 199–210 CrossRef CAS PubMed.
- D. K. Rogstad, J. Heo, N. Vaidehi, W. A. Goddard, A. Burdzy and L. C. Sowers, Biochemistry, 2004, 43, 5688–5697 CrossRef CAS PubMed.
- Y. Wang, X. Zhang, G. Zou, S. Peng, C. Liu and X. Zhou, Acc. Chem. Res., 2019, 52, 1016–1024 CrossRef CAS PubMed.
- J. Xing, Y. Ai, Y. Liu, J. Du, W. Chen, Z. Lu and X. Wang, J. Phys. Chem. B, 2018, 122, 2704–2714 CrossRef CAS PubMed.
- V. López, A. F. Fernández and M. F. Fraga, Ageing Res. Rev., 2017, 37, 28–38 CrossRef PubMed.
- A. Berson, R. Nativio, S. L. Berger and N. M. Bonini, Trends Neurosci., 2018, 41, 587–598 CrossRef CAS PubMed.
- C. Deans and K. A. Maggert, Genetics, 2015, 199, 887–896 CrossRef CAS PubMed.
- C. Hognon, V. Besancenot, A. Gruez, S. Grandemange and A. Monari, J. Phys. Chem. B, 2019, 123, 7365–7371 CrossRef CAS PubMed.
- Y. Tang, S. J. Zheng, C. B. Qi, Y. Q. Feng and B. F. Yuan, Anal. Chem., 2015, 87, 3445–3452 CrossRef CAS PubMed.
- M. Bachman, S. Uribe-Lewis, X. Yang, H. E. Burgess, M. Iurlaro, W. Reik, A. Murrell and S. Balasubramanian, Nat. Chem. Biol., 2015, 11, 555–557 CrossRef CAS PubMed.
- M. Iurlaro, G. Ficz, D. Oxley, E. A. Raiber, M. Bachman, M. J. Booth, S. Andrews, S. Balasubramanian and W. Reik, Genome Biol., 2013, 14, R119 CrossRef PubMed.
- T. Etienne, X. Assfeld and A. Monari, J. Chem. Theory Comput., 2014, 10, 3896–3905 CrossRef CAS PubMed.
- R. Crespo-Otero and M. Barbatti, Chem. Rev., 2018, 118, 7026–7068 CrossRef CAS PubMed.
- S. Mai, P. Marquetand and L. González, Wiley Interdiscip. Rev.: Comput. Mol. Sci., 2018, 8, e1370 Search PubMed.
- S. Mai, P. Marquetand and L. González, Int. J. Quantum Chem., 2015, 115, 1215–1231 CrossRef CAS.
- R. L. Martin, J. Chem. Phys., 2003, 118, 4775–4777 CrossRef CAS.
- M. J. Janicki, R. Szabla, J. Šponer and R. W. Góra, Chem. Phys., 2018, 515, 502–508 CrossRef CAS.
- S. Mai, M. Pollum, L. Martínez-Fernández, N. Dunn, P. Marquetand, I. Corral, C. E. Crespo-Hernández and L. González, Nat. Commun., 2016, 7, 1–8 Search PubMed.
- M. Marazzi, S. Mai, D. Roca-Sanjuán, M. G. Delcey, R. Lindh, L. González and A. Monari, J. Phys. Chem. Lett., 2016, 7, 622–626 CrossRef CAS PubMed.
Footnote |
| † Electronic supplementary information (ESI) available: The simulated and experimental absorption spectrum for ForC and ForU in different solvents, Milli-Q absorption spectrum for ForU and ForC, experimental low temperature phosphorescence spectra, CAS active spaces, total standard deviation of the ensemble of the trajectories projected on the vibrational normal modes, representation of the most active vibrational normal modes, time evolution of the ring puckering parameters, computational and experimental methodology. See DOI: 10.1039/d0cc01132k |
| This journal is © The Royal Society of Chemistry 2020 |


