
Operando X-ray absorption spectroscopy of hyperfine β-FeOOH nanorods modified with amorphous Ni(OH)2 under electrocatalytic water oxidation conditions†
Takeshi
Morikawa
 *a,
Sheraz
Gul
b,
Yusaku F.
Nishimura
a,
Tomiko M.
Suzuki
a and
Junko
Yano
*b
*a,
Sheraz
Gul
b,
Yusaku F.
Nishimura
a,
Tomiko M.
Suzuki
a and
Junko
Yano
*b
aToyota Central R&D Labs., Inc., 41-1 Yokomichi, Nagakute, Aichi 480-1192, Japan. E-mail: morikawa@mosk.tytlabs.co.jp
bMolecular Biophysics and Integrated Bioimaging Division, Lawrence Berkeley National Laboratory, Berkeley, California 94720, USA. E-mail: jyano@lbl.gov
First published on 1st April 2020
Abstract
Operando X-ray absorption spectroscopy was employed to study an active electrocatalyst, hyperfine β-FeOOH nanorods (∅ 3 × 15 nm) surface-modified with amorphous Ni hydroxide. The nearest neighbor structure and valence of Fe3+ ions did not change under water oxidation conditions, while changes in the nearest neighbor ordering of Ni2+ ions and a reversible transition to Ni3+ were observed in accordance with the electrical bias for the reaction.
In the water oxidation reaction (also referred to as the oxygen evolution reaction: OER), extracting electrons from water molecules is a crucial step in generating useful chemicals such as hydrogen by proton reduction,1 and organic compounds by CO2 reduction.2,3 Such uphill energy storage reactions are seen as part of the current drive toward a sustainable society based on natural energy sources. To apply such systems on a large scale, highly active and cost-effective catalysts are crucial.4 Oxides, oxyhydroxides and hydroxides of earth-abundant metals are recognized as the best choices for this purpose.5–7 Iron is of interest because it is relatively nontoxic and has the fourth highest Clarke number among the elements (4.70).8 Among the possible Fe compounds, FeOOH is especially attractive, as it occurs naturally in soil, and it is also a product of the corrosion of steel. Amorphous α- and γ-FeOOH have been found to function as OER catalysts.9–15 Recently, Suzuki et al. reported that the OER rate over hyperfine β-FeOOH(Cl) (akaganeite; hereafter, β-FeOOH) nanorods having extremely small volumes (diameters of 3 nm and lengths of 15 nm) was higher than that of the conventional β-FeOOH nanorods (typically 30 nm and 400 nm, respectively).16,17 The compound β-FeOOH polymorph has a unique structure; groups of four double chains of FeO3(OH)3 octahedra contain tunnels running along the [010] direction, which are partly occupied by Cl− ions.18 Both the OER rate and overpotential can be enhanced by doping with Ni2+ ions (β-FeOOH:Ni), and further increased by surface modification with amorphous Ni(OH)2 (β-FeOOH:Ni/a-Ni(OH)2) (X-ray diffraction data in Fig. S1, ESI†). Based on the previous work on Ni-rich Ni–Fe oxides,19 it was hypothesized that the enhanced OER rate in β-FeOOH:Ni can be attributed to the modified electronic state of the active Fe centers. It was shown that amorphous Ni(OH)2 at the surface of the β-FeOOH:Ni nanorods not only improved the electronic structure of these active centers, but also increased the electrical conductivity of the stacked electrode fabricated from particles.1657Fe Mössbauer spectroscopy revealed that a hyperfine β-FeOOH structure was maintained even with the increasing Ni content and that an increase in quadrupole splitting and the peak width can be due to the electronic interaction between Fe and Ni species.17 The β-FeOOH:Ni/a-Ni(OH)2 stacked anode possesses an OER activation overpotential of 170 mV and exhibited a 50 mA cm−2 OER current at 1.72 V in an aqueous 1 M KOH solution with a Pt cathode during the H2O conversion to oxygen (O2).17 However, there have been few studies on the local atomic structure of the Fe-rich oxyhydroxides under OER conditions in the presence of Ni species, in comparison to those of Ni-rich systems.
In the present work, operando X-ray absorption spectroscopy (XAS) was used to examine β-FeOOH:Ni/a-Ni(OH)2 nanorods in aqueous solutions during the OER under electrical biases to understand the atomic-scale properties of the catalysts. These operando analyses are crucial for a better understanding of the oxidation states and local atomic structural motifs. Previously, similar approaches were applied to Ni-rich (Ni,Fe)OOH and Ni0.3Fe0.07Co0.2Ce0.43Ox systems,19,20 and the results have provided insights into the interactions between Ni and Fe species in the compounds. In this study, we investigated both Ni and Fe XAS to characterize their local environment.
Colloidal suspensions of β-FeOOH:Ni (1 at% Ni) and β-FeOOH:Ni/a-Ni(OH)2 (22 at% Ni) nanorods were produced at room temperature (ESI†).16,17 High-resolution transmission electron microscopy (HRTEM) observations in conjunction with fast Fourier transform (FFT) lattice spacing analyses confirmed that the lattice planes in these materials arranged parallel to the longitudinal direction of the β-FeOOH nanorods were (200) planes. The long axis of the nanorods was parallel to the tetragonal C axis (Fig. 1(a)) and tunnels formed by the Fe–O octahedra grew in the long axis direction to lengths up to 15 nm. These nanorods (drawn as cylinders) were deposited on carbon paper (CP) (Fig. 1(b)). This figure also includes typical electrochemical characterization data at 1 mg-catalyst cm−2 demonstrating that doping with Ni2+ lowered the OER potential from +1.66 to +1.60 V vs. RHE (at 2 mA cm−2) and that surface modification with a-Ni(OH)2 further decreased the corresponding potential to +1.51 (the data for pure β-FeOOH and a-Ni(OH)2 are shown in Fig. S2, ESI†).17
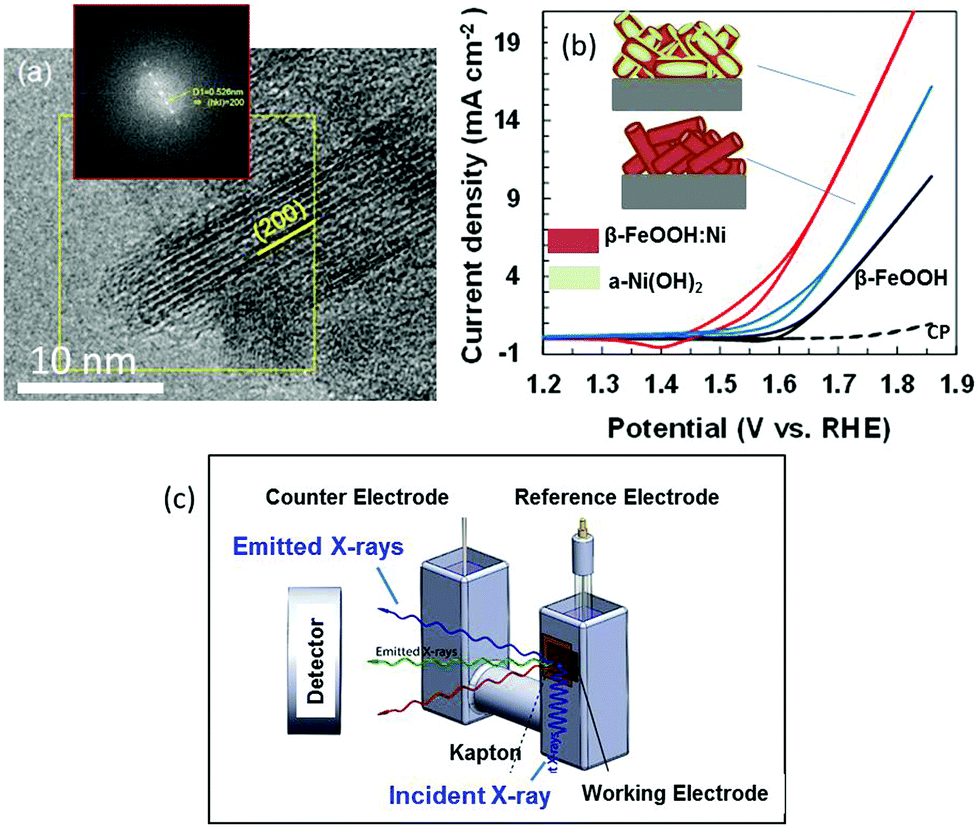 | ||
| Fig. 1 (a) HRTEM image of a β-FeOOH nanorod with an inset showing FFT for the region in yellow square. (b) Current–potential curves acquired during the OER in 0.1 M KOH using pure β-FeOOH (black), 1% Ni (β-FeOOH:Ni) (blue) and 22% Ni (β-FeOOH:Ni surface-decorated with amorphous Ni(OH)2) (red), together with schematic images showing these materials on carbon paper. (c) Schematic image of the experimental in situ XAS apparatus used to acquire data during the OER at an anode supported on carbon. | ||
Metal K-edge X-ray absorption near edge structure (XANES) and extended X-ray absorption fine structure (EXAFS) analyses were conducted using fluorescence yield detection (Fig. 1(c) and ESI†). The electrode in a cell was immersed in 0.1 M KOH so as to produce faster diffusion rates and higher electrocatalytic current densities. This arrangement allowed the OER overpotential to be assessed at activity levels comparable to those for conventional Ni-rich systems.20 Spectra were acquired under three conditions: dry (without electrolyte, as a reference), at an open-circuit (OC) potential in the electrolyte and at +1.56 V (vs. RHE) during the OER. The value of +1.56 V is used in the previous papers.17 Under conditions where the current value is greater than this, O2 bubbles disturbed fluorescence detection.
The Fe K-edge XANES spectra in Fig. 2(a) provide information about the β-FeOOH structure. The rising edge energy values are similar for the 1% Ni and 22% Ni β-FeOOH samples, indicating that Fe3+ was present in both. Under the three different test conditions, there were no significant differences in spectral shapes and thus no clear changes in chemical states. However, there may have been some small changes in the EXAFS local structure of the Fe3+ ions (Fig. S3, ESI†). Fig. 2(b) provides the Ni K-edge XANES spectra. The rising edge energy for the 1% Ni β-FeOOH is seen to be close to that for the Ni in Ni(OH)2, indicating that the average oxidation state of Ni is close to Ni2+ (Fig. S4(a), ESI†). The evident broadening of the white line under OC conditions also suggests increased heterogeneity of the Ni species. Under the OER conditions, the white line further broadens toward higher energies, demonstrating that a portion of the Ni was oxidized. Because no improvements in the OER activation overpotential or current were observed by adding Ni(OH)2 to the surface of the non-doped β-FeOOH, it is apparent that part of the Ni remained in the β-FeOOH lattice before and after the OER, as has been discussed in a previous report.17 These data suggest the crucial role of the Ni ions originally doped into the β-FeOOH.
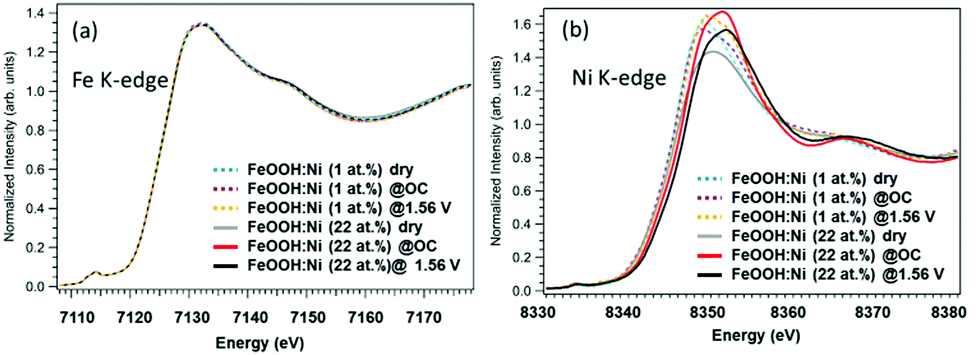 | ||
| Fig. 2 (a) Fe and (b) Ni XANES spectra of 1% Ni (β-FeOOH:Ni) and 22% Ni (β-FeOOH:Ni surface-decorated with Ni(OH)2) acquired under dry, OC potential and OER potential (+1.56 V) conditions. | ||
In case of the 22%-Ni β-FeOOH sample, approximately 1% Ni was doped into the β-FeOOH lattice while the remaining fraction was located on the surface as amorphous Ni(OH)2.17 This same phenomenon has been previously observed using X-ray diffraction (XRD) and ex situ XANES.17 A comparison of the Ni K-edge XANES data acquired from β-Ni(OH)2, Ni foil, β-NiOOH and γ-NiOOH (Fig. S4(b), ESI†) shows that the Ni profile of the β-FeOOH:Ni/a-Ni(OH)2 is close to that of the β-Ni(OH)2, since the rising edge energy is similar to that of Ni in Ni(OH)2, and the initial average oxidation state of the Ni ions is close to +2. The Ni peak intensity increased under OC conditions, suggesting that the KOH electrolyte induced ordering of the a-Ni(OH)2 on the β-FeOOH:Ni surface. The white line was also found to be broadened and exhibited the edge shift toward higher energies, meaning that the Ni ions were oxidized to a trivalent state and a structural change was also induced. Under the OER conditions, the Ni ions were further oxidized, as indicated by the edge shift toward higher energy. However, the peak intensity was slightly decreased, and so the Ni ions were likely in a mixture of several different oxidation states. Other data also confirmed that the valence of the Ni ions could be reversibly changed between that in β-like Ni(OH)2 and a higher oxidation state by varying the applied potential (Fig. S5, ESI†). This result indicates that a reversible change in the Ni ion state from that of β-like Ni(OH)2 and a mixture of Ni2+ and Ni3+ is correlated with the OER activity (Fig. S4(b), ESI†). The Fe K-edge EXAFS data obtained from the 1% Ni sample showed no changes under the OER conditions (Fig. S6(a), ESI†). In contrast, the 22% Ni specimen demonstrated a considerable increase in the peak amplitude for the second nearest neighbor under the OC conditions in the electrolyte, followed by a relative decrease under the OER conditions. These results indicate a small amount of disorder in the β-FeOOH structure (Fig. S6(b), ESI†). Fig. 3 presents the Ni K-edge EXAFS results of these materials along with the spectrum of the reference compound β-Ni(OH)2. In case of the 1% Ni data shown in Fig. 3(a), there is almost no second nearest neighbor peak observed under the dry conditions. This result can be explained by the defects that are accompanied by doping with Ni, as has also been observed in the work of the aliovalent doping of nanocrystals.21 The XANES data demonstrate that Ni2+ ions were doped into the Fe3+ matrix, which generated dopant sites paired with nearby vacant cation sites due to charge balancing. Such defects have been observed in, for example, Cu-doped nanocrystals of zinc chalcogenides.22 Under the OC conditions and +1.56 V, the FT amplitude corresponding to the first nearest neighbor shell increased, suggesting a more organized first shell. In addition, the second nearest neighbor peak became more prominent at +1.56 V. Therefore, Ni/Fe ions in proximity to one another were likely to be linked or became more organized. The apparent distances were slightly smaller than those in crystalline β-Ni(OH)2. The internal doping of the β-FeOOH with Ni evidently had no drastic effects on the XANES/EXAFS results immediately after adding the electrolyte, as demonstrated by the data for the 22% Ni sample (discussed below), in which the majority of the Ni was on the nanorod surfaces. However, it is possible that the Ni ions in the nanorods were close to the surface and slowly migrated onto the surface over extended periods of time (that is, several hours under catalytic conditions). This phenomenon is suggested by the increase in the FT amplitude of the second nearest neighbor peak over an extended OER experiment using the 1% Ni sample (Fig. 3(a)). The best fits for the Ni EXAFS data obtained under different conditions are provided in Fig. S7 and S8 (ESI†), and the corresponding parameters are summarized in Table S1 (ESI†).
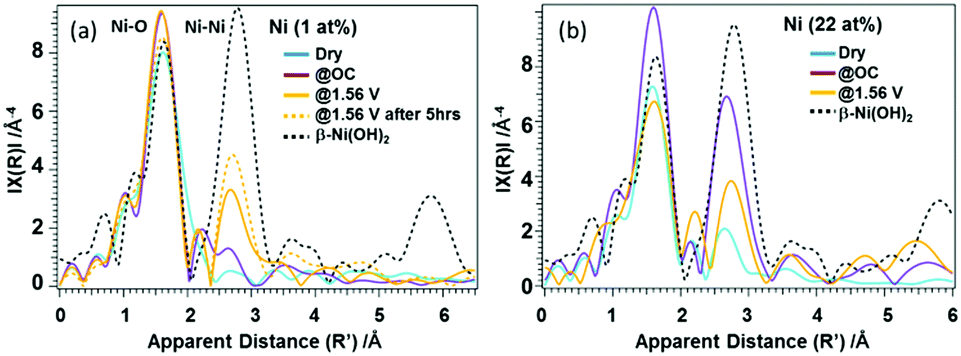 | ||
| Fig. 3 Ni EXAFS spectra acquired under dry, OC potential and OER potential (+1.56 V) conditions using (a) 1% Ni (β-FeOOH:Ni) and (b) 22% Ni (β-FeOOH:Ni surface-decorated with Ni(OH)2) together with that of the reference compound b-Ni(OH)2. | ||
In case of the 22% Ni results shown in Fig. 3(b), the second nearest neighbor peak exhibits a low intensity under the dry conditions. Under the OC conditions the intensity of the first nearest neighbor peak increases, which can be attributed to the formation of a more uniform structure. In addition, the increase in the amplitude of the peak related to the second nearest neighbor shell suggests a transition toward a β-Ni(OH)2-like phase. Here, the Ni phase likely exists as both amorphous Ni(OH)2 and β-Ni(OH)2-like states. The XRD patterns indicate an amorphous state of the material since they contain no peaks originating from Ni(OH)2. Under the OER conditions, Ni likely exists as a mixed phase that consists of β-Ni(OH)2 and a β-NiOOH-like structures, having two Ni-O-Ni neighbor distances at 2.82 and 3.13 Å. However, the Ni ions seem to be less organized than under the OC conditions. This reversible change in the degree of the Ni(OH)2 ordered structures between the OC and OER conditions at the β-FeOOH nanorod surfaces seems to be the most important character of these materials in relation to its function.
There have been various reports regarding the OER at low potentials over Ni-rich oxide and (oxy)hydroxide systems mixed with Fe, because these materials exhibit much higher activity than Fe-rich systems.23,24 The results obtained from Ni-rich systems by Gorlin et al. suggest that Fe ions serve as the active sites, because the binding energies of OER intermediates such as HO*, O* and HOO* at Fe sites are nearly ideal, and these sites can be modified by adjacent Ni species.25 The low activation energy in these scenarios is attributed to Fe sites with unusually short Fe–O bond lengths induced by the presence of Ni.19 Analyses by both differential electrochemical mass spectrometry and XAS have shown that Fe centers remain in the Fe3+ state regardless of the applied potential or catalyst composition, while the Ni centers in NiOOH are oxidized from Ni2+ to Ni3+ and even to Ni4+ during the OER.26 However, it is believed that the formation of Ni3+ and Ni4+ has a negative effect on the faradaic efficiency of O2 formation when Ni is adjacent to Fe. DFT calculations have suggested that the OER activity of Fe-doped NiOOH is associated with the reduction of Ni3+ to Ni2+ in concert with the oxidation of Fe3+ present on the surface to Fe4+.27
In a prior study of an Fe-rich OER system containing Ni, Chemelewski et al. showed that the reaction overpotential for electro-deposited amorphous FeOOH was reduced by mixing with Ni (5–20%).28 As noted, the present surface-modified β-FeOOH:Ni/a-Ni(OH)2 catalyst also exhibits a very high OER activity.16 In this case, Fe ions are believed to serve as the active sites. The electronic state of these ions determines the interactions with intermediates such as HO*, O* and HOO* but can be modified by the presence of adjacent Ni species in a similar manner to the functioning of Ni-rich systems.17 In β-FeOOH:Ni/a-Ni(OH)2, the β-FeOOH:Ni and a-Ni(OH)2 are phase-separated such that a-Ni(OH)2 is situated on the surfaces of the β-FeOOH:Ni nanorods, which is different from the structure of Ni–Fe mixed oxides. However, a previous study using 57Fe Mössbauer spectroscopy has suggested electronic interactions between Fe and Ni in β-FeOOH:Ni/a-Ni(OH)2.17 The cyclic voltammetry curves obtained from β-FeOOH:Ni/a-Ni(OH)2 exhibit minimal hysteresis compared to those generated by Ni–Fe mixed oxides.25 Here, Ni2+ ions are not oxidized to Ni4+ at +1.56 V and that only a small fraction of the original Ni2+ is oxidized to Ni3+, perhaps in close proximity to the β-FeOOH:Ni/a-Ni(OH)2 interface. This presumably occurs due to the separation of the Fe-rich and Ni-rich phases and could be the key to the high activity and 100% faradaic efficiency at +1.56 V. It is also suggested that Ni3+ may be further oxidized to Ni4+ at higher potential, and such species could play an important role in the OER. However, collecting XAS data at higher potential was not possible due to the interference of O2 bubbles. The enhanced OER by a simple physical mixture of Ni oxyhydroxide and Fe oxyhydroxide in contact29 is interesting for comparison with the present system. Result from the DFT calculations, which suggested that the (010) surface index of β-FeOOH tends to increase its catalytic activity, could also be taken into account.14 From these results, in the previous literatures and the present paper, the control and optimization of the structure and electronic interactions of the β-FeOOH and the accompanying Ni species could further enhance the OER.
In summary, operando XAS analyses of β-FeOOH:Ni surface-modified with a-Ni(OH)2 in aqueous solution were conducted. The nearest neighbor structure and valence of Fe3+ ions under electrically-biased OER conditions were identical to those under non-biased conditions. In contrast, Ni ions showed second nearest neighbor ordering equivalent to β-Ni(OH)2 and a fraction of (presumably at the interface of β-FeOOH:Ni and a-Ni(OH)2) Ni2+ ions was oxidized to Ni3+ during the catalytic reaction. This process was reversible depending on the applied electrical bias. These findings show the important role of the Fe and Ni interactions in the Fe-rich oxide OER catalysts, accompanied by the structural change of Ni species at a catalytic potential.
This study was performed under Cooperative Research and Development Agreement AWD00001924 between the Lawrence Berkeley National Laboratory and the Toyota Central R&D Laboratory. Synchrotron radiation analyses were performed on the 7-3 and 11-2 beamlines at the Stanford Synchrotron Radiation Lightsource at the SLAC National Accelerator Laboratory, which is operated by Stanford University for the U.S. Department of Energy Office of Science, Office of Basic Energy Science. The authors thank Frances Houle for valuable suggestions, Takashi Sugiura and Keiichiro Oh-ishi for acquiring HRTEM images, and Sirine Fakra for providing the akaganeite reference spectrum.
Conflicts of interest
There are no conflicts to declare.Notes and references
- M. G. Walter, E. L. Warren, J. R. McKone, S. W. Boettcher, Q. X. Mi, E. A. Santori and N. S. Lewis, Chem. Rev., 2010, 110, 6446–6473 CrossRef CAS PubMed.
- S. Sato, T. Arai, T. Morikawa, K. Uemura, T. M. Suzuki, H. Tanaka and T. Kajino, J. Am. Chem. Soc., 2011, 133, 15240–15243 CrossRef CAS PubMed.
- T. Arai, S. Sato and T. Morikawa, Energy Environ. Sci., 2015, 8, 1998–2002 RSC.
- T. Arai, S. Sato, K. Sekizawa, T. M. Suzuki and T. Morikawa, Chem. Commun., 2019, 55, 237–240 RSC.
- X. M. Xu, W. Wang, W. Zhou and Z. P. Shao, Small Methods, 2018, 2, 1800071 CrossRef.
- M. S. Burke, L. J. Enman, A. S. Batchellor, S. Zou and S. W. Boettcher, Chem. Mater., 2015, 27, 7549–7558 CrossRef CAS.
- Z. Y. Cai, X. M. Bu, P. Wang, J. C. Ho, J. H. Yang and X. Y. Wang, J. Mater. Chem. A, 2019, 7, 5069–5089 RSC.
- F. W. Clarke and H. S. Washington, US. Geol. Surv. Prof. Paper, 1924, 127, 1–108 Search PubMed.
- G. L. Elizarova, L. G. Matvienko, V. L. Kuznetsov, D. I. Kochubey and V. N. Parmon, J. Mol. Catal. A: Chem., 1995, 103, 43–50 CrossRef CAS.
- J. W. Schultze, S. Mohr and M. M. Lohrengel, J. Electroanal. Chem., 1983, 154, 57–68 CrossRef CAS.
- M. E. G. Lyons and L. D. Burke, J. Electroanal. Chem., 1984, 170, 377–381 CrossRef CAS.
- J. A. Seabold and K.-S. Choi, J. Am. Chem. Soc., 2012, 134, 2186–2192 CrossRef CAS PubMed.
- K. J. McDonald and K. S. Choi, Energy Environ. Sci., 2012, 5, 8553–8557 RSC.
- Y. Sakamoto, Y. Noda, K. Ohno, K. Koike, K. Fujii, T. M. Suzuki, T. Morikawa and S. Nakamura, Phys. Chem. Chem. Phys., 2019, 21, 18486–18494 RSC.
- W. Luo, C. Jiang, Y. Li, S. A. Shevlin, X. Han, K. Qiu, Y. Cheng, Z. Guo, W. Huang and J. Tang, J. Mater. Chem. A, 2017, 5, 2021–2028 RSC.
- T. M. Suzuki, T. Nonaka, A. Suda, N. Suzuki, Y. Matsuoka, T. Arai, S. Sato and T. Morikawa, Sustainable Energy Fuels, 2017, 1, 636–643 RSC.
- T. M. Suzuki, T. Nonaka, K. Kitazumi, N. Takahashi, S. Kosaka, Y. Matsuoka, K. Sekizawa, A. Suda and T. Morikawa, Bull. Chem. Soc. Jpn., 2018, 91, 778–786 CrossRef CAS.
- X. Song and J.-F.-O. Boily, J. Phys. Chem. C, 2012, 116, 2303–2312 CrossRef CAS.
- D. Friebel, M. W. Louie, M. Bajdich, K. E. Sanwald, Y. Cai, A. M. Wise, M. J. Cheng, D. Sokaras, T. C. Weng, R. Alonso-Mori, R. C. Davis, J. R. Bargar, J. K. Norskov, A. Nilsson and A. T. Bell, J. Am. Chem. Soc., 2015, 137, 1305–1313 CrossRef CAS PubMed.
- M. Favaro, W. S. Drisdell, M. A. Marcus, J. M. Gregoire, E. J. Crumlin, J. A. Haber and J. Yano, ACS Catal., 2017, 7, 1248–1258 CrossRef CAS.
- C. Corrado, Y. Jiang, F. Oba, M. Kozina, F. Bridges and J. Z. Zhang, J. Phys. Chem. A, 2009, 113, 3830–3839 CrossRef CAS PubMed.
- S. Gul, J. K. Cooper, C. Corrado, B. Vollbrecht, F. Bridges, J. Guo and J. Z. Zhang, J. Phys. Chem. C, 2011, 115, 20864–20875 CrossRef CAS.
- L. Trotochaud, J. K. Ranney, K. N. Williams and S. W. Boettcher, J. Am. Chem. Soc., 2012, 134, 17253–17261 CrossRef CAS PubMed.
- B. J. Trzesniewski, O. Diaz-Morales, D. A. Vermaas, A. Longo, W. Bras, M. T. Koper and W. A. Smith, J. Am. Chem. Soc., 2015, 137, 15112–15121 CrossRef CAS PubMed.
- M. Görlin, P. Chernev, J. Ferreira de Araújo, T. Reier, S. Dresp, B. Paul, R. Krähnert, H. Dau and P. Strasser, J. Am. Chem. Soc., 2016, 138, 5603–5614 CrossRef PubMed.
- M. Görlin, J. Ferreira de Araújo, H. Schmies, D. Bernsmeier, S. Dresp, M. Gliech, Z. Jusys, P. Chernev, R. Kraehnert, H. Dau and P. Strasser, J. Am. Chem. Soc., 2017, 139, 2070–2082 CrossRef PubMed.
- J. M. P. Martirez and E. A. Carter, J. Am. Chem. Soc., 2019, 141, 693–705 CrossRef CAS PubMed.
- W. D. Chemelewski, J. R. Rosenstock and C. B. Mullins, J. Mater. Chem. A, 2014, 2, 14957–14962 RSC.
- M. Gorlin, P. Chernev, P. Paciok, C.-W. Tai, J. F. D. Arau, T. Reier, M. Heggen, R. Dunin-Borkowski, P. Strasser and H. Dau, Chem. Commun., 2019, 55, 818–821 RSC.
Footnote |
| † Electronic supplementary information (ESI) available: Syntheses of materials and electrodes, experimental methods, XRD and XAS data and best fit parameters. See DOI: 10.1039/d0cc00692k |
| This journal is © The Royal Society of Chemistry 2020 |