 Open Access Article
First observation of surface protonics on SrZrO3 perovskite under a H2 atmosphere†
Yudai
Hisai
a,
Kota
Murakami
a,
Yukiko
Kamite
a,
Quanbao
Ma
b,
Einar
Vøllestad
b,
Ryo
Manabe
a,
Taku
Matsuda
a,
Shuhei
Ogo
 a,
Truls
Norby
 b and
Yasushi
Sekine
 *a
*a
aDepartment of Applied Chemistry, Waseda University, 3-4-1 Okubo, Shinjuku, Tokyo, 169-8555, Japan. E-mail: ysekine@waseda.jp
bDepartment of Chemistry, University of Oslo, FERMiO, Gaustadalléen 21, NO-0349 Oslo, Norway
First published on 12th February 2020
Abstract
This is the first direct observation that surface proton hopping occurs on SrZrO3 perovskite even under a H2 (i.e. dry) atmosphere. Understanding proton conduction mechanisms on ceramic surfaces under a H2 atmosphere is necessary to investigate the role of proton hopping on the surface of heterogeneous catalysts in an electric field. In this work, surface protonics was investigated using electrochemical impedance spectroscopy (EIS). To extract the surface proton conduction, two pellets of different relative densities were prepared: a porous sample (R.D. = 60%) and a dense sample (R.D. = 90%). Comparison of conductivities with and without H2 revealed that only the porous sample showed a decrease in the apparent activation energy of conductivity by supplying H2. H/D isotope exchange tests revealed that the surface proton is the dominant conductive species over the porous sample with H2 supply. Such identification of a dominant conductive carrier facilitates consideration of the role of surface protonics in chemical reactions.
Surface protonics is recognized as proton transportation on an oxide surface in a middle-temperature or low-temperature region. In a H2O atmosphere, protons are transferred continuously between M–OH2 and M–OH− formed by supplied H2O by the Grotthuss mechanism.1–3 Investigation of surface protonics is anticipated to yield useful knowledge for application to various electrochemical devices such as fuel cells, chemical sensors, and electrolyzers.4–6 Recently, an important role of surface protonics during heterogeneous catalytic reactions was found in an electric field under both H2O and H2 atmospheres.7–19 It promotes low-temperature catalysis for hydrogen production, ammonia synthesis, and other processes. Electrochemical impedance spectroscopy (EIS) of oxide surfaces under a H2O atmosphere has been investigated to elucidate the correlation between catalysis in an electric field and surface protonics (Scheme 1).8,10,20 The results show a good agreement between the H2O partial pressure dependence on surface protonics and that on catalytic activity in the electric field.20 The correlation revealed the strong contribution of surface protonics to the enhanced reaction rate at a low temperature in the electric field. Therefore, EIS measurement is a promising method for the evaluation of surface protonics during catalytic reaction with an electric field.
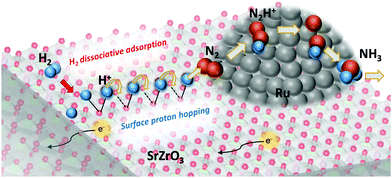 | ||
| Scheme 1 Contribution of surface protonics in the heterogeneous catalytic reaction for low temperature (<550 K) ammonia synthesis in an electric field.12 | ||
This study provides the first example of the observation of surface protonics under a H2 atmosphere (i.e. in a dry condition) using EIS measurements. As the sample, SrZrO3, which was used for ammonia synthesis in the electric field, was selected. Measurements were performed with porous (relative density, R.D. = 60%) and dense (R.D. = 90%) SrZrO3 pellets. Earlier reports have described that porous pellets that have low relative density (R.D. = 50–60%) are feasible for extracting surface conductive components4,5,20–25 because many more vacant sites exist for adsorbate species to adsorb on the oxide surface than on dense pellets (R.D. > 90%). Surface protonics was confirmed from comparison of the respective behaviors of porous and dense samples.
We prepared two types of SrZrO3 pellets having low (60%) and high (90%) densities. SrZrO3 powders were synthesized using a complex polymerization method.12,14,16 Then porous and dense SrZrO3 pellets were prepared. The detailed preparation method is described in the ESI.† All electrochemical impedance spectroscopy (EIS) measurements were taken in a measurement cell (ProboStat™, NORECS AS, Norway) using a two-electrode four-wire setup connected to an impedance spectrometer (alpha-A; Novocontrol Technologies) with a ZG4 interface. The impedance spectra were recorded at frequencies of 106–10−3 Hz using an oscillation amplitude of 100 mV RMS (root mean square). Temperature dependences of electrochemical conductivity were examined under a N2 atmosphere at 423–723 K and under N2![[thin space (1/6-em)]](https://www.rsc.org/images/entities/char_2009.gif) :
:![[thin space (1/6-em)]](https://www.rsc.org/images/entities/char_2009.gif) H2 = 1
H2 = 1![[thin space (1/6-em)]](https://www.rsc.org/images/entities/char_2009.gif) :
:![[thin space (1/6-em)]](https://www.rsc.org/images/entities/char_2009.gif) 3 at 348–723 K. Impedance data were analyzed using ZView equivalent circuit fitting software (ver. 3.5a; Scribner Associates Inc.) using a [(RC)(RC)]Cstray equivalent circuit model, as presented in Fig. S1 (ESI†). The (RC) components were assigned to the series-connected bulk and grain boundary transport. Also, Cstray denotes parallel-connected parasitic capacitance. The values of electrochemical conductivity (σ) were calculated for both the bulk (b) and grain boundary (gb) using eqn (1). In this equation, L represents the pellet thickness, S denotes the area of the Pt electrode, and R stands for the fitted resistance value. The apparent activation energy (Ea) of the electrochemical conductivity was calculated for both the bulk and grain boundary using the Arrhenius expression. For eqn (2), where A shows the pre-exponential, kB denotes Boltzmann's constant.
3 at 348–723 K. Impedance data were analyzed using ZView equivalent circuit fitting software (ver. 3.5a; Scribner Associates Inc.) using a [(RC)(RC)]Cstray equivalent circuit model, as presented in Fig. S1 (ESI†). The (RC) components were assigned to the series-connected bulk and grain boundary transport. Also, Cstray denotes parallel-connected parasitic capacitance. The values of electrochemical conductivity (σ) were calculated for both the bulk (b) and grain boundary (gb) using eqn (1). In this equation, L represents the pellet thickness, S denotes the area of the Pt electrode, and R stands for the fitted resistance value. The apparent activation energy (Ea) of the electrochemical conductivity was calculated for both the bulk and grain boundary using the Arrhenius expression. For eqn (2), where A shows the pre-exponential, kB denotes Boltzmann's constant.
| σx = L/SRx (x = b, gb) | (1) |
σxT = A![[thin space (1/6-em)]](https://www.rsc.org/images/entities/char_2009.gif) exp(−Ea/kBT) exp(−Ea/kBT) | (2) |
![[thin space (1/6-em)]](https://www.rsc.org/images/entities/char_2009.gif) :
:![[thin space (1/6-em)]](https://www.rsc.org/images/entities/char_2009.gif) H2 = 1
H2 = 1![[thin space (1/6-em)]](https://www.rsc.org/images/entities/char_2009.gif) :
:![[thin space (1/6-em)]](https://www.rsc.org/images/entities/char_2009.gif) 3 atmosphere at 723 K for 2 h, and (C) N2 purge for 2 h after H2 reduction at 723 K for 2 h.
3 atmosphere at 723 K for 2 h, and (C) N2 purge for 2 h after H2 reduction at 723 K for 2 h.
The crystalline phases for the synthesized SrZrO3 powder and pellets were evaluated from XRD measurements. As presented in Fig. S2 (ESI†), all samples have an orthorhombic perovskite structure. According to the XRD peak intensity and width, crystallinity increased in the following order: powder < porous pellet < dense pellet. Moreover, the crystal morphologies of both the porous and dense pellets were assessed using FE-SEM, as depicted in Fig. 1. Numerous pores were detected in the porous pellet. Such a porous sample is extremely useful for the detection of surface conductions induced by the adsorbed H2O on the grain surface at low temperatures under H2O conditions.4,5,20–25
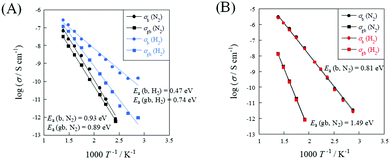
To evaluate the relative density dependence of electrochemical conductivity, EIS measurements were conducted under N2 or N2 + H2 atmospheres using porous (R.D. = 60%) and dense (R.D. = 90%) SrZrO3 samples. Fig. 2 depicts the temperature dependence of electrochemical conductivity on each sample. Fig. 3 presents the Nyquist plot for each sample under N2 and N2 + H2 atmospheres at 723 K. Accordingly, the porous sample and dense sample exhibited completely different trends. Regarding the result of the porous sample (Fig. 2(A)), the electrochemical conductivity of both the bulk and grain boundary under a N2 atmosphere decreased along with decreasing temperature, exhibiting typical Arrhenius behavior. The apparent activation energies of electrochemical conductivity were calculated as 0.93 eV and 0.89 eV, respectively, for the bulk and grain boundary. When H2 was supplied, the apparent activation energy of the electrochemical conductivity decreased markedly compared to that under N2 atmosphere: 0.47 eV (bulk) and 0.74 eV (grain boundary). Regarding the dense sample (Fig. 2(B)), however, the temperature dependence and the apparent activation energy for the dense sample under a H2 atmosphere were identical to those under a N2 atmosphere. Such a difference between porous and dense samples might be attributable to the dissociative adsorption of the supplied H2 on the grain surface, as described in eqn (3).
| H2(g) ⇄ 2Had+ + 2e− | (3) |
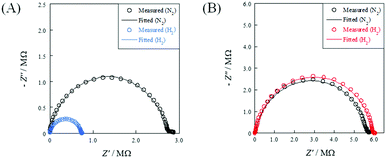 | ||
| Fig. 3 Nyquist plots under N2 and H2 atmospheres at 723 K: (A) porous pellet (R.D. = 60%); and (B) dense pellet (R.D. = 90%). | ||
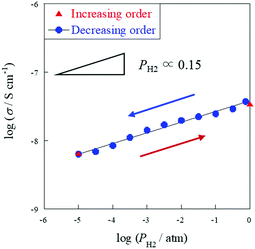 | ||
| Fig. 4 H2 partial pressure dependence of electrical conductivity on the porous SrZrO3 sample (R.D. = 60%) at 723 K, PH2 = 10−5–1 atm (N2 balanced); total flow rate: 60 sccm. | ||
To ascertain whether the dominant conductive carrier on the porous sample under H2 conditions is protons or not, H/D isotope effects were assessed with the porous and dense samples. As presented in Table 1, the porous sample exhibited an H/D isotope effect at all measured temperatures (σD2/σH2 ≃ 0.5), indicating protons as the dominant conductive carrier. Such a significant H/D isotopic value is explainable by a semi-classical theory.28–33 Considering a potential barrier for proton (or deuteron) transfer reaction, a proton's binding energy is (1/2)hνH at the zero-point vibration energy level. The difference in activation energy between a proton and deuteron can be shown as presented in eqn (4).
| ED − EH = (1/2)h(νD − νH) | (4) |
 , where m represents the mass of a proton or deuteron. Regarding OH− ions in SrZrO3-based oxides, the OH− stretching frequency is reported as around 1014 s−1 order.34,35 Using this value, the difference of the activation energies (ED − EH) is calculated theoretically as 0.055 eV, and the experimental results were 0.03 eV. It is slightly lower than the theoretical value, probably because a small difference in energy level exists not only at the initial state, but also at the transition state. Considering that point, a slightly lower value would typically be obtained for the difference in the activation energies.30,31,36 Protons are formed by H2 dissociative adsorption on the porous SrZrO3 surface. The resulting surface proton hopping dominates conduction under a H2 atmosphere.
![[thin space (1/6-em)]](https://www.rsc.org/images/entities/char_2009.gif) :
:![[thin space (1/6-em)]](https://www.rsc.org/images/entities/char_2009.gif) H2(D2) = 1
H2(D2) = 1![[thin space (1/6-em)]](https://www.rsc.org/images/entities/char_2009.gif) :
:![[thin space (1/6-em)]](https://www.rsc.org/images/entities/char_2009.gif) 3 gas flow, 423–723 K temperature, 60 sccm total flow rate
3 gas flow, 423–723 K temperature, 60 sccm total flow rate
| Temperature/K | Porous SrZrO3 sample | Dense SrZrO3 sample | ||||
|---|---|---|---|---|---|---|
| σ H2/S cm−1 | σ D2/S cm−1 | σ D2/σH2/— | σ H2/S cm−1 | σ D2/S cm−1 | σ D2/σH2/— | |
| 723 | 1.21 × 10⁻⁷ | 7.91 × 10⁻⁸ | 0.65 | 2.43 × 10⁻⁶ | 2.41 × 10⁻⁶ | 0.99 |
| 623 | 1.70 × 10⁻⁸ | 9.88 × 10⁻⁹ | 0.58 | 4.14 × 10⁻⁷ | 4.12 × 10⁻⁷ | 1.00 |
| 523 | 5.01 × 10⁻¹⁰ | 2.62 × 10⁻¹⁰ | 0.52 | 2.57 × 10⁻⁸ | 2.55 × 10⁻⁸ | 0.99 |
| 423 | 4.74 × 10⁻¹¹ | 2.27 × 10⁻¹¹ | 0.48 | 2.44 × 10⁻¹⁰ | 2.42 × 10⁻¹⁰ | 0.99 |
As mentioned above, it is indubitable that the increase of conductivity with H2 addition is attributed to surface proton conduction. It is also important to assess the change of oxidation state by H2 reduction. Therefore, XPS measurements were performed with SrZrO3 samples which were pre-treated with various conditions: (A) N2 purge, (B) H2 reduction, (C) N2 purge after H2 reduction. Fig. 5 presents O1s XPS spectra. As a result, two peaks at around 529 eV and 531 eV were observed for all patterns ((A)–(C)). These peaks are assigned to Os or OH and Olat, respectively.37–40 These two peaks did not shift through (A)–(C), which indicated that the oxidation state of SrZrO3 would not change even if the sample was reduced with H2. Furthermore, the peak intensity of Os or OH increased after the sample was treated with H2 ((A) → (B)), then decreased with N2 purge ((B) → (C)). This indicated that surface adsorbed species i.e. OH groups were formed over the SrZrO3 surface by H2 reduction, and it would be removed by N2 purge. This behavior well corresponds to the reversibility of surface OH coverage (Fig. 4).
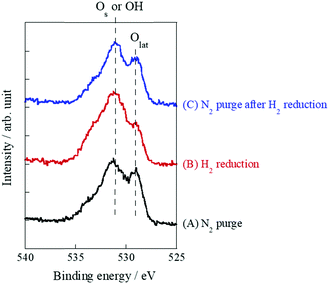 | ||
| Fig. 5 O1s X-ray photoelectron spectra of various pretreatment conditions over SrZrO3: (A) N2 purge, (B) H2 reduction, and (C) N2 purge after H2 reduction. | ||
In conclusion, through several studies of EIS measurement, surface protons under a H2 atmosphere were investigated by examination of the relative density dependence of a SrZrO3 pellet. The cause of the decrease of apparent activation energy in a porous sample by H2 addition was inferred as proton formation by H2 dissociative adsorption on the grain surface. Then proton conduction occurs under a H2 atmosphere. H/D isotope effects indicated proton migration on the oxide surface with the hopping mechanism. Such identification of a dominant conductive carrier is an important consideration when assessing correlation between surface ion conduction and chemical reactions.
This work was supported by JST CREST JPMJCR1423.
Conflicts of interest
There are no conflicts to declare.Notes and references
- R. Sato, S. Ohkuma, Y. Shibuta, F. Shimojo and S. Yamaguchi, J. Phys. Chem. C, 2015, 119, 28925 CrossRef CAS.
- M. F. Camellone, F. N. Ribeiro, L. Szabová, Y. Tateyama and S. Fabris, J. Am. Chem. Soc., 2016, 138, 11560 CrossRef PubMed.
- G. Tocci and A. Michaelides, J. Phys. Chem. Lett., 2014, 5, 474 CrossRef CAS PubMed.
- S. Miyoshi, Y. Akao, N. Kuwata, J. Kawamura, Y. Oyama, T. Yagi and S. Yamaguchi, Chem. Mater., 2014, 26, 5194 CrossRef CAS.
- S. Ø. Stub, E. Vøllestad and T. Norby, J. Phys. Chem. C, 2017, 121, 12817 CrossRef CAS.
- S. Kim, H. J. Avila-Paredes, S. Wang, C. T. Chen, R. A. De Souza, M. Martin and Z. A. Munir, Phys. Chem. Chem. Phys., 2009, 11, 3035 RSC.
- S. Okada, R. Manabe, R. Inagaki, S. Okada and Y. Sekine, Catal. Today, 2018, 307, 272 CrossRef CAS.
- R. Manabe, S. Okada, R. Inagaki, K. Oshima, S. Ogo and Y. Sekine, Sci. Rep., 2016, 6, 38007 CrossRef CAS PubMed.
- S. Ogo and Y. Sekine, Chem. Rec., 2017, 17(8), 726 CrossRef CAS PubMed.
- R. Inagaki, R. Manabe, Y. Hisai, Y. Kamite, T. Yabe, S. Ogo and Y. Sekine, Int. J. Hydrogen Energy, 2018, 43, 14310 CrossRef CAS.
- M. Torimoto, K. Murakami and Y. Sekine, Bull. Chem. Soc. Jpn., 2019, 92(10), 1785 CrossRef CAS.
- R. Manabe, H. Nakatsubo, A. Gondo, K. Murakami, S. Ogo, H. Tsuneki, M. Ikeda, A. Ishikawa, H. Nakai and Y. Sekine, Chem. Sci., 2017, 8, 5434 RSC.
- A. Gondo, R. Manabe, R. Sakai, K. Murakami, T. Yabe, S. Ogo, M. Ikeda, H. Tsuneki and Y. Sekine, Catal. Lett., 2018, 148, 1929 CrossRef CAS.
- K. Murakami, R. Manabe, H. Nakatsubo, T. Yabe, S. Ogo and Y. Sekine, Catal. Today, 2018, 307, 272 CrossRef.
- K. Murakami, Y. Tanaka, R. Sakai, K. Toko, K. Ito, A. Ishikawa, T. Higo, T. Yabe, S. Ogo, M. Ikeda, H. Tsuneki, H. Nakai and Y. Sekine, Catal. Today DOI:10.1016/j.cattod.2018.10.055.
- K. Murakami, Y. Tanaka, S. Hayashi, R. Sakai, Y. Hisai, Y. Mizutani, A. Ishikawa, T. Higo, S. Ogo, J. G. Seo, H. Tsuneki, H. Nakai and Y. Sekine, J. Chem. Phys., 2019, 151, 064708 CrossRef.
- K. Takise, A. Sato, K. Murakami, S. Ogo, J. G. Seo, K. Imagawa, S. Kado and Y. Sekine, RSC Adv., 2019, 9, 5918 RSC.
- K. Takise, A. Sato, S. Ogo, J. G. Seo, K. Imagawa, S. Kado and Y. Sekine, RSC Adv., 2019, 9, 27743 RSC.
- M. Kosaka, T. Higo, S. Ogo, J. G. Seo, K. Imagawa, S. Kado and Y. Sekine, Int. J. Hydrogen Energy, 2020, 45(1), 738 CrossRef CAS.
- R. Manabe, S. Ø. Stub, T. Norby and Y. Sekine, Solid State Commun., 2018, 270, 45 CrossRef CAS.
- B. Scherrer, M. V. F. Schlupp, D. Stender, J. Martynczuk, J. G. Grolig, H. Ma, P. Kocher, T. Lippert, M. Prestat and L. J. Gauckler, Adv. Funct. Mater., 2013, 23, 1957 CrossRef CAS.
- S. Ø. Stub, K. Thorshaug, P. M. Røvik, T. Norby and E. Vøllestad, Phys. Chem. Chem. Phys., 2018, 20, 15653 RSC.
- S. Ø. Stub, E. Vøllestad and T. Norby, J. Mater. Chem. A, 2018, 6, 8265 RSC.
- I. G. Tredici, F. Maglia, C. Ferrara, P. Mustarelli and U. Anselmi-Tamburini, Adv. Funct. Mater., 2014, 24, 5137 CrossRef CAS.
- S. Raz, K. Sasaki, J. Maier and I. Riess, Solid State Ionics, 2001, 143, 181 CrossRef CAS.
- A. Sato, S. Ogo, Y. Takeno, K. Takise, J. G. Seo and Y. Sekine, ACS Omega, 2019, 4, 10438 CrossRef CAS PubMed.
- T. Higo, K. Ueno, Y. Omori, H. Tsuchiya, S. Ogo, S. Hirose, H. Mikami and Y. Sekine, RSC Adv., 2019, 9, 22721 RSC.
- A. S. Nowick and A. V. Vaysley, Solid State Ionics, 1997, 97, 17 CrossRef CAS.
- R. Mukundan, E. L. Brosha, S. A. Birdsell, A. L. Costello, F. H. Garzon and R. S. Williams, J. Electrochem. Soc., 1999, 146, 2184 CrossRef CAS.
- T. Scherban and A. S. Nowick, Solid State Ionics, 1989, 35, 189 CrossRef.
- T. Scherban, W.-K. Lee and A. S. Nowick, Solid State Ionics, 1988, 28–30, 585 CrossRef.
- W.-K. Lee, A. S. Nowick and L. A. Boatner, Solid State Ionics, 1986, 18–19, 989 CrossRef CAS.
- T. Scherban and A. S. Nowick, Solid State Ionics, 1992, 53–56, 1004 CrossRef CAS.
- S. Shin, H. H. Huang, M. Ishigame and H. Iwahara, Solid State Ionics, 1990, 40–41, 910 CrossRef CAS.
- H. Yugami, Y. Shibayama, S. Matsuo, M. Ishigame and S. Shin, Solid State Ionics, 1996, 85, 319 CrossRef CAS.
- T. Norby, M. Friesel and B. E. Mellander, Solid State Ionics, 1995, 77, 105 CrossRef CAS.
- J. T. Newberg, D. E. Starr, S. Yamamoto, S. Kaya, T. Kendelewicz, E. R. Mysak, S. Porsgaard, M. B. Salmeron, G. E. Brown Jr., A. Nilsson and H. Bluhm, Surf. Sci., 2011, 605, 89 CrossRef CAS.
- G. P. López, D. G. Castner and B. D. Ratner, Surf. Interface Anal., 1991, 17, 267 CrossRef.
- E. McCafferty and J. P. Wightman, Surf. Interface Anal., 1998, 26, 549 CrossRef CAS.
- J. van den Brand, W. G. Sloof, H. Terryn and J. H. W. de Wit, Surf. Interface Anal., 2004, 36, 81 CrossRef CAS.
Footnote |
| † Electronic supplementary information (ESI) available: Preparation method for the sample, Fig. S1 and S2. See DOI: 10.1039/c9cc08757e |
| This journal is © The Royal Society of Chemistry 2020 |


